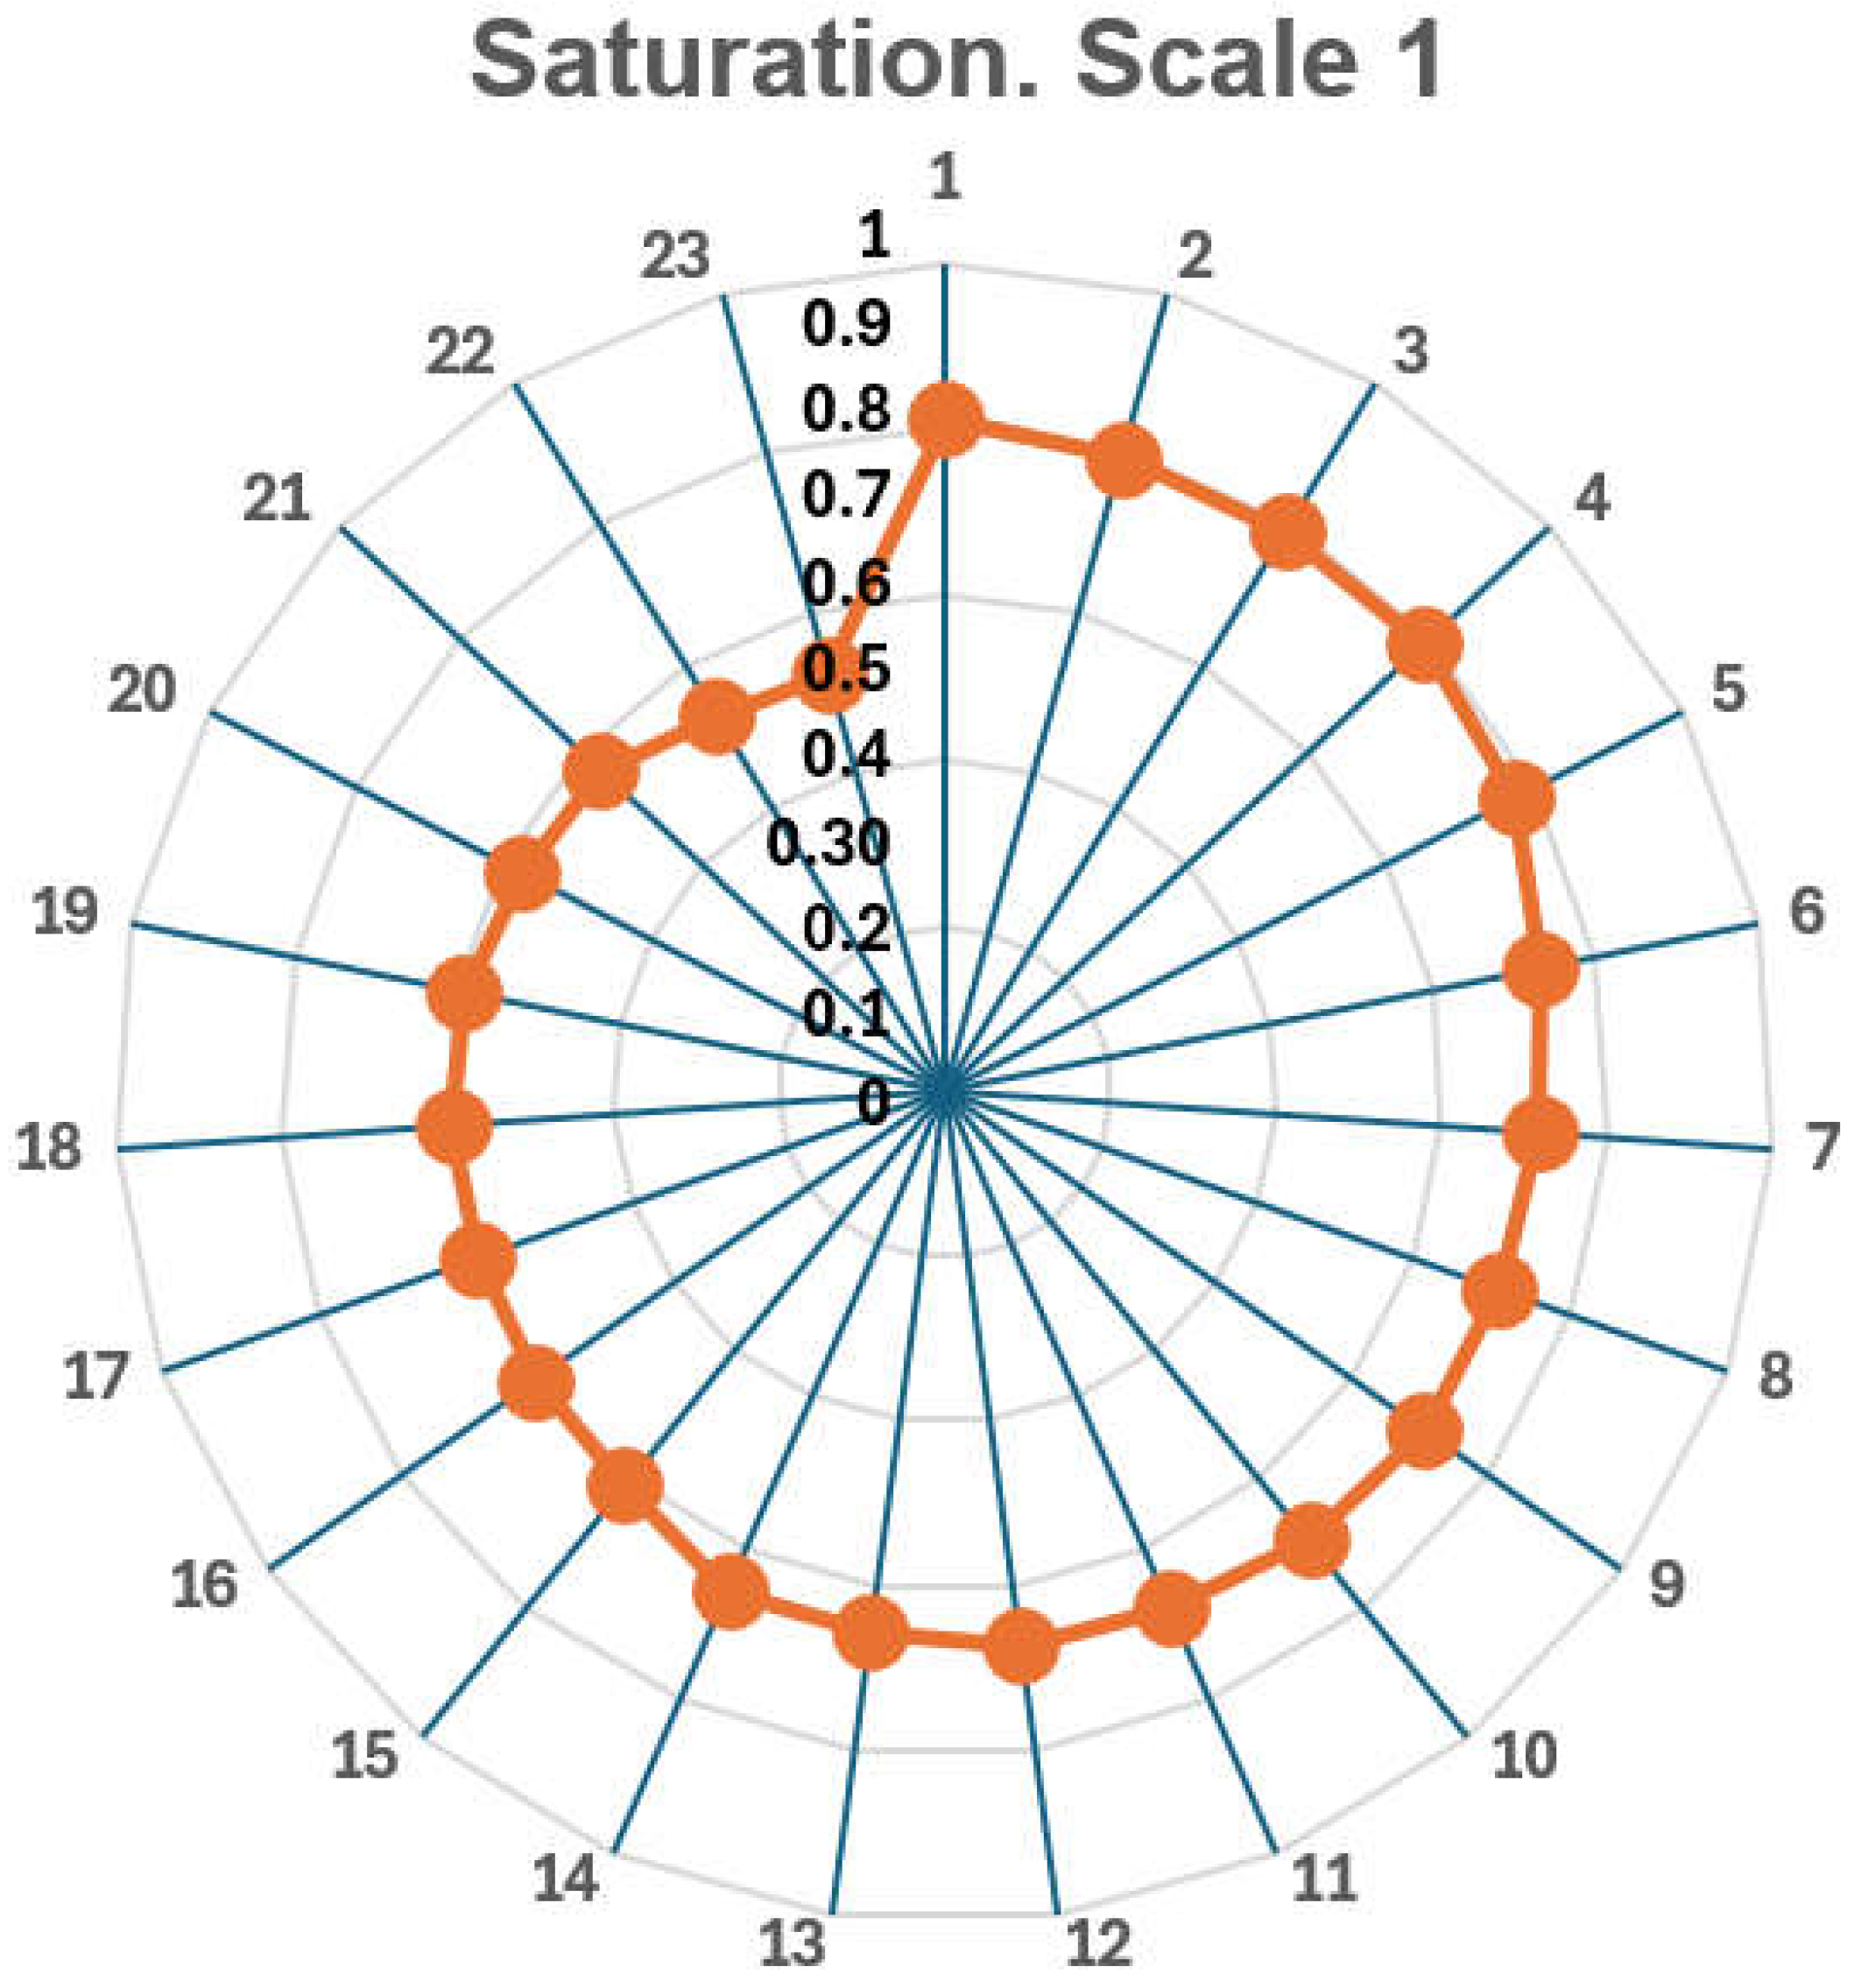
3.4.1. Structure of the First Age Scale
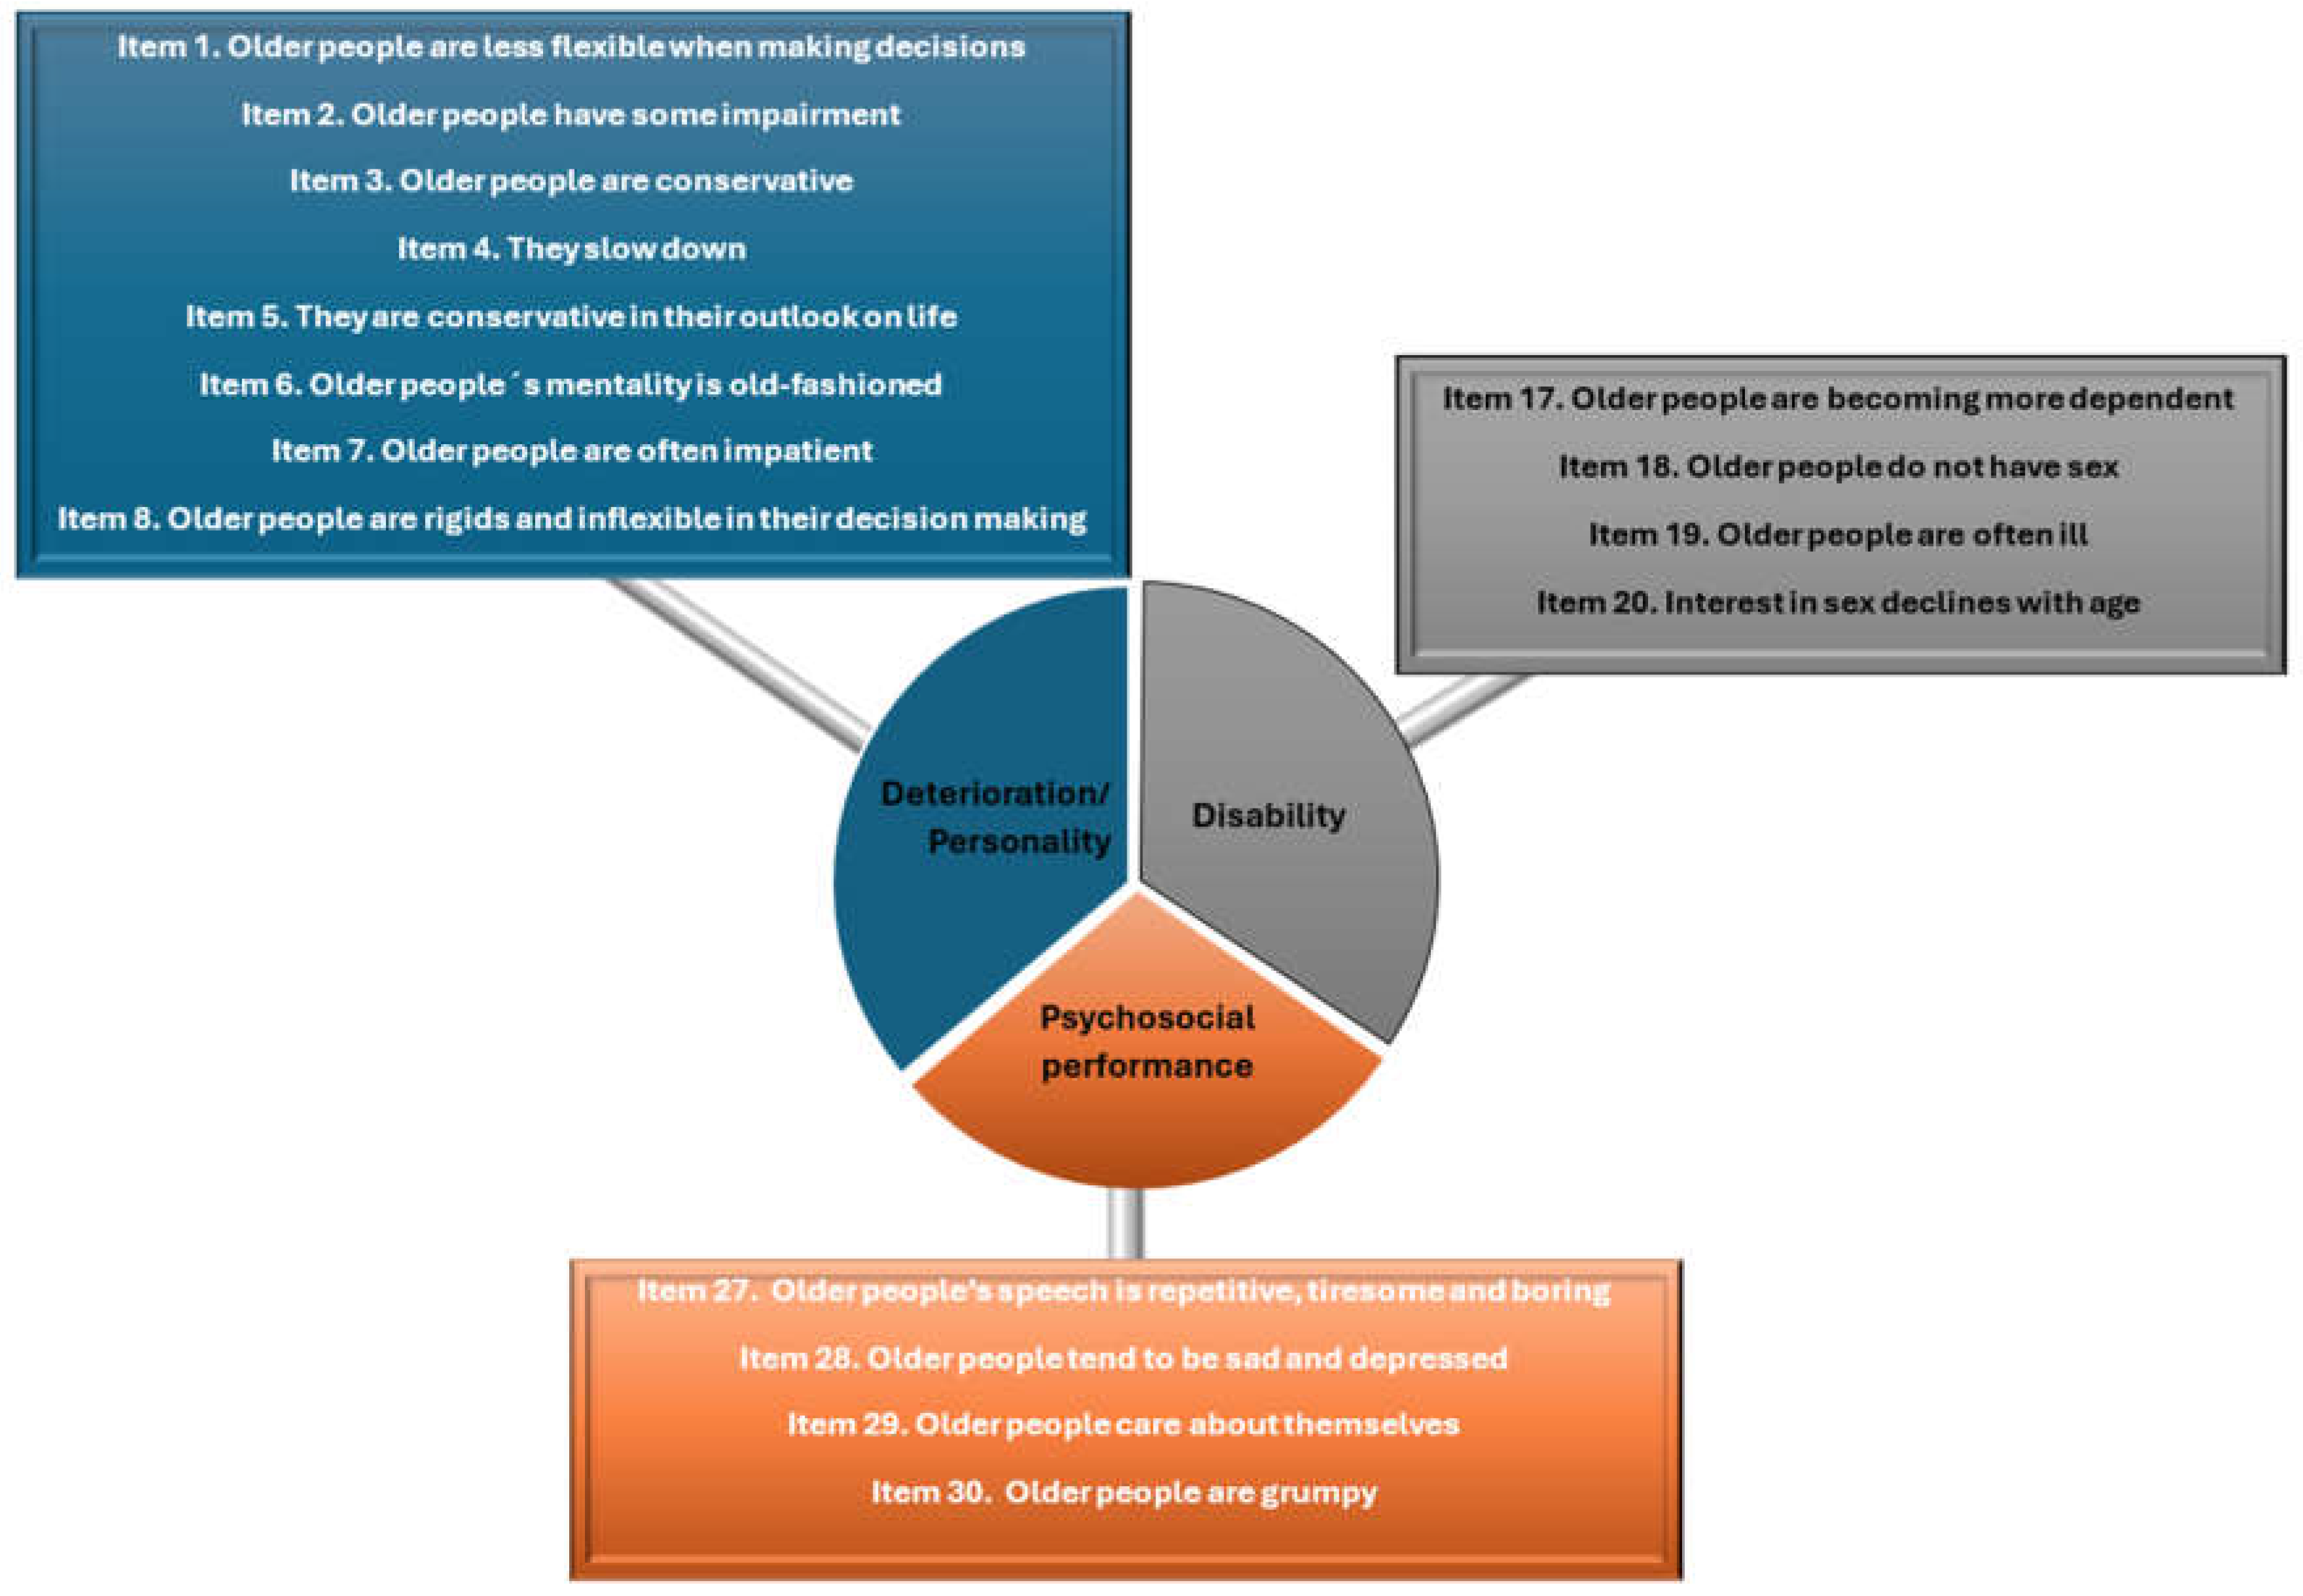
The First Age Scale is divided into three distinct factors: Impairment/Personality, Disability, and Psychosocial Functioning (
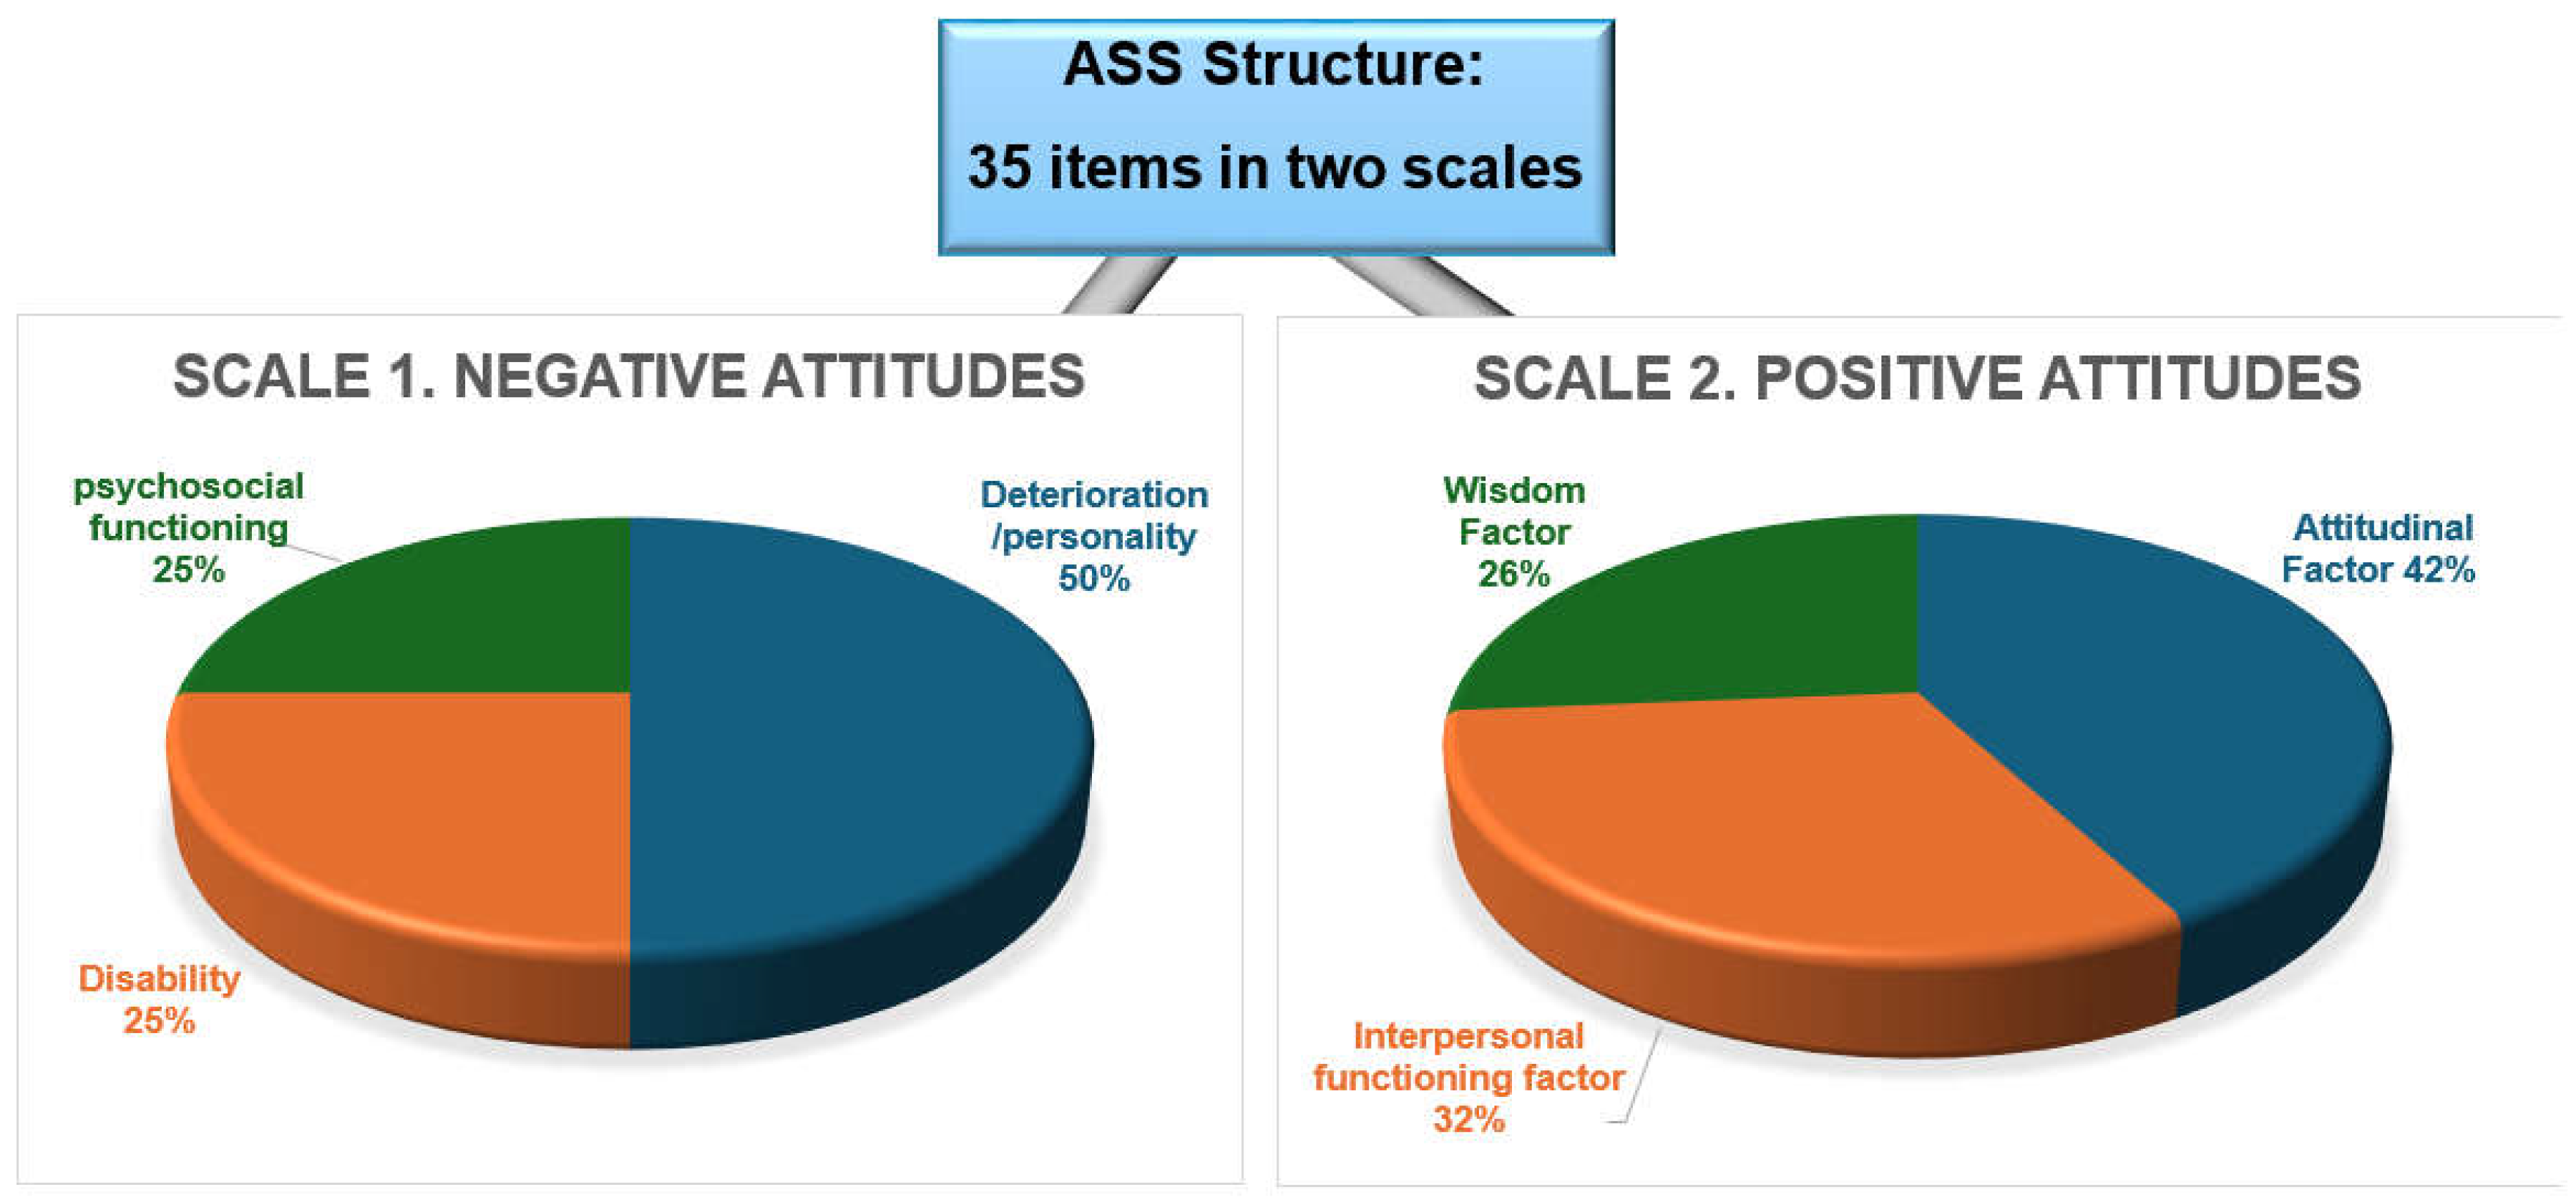
Figure 5). Each factor contains items that allow for a detailed assessment of various dimensions of negative attitudes toward old age. For example, the Impairment/Personality factor has a possible score ranging from 8 to 40 points, while the Disability and Psychosocial Functioning factors each have a possible score ranging from 4 to 20 points.
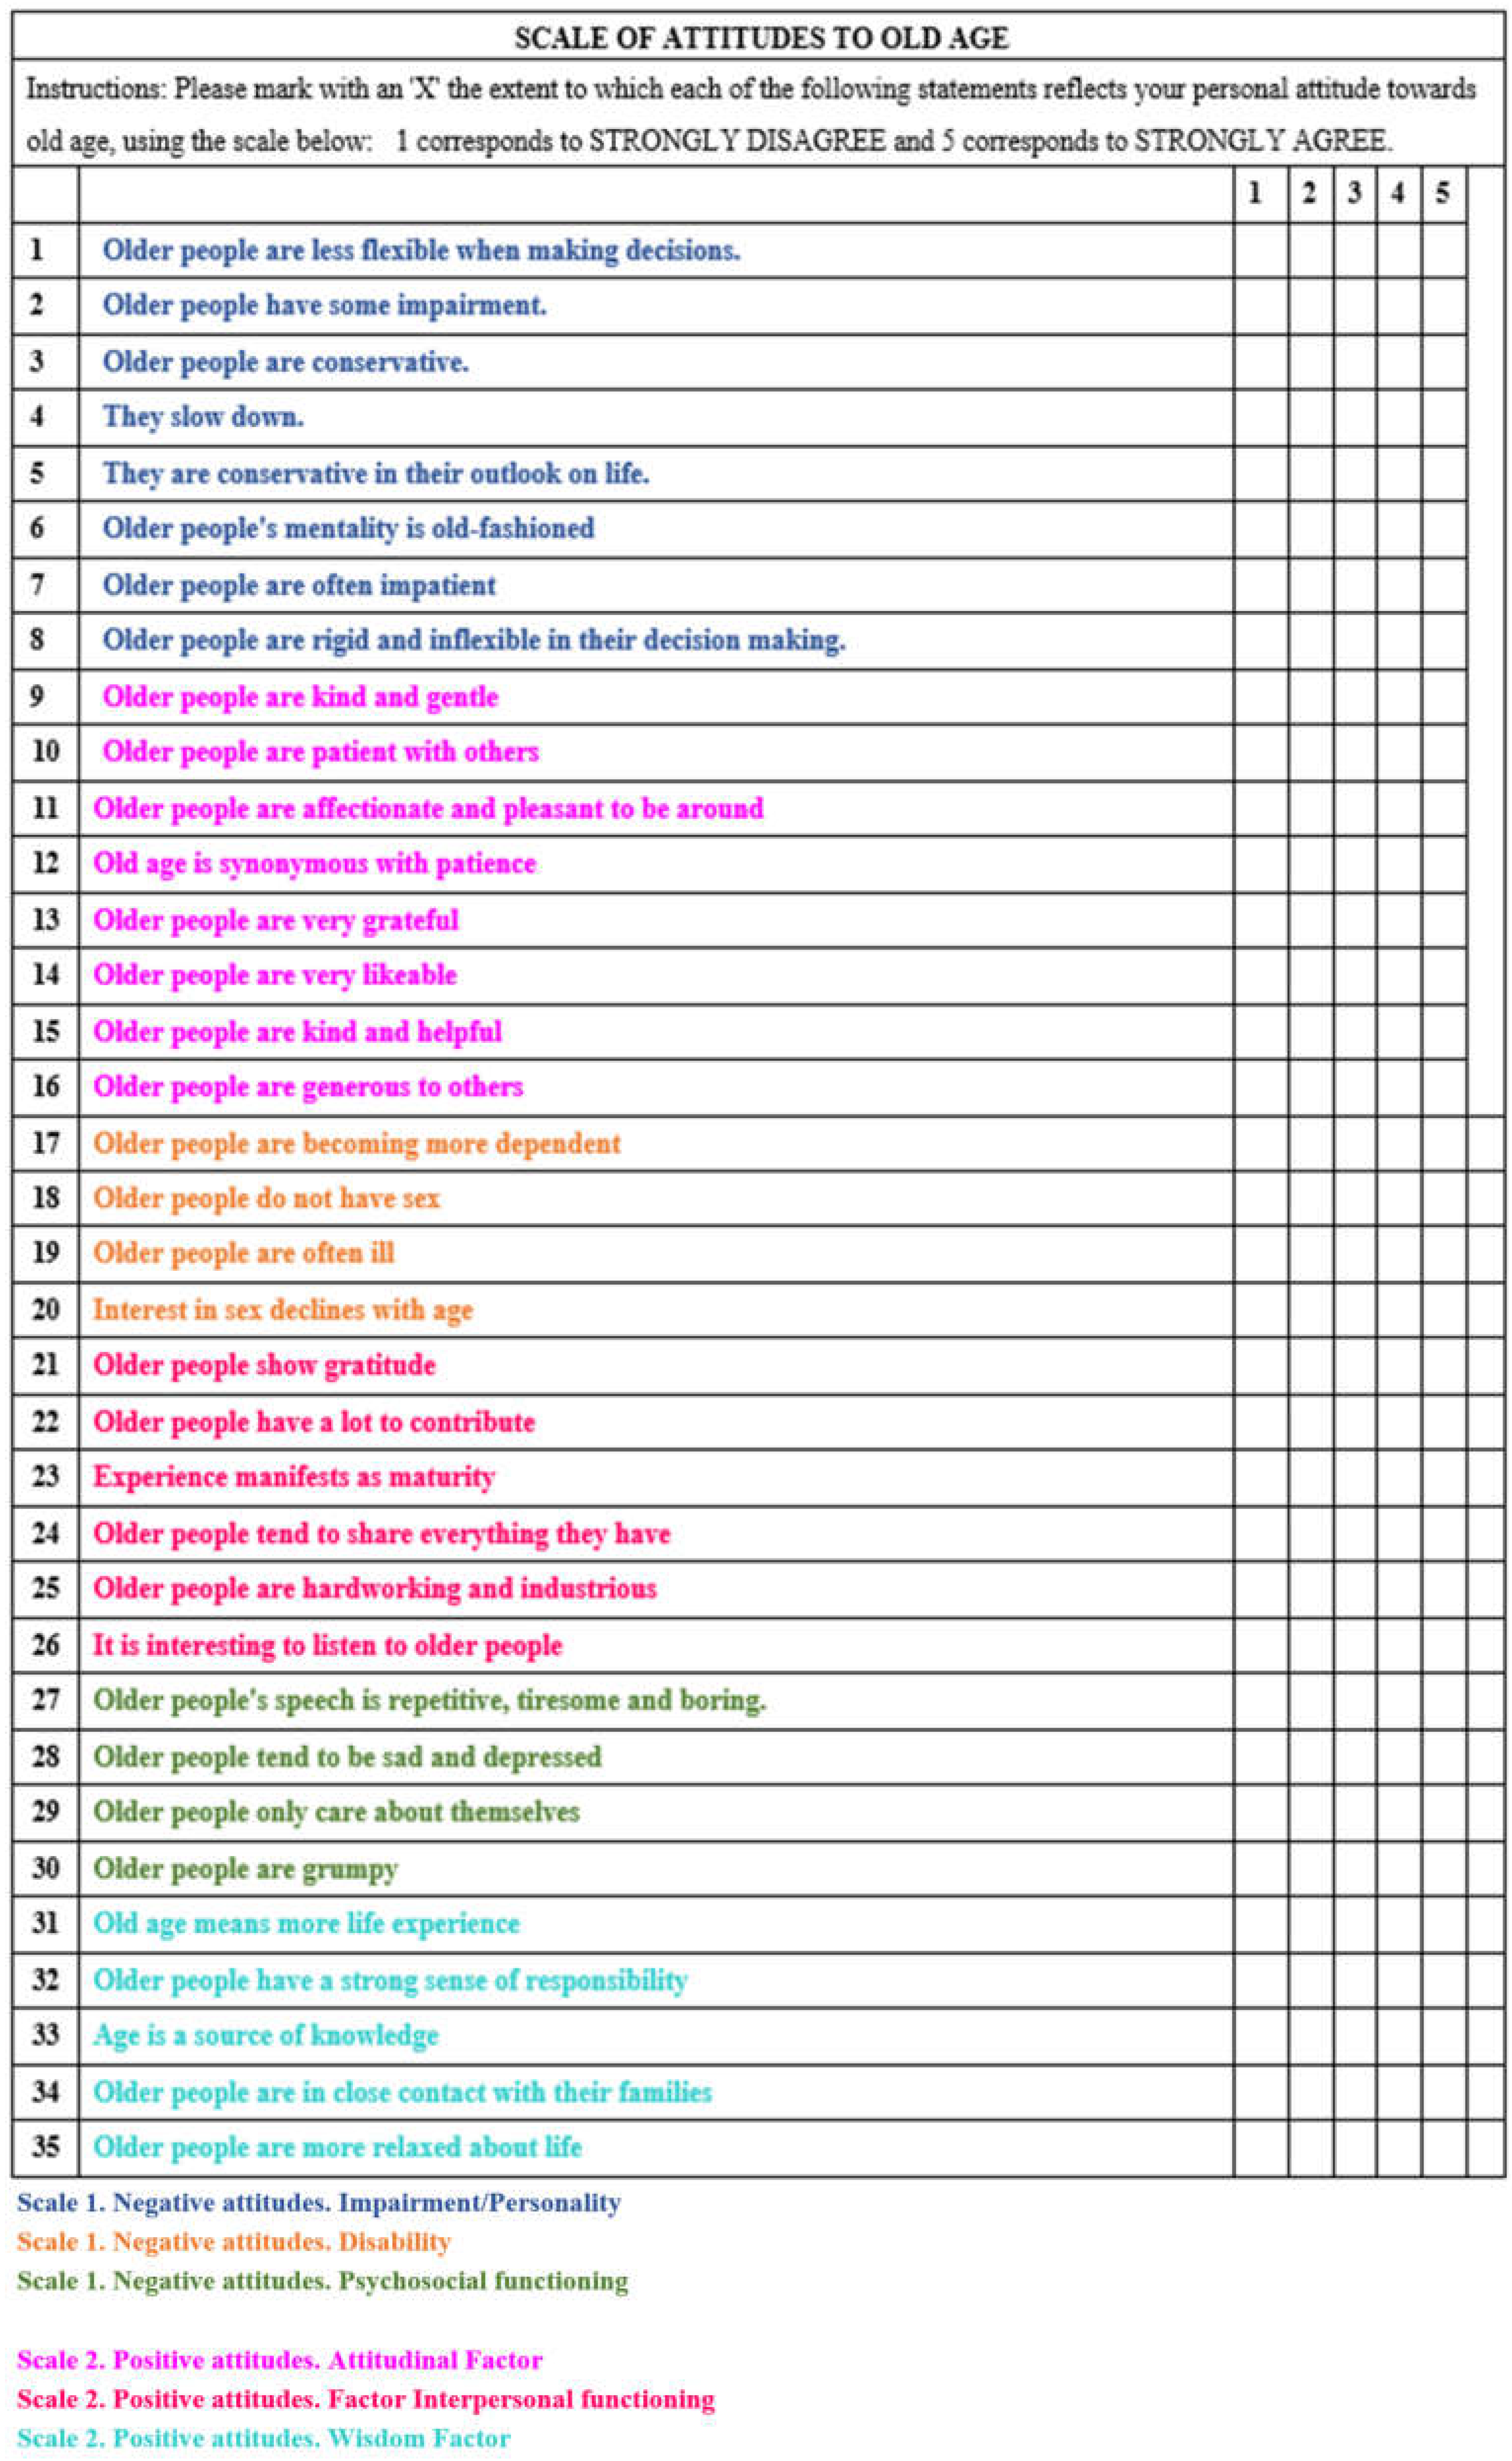
Scale 1 of the Negative Stereotyping includes 16 items with a total score range of 16 to 80 points. It is divided into three main factors: Impairment/Personality, Disability, and Psychosocial Functioning. The Impairment/Personality factor, which has a score range of 8 to 40 points, assesses personality impairment and its impacts. The Disability factor, with a score range of 4 to 20 points, evaluates participants’ perceptions and experiences of disability. Lastly, the Psychosocial Functioning factor, also scored from 4 to 20 points, measures the level of social and psychological integration of the individual. Together, these three factors offer a comprehensive assessment of negative stereotypes and their impact on various aspects of participants’ lives.
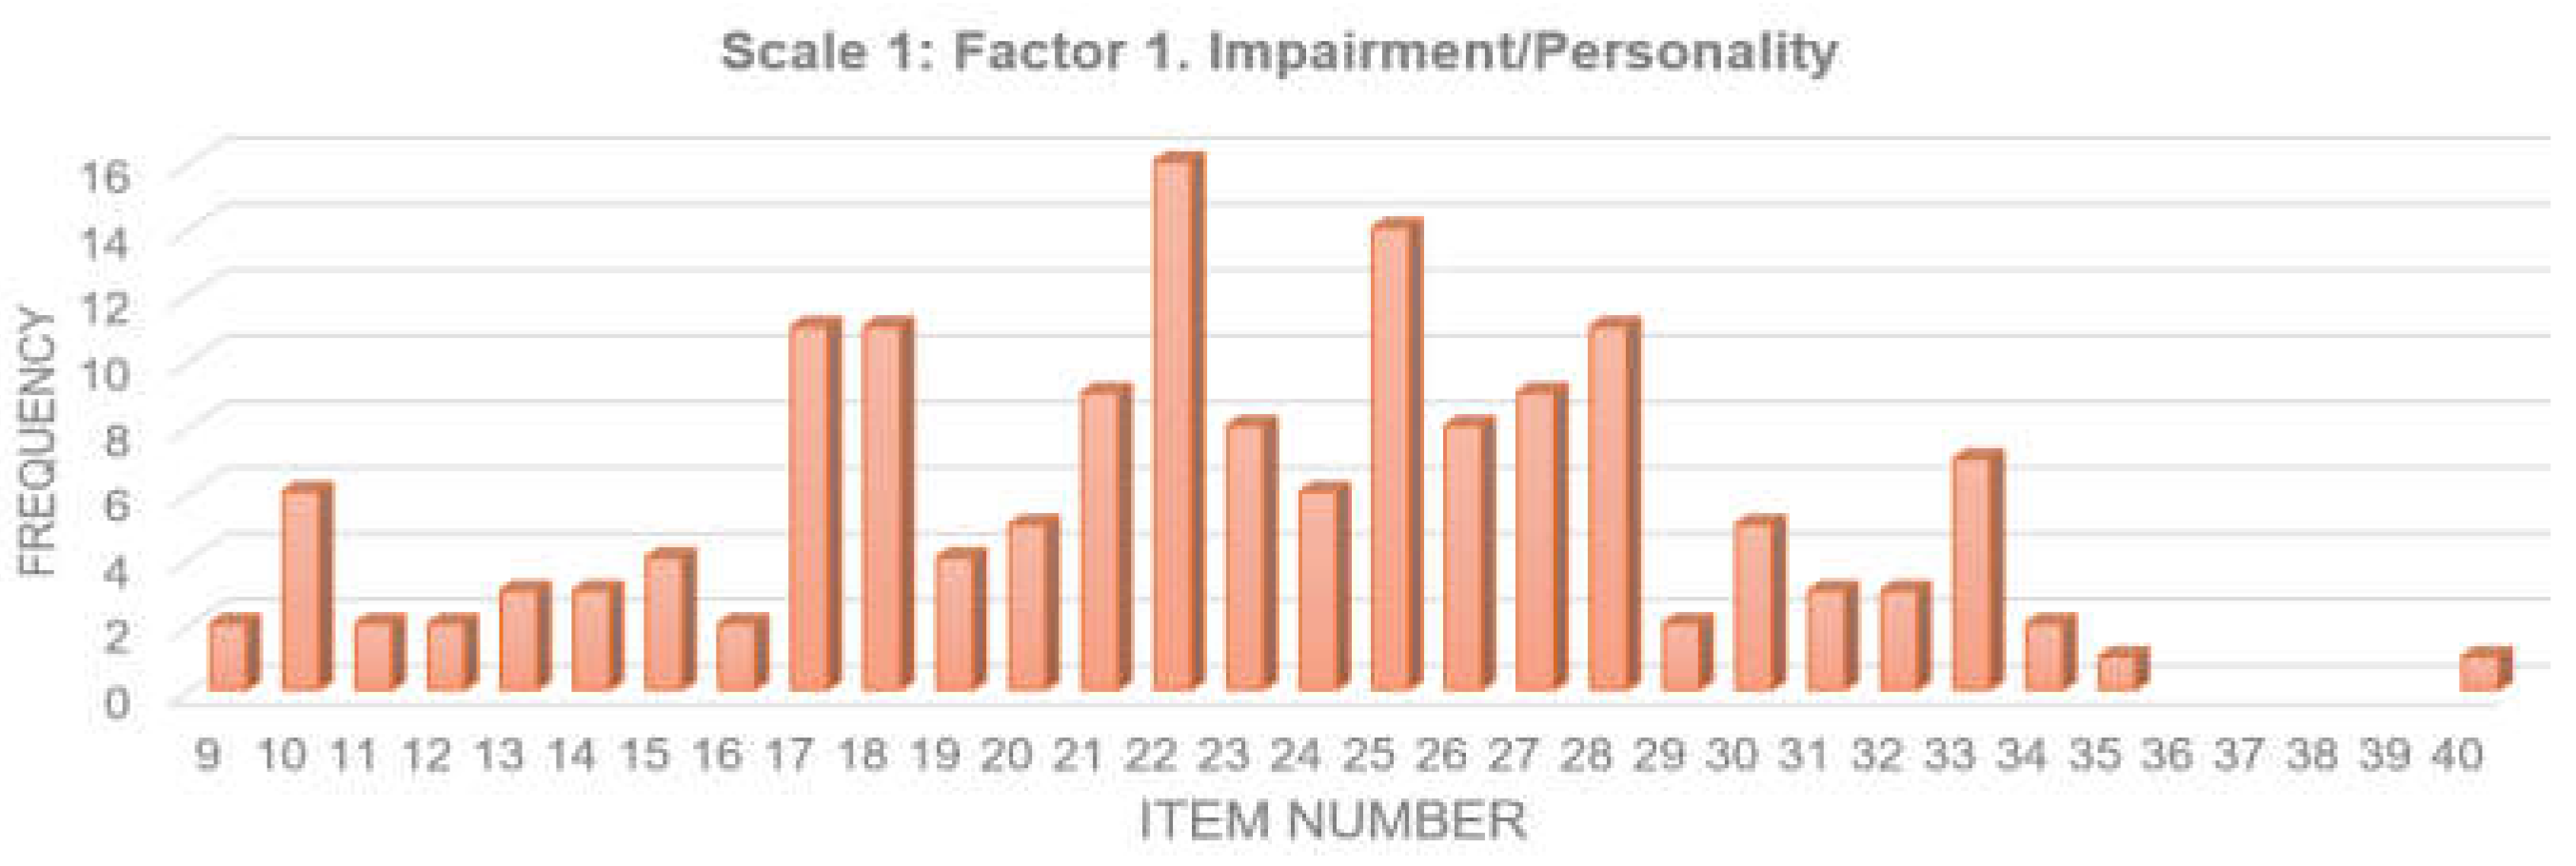
The Impairment/Personality factor has a mean score of 22.5 points with a standard deviation of 6.3 (M = 22.5, SD = 6.3).
Figure 6 below shows the distribution of the data for this factor. The graph illustrates the response frequencies across participants, highlighting a moderate dispersion in scores. This suggests variability in how individuals perceive personality impairment, with some participants scoring higher or lower than the mean, reflecting differing personal perceptions of this factor.
For the Disability factor, the mean score was 9.95 points with a standard deviation of 3.6 (
M = 9.95,
SD = 3.6). The distribution of the corresponding data is shown in
Figure 7. The Disability factor yielded a mean score of 9.95 points and a standard deviation of 3.6 (
M = 9.95,
SD = 3.6).
Figure 7 illustrates the distribution of data for this factor. The data suggest a relatively low mean score, with a moderate standard deviation, indicating that while some participants report higher levels of disability, most show lower levels of perceived disability.
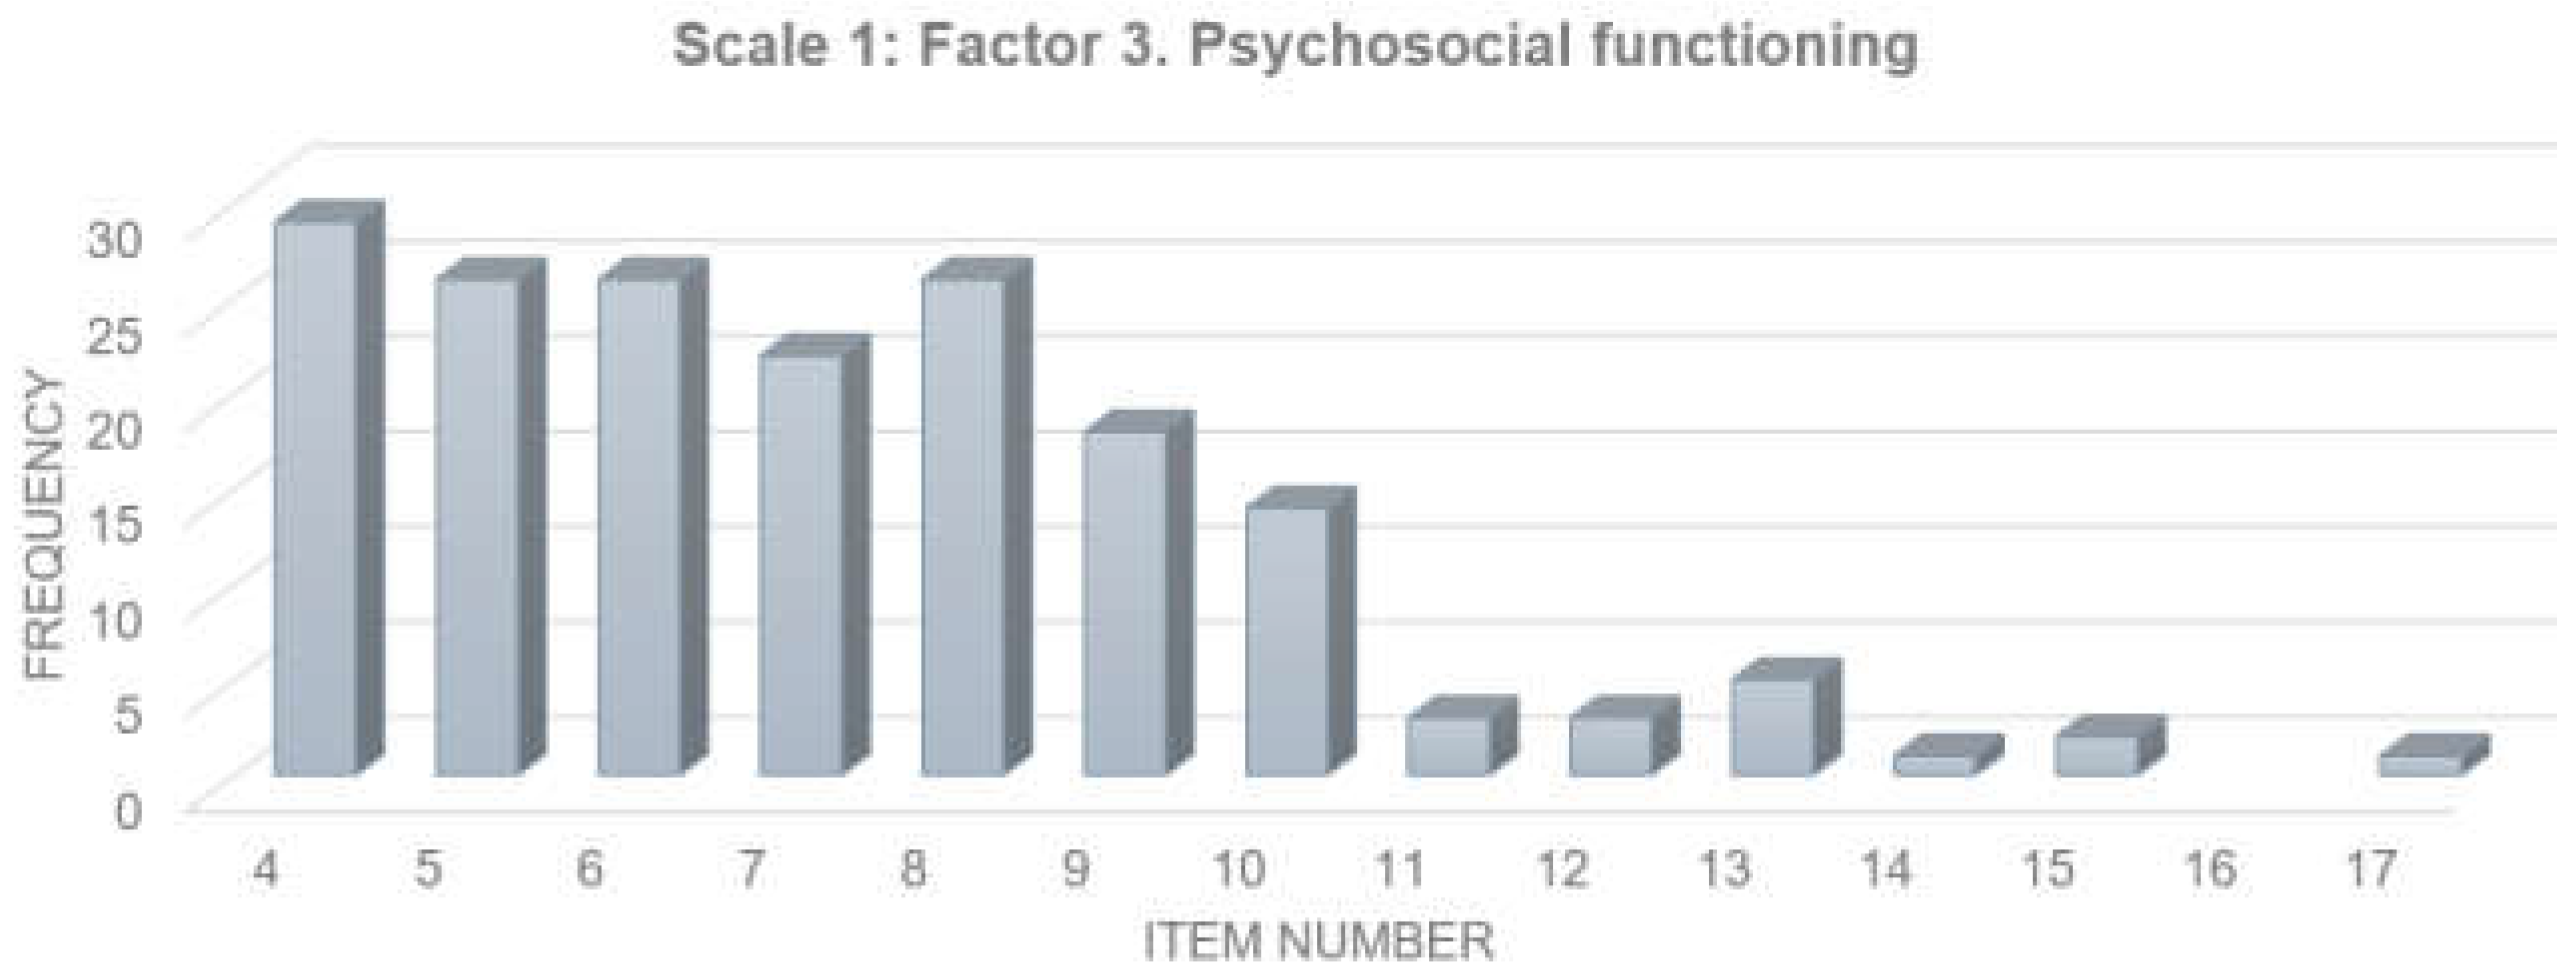
The Psychosocial Functioning factor had a mean score of 7.1 points with a standard deviation of 2.16 (
M = 7.1,
SD = 2.16). As shown in
Figure 8, this graph represents the distribution of data for this factor. The low standard deviation and moderate mean indicate that participants generally perceive a moderate level of psychosocial functioning with little variability in their responses.
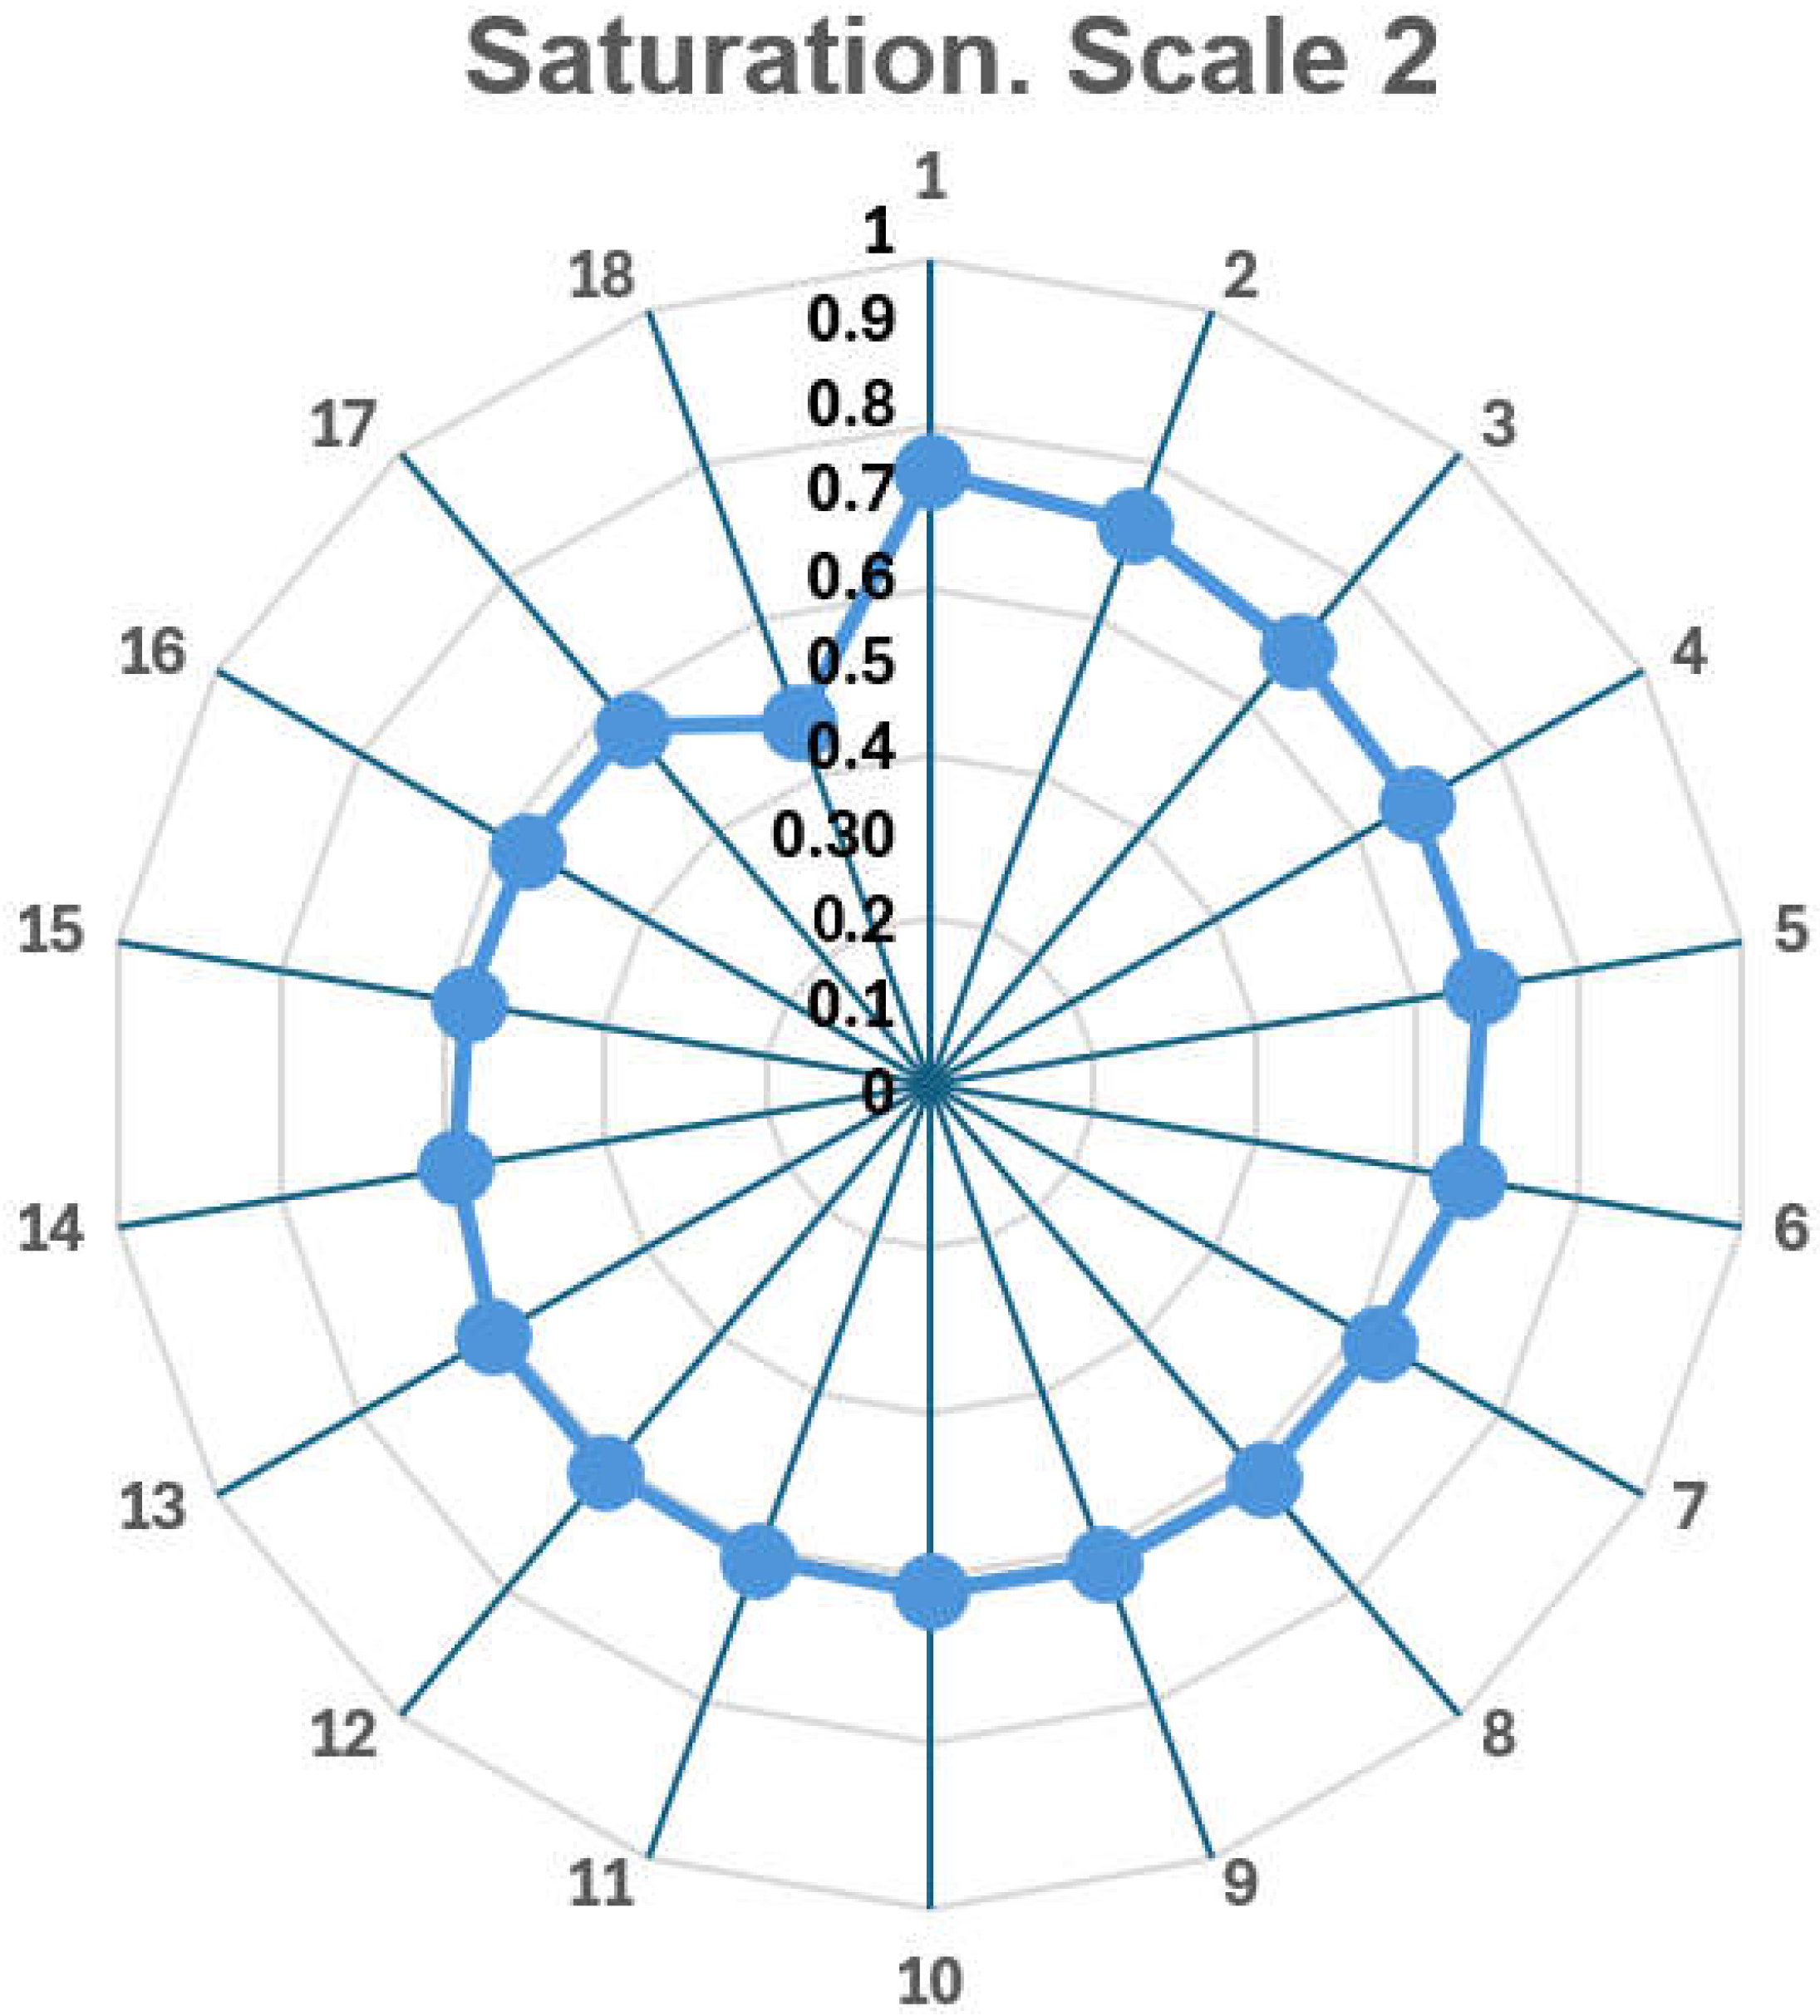
3.4.2. Structure of the Second Age Scale
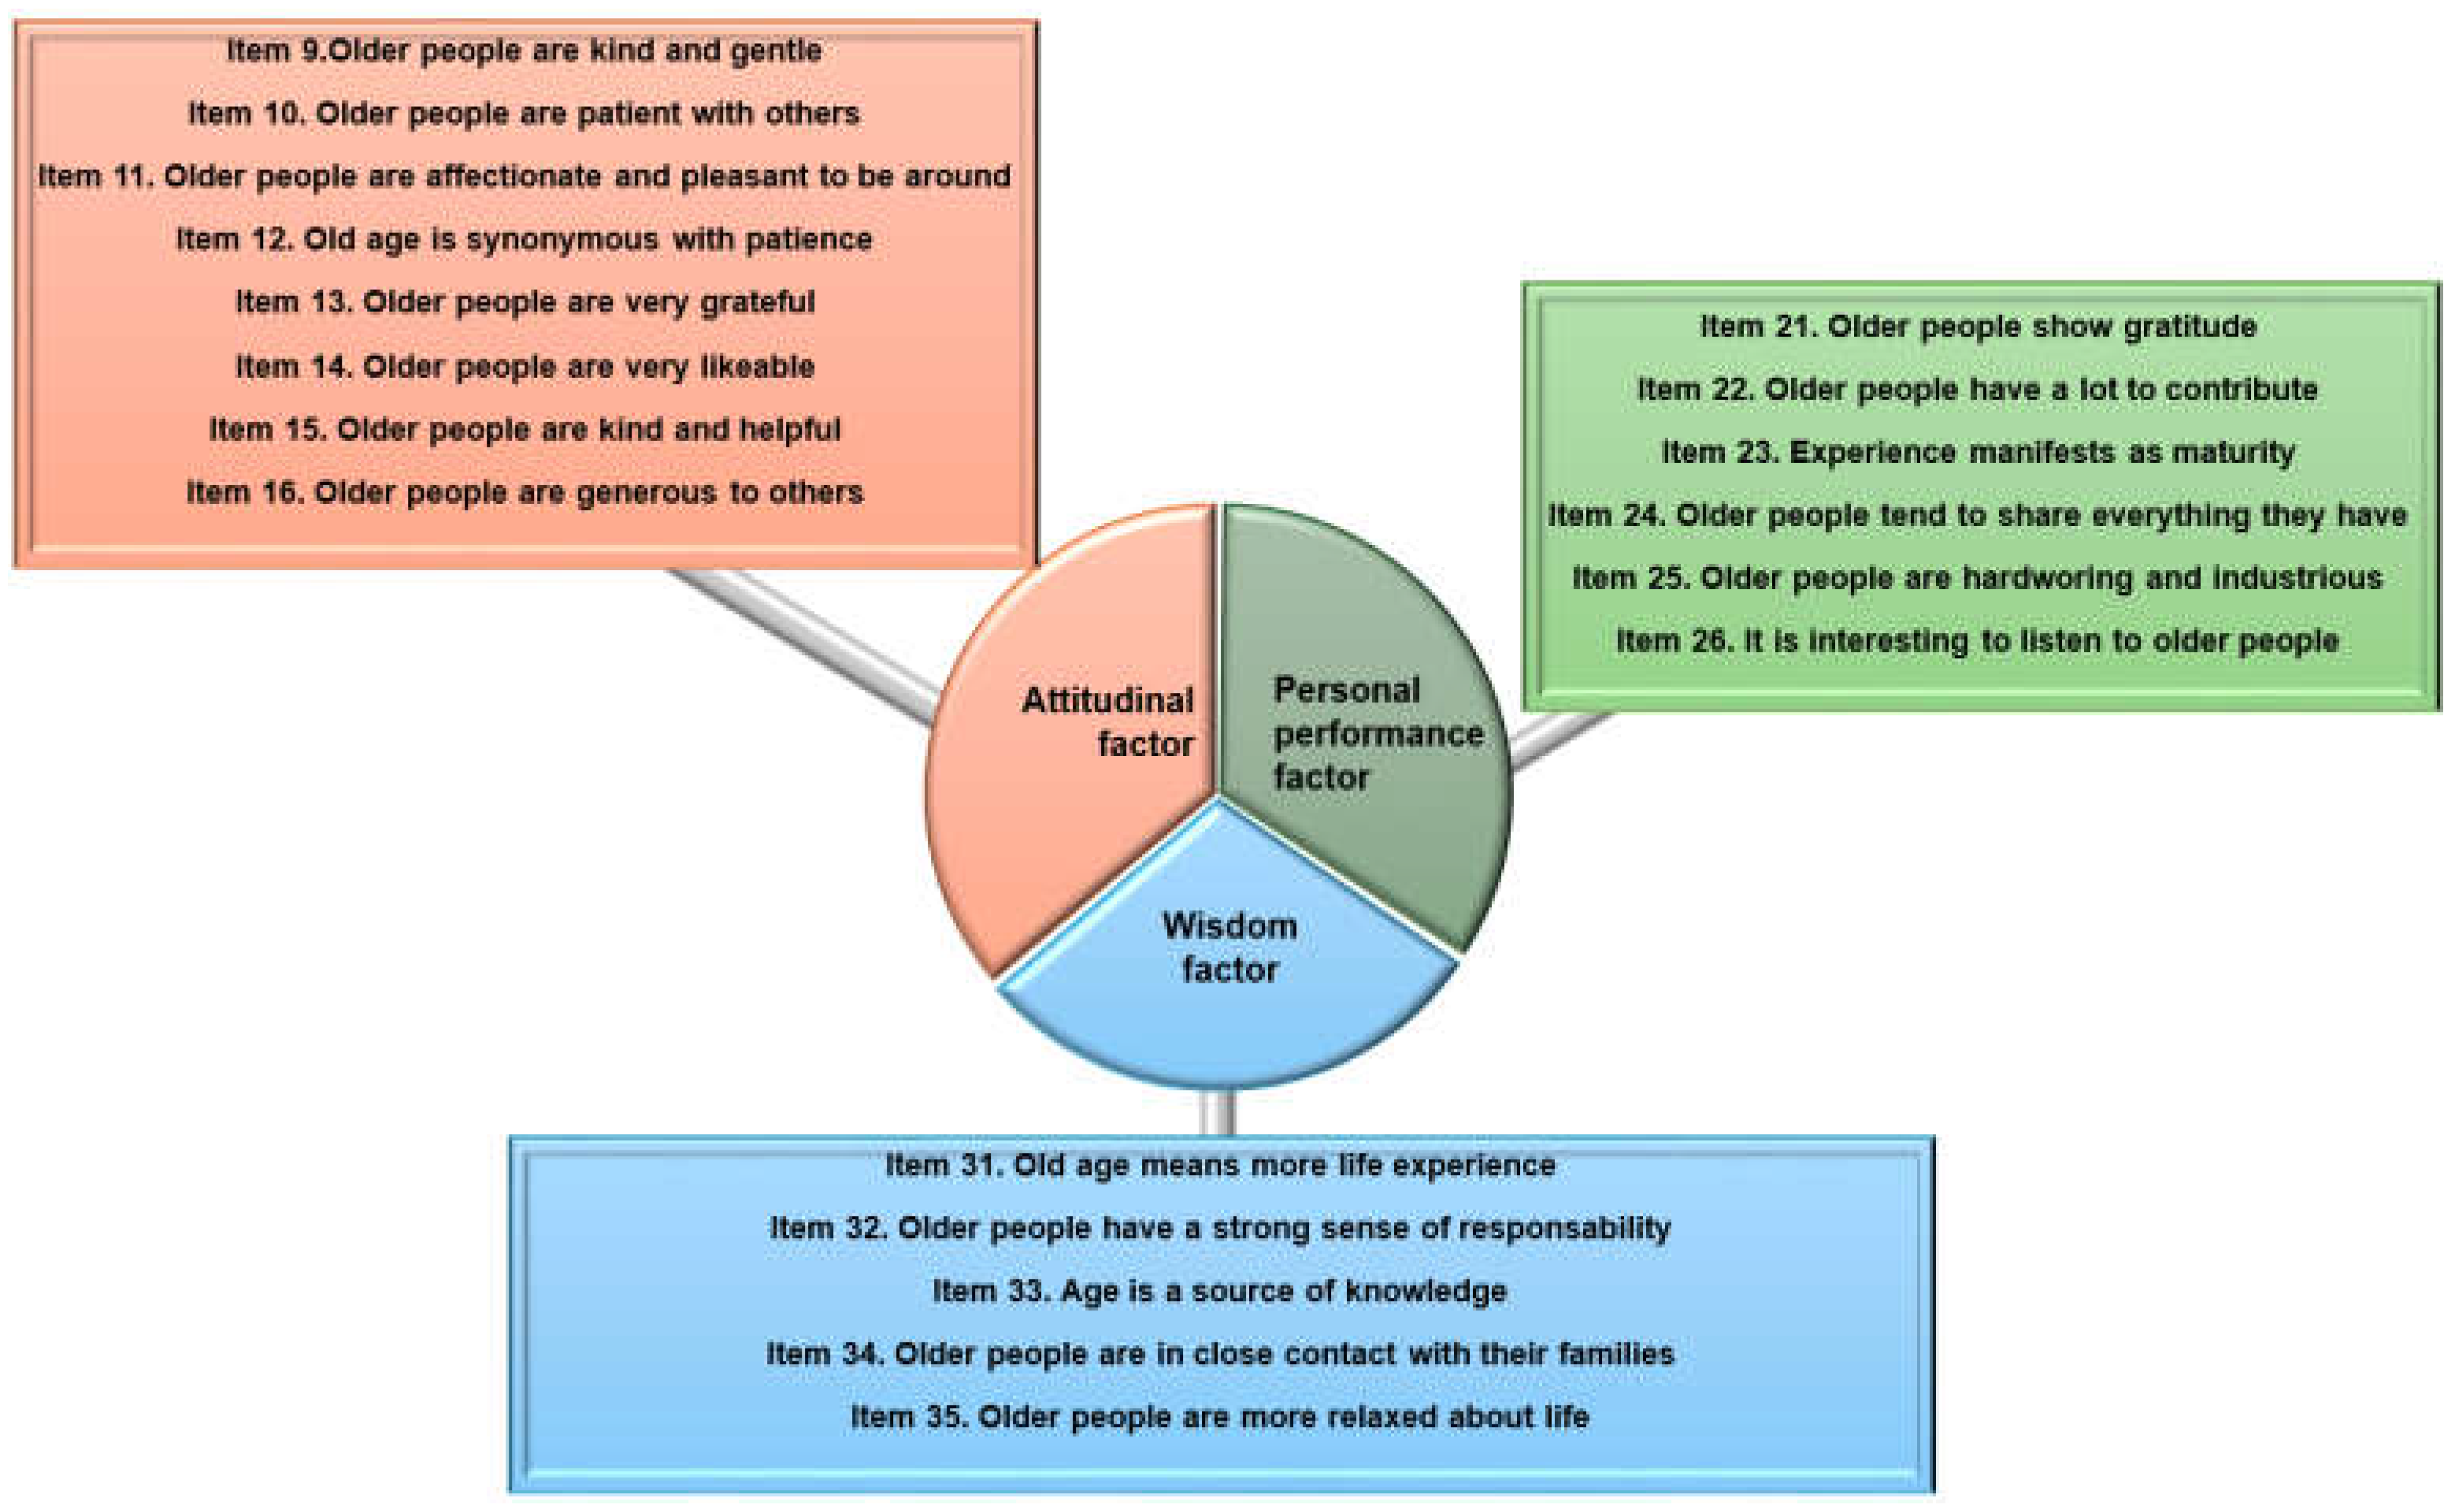
The Second Age Scale, which assesses positive attitudes toward old age, is divided into three factors: Attitudes, Interpersonal Functioning, and Wisdom (
Figure 9).
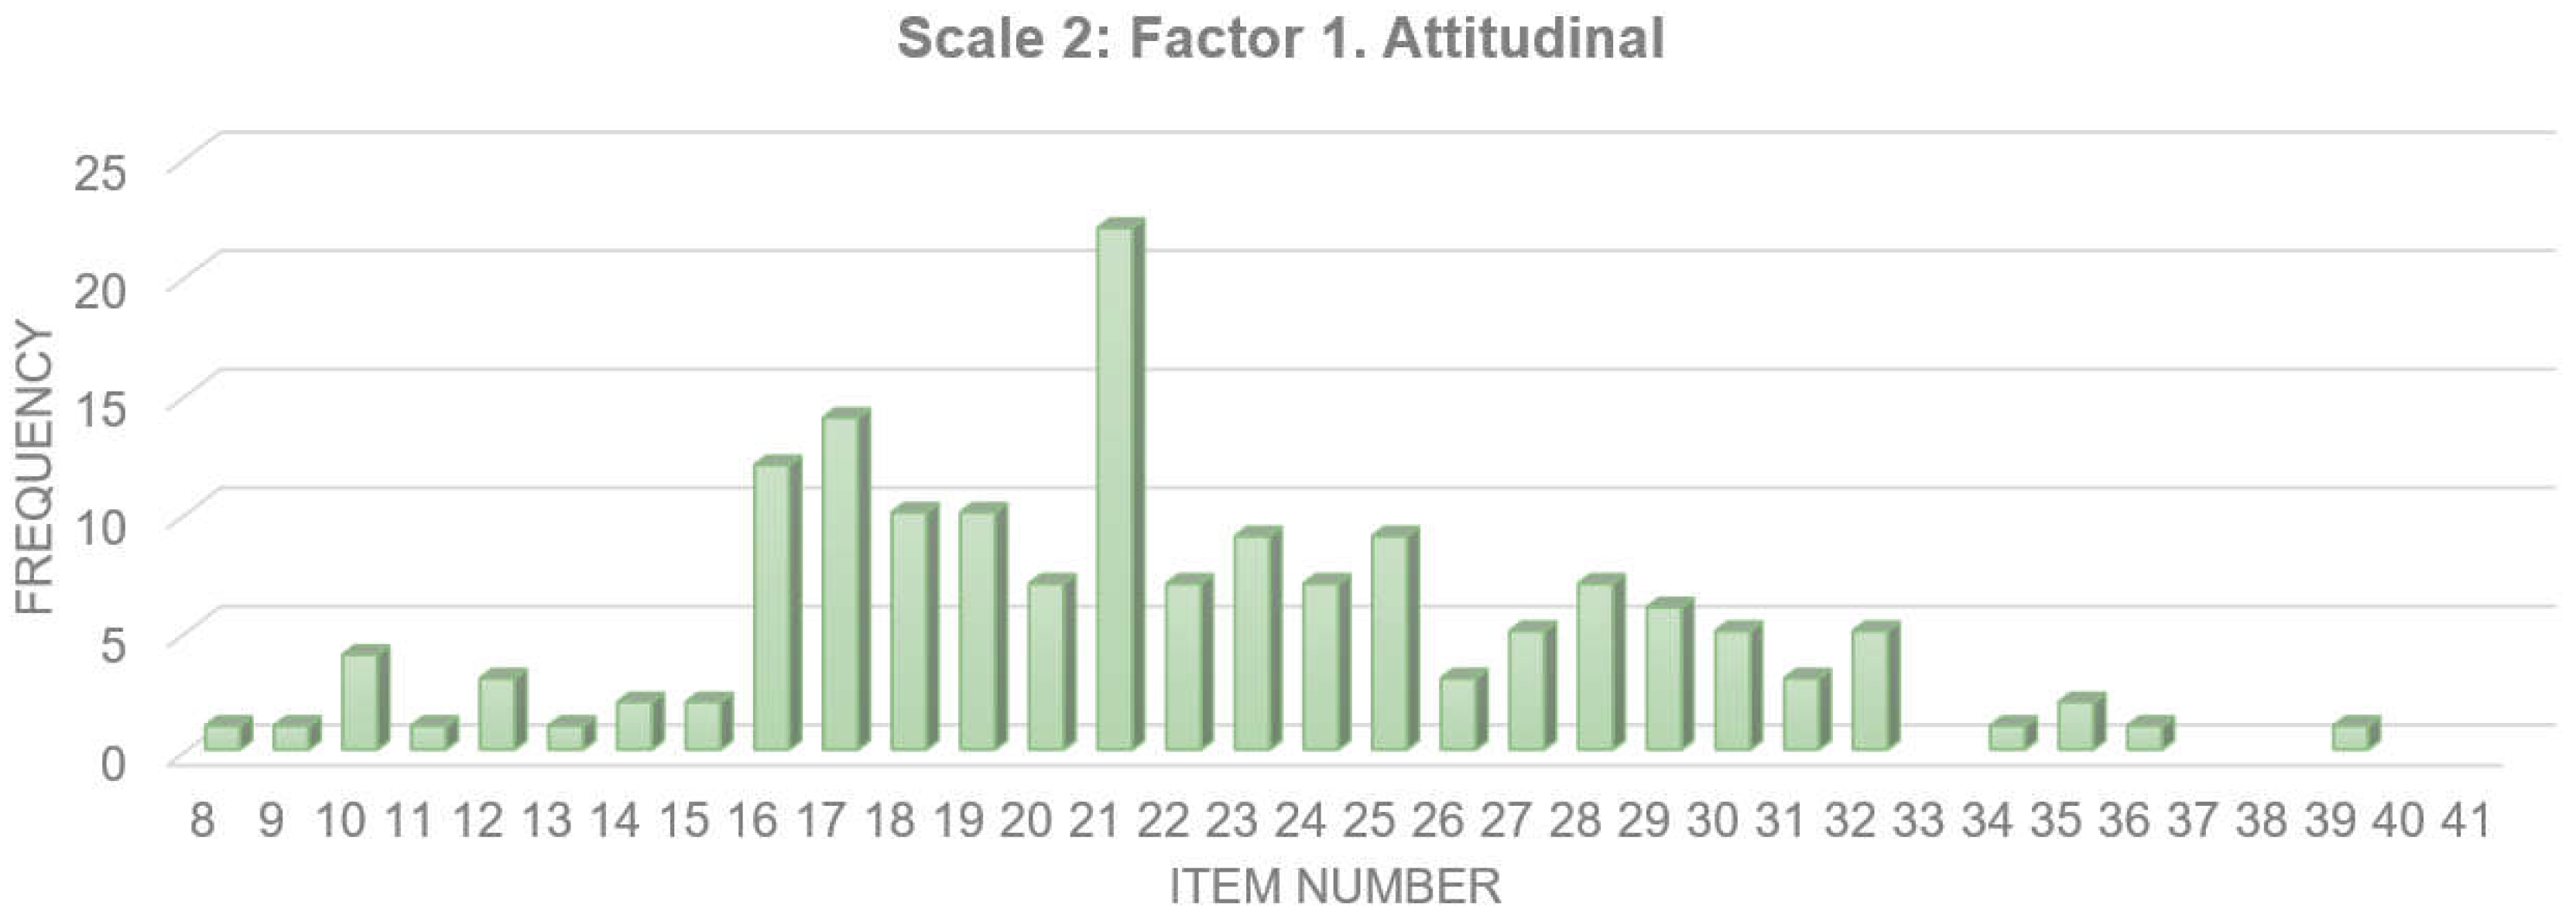
The Attitudinal factor had a mean score of 21.7 points with a standard deviation of 5.9 (
M = 21.7,
SD = 5.9).
Figure 10 represents the distribution of responses for this factor, showing positive attitudes toward old age with some variability among participants.
Figure 9 illustrates how the items are distributed in the second scale of the AAS, reflecting the main dimensions assessed in relation to attitudes toward aging.
Figure 9.
Scheme of the distribution of items in the AAS corresponding to Scale 2.
Figure 9.
Scheme of the distribution of items in the AAS corresponding to Scale 2.
Figure 10.
Distribution of data in the Attitude factor. Distribution of response frequencies for Factor 1, Attitudinal, of Scale 2. The chart shows the frequency of responses for each item of the scale, which evaluates general attitudes toward aging. The X-axis represents the item numbers, while the Y-axis reflects the number of responses associated with each item. This chart highlights variations in participants’ responses, showing differences in perceptions of aging.
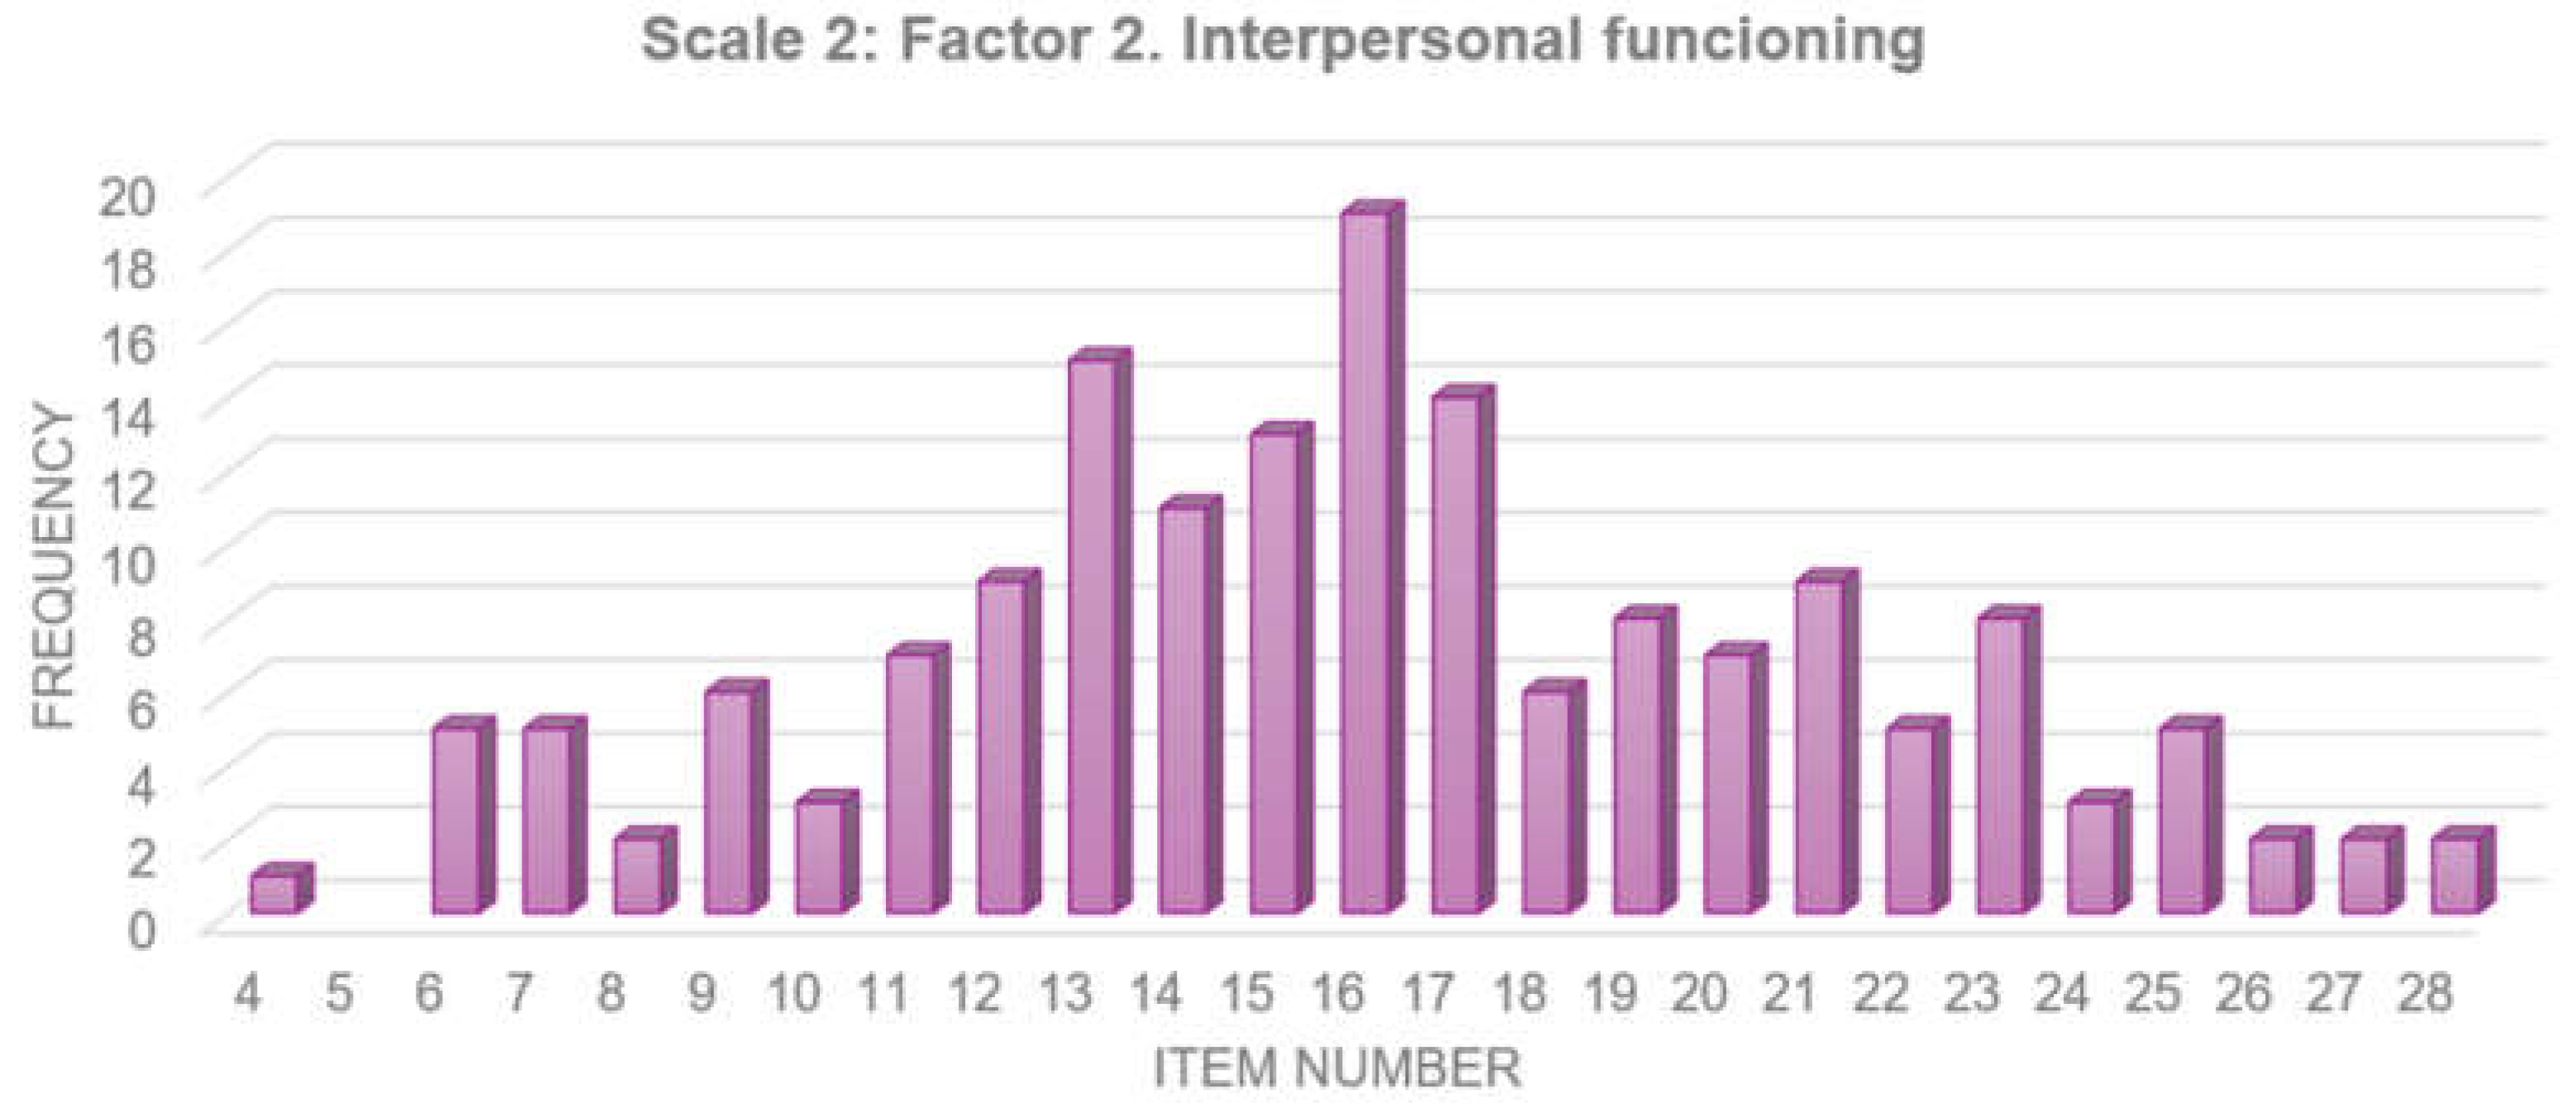
The Interpersonal Functioning factor had a mean of 18.0 points and a standard deviation of 5.1 (
M = 18.0,
SD = 5.1). As shown in
Figure 11, the data distribution indicates moderate variability in participants’ perceptions of interpersonal functioning and relationships in old age.
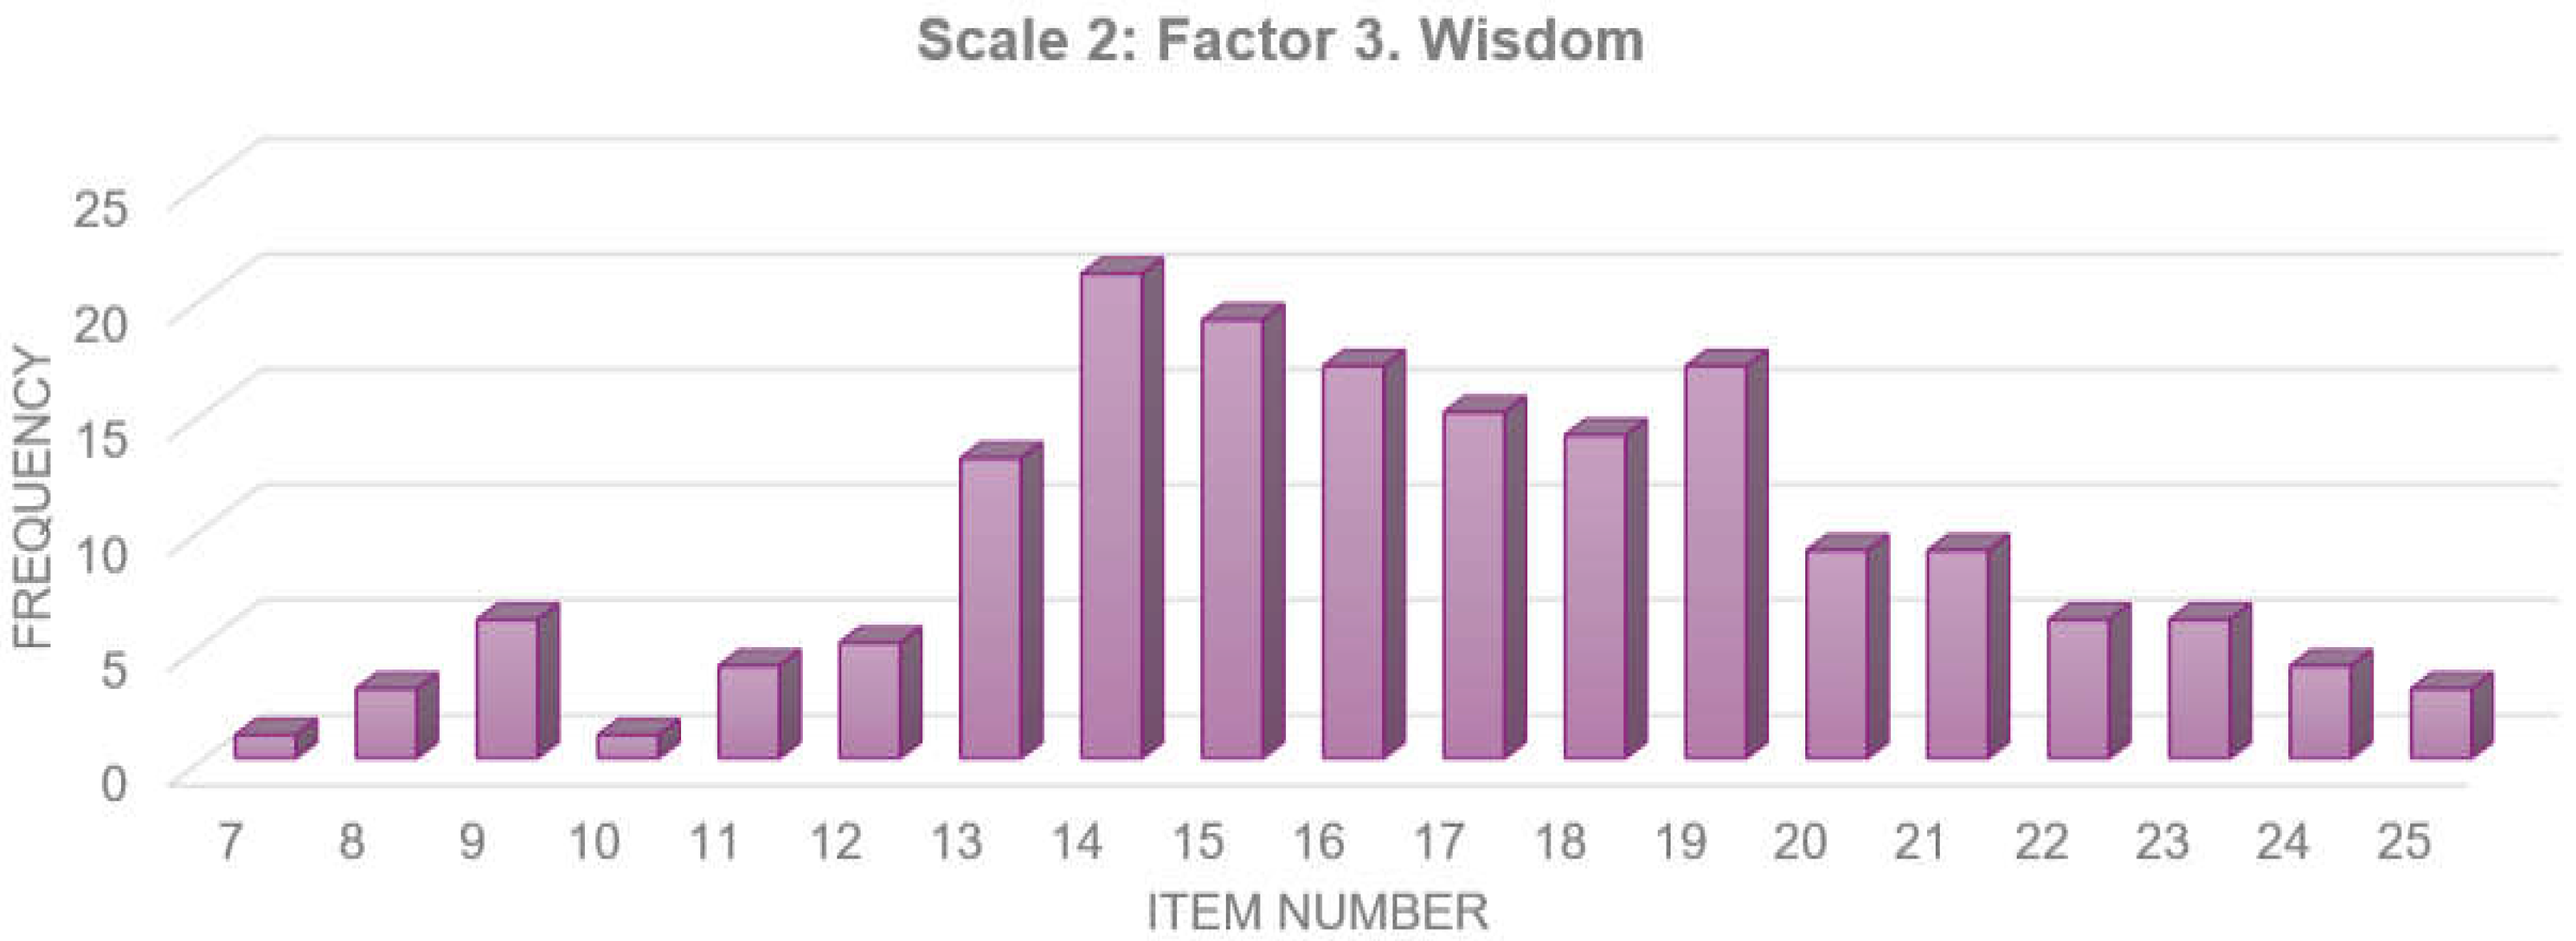
Finally, the Wisdom factor had a mean of 16.5 points and a standard deviation of 3.8 (
M = 16.5,
SD = 3.8).
Figure 12 below presents the distribution of responses for this factor. It shows that most participants perceive older people as possessing considerable wisdom, with low variability in scores.
These figures and graphs provide a detailed overview of how the responses are distributed within each factor, allowing a clear understanding of the attitudes toward aging assessed in this study. The graphical information complements the statistical data, making it easier to identify patterns and trends in participants’ responses.
The Positive Stereotype Scale 2, which consists of 19 items, has a total score ranging from 19 to 95 points. The scale is divided into three main factors: Attitudinal, Interpersonal Functioning, and Wisdom. The Attitudinal factor, with scores ranging from 8 to 40 points, measures general attitudes toward old age, with a mean of 21.7 points and a standard deviation of 5.9 (
M = 21.7,
SD = 5.9), suggesting generally positive attitudes with some variability between participants, as shown in
Figure 10. The Interpersonal Functioning factor, with scores ranging from 6 to 30 points, assesses interpersonal skills and relationships in old age, with a mean of 18.0 points and a standard deviation of 5.1 (
M = 18.0,
SD = 5.1), indicating a good level of interpersonal functioning with moderate variability, as shown in
Figure 11. Finally, the Wisdom factor, with scores ranging from 5 to 25 points, measures the perception of wisdom and knowledge accumulated with age, with a mean of 16.5 points and a standard deviation of 3.8 (
M = 16.5,
SD = 3.8), reflecting a moderately high perception of wisdom with little variability among participants, as shown in
Figure 12.
The construct validity indices for the Negative Stereotype Scale and Positive Stereotype Scale are now presented below. This table shows the relationship between the factors of each scale and their corresponding convergent and discriminant validity indices (
Table 10).
Table 10 presents the correlations between the factors of the Negative and Positive Stereotype Scales, along with their respective p-values. For the Negative Stereotype Scale, the factors show significant positive correlations, particularly Psychosocial Functioning (r = 0.60) and Impairment/Personality (r = 0.56), which suggest a strong relationship with negative attitudes toward old age. On the other hand, the Positive Stereotype Scale shows higher correlations for factors such as Wisdom (r = 0.72) and Attitudinal (r = 0.68), indicating a stronger association with positive attitudes toward aging. The other factors in both scales, such as Disability and Interpersonal Functioning, show moderate but still significant correlations. These results underscore the validity of both scales in distinguishing between positive and negative stereotypes, confirming their construct validity and effectiveness in capturing different aspects of attitudes toward old age.
The results of the Negative and Positive Stereotype Scales assessing attitudes toward old age among Master’s degree students in Education can be attributed to various factors related to their advanced academic training and professional context.
Firstly, the theoretical depth provided by the Master’s program plays a significant role. These students undergo advanced academic training that includes an in-depth study of human development, pedagogy, and psychology. This background equips them with a more nuanced and reflective understanding of the different stages of life, including old age, which likely contributes to the development of more positive and less stereotypical attitudes toward aging.
Moreover, research training and critical reflection are essential aspects of Master’s-level education. Students are trained in research methods, which encourages them to critically analyze and challenge prevailing negative stereotypes about aging. This academic approach fosters a more informed and balanced perspective, allowing students to move beyond simplistic views and engage with the complexities of aging.
In addition to academic training, many Master’s students have significant professional and social experiences that shape their perceptions of aging. Professional interactions, especially those with older individuals in educational or community settings, can help reinforce positive attitudes. These experiences often lead to a deeper appreciation of the skills, wisdom, and contributions of older people. Furthermore, professional networks and mentoring are common at the Master’s level, and mentors who hold positive views of aging can serve as role models, influencing their mentees to adopt similar perspectives.
Master’s programs also emphasize the preparation of students for leadership roles in education, which requires an inclusive and respectful understanding of all life stages, including aging. As future educators and leaders, students are expected to design and manage educational programs that cater to all age groups. This focus on leadership highlights the importance of developing positive and inclusive attitudes toward aging. Additionally, students are trained with a strong sense of ethical and social responsibility, which includes promoting the well-being of society, further reinforcing the need for a respectful attitude toward older adults.
Finally, sociocultural and media influences also play a crucial role in shaping students’ attitudes. Master’s students, who are typically more aware of cultural norms and values regarding aging, may be influenced by cultures that emphasize the wisdom and experience of older generations. These cultural values can encourage more positive views of aging. Moreover, Master’s students have access to a wide range of academic resources, literature, and research that offer positive representations of aging, helping to counteract negative stereotypes and contribute to a more balanced and appreciative view of older adults.
In summary, the combination of advanced academic training, professional experience, expectations of leadership and social responsibility, and the influence of cultural norms and access to diverse information contribute to the development of positive and balanced attitudes and perceptions of aging among Master’s in Education students. Additionally, their training in social and community sustainability enables them to understand the importance of integrating and valuing older people as a fundamental part of a sustainable and inclusive society. This is reflected in the results of the Negative and Positive Stereotype Scales, which show an appreciation of the wisdom and capacity of older people, as well as a lower tendency to hold negative stereotypes. Involving older people in sustainability initiatives strengthens social cohesion and promotes a fairer and more supportive environment for all generations.
It is crucial to consider attitudes toward aging in this sample, as future educators have the potential to significantly influence the formation of perceptions and values in their students, thus promoting a more inclusive and respectful view of aging in society.
