Abstract
Diagnosing climate variability and environmental change in floodable regions is essential for understanding and mitigating impacts on natural ecosystems. Our objective was to characterize environmental degradation in the Brazilian Pantanal by identifying changes in vegetation and water cover over a 30-year period using remote sensing techniques. We evaluated surface physical–hydric parameters, including Land Use and Land Cover (LULC) maps, Normalized Difference Vegetation Index (NDVI), Modified Normalized Difference Water Index (MNDWI), Normalized Difference Moisture Index (NDMI), and precipitation data. There was a decrease in the area of water bodies (−9.9%), wetlands (−5.7%), and forest formation (−3.0%), accompanied by an increase in the area of pastureland (7.4%). The NDVI showed significant changes in vegetation cover (−0.69 to 0.81), while the MNDWI showed a decrease in water surface areas (−0.73 to 0.93) and the NDMI showed a continuous decrease in vegetation moisture (−0.53 to 1). Precipitation also decreased over the years, reaching a minimum of 595 mm. Vegetation indices and land use maps revealed significant changes in vegetation and loss of water bodies in the Pantanal, reinforcing the need for sustainable management, recovery of degraded areas, and promotion of ecotourism to balance environmental conservation and local development.
1. Introduction
In Brazil, the Pantanal natural region, comprising the states of Mato Grosso do Sul and Mato Grosso, is the largest tropical wetland in the world and is under serious threat from climate change, agricultural expansion, and other anthropogenic pressures on this fragile ecosystem. These threats are affecting the biodiversity and ecological dynamics of the Pantanal’s terrestrial and aquatic habitats, threatening the sustainability of its ecosystem services.
In addition to being the largest floodplain in the world, the Pantanal plays a crucial role in regulating the region’s hydrological cycles, acting as a natural water reservoir and effectively controlling floods and droughts. Its rich biodiversity of endemic and migratory species is essential to South America’s ecological balance. In addition, the biome provides essential ecosystem services such as water purification, carbon sequestration, and protection against natural disasters such as floods. Conservation of the Pantanal is therefore fundamental to maintaining ecological balance and the well-being of human populations that depend directly on the region’s natural resources [1,2].
The Pantanal is surrounded by the natural regions of the Cerrado and the Amazon Rainforest, which are rich in water sources and streams and rivers of different levels. The change in land use in these regions into pastures and croplands, in addition to the increase in the frequency of forest fires, has led to disturbances in the hydrological cycle and, consequently, in the functioning of the environment [3,4,5].
The Pantanal is characterized by a mosaic of forest complexes and dry or seasonally flooded grasslands, driven by water drainage from higher plateaus during the rainy season. These waters are slowly drained into the lower lands of the Paraguay River basin, creating highly diverse conditions for a variety of habitats that allow a high diversity of plant and animal species [6,7,8]. There are more than 2272 species of plants, 582 species of birds, 132 species of mammals, 113 species of reptiles, and 41 species of amphibians, making the Pantanal a UNESCO World Heritage Site, in an area of 25,156,000 ha of natural reserve [9,10,11,12].
However, the Pantanal biome faces multiple environmental threats, most of which are human-caused. These include deforestation, soil degradation, erosion, and water pollution. Agribusiness, especially cattle ranching, is the leading economic activity in the region and is one of the most relevant sources of deforestation. The increase in land for extensive pasture, which supports more than 5.0 million head of cattle, along with crops, threatens the natural vegetation and biodiversity of the Pantanal [13,14,15].
Land use changes in the Pantanal biome over the last century have been driven mainly by the expansion of cattle ranching, one of the oldest and most widespread economic activities in the region since the first settlements in the 17th century [16]. The abundance of natural pastures has favored the development of this practice, but it has also led to significant environmental impacts, such as deforestation, soil degradation, alteration of aquatic and terrestrial ecosystems, and increasing water pollution [17,18].
The intensification of these activities, combined with climate change, has put additional pressure on the Pantanal wetlands, compromising the quality of water resources that are essential for both biodiversity and the supply of local populations. Therefore, continuous and accurate monitoring of the spatial and temporal variability of these areas is essential to provide up-to-date information on environmental changes and to enable more effective and sustainable management of the biome in the face of current threats [19,20].
In addition, the region as a whole and the wetlands in particular, are experiencing their worst crisis in decades. Climate change, such as reduced precipitation and increased average temperatures, has exacerbated this crisis by altering flood patterns that are critical to the ecological functions of the Pantanal [21,22].
Reductions in precipitation adversely affect soil water availability, leading to more severe droughts and a biomass that is more susceptible to wildfires. Rising average temperatures accelerate evaporation and intensify extreme heat events. These climate phenomena, combined with the expansion of agriculture and grazing, threaten the ecological resilience of wetlands and the region’s rich biodiversity [23,24].
Given the ecological and socio-economic importance of the Pantanal, as well as other wetlands in the world, their mapping and monitoring is essential for the sustainable management of their natural resources. However, in situ monitoring is expensive and difficult to access due to the peculiarities of this region (floodable wetlands, limited infrastructure). In this context, the use of remote sensing data for these purposes seems indispensable [25,26,27,28,29].
Remote Sensing (RS) and Geographical Information Systems (GIS) techniques are fundamental for integrating and managing land use change data, in addition to facilitating the visualization of large amounts of data [30,31]. Working with this type of data allows the creation of thematic maps that can display vegetation indices such as Normalized Difference Vegetation Index (NDVI), Modified Normalized Difference Water Index (MNDWI), and Normalized Difference Moisture Index (NDMI). These indexes are essential for monitoring changes in land use and vegetation patterns, providing valuable data for natural resource management and conservation [32,33,34,35].
In addition to monitoring land use change and vegetation indices, precipitation is of great importance in studies of climate and environmental change. This variable directly influences local climate and other weather variables, such as soil water availability, and is crucial for studies of drought severity over time. Therefore, understanding the distribution pattern of precipitation in large scale scenarios is essential for policies regarding efficient and sustainable management of water resources. Furthermore, this type of study can help in decision making to mitigate the effects of climate change, thus ensuring water availability for both wild and anthropogenic needs [36,37,38,39].
These challenges highlight the urgent need for effective, continuous monitoring of vegetation cover and water resources in the Pantanal region. Remote sensing and geographic information systems are very useful for these tasks, allowing a precise and detailed analysis of changes in land use and vegetation status, even in remote areas within this biome. Analysis of the interactions between environmental variables and human activities, together with climate change, is fundamental for designing conservation strategies and sustainable use of natural resources. Therefore, studies using satellite imagery to quantify changes in land cover are welcome and useful for the conservation of this unique biome.
Our hypothesis is that the expansion of agriculture, especially cattle ranching, combined with the decrease in precipitation in the Pantanal has had a negative impact on the biome. It is hypothesized that this interaction has led to a reduction in the area of water bodies, a loss of native vegetation, and a decrease in vegetation moisture, thereby compromising the ecological resilience and ecosystem services of the Pantanal. Our objective was to characterize environmental degradation in the Pantanal, identifying changes in vegetation cover and water surfaces over a 30-year time series using remote sensing data and processing.
2. Materials and Methods
2.1. Study Area
The Brazilian Pantanal natural region is located in the states of Mato Grosso (65%) and Mato Grosso do Sul (35%) [40], in the central-west region of Brazil (Figure 1), and covers approximately 151,000 km2, or 2% of Brazil’s territory. The Pantanal is a unique biome in terms of ecology and biogeography, as it is a kind of link between the Cerrado (neotropical savanna) in Central Brazil, the Amazon Rainforest, and the ecosystem of the Chaco Basin, being influenced by these three natural regions throughout its natural history [41].
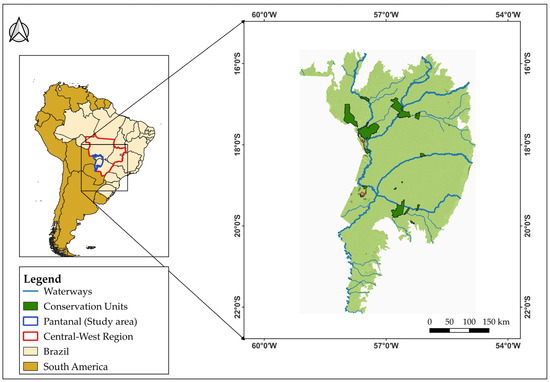
Figure 1.
Location of the study area within the central-west region of Brazil.
According to the Köppen classification, the Pantanal region belongs to the Aw category; i.e., it has a tropical savanna climate with dry winters and warm, hot summers [42]. The mean annual temperature is 25 °C, varying from 20 °C in July to 28 °C in December and January. The mean annual relative humidity is 80%, ranging from 72% in September up to 85% in March. Mean annual precipitation is 1184 mm, with spatial variations ranging from 959 mm in the western part of the region to 1500 mm in the northeastern part [43]. Most of the precipitation (80%) occurs during the rainy season (October to March) [41].
2.2. Land Use and Land Cover (LULC)
The Land Use and Land Cover (LULC) time series used in this research were provided by the MapBiomas project [44] and have a resolution of 30 m. The LULC maps of collection 6.0 were generated from Landsat satellite imagery, and were produced through a classification process using the Random Forest ensemble method, in the Google Earth Engine cloud platform.
The time series of the study was from 1992 to 2022, with an interval of 5 years for image acquisition (1992, 1997, 2022, 2007, 2012, 2017, and 2022). The LULC data were reclassified from 14 to 8 classes for each year. The converted classes and their respective original attributes are as follows: forest (#3 and #9); wetlands (#11 and #33), savanna formations (#4), grasslands (#12), pastures (#15), urban buildings and water surfaces (#24). In addition, the perennial crops, crop mosaic, and agricultural mosaic classes have been combined into a single class called agropastoral. The detailed list of these and other class codes can be found on the MapBiomas project website: https://brasil.mapbiomas.org/wp-content/uploads/sites/4/2023/08/ATBD-Collection-8-v1.docx.pdf (accessed on 15 December 2024).
2.3. Orbital Satellite Data (Remote Sensing—Landsat 5 TM, Landsat 7 ETM+, Landsat 8 OLI)
We used orbital images from the Landsat 5, 7, and 8 satellites equipped with the TM, ETM+, and OLI sensors, respectively. These services are provided by the United States Geological Survey (USGS) in cooperation with the National Aeronautics and Spatial Administration (NASA). Images from the years 1992, 1997, 2002, 2007, 2012, 2017, and 2022 were used to calculate the Normalized Difference Vegetation Index (NDVI), Normalized Difference Water Index (NDWI), and Normalized Difference Moisture Index (NDMI).
Vegetation and water surface indices were calculated based on multispectral bands of surface reflectance according to the specifications of the TM, ETM+, and OLI sensors (Table 1). These indices are sensitive to changes in land use and land cover, vegetation biomass, soil water availability, drought conditions, crop productivity, and photosynthetic activity [45,46].

Table 1.
Characteristics of the multitemporal Landsat satellite images used in the study.
The thematic maps of physical–hydric features were automatically processed on the Google Earth Engine (GEE) cloud platform [47]. GEE provides a large library of functions for mathematical analysis, computational modeling, statistical analysis, and machine learning functionalities by using specific algorithms for digital processing of satellite imagery [48].
NDVI was obtained by calculating the ratio of reflectance difference between near red () and red (), according to Equation (1) [49]:
where and correspond to the bands 3 and 4 of Landsat 5 TM sensors, bands 4 and 3 of Landsat 7 ETM+, and to bands 5 and 4 of Landsat 8 OLI, respectively. The near infrared reflects strongly in healthy vegetation due to the internal structure of the leaves, while the red band records the absorption of light by chlorophyll for photosynthesis. NDVI varies between −1 and 1, with values near 1 indicating dense, healthy vegetation; values near 0 representing surfaces such as exposed soil; and negative values associated with bodies of water [50].
The Modified Normalized Difference Water Index (MNDWI) was adopted for improve detection of water surfaces from satellite imagery, according to Equation (2) [51]:
For Landsat 5, the green band ( corresponds to band 2, while shortwave infrared () corresponds to band 5. For Landsat 7, is band 2 and is band 5. For Landsat 8, is band 3 and is band 6. The band reflects visible light associated with vegetation and soil and is useful for distinguishing areas of dense vegetation or exposed soil, while the band is sensitive to soil moisture and the presence of water and reflects areas of water differently. The MNDWI ranges from −1 to 1, with positive values indicating the presence of water (such as lakes, rivers, and swamps) and negative values associated with dry surfaces such as vegetation or exposed soil [52].
NDMI was calculated as being the ratio between the difference and the sum of the reflected radiance in the spectrum regions NIR and SWIR, according to Equation (3). This index describes the level of water stress and help to identify areas under water deficit [53]:
The band identifications in the Landsat satellites correspond to the NIR and SWIR1 bands as follows: in Landsat 5, NIR is band 4 and SWIR1 is band 5; in Landsat 7, NIR is band 4 and SWIR1 is band 5; and in Landsat 8, NIR is band 5 and SWIR1 is band 6. The NIR band is highly reflective in healthy vegetation due to its internal structure and is a good indicator of the amount of moisture in the vegetation. The SWIR band is more sensitive to soil and vegetation moisture. The NDMI also ranges from −1 to 1, with positive values indicating more moisture in the vegetation and negative values associated with areas with little or no moisture, such as dry soil or water bodies [54].
2.4. Land Surface Temperature (LST) Estimation
Land Surface Temperature (LST) is the radiative temperature of the land surface after being heated by the sun. In this study, both Operational Land Imagery (OLI) and Thermal Infrared (TIR) from the Landsat 5, 7, and 8 satellites were used to determine the LST after applying atmospheric correction to remote sensing imagery. This index is used as an indicator of the energy balance of the Earth’s surface and the greenhouse effect in climate change research [55]. Google Earth Engine was used to acquire the satellite images and QGIS software was used for each processing step (Figure 2).
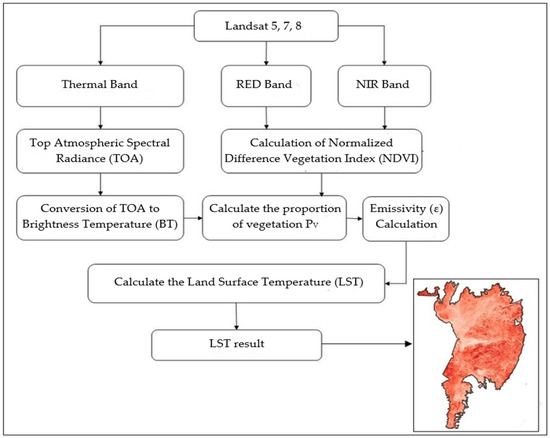
Figure 2.
Methodological flowchart for Land Surface Temperature (LST) in the Pantanal region.
First, the Top-of-Atmosphere (TOA) radiance was calculated using the radiance scale. The Digital Number (DN) of the thermal bands was converted to TOA spectral radiance (Supplementary Materials [56,57,58]). Images were obtained from Landsat 5, 7, and 8 satellites. Brightness Temperature (BT) was then calculated from thermal constants in the file metadata (Supplementary Materials [59,60]). Vegetation area was estimated (Supplementary Materials), and Land Surface Emissivity (LSE) was derived from NDVI values (Supplementary Materials [61,62]).
Finally, the Bright Temperature (BT), the wavelength of the emitted radiation, and the surface Emissivity (E) were used to calculate the LST (Equation (S6), Supplementary Materials [50,63]). This procedure was applied to all years of the time series, allowing a temporal analysis of LST changes.
2.5. Precipitation Data Based on CHIRPS
To study the spatial distribution of precipitation over the Brazilian Pantanal, we used data from the Climate Hazards Group Infrared Precipitation with Station Data (CHIRPS). This project covers the zone between 50° S and 50° N in both hemispheres, and includes a historical climate series that arranges satellite imagery data with a 0.05° spatial resolution grid (approximately 5.55 × 5.55 km grid) [64].
After obtaining the raster files of each image, processing was performed using QGIS 3.22.14 software. This application allows detailed spatial analysis and visualization of variables over time.
2.6. Temporal Trends in the Pantanal: Mann–Kendall Test for NDVI, Precipitation, LST, and Air Temperature
For the temporal trend in the Pantanal region, we applied an analysis to interpret a time series of NDVI, precipitation, land surface temperature, and air temperature data. Graphs and maps were created for comparison and trend analysis of the data. A time series from 1992 to 2022 was considered for the analysis due to the availability of high quality data, which ensures robust interpolation and consequently more accurate results. NDVI was obtained by processing images from the Landsat program (satellites 5, 7, and 8); mean annual precipitation data were processed from the Chirps database. Land surface temperature (LST) was obtained from the thermal bands of the Landsat satellites, and air temperature was obtained from the ERA5-Land database [65,66,67].
The Mann–Kendall test was applied to the time series of NDVI, LST, air temperature, and precipitation for each pixel of the analyzed images. This test has a range of values from −1 to 1, where negative values indicate a decrease in the variable, positive values indicate an increase, and zero means a balance between losses and gains [68].
The Mann–Kendall test was applied using the Kendall package in R software version 4.2.2 [69]. The annual images were processed to obtain annual means of NDVI, LST, air temperature, and precipitation over a 30-year series. The analysis consisted of an intrablock test, and the statistics were calculated for each pixel, arranged in a global test for the area of the Pantanal region. This process produced clear maps of the Mann–Kendall statistics, allowing the analysis of the trend for each variable over time.
3. Results and Discussion
3.1. Land Use and Land Cover (LULC)
In 1992, the dominant LULC classes were grassland (32.3%), forest (18.6%), water surface (14.4%), wetland (13.9%), savanna (13.2%), pasture (7.3%), and urban (0.04%). After 30 years, water surfaces, wetlands, and forest areas decreased by 9.9%, 5.7%, and 3%, respectively. On the other hand, the areas of grassland (8.6%), pasture (7.4%), and savanna (2.6%) increased (Figure 3).
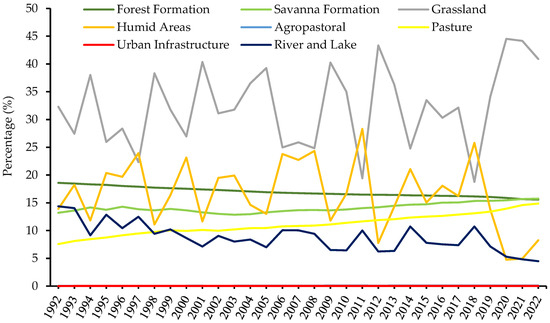
Figure 3.
Percentage change in land use and land cover classes in the Pantanal between 1992 and 2022.
Temporal analysis showed that changes in LULC were more pronounced at certain times and for certain classes. Notably, pastures and grasslands had the highest rates of increase over the entire period, while water surfaces decreased, while urban infrastructure areas remained stable and with a low proportion (Figure 4).
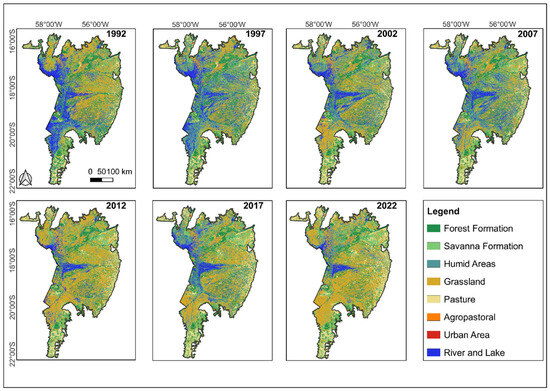
Figure 4.
Maps of LULC classification in the Brazilian Pantanal.
These changes in LULC in the Pantanal are consistent with [70], who suggest that the expansion of grasslands and pastures is directly related to real estate speculation and increasing demand for agricultural and livestock products. This expansion, often without sustainable or good management practices, has led to soil degradation processes and land use conversion from natural vegetation to pasture [71]. Conversely, the decline in water bodies, wetlands, and forests reflects changes in the hydrological cycle, exacerbated by factors such as dam construction, deforestation, and climate change [72].
Dams on rivers can have significant ecological impacts, including habitat fragmentation and loss, disruption of natural life cycles, disconnection of the river from its floodplain, facilitation of the introduction of exotic species, and restricted dispersal of aquatic biota. These effects can lead to a reduction in biodiversity and ecosystem services, affecting not only the area occupied by the reservoir, but also downstream regions in the entire river system [73,74]. These changes directly affect the cycle of floods and droughts, which are fundamental to the maintenance of the Pantanal ecosystem [75].
The expansion of savanna formation in the Pantanal observed during the study period reflects a possible response to the environmental and anthropogenic changes affecting the biome. This expansion may be associated with the degradation of native vegetation, including the reduction in forest and wetland areas, due to agricultural pressure, changes in water regimes, and climate change [76]. In addition, the increased frequency of wildfires in the region contributes significantly to landscape transformation, favoring the replacement of forest formations with savanna formations that are more resilient to conditions of water stress and disturbances such as fire [77].
These changes directly affect the flood and drought cycles that are fundamental to the functioning of the Pantanal ecosystem. Changes in natural landscapes, such as savanna, are also associated with agricultural expansion and increasing pressure on natural ecosystems.
In addition, changes in land use in the Pantanal are closely linked to economic and social factors that have shaped the landscape and environmental dynamics of the region in recent decades. Agricultural expansion, driven by growing global demand for commodities such as soybeans and beef, reflects the impact of an increasingly competitive international market, coupled with national policies that prioritize the agricultural sector as a driver of economic development [78]. As a result, natural areas have been systematically converted to pasture and cropland, leading to significant habitat fragmentation, a reduction in biodiversity, and the loss of essential ecosystem services [79]. In addition, agricultural expansion in the Pantanal is often facilitated by the absence or ineffectiveness of environmental regulations in some regions, allowing for management practices such as deforestation and intensive land use, which exacerbate environmental degradation [80]. This lack of environmental control creates a favorable scenario for overexploitation of natural resources, exacerbating the negative impacts on the biome.
On the other hand, social factors also play a crucial role in this process. The generation of employment and income associated with agriculture is particularly important for local communities, who are often dependent on these economic activities in regions where sustainable alternatives are limited. This economic dependence contributes to the perpetuation of practices that, while providing short-term benefits, may compromise the ecological integrity and resilience of the Pantanal in the long term [81].
The changes observed in the Brazilian Pantanal over the last three decades have revealed a profound transformation of the region’s ecosystems. The expansion of agricultural activities not only reflects economic growth, but also accentuates the environmental sensitivity of this natural region. The conversion of natural areas into pastures and grasslands directly affects its ecological dynamics, causing habitat fragmentation and reducing resilience to extreme climate phonemes. In addition, the reduction in wetlands and water surfaces can threaten the mechanisms of regulation of the hydrological cycle, which are essential for maintaining the balance between floods and droughts. Without appropriate interventions, such as the restoration of degraded areas and the adoption of sustainable agricultural practices, the Brazilian Pantanal may face increasingly complex challenges for its conservation and the maintenance of ecosystem services.
3.2. Spatial and Temporal Variations in NDVI, MNDWI, and NDMI Indices
NDVI values ranged from −0.69 to 0.81 over the time series studied (Figure 5). Analysis of the NDVI thematic maps revealed different patterns of land use and land cover over time in the study area. For example, water bodies are represented by negative NDVI values ranging from −0.69 to −0.01 (indicated by dark red pixels). In contrast, areas with little or no vegetation have NDVI values between 0.00 and 0.42, while areas with dense vegetation are characterized by values greater than 0.43.
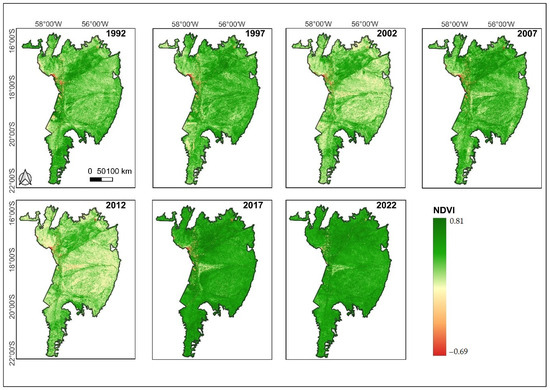
Figure 5.
Space–time distribution of NDVI in the Brazilian Pantanal, between 1992 and 2022.
There is a direct correlation between variations in vegetation cover and the impact of anthropic activities, as well as climate changes in the region. Negative values of NDVI associated with water surfaces indicate a decrease in these areas, possibly due to the increasing frequency and severity of drought events [82]. In fact, the predominance of intermediate values (0.00–0.42) indicates environmental degradation and intensive land use as a result of agricultural expansion, a very common pressure in this natural region [83]. The reduction in dense vegetation areas, signaled by high NDVI values, reinforces that the conservation of these forest ecosystems is crucial to maintain the provision of ecosystem services and its biodiversity [84].
The oscillating NDVI values in the Pantanal indicate the vulnerability of this ecosystem to anthropogenic pressures and climate change. The reduction in areas of dense vegetation, essential for biodiversity, suggests a worrying scenario. Areas once covered by equilibrated vegetation now show signs of soil degradation and exposure, reflecting the impact of agricultural expansion and severe droughts. This situation not only threatens the health of the biome, but may also limit the Pantanal’s ability to provide essential ecosystem services, such as regulating hydrological cycles and maintaining water quality. It is therefore essential to implement effective restoration and conservation strategies in the affected areas to ensure that the Pantanal can withstand future threats and maintain its rich biodiversity.
There was a negative correlation between NDVI and the areas of forest formation, indicating a decrease in this cover, probably due to deforestation and conversion of forest areas to agricultural and pastoral activities (Figure 6). In contrast, savanna formation showed an increase and a positive correlation with NDVI, which can be attributed to the expansion of pastures or changes in environmental conditions that favor this type of vegetation. The strong positive correlation between NDVI and agropastoral and pasture areas suggests that these activities are associated with an increase in vegetation, while the negative correlation with river and lake areas reflects a decrease in vegetation in aquatic areas. These results indicate that changes in land use in the Pantanal, such as an increase in pasture areas and a decrease in forest areas, are directly related to variations in the vegetation index and have a significant impact on the structure and dynamics of the biome over time [85,86].
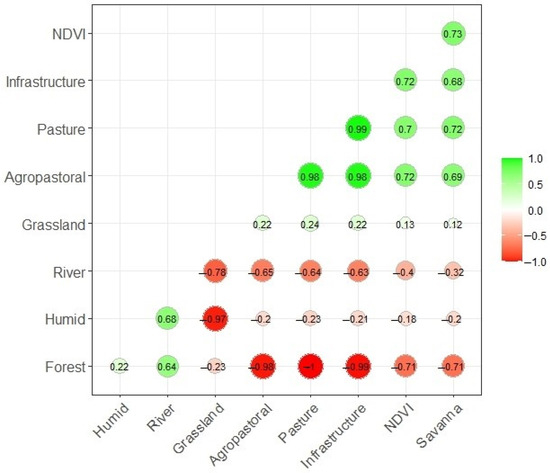
Figure 6.
Pearson’s correlation between NDVI and land use classes in the Brazilian Pantanal.
Figure 7 shows the evolution of the MNDWI in the Pantanal region over the 30-year time series. The water surfaces (in blue) are concentrated in the central and northern zones. Until 1997, there was a remarkable presence of water surface, which decreased in the following years. Between 2002 and 2022, this reduction was accentuated and remained noticeable throughout the period. The MNDWI index ranged from −0.73 to 0.93, reflecting the continuous decrease in water surfaces over time [87]. This may be related to climate change, which affects the water regime in the region by altering the distribution of precipitation and the escalation of evapotranspiration over time [88]. The changes in the hydrological cycle, especially in the Paraguay River basin, show the effects of climate change on the connectivity of floodplains and other water surfaces, causing imbalances in the hydric dynamics of the Pantanal [89].
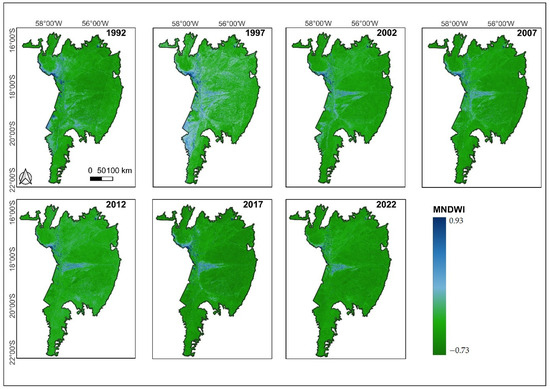
Figure 7.
Space–time distribution of MNDWI in the Brazilian Pantanal between 1992 and 2022.
The changes observed in the MNDWI index present an alarming scenario for aquatic ecosystems. The reduction in flooded areas and the increase in evapotranspiration rates are clear evidence of environmental pressures, largely driven by climate changes over time. The reduction in the amount and frequency of precipitation events has had a direct impact on the availability of soil water, thereby affecting biodiversity and ecosystem services that depend on hydrological cycles. Moreover, the loss of connectivity between flooded plains and flowing rivers not only harms plant and animal species, but also compromises the Pantanal’s ability to recover from extreme climate events, i.e., its ecological resilience. It is therefore essential to implement water management and conservation strategies aimed at restoring the integrity and resilience of aquatic ecosystems.
The results for the NDMI range from −0.53 to 1 (Figure 8). In 1992, there was a predominance of areas with moderate moisture and an increase in green areas in 1997. Until 2002, the moisture remained stable, but in 2007 there was a significant decrease, which continued between 2012 and 2017, with the predominance of dry areas. In the last year analyzed, i.e., 2022, there was a remarkable recovery of moisture, especially in the central zone, implying an improvement in the conditions for natural vegetation recovery.
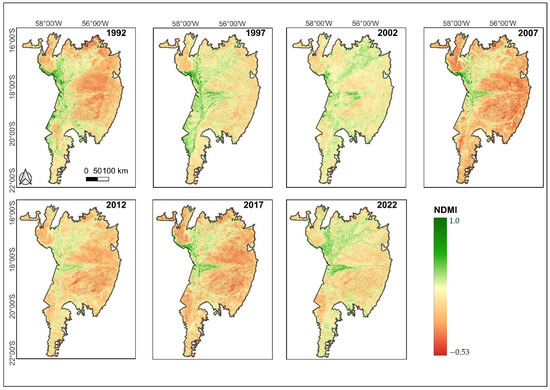
Figure 8.
Space–time distribution of NDMI in the Brazilian Pantanal between 1992 and 2022.
The oscillations in the NDMI reflect the complex interactions between climate change and management practices in the Pantanal. The initial increase in moisture can be interpreted as a signal of hydrological recovery, which is often associated with favorable climatic conditions and a balanced water regime [90]. However, the dramatic decrease in moisture since 2007 suggests a scenario of severe water stress, possibly exacerbated by the intensification of droughts and climatic variability that is well documented in this region [91]. This situation raises concerns about the resilience of aquatic and terrestrial ecosystems, as the decrease in moisture may negatively impact local biodiversity and its ecosystem services, such as hydric regulation and habitat provisioning [92].
The recovery of moisture in certain periods suggests that ecosystems can recover under favorable conditions. However, the sharp drop in the moisture index points to an alarming scenario, often associated with prolonged droughts and changes in precipitation patterns, with a direct impact on vegetation and biodiversity. Despite some signs of recovery in some areas, this improvement cannot be considered a definitive solution. It is therefore essential to continue monitoring and developing strategies to ensure the protection of these ecosystems.
The changes observed in the NDVI, MNDWI, and NDMI indices reflect significant changes in the ecological balance of the Pantanal. The decrease in NDVI indicates a loss of native vegetation, resulting in a decrease in biodiversity and a reduction in the ecosystem’s ability to sequester carbon, which contributes to the exacerbation of climate change. The decline of the MNDWI indicates a reduction in water cover, which can affect aquatic life and impair basic ecosystem services such as regulating the water cycle and providing water to local populations. In turn, the decline of the NDMI indicates a loss of moisture in vegetation, signaling water stress that can lead to soil degradation, increased fire risk, and reduced resilience of the biome to climate variability. These interrelated ecological changes suggest a scenario of environmental fragility that calls for sustainable management strategies and public policies aimed at conserving the Pantanal.
3.3. Land Surface Temperature (LST) Estimation
The Land Surface Temperature (LST) of the Brazilian Pantanal showed a significant increase over the years (Figure 9). In 1992, the temperature values ranged from 15.8 °C to 31.6 °C, while in 2022 the range was from 20.5 °C to 33.5 °C. This indicates a clear tendency of increasing temperatures, both in minimum and maximum, especially in recent years.
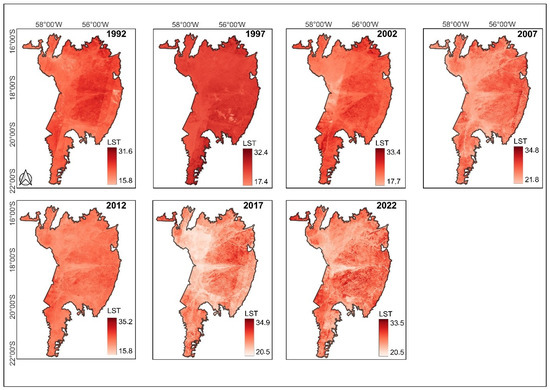
Figure 9.
Land Surface Temperature (LST) maps for the Brazilian Pantanal.
Rising mean temperatures are associated with changes in land use and land cover. In fact, areas without vegetation cover tend to show higher temperatures due to higher absorption of solar radiation and reduction in evapotranspiration [93]. As a result, soil exposure, especially in areas with reduced vegetation cover, results in higher temperatures, as demonstrated by research that indicates a direct influence of anthropic activities on thermal dynamics in the region [94]. In addition, ref. [95] suggests that intensive land use, such as agriculture, leads to increased mean temperatures, reflecting a pattern similar to that observed in the Pantanal. Therefore, the increased LST values in the region are not only a result of regional climate changes, but rather due to the combination of management practices [96].
Rising temperatures in the Brazilian Pantanal highlight the link between human activities and environmental conditions. The conversion of native vegetation to agriculture or cattle ranching not only exposes the soil, but also alters the natural surface cooling process. With less vegetation cover, the soil’s ability to retain moisture and regulate temperature decreases, resulting in excessive heating. Thus, the LST dynamics in the Pantanal show a complex system where changes in land use and land cover have amplified the impacts of climate change, reinforcing the need for sustainable management policies.
3.4. Precipitation Data Based on CHIRPS
Precipitation maps show a significant decrease in precipitation over the years, especially in the central areas (Figure 10). In 1992, precipitation ranged from 997 mm to 1873 mm, with the northern and eastern zones receiving more. In 2002, however, the Pantanal was much drier, with precipitation ranging from 595 mm to 1605 mm, when the central zones received less precipitation. This trend continued in 2022, with precipitation ranging from 654 mm to 1365 mm, showing drier central and southern zones of the Pantanal.
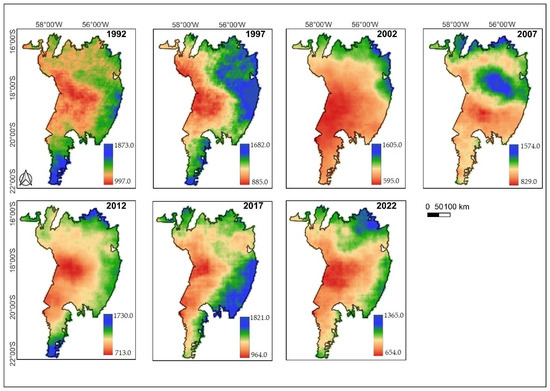
Figure 10.
Space–time distribution of annual total precipitation (mm), by CHIRPS product, in the Brazilian Pantanal, between 1992 and 2022.
This trend in decreasing precipitation is closely linked to climate change and interactions with the natural region of the Amazon rainforest [97]. The degradation of the Amazon biome, driven by deforestation and agricultural expansion, affects the atmospheric circulation of water vapor and its dynamics in South America, reducing the moisture supply to the Pantanal region [98,99]. The flying rivers theory highlights how the equatorial rainforests play a crucial role in the climate regulation of a southern region, and the decrease in precipitation, often concentrated in certain months, can lead to prolonged droughts, in addition to increasing vulnerability to forest fires [100,101]. For this reason, the analysis of precipitation patterns in the Pantanal should take into account these interrelated aspects, emphasizing the importance of conservation strategies and sustainable management that take into account such regional climate dynamics.
The reduction in precipitation in the Brazilian Pantanal is a reflection of a complex interaction between climate change and environmental degradation processes in neighboring regions, particularly the Amazon rainforest biome. Deforestation and changes in land cover and use have affected the hydrological cycle, resulting in reduced moisture availability for the Pantanal. This water scarcity had contributed to the intensification of droughts and an increase in the frequency of wildfires in the region. In addition, changes in precipitation patterns highlight the urgent need for conservation and restoration strategies for degraded lands to restore ecosystem resilience.
3.5. Temporal Trends in the Pantanal: Mann–Kendall Test for NDVI, Precipitation, LST, and Air Temperature
A trend of decreasing precipitation over the study period was observed from the Mann–Kendall test (Figure 11a). In contrast, the trend for NDVI (Figure 11b), air temperature (Figure 11c), and soil surface temperature (Figure 11d) showed an increase over time.
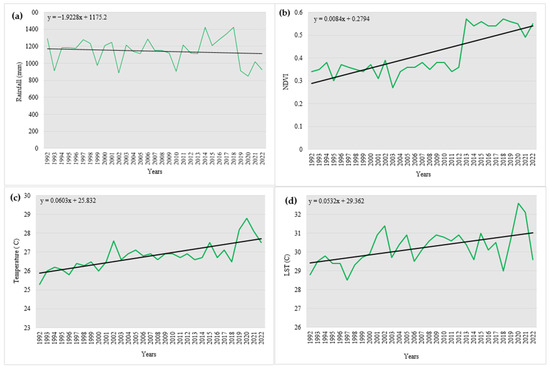
Figure 11.
Trends in interannual variability of (a) precipitation (mm), (b) NDVI, (c) air temperature, and (d) land surface temperature in the Brazilian Pantanal (1992–2022).
The analysis confirmed a significant decreasing trend in precipitation over the 30-year time series, which is in agreement with other studies. On the other hand, the variations in NDVI, air temperature, and LST show a tendency to increase over time. The increase in NDVI values can be associated with an assumed intensification of agricultural practices, mainly in the replacement of natural vegetation areas by pastures [102]. In addition, rising temperatures, both atmospheric and surface, indicate an ongoing warming process in the Brazilian Pantanal [103]. This warming, coupled with a decrease in precipitation, indicates changes in the region’s hydric balance, with serious implications for aquatic ecosystems and the biome’s biodiversity [104]. These trends reinforce the need for mitigation policies that address both the conservation of its natural ecosystems as well as the sustainable management of water resources.
These results of increased temperature and decreased precipitation are consistent with other studies conducted in the Pantanal. The study by Silva et al. [105] used the Eta ensemble (Eta-HadGEM2-ES) and CORDEX ensemble regional climate models to project climate change in the Pantanal. The trend indicated a significant decrease in precipitation, with more intense and frequent droughts, especially under the RCP8.5 scenario, which predicts extreme droughts concentrated in the 2090s. As for temperature, it showed an average increase of 5 °C to 7 °C by the end of the century, with greater evapotranspiration, which could further aggravate the impact of droughts and increase the risk of forest fires in the region. The study by Marengo et al. [106], using the Eta-HadGEM2-ES (Hadley Centre Global Environment Model version 2—Earth System) model for the period 2071 to 2100, indicated a trend toward an average annual temperature increase of 5 to 7 °C and a reduction in precipitation of up to 30% by the end of the 21st century. These climate changes have the potential to significantly impact the region’s ecosystems and water resources.
Estimates of rising temperatures and reduced precipitation point to a future with more extreme events, such as prolonged droughts and more severe water deficits. These climate changes threaten not only regional biodiversity, but also the sustainability of water resources. This calls for urgent action to mitigate and implement sustainable management of the affected areas.
Concerning precipitation, an increase was observed in some zones in the north and south of the Brazilian Pantanal, while the eastern border had decreased over the years (Figure 12). NDVI values showed an increasing trend in most of the study area, indicating a possible improvement in vegetation, except in some zones in the east and west. LST had revealed a probable increase in surface temperature in several areas, more pronounced in some central regions and a decreasing tendency in other zones. For air temperature, there was an increase in the eastern boundary of the region, while the northern and western zones had decreasing temperatures over the time series.
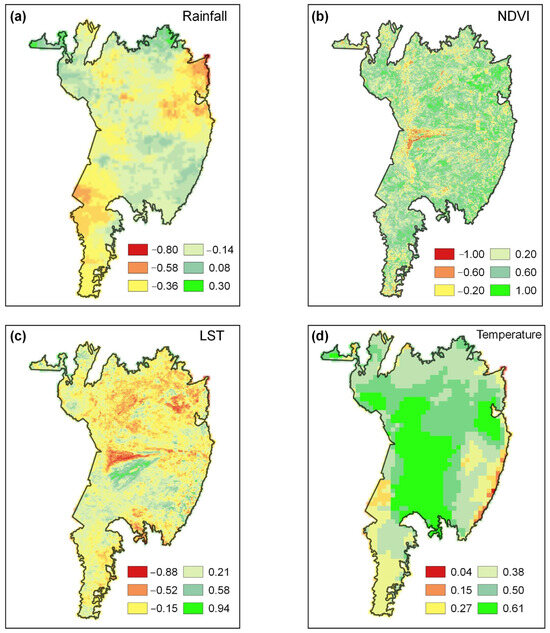
Figure 12.
Spatial trends in (a) precipitation (mm), (b) NDVI, (c) land surface temperature, and (d) air temperature in the Brazilian Pantanal.
Analysis of environmental patterns in the Brazilian Pantanal revealed complex interaction among changes in vegetation, precipitation, and air and surface temperatures. The NDVI showed a general increasing trend, except at the eastern and western borders, indicating degradation processes of the natural vegetation, probably due to agricultural expansion and changes in the water regime [107]. This trend is consistent with studies reporting the impact of anthropic activities on climate and environmental variability [108], albeit in different regions. The increase in TST in the central zones of the Pantanal, also observed by Miranda [109], increases the vulnerability of these areas to global warming, which significantly affects the ecological and hydrological cycles. Moreover, the decrease in precipitation, especially at the eastern boundary, confirms the work of Broquet et al. [110], which emphasizes the role of the vegetation cover in regulating the regional climate.
In summary, the results indicate an increasing vulnerability of the Brazilian Pantanal to climate change and human activities. The Mann–Kendall trend analysis reinforces the need for continuous monitoring, since the variations in precipitation and temperature have a direct impact on the integrity of the Pantanal ecosystem. Thus, sustainable management and mitigation strategies are essential to improve the resilience of this natural region to future challenges.
This need for continuous monitoring is also reflected in the innovative contributions of this study compared to previous work. While the analysis of the Pantanal’s vulnerability usually focuses on isolated aspects, such as the impacts of agricultural expansion or climate change, this study offers an integrated approach. By using indices such as NDVI, MNDWI, and NDMI in conjunction with precipitation data, and by analyzing a comprehensive time series (1992 to 2022) with Landsat imagery, it was possible to identify spatial and temporal patterns of transformation that go beyond conventional approaches. This integration allows a more detailed examination of the interaction between wetland and forest loss and the ecological dynamics of the Pantanal, providing a broader view of the cumulative effects of multiple factors on the biome over time.
4. Conclusions
As indicated by the MNDWI and NDMI indices, changes in land use in the Pantanal show that agricultural practices and pastures have replaced natural areas, resulting in a significant reduction in wetlands. These changes highlight the urgent need for practical and integrated strategies for sustainable management of the biome.
Mitigating the observed impacts requires the implementation of conservation agriculture practices, such as the use of agroforestry systems, no-till farming, and crop rotation, combined with the restoration of degraded areas. Proper management of water resources should include measures such as control of dams and canals to maintain natural flood cycles that are essential for local biodiversity.
In addition, it is essential to strengthen environmental governance through greater integration of regulatory agencies, implementation of effective public policies, and rigorous enforcement of management practices. Major obstacles include a lack of technical and financial resources and resistance from the business sector.
As a sustainable economic alternative, the promotion of ecotourism can play a crucial role. Promoting activities such as wildlife watching, community-based tourism, and environmental education can generate income for local communities and reduce pressure on natural resources. These initiatives need to be accompanied by training and logistical support to ensure their viability and alignment with conservation principles.
Supplementary Materials
The following supporting information can be downloaded at https://www.mdpi.com/article/10.3390/su17010051/s1, Table S1: Thermal constant. References [50,56,57,58,59,60,61,62,63] are cited in Supplementary Materials.
Author Contributions
Conceptualization, S.T.P.J. and D.S.; methodology, S.T.P.J. and D.S.; validation, I.A.G. and R.B.S.; formal analysis, R.B.S. and R.B.G.d.S.; investigation, I.A.G.; resources, I.A.G.; data curation, S.T.P.J., R.B.S. and D.S.; writing—original draft preparation, S.T.P.J., R.B.S., I.A.G. and D.S.; writing—review and editing, S.T.P.J., R.B.S., R.B.G.d.S. and D.S.; visualization, D.S. and R.B.G.d.S.; supervision, I.A.G. and D.S.; project administration, D.S. All authors have read and agreed to the published version of the manuscript.
Funding
This research received no external funding.
Institutional Review Board Statement
Not applicable.
Informed Consent Statement
Not applicable.
Data Availability Statement
All the data are provided in the main manuscript. Contact the corresponding author if further explanation is required.
Acknowledgments
Coordenação de Aperfeiçoamento de Pessoal de Nível Superior—Brasil (CAPES)—Finance Code 001.
Conflicts of Interest
The authors declare no conflicts of interest.
References
- Pereira, O.J.R.; Merino, E.R.; Montes, C.R.; Barbiero, L.; Rezende-Filho, A.T.; Lucas, Y.; Melfi, A.J. Estimating Water PH Using Cloud-Based Landsat Images for a New Classification of the Nhecolândia Lakes (Brazilian Pantanal). Remote Sens. 2020, 12, 1090. [Google Scholar] [CrossRef]
- Zeilhofer, P.; de Moura, R.M. Hydrological Changes in the Northern Pantanal Caused by the Manso Dam: Impact Analysis and Suggestions for Mitigation. Ecol. Eng. 2009, 35, 105–117. [Google Scholar] [CrossRef]
- Louzada, R.O.; Bergier, I.; Assine, M.L. Landscape Changes in Avulsive River Systems: Case Study of Taquari River on Brazilian Pantanal Wetlands. Sci. Total Environ. 2020, 723, 138067. [Google Scholar] [CrossRef] [PubMed]
- Vicente, E.C.; Guedes, N.M.R. Organophosphate Poisoning of Hyacinth Macaws in the Southern Pantanal, Brazil. Sci. Rep. 2021, 11, 5602. [Google Scholar] [CrossRef]
- Guerra, A.; Roque, F.d.O.; Garcia, L.C.; Ochoa-Quintero, J.M.; de Oliveira, P.T.S.; Guariento, R.D.; Rosa, I.M. Drivers and Projections of Vegetation Loss in the Pantanal and Surrounding Ecosystems. Land Use Policy 2020, 91, 104388. [Google Scholar] [CrossRef]
- Nunes da Cunha, C.; Bergier, I.; Tomas, W.M.; Damasceno-Junior, G.A.; Santos, S.A.; Assunção, V.A.; Sartori, Â.L.B.; Pott, A.; de Arruda, E.C.; da Silva Garcia, A.; et al. Hydrology and Vegetation Base for Classification of Macrohabitats of the Brazilian Pantanal for Policy-Making and Management. In Flora and Vegetation of the Pantanal Wetland; Springer International Publishing: Cham, Switzerland, 2021; pp. 365–391. [Google Scholar]
- Tomas, W.M.; de Oliveira Roque, F.; Morato, R.G.; Medici, P.E.; Chiaravalloti, R.M.; Tortato, F.R.; Penha, J.M.F.; Izzo, T.J.; Garcia, L.C.; Lourival, R.F.F.; et al. Sustainability Agenda for the Pantanal Wetland: Perspectives on a Collaborative Interface for Science, Policy, and Decision-Making. Trop. Conserv. Sci. 2019, 12. [Google Scholar] [CrossRef]
- Ivory, S.J.; McGlue, M.M.; Spera, S.; Silva, A.; Bergier, I. Vegetation, Rainfall, and Pulsing Hydrology in the Pantanal, the World’s Largest Tropical Wetland. Environ. Res. Lett. 2019, 14, 124017. [Google Scholar] [CrossRef]
- Silva, P.S.; Rodrigues, J.A.; Nogueira, J.; Moura, L.C.; Enout, A.; Cuiabália, C.; DaCamara, C.C.; Pereira, A.A.; Libonati, R. Joining Forces to Fight Wildfires: Science and Management in a Protected Area of Pantanal, Brazil. Environ. Sci. Policy 2024, 159, 103818. [Google Scholar] [CrossRef]
- Pott, A.; Pott, V.J. Flora of the Pantanal. In Flora and Vegetation of the Pantanal Wetland; Springer International Publishing: Cham, Switzerland, 2021; pp. 39–228. [Google Scholar]
- Nunes, A.P.; Posso, S.R.; da Frota, A.V.B.; Vitorino, B.D.; Laps, R.R.; Donatelli, R.J.; Straube, F.C.; Pivatto, M.A.C.; de Oliveira, D.M.M.; Carlos, B.; et al. Birds of the Pantanal Floodplains, Brazil: Historical Data, Diversity, and Conservation. Pap. Avulsos Zool. 2021, 61, e20216182. [Google Scholar] [CrossRef]
- Gimênes Junior, H.; Rech, R. Guia Ilustrado dos Peixes do Pantanal e Entorno; Julien Design: Campo Grande, Brazil, 2022. [Google Scholar]
- Schulz, C.; Whitney, B.S.; Rossetto, O.C.; Neves, D.M.; Crabb, L.; de Oliveira, E.C.; Terra Lima, P.L.; Afzal, M.; Laing, A.F.; de Souza Fernandes, L.C.; et al. Physical, Ecological and Human Dimensions of Environmental Change in Brazil’s Pantanal Wetland: Synthesis and Research Agenda. Sci. Total Environ. 2019, 687, 1011–1027. [Google Scholar] [CrossRef] [PubMed]
- Lázaro, W.L.; Oliveira-Júnior, E.S.; da Silva, C.J.; Castrillon, S.K.I.; Muniz, C.C. Climate Change Reflected in One of the Largest Wetlands in the World: An Overview of the Northern Pantanal Water Regime. Acta Limnol. Bras. 2020, 32, e104. [Google Scholar] [CrossRef]
- Bergier, I.; Assine, M.L.; McGlue, M.M.; Alho, C.J.R.; Silva, A.; Guerreiro, R.L.; Carvalho, J.C. Amazon Rainforest Modulation of Water Security in the Pantanal Wetland. Sci. Total Environ. 2018, 619–620, 1116–1125. [Google Scholar] [CrossRef] [PubMed]
- Chiaravalloti, R.M.; Tomas, W.M.; Akre, T.; Morato, R.G.; Camilo, A.R.; Giordano, A.J.; Leimgruber, P. Achieving Conservation through Cattle Ranching: The Case of the Brazilian Pantanal. Conserv. Sci. Pract. 2023. early view. [Google Scholar] [CrossRef]
- Colman, C.; Oliveira, P.; Almagro, A.; Soares-Filho, B.; Rodrigues, D. Effects of Climate and Land-Cover Changes on Soil Erosion in Brazilian Pantanal. Sustainability 2019, 11, 7053. [Google Scholar] [CrossRef]
- de Freitas, D.A.F.; Silva, M.L.N.; Cardoso, E.L.; Oliveira, D.M.d.S.; Moitinho, M.R.; Curi, N. Carbon and Nitrogen Stocks in Soil under Native Pastures in the Pantanal Wetland Biome, Brazil. Agronomy 2024, 14, 1994. [Google Scholar] [CrossRef]
- Valente, F.; Laurini, M. The Dynamics of Fire Activity in the Brazilian Pantanal: A Log-Gaussian Cox Process-Based Structural Decomposition. Fire 2024, 7, 170. [Google Scholar] [CrossRef]
- Shimabukuro, Y.E.; de Oliveira, G.; Pereira, G.; Arai, E.; Cardozo, F.; Dutra, A.C.; Mataveli, G. Assessment of Burned Areas during the Pantanal Fire Crisis in 2020 Using Sentinel-2 Images. Fire 2023, 6, 277. [Google Scholar] [CrossRef]
- Chiaravalloti, R.M.; Homewood, K.; Erikson, K. Sustainability and Land Tenure: Who Owns the Floodplain in the Pantanal, Brazil? Land Use Policy 2017, 64, 511–524. [Google Scholar] [CrossRef]
- Marques, J.F.; Alves, M.B.; Silveira, C.F.; Amaral e Silva, A.; Silva, T.A.; dos Santos, V.J.; Calijuri, M.L. Fires Dynamics in the Pantanal: Impacts of Anthropogenic Activities and Climate Change. J. Environ. Manag. 2021, 299, 113586. [Google Scholar] [CrossRef] [PubMed]
- Ioris, A.A.R. Development and Conservation Frontiers in the Pantanal Wetland. In Frontier Making in the Amazon; Springer: Cham, Switzerland, 2020; pp. 179–201. [Google Scholar]
- Marengo, J.A.; Cunha, A.P.; Cuartas, L.A.; Deusdará Leal, K.R.; Broedel, E.; Seluchi, M.E.; Michelin, C.M.; De Praga Baião, C.F.; Chuchón Angulo, E.; Almeida, E.K.; et al. Extreme Drought in the Brazilian Pantanal in 2019–2020: Characterization, Causes, and Impacts. Front. Water 2021, 3, 639204. [Google Scholar] [CrossRef]
- Baker, C.; Lawrence, R.; Montagne, C.; Patten, D. Mapping Wetlands and Riparian Areas Using Landsat ETM+ Imagery and Decision-Tree-Based Models. Wetlands 2006, 26, 465–474. [Google Scholar] [CrossRef]
- Mahdavi, S.; Salehi, B.; Granger, J.; Amani, M.; Brisco, B.; Huang, W. Remote Sensing for Wetland Classification: A Comprehensive Review. GISci Remote Sens. 2018, 55, 623–658. [Google Scholar] [CrossRef]
- Gallant, A. The Challenges of Remote Monitoring of Wetlands. Remote Sens. 2015, 7, 10938–10950. [Google Scholar] [CrossRef]
- Tien Bui, D.; Van Le, H.; Hoang, N.-D. GIS-Based Spatial Prediction of Tropical Forest Fire Danger Using a New Hybrid Machine Learning Method. Ecol. Inform. 2018, 48, 104–116. [Google Scholar] [CrossRef]
- Leite, M.V.M.; Bobuľská, L.; Espíndola, S.P.; Campos, M.R.C.; Azevedo, L.C.B.; Ferreira, A.S. Modeling of Soil Phosphatase Activity in Land Use Ecosystems and Topsoil Layers in the Brazilian Cerrado. Ecol. Model. 2018, 385, 182–188. [Google Scholar] [CrossRef]
- Teodoro, A.C.; Duarte, L. Forest Fire Risk Maps: A GIS Open Source Application—A Case Study in Norwest of Portugal. Int. J. Geogr. Inf. Sci. 2013, 27, 699–720. [Google Scholar] [CrossRef]
- Chuvieco, E.; Aguado, I.; Yebra, M.; Nieto, H.; Salas, J.; Martín, M.P.; Vilar, L.; Martínez, J.; Martín, S.; Ibarra, P.; et al. Development of a Framework for Fire Risk Assessment Using Remote Sensing and Geographic Information System Technologies. Ecol. Model. 2010, 221, 46–58. [Google Scholar] [CrossRef]
- Silva, J.L.B.; Moura, G.B.A.; Silva, Ê.F.F.; Lopes, P.M.O.; Silva, T.T.F.; Lins, F.A.C.; Silva, D.A.O.; Ortiz, P.F.S. Spatial-Temporal Dynamics of the Caatinga Vegetation Cover by Remote Sensing in Municipality of the Brazilian Semi-Arid. Rev. Bras. Ciênc. Agrár.—Braz. J. Agric. Sci. 2019, 14, 1–10. [Google Scholar] [CrossRef]
- da Silva, M.V.; Pandorfi, H.; de Almeida, G.L.P.; de Lima, R.P.; dos Santos, A.; Jardim, A.M.d.R.F.; Rolim, M.M.; da Silva, J.L.B.; Batista, P.H.D.; da Silva, R.A.B.; et al. Spatio-Temporal Monitoring of Soil and Plant Indicators under Forage Cactus Cultivation by Geoprocessing in Brazilian Semi-Arid Region. J. S. Am. Earth Sci. 2021, 107, 103155. [Google Scholar] [CrossRef]
- Batista, P.H.D.; de Almeida, G.L.P.; da Silva, J.L.B.; Lins, F.A.C.; da Silva, M.V.; Cordeiro Junior, J.J.F. Hydro-Physical Properties of Soil and Pasture Vegetation Coverage under Animal Trampling. Rev. Bras. Eng. Agrícola Ambient. 2020, 24, 854–860. [Google Scholar] [CrossRef]
- dos Santos, A.; Lopes, P.M.O.; da Silva, M.V.; Jardim, A.M.d.R.F.; Moura, G.B.d.A.; Fernandes, G.S.T.; Silva, D.A.d.O.; da Silva, J.L.B.; Rodrigues, J.A.d.M.; Silva, E.A.; et al. Causes and Consequences of Seasonal Changes in the Water Flow of the São Francisco River in the Semiarid of Brazil. Environ. Sustain. Indic. 2020, 8, 100084. [Google Scholar] [CrossRef]
- Xavier, S.F.A.; da Silva Jale, J.; Stosic, T.; dos Santos, C.A.C.; Singh, V.P. An Application of Sample Entropy to Precipitation in Paraíba State, Brazil. Theor. Appl. Climatol. 2019, 136, 429–440. [Google Scholar] [CrossRef]
- Costa, R.L.; Macedo de Mello Baptista, G.; Gomes, H.B.; Daniel dos Santos Silva, F.; Lins da Rocha Júnior, R.; de Araújo Salvador, M.; Herdies, D.L. Analysis of Climate Extremes Indices over Northeast Brazil from 1961 to 2014. Weather Cli. Extremes 2020, 28, 100254. [Google Scholar] [CrossRef]
- Mutti, P.R.; de Abreu, L.P.; Andrade, L.d.M.B.; Spyrides, M.H.C.; Lima, K.C.; de Oliveira, C.P.; Dubreuil, V.; Bezerra, B.G. A Detailed Framework for the Characterization of Rainfall Climatology in Semiarid Watersheds. Theor. Appl. Climatol. 2020, 139, 109–125. [Google Scholar] [CrossRef]
- Bezerra, A.C.; da Costa, S.A.T.; da Silva, J.L.B.; Araújo, A.M.Q.; Moura, G.B.d.A.; Lopes, P.M.O.; Nascimento, C.R. Annual Rainfall in Pernambuco, Brazil: Regionalities, Regimes, and Time Trends. Rev. Bras. De Meteorol. 2021, 36, 403–414. [Google Scholar] [CrossRef]
- Maria, B.; Soriano, A.; Luis, E.; Walfrido, C.; Tomás, M.; Aparecida, S.; Sandra, S.; Araújo, M.; Luiz, C.; Pellegrin, A. Uso do Fogo Para o Manejo da Vegetação no Pantanal; Embrapa Pantanal: Corumbá, Brazil, 2020. [Google Scholar]
- de Oliveira-Júnior, J.F.; Teodoro, P.E.; Junior, C.A.d.S.; Baio, F.H.R.; Gava, R.; Capristo-Silva, G.F.; de Gois, G.; Filho, W.L.F.C.; Lima, M.; Santiago, D.d.B.; et al. Fire Foci Related to Rainfall and Biomes of the State of Mato Grosso Do Sul, Brazil. Agric. For. Meteorol. 2020, 282–283, 107861. [Google Scholar] [CrossRef]
- Alvares, C.A.; Stape, J.L.; Sentelhas, P.C.; de Moraes Gonçalves, J.L.; Sparovek, G. Köppen’s Climate Classification Map for Brazil. Meteorol. Z. 2013, 22, 711–728. [Google Scholar] [CrossRef] [PubMed]
- de Macedo, H.A.; Stevaux, J.C.; Bergier, I.; Silva, A. Balanço Hídrico Da Bacia Do Alto Paraguai Por Meio De Dados Trmm E Mod16a2. In Pantanal: O Espaço Geográfi co e as Tecnologias em Análise; de Oliveira, A.C., Ed.; Atena Editora: Ponta Grossa, Brazil, 2019; pp. 59–70. [Google Scholar]
- MapBiomas Project. Collection 9 of the Annual Land Cover and Land Use Maps of Brazil (1985–2023). Available online: https://data.mapbiomas.org/dataset.xhtml?persistentId=doi:10.58053/MapBiomas/XXUKA8 (accessed on 15 December 2024).
- Huete, A.R. A Soil-Adjusted Vegetation Index (SAVI). Remote Sens. Environ. 1988, 25, 295–309. [Google Scholar] [CrossRef]
- Huete, A.; Didan, K.; Miura, T.; Rodriguez, E.P.; Gao, X.; Ferreira, L.G. Overview of the Radiometric and Biophysical Performance of the MODIS Vegetation Indices. Remote Sens. Environ. 2002, 83, 195–213. [Google Scholar] [CrossRef]
- Gorelick, N.; Hancher, M.; Dixon, M.; Ilyushchenko, S.; Thau, D.; Moore, R. Google Earth Engine: Planetary-Scale Geospatial Analysis for Everyone. Remote Sens. Environ. 2017, 202, 18–27. [Google Scholar] [CrossRef]
- Amani, M.; Ghorbanian, A.; Ahmadi, S.A.; Kakooei, M.; Moghimi, A.; Mirmazloumi, S.M.; Moghaddam, S.H.A.; Mahdavi, S.; Ghahremanloo, M.; Parsian, S.; et al. Google Earth Engine Cloud Computing Platform for Remote Sensing Big Data Applications: A Comprehensive Review. IEEE J. Sel. Top. Appl. Earth Obs. Remote Sens. 2020, 13, 5326–5350. [Google Scholar] [CrossRef]
- Allen, R.G.; Tasumi, M.; Trezza, R.; Bastiaanssen, W.G.M. SEBAL (Surface Energy Balance Algorithms for Land) Advance Training and User’s Manual–Idaho Implementation; Idaho University: Moscow, ID, USA, 2002. [Google Scholar]
- Carlson, T.N.; Ripley, D.A. On the Relation between NDVI, Fractional Vegetation Cover, and Leaf Area Index. Remote Sens. Environ. 1997, 62, 241–252. [Google Scholar] [CrossRef]
- Xu, H. Modification of Normalised Difference Water Index (NDWI) to Enhance Open Water Features in Remotely Sensed Imagery. Int. J. Remote Sens. 2006, 27, 3025–3033. [Google Scholar] [CrossRef]
- Sun, F.; Sun, W.; Chen, J.; Gong, P. Comparison and Improvement of Methods for Identifying Waterbodies in Remotely Sensed Imagery. Int. J. Remote Sens. 2012, 33, 6854–6875. [Google Scholar] [CrossRef]
- Gao, B. NDWI—A Normalized Difference Water Index for Remote Sensing of Vegetation Liquid Water from Space. Remote Sens. Environ. 1996, 58, 257–266. [Google Scholar] [CrossRef]
- Du, Y.; Zhang, Y.; Ling, F.; Wang, Q.; Li, W.; Li, X. Water Bodies’ Mapping from Sentinel-2 Imagery with Modified Normalized Difference Water Index at 10-m Spatial Resolution Produced by Sharpening the SWIR Band. Remote Sens. 2016, 8, 354. [Google Scholar] [CrossRef]
- Mikhaylov, A.; Moiseev, N.; Aleshin, K.; Burkhardt, T. Global Climate Change and Greenhouse Effect. Entrep. Sustain. Issues 2020, 7, 2897–2913. [Google Scholar] [CrossRef]
- Chatterjee, R.S.; Singh, N.; Thapa, S.; Sharma, D.; Kumar, D. Retrieval of Land Surface Temperature (LST) from Landsat TM6 and TIRS Data by Single Channel Radiative Transfer Algorithm Using Satellite and Ground-Based Inputs. Int. J. Appl. Earth Obs. Geoinf. 2017, 58, 264–277. [Google Scholar] [CrossRef]
- Chander, G.; Markham, B. Revised Landsat-5 Tm Radiometric Calibration Procedures and Postcalibration Dynamic Ranges. IEEE Trans. Geosci. Remote Sens. 2003, 41, 2674–2677. [Google Scholar] [CrossRef]
- Landsat Project Science Office. Landsat 7 Science Data User’s Handbook; NASA: Washington, DC, USA, 2000.
- Zanter, K. Landsat 8(L8) Data Users Handbook; Landsat Science Official Website; U.S. Geological Survey: Sioux Falls, SD, USA, 2016.
- Latif, M.S. Land Surface Temperature Retrieval of Landsat-8 Data Using Split Window Algorithm-A Case Study of Ranchi District. Int. J. Eng. Dev. Res. 2014, 2, 2840–3849. [Google Scholar]
- Rhinane, H.; Hilali, A.; Bahi, H.; Berrada, A. Contribution of Landsat TM Data for the Detection Of Urban Heat Islands Areas Case of Casablanca. J. Geogr. Inf. Syst. 2012, 4, 20–26. [Google Scholar] [CrossRef]
- Bendib, A.; Dridi, H.; Kalla, M.I. Contribution of Landsat 8 Data for the Estimation of Land Surface Temperature in Batna City, Eastern Algeria. Geocarto Int. 2017, 32, 503–513. [Google Scholar] [CrossRef]
- Mahato, S.; Pal, S. Changing Land Surface Temperature of a Rural Rarh Tract River Basin of India. Remote Sens. Appl. 2018, 10, 209–223. [Google Scholar] [CrossRef]
- Funk, C.; Peterson, P.; Landsfeld, M.; Pedreros, D.; Verdin, J.; Shukla, S.; Michaelsen, J. The Climate Hazards Infrared Precipitation with Stations—A New Environmental Record for Monitoring Extremes. Sci. Data 2015, 2, 150066. [Google Scholar] [CrossRef] [PubMed]
- Kim, H.; Wigneron, J.-P.; Kumar, S.; Dong, J.; Wagner, W.; Cosh, M.H.; Bosch, D.D.; Collins, C.H.; Starks, P.J.; Seyfried, M.; et al. Global Scale Error Assessments of Soil Moisture Estimates from Microwave-Based Active and Passive Satellites and Land Surface Models over Forest and Mixed Irrigated/Dryland Agriculture Regions. Remote Sens. Environ. 2020, 251, 112052. [Google Scholar] [CrossRef]
- Wulder, M.A.; Masek, J.G.; Cohen, W.B.; Loveland, T.R.; Woodcock, C.E. Opening the Archive: How Free Data Has Enabled the Science and Monitoring Promise of Landsat. Remote Sens. Environ. 2012, 122, 2–10. [Google Scholar] [CrossRef]
- Sobrino, J.A.; Jiménez-Muñoz, J.C.; Paolini, L. Land Surface Temperature Retrieval from LANDSAT TM 5. Remote Sens. Environ. 2004, 90, 434–440. [Google Scholar] [CrossRef]
- Sayyad, R.; Dakhore, K.; Phad, S. Analysis of Rainfall Trend of Parbhani, Maharshtra Using Mann–Kendall Test. J. Agrometeorol. 2021, 21, 239–240. [Google Scholar] [CrossRef]
- R Development Core Team. R: A Language and Environment for Statistical Computing; R Foundation for Computing Statistical: Vienna, Austria, 2022. [Google Scholar]
- Teodoro, P.E.; Maria, L.d.S.; Rodrigues, J.M.A.; Silva, A.d.A.e.; da Silva, M.C.M.; de Souza, S.S.; Rossi, F.S.; Teodoro, L.P.R.; Della-Silva, J.L.; Delgado, R.C.; et al. Wildfire Incidence throughout the Brazilian Pantanal Is Driven by Local Climate Rather Than Bovine Stocking Density. Sustainability 2022, 14, 10187. [Google Scholar] [CrossRef]
- Alho, C.J.R.; Mamede, S.B.; Benites, M.; Andrade, B.S.; Sepúlveda, J.J.O. Threats to the Biodiversity of the Brazilian Pantanal due to Land Use and Occupation. Ambiente Soc. 2019, 22, e01891. [Google Scholar] [CrossRef]
- Peluso, L.M.; Mateus, L.; Penha, J.; Bailly, D.; Cassemiro, F.; Suárez, Y.; Fantin-Cruz, I.; Kashiwaqui, E.; Lemes, P. Climate Change Negative Effects on the Neotropical Fishery Resources May Be Exacerbated by Hydroelectric Dams. Sci. Total Environ. 2022, 828, 154485. [Google Scholar] [CrossRef] [PubMed]
- Renöfält, B.M.; Jansson, R.; Nilsson, C. Effects of Hydropower Generation and Opportunities for Environmental Flow Management in Swedish Riverine Ecosystems. Freshw. Biol. 2010, 55, 49–67. [Google Scholar] [CrossRef]
- Grill, G.; Lehner, B.; Lumsdon, A.E.; MacDonald, G.K.; Zarfl, C.; Reidy Liermann, C. An Index-Based Framework for Assessing Patterns and Trends in River Fragmentation and Flow Regulation by Global Dams at Multiple Scales. Environ. Res. Lett. 2015, 10, 015001. [Google Scholar] [CrossRef]
- Fantin-Cruz, I.; Pedrollo, O.; Girard, P.; Zeilhofer, P.; Hamilton, S.K. Effects of a Diversion Hydropower Facility on the Hydrological Regime of the Correntes River, a Tributary to the Pantanal Floodplain, Brazil. J. Hydrol. 2015, 531, 810–820. [Google Scholar] [CrossRef]
- Junk, W.J.; Cunha, C.N. Pantanal: A large South American wetland at a crossroads. Ecol. Eng. 2005, 24, 391–401. [Google Scholar] [CrossRef]
- Abreu, R.C.R.; Hoffmann, W.A.; Vasconcelos, H.L.; Pilon, N.A.; Rossatto, D.R.; Durigan, G. The Biodiversity Cost of Carbon Sequestration in Tropical Savanna. Sci. Adv. 2017, 3, e1701284. [Google Scholar] [CrossRef]
- Dias, L.C.P.; Pimenta, F.M.; Santos, A.B.; Costa, M.H.; Ladle, R.J. Patterns of Land Use, Extensification, and Intensification of Brazilian Agriculture. Glob. Chang. Biol. 2016, 22, 2887–2903. [Google Scholar] [CrossRef]
- Camargo, F.A.O.; Silva, L.S.; Merten, G.H.; Carlos, F.S.; Baveye, P.C.; Triplett, E.W. Brazilian Agriculture in Perspective: Great expectations vs. reality. Adv. Agron. 2017, 141, 53–114. [Google Scholar]
- Caballero, C.B.; Biggs, T.W.; Vergopolan, N.; West, T.A.P.; Ruhoff, A. Transformation of Brazil’s Biomes: The Dynamics and Fate of Agriculture and Pasture Expansion into Native Vegetation. Sci. Total Environ. 2023, 896, 166323. [Google Scholar] [CrossRef] [PubMed]
- Arvor, D.; Meirelles, M.; Dubreuil, V.; Bégué, A.; Shimabukuro, Y.E. Analyzing the Agricultural Transition in Mato Grosso, Brazil, Using Satellite-Derived Indices. Appl. Geogr. 2012, 32, 702–713. [Google Scholar] [CrossRef]
- Carvalho, W.d.S.; Filho, F.J.C.M.; Rodrigues, L.R.; Calheiros, C.S.C. Influence of Land Use and Land Cover on the Quality of Surface Waters and Natural Wetlands in the Miranda River Watershed, Brazilian Pantanal. Appl. Sci. 2024, 14, 5666. [Google Scholar] [CrossRef]
- Miranda, C.S.; Gamarra, R.M.; Mioto, C.L.; Silva, N.M.; Conceição Filho, A.P.; Pott, A. Analysis of the Landscape Complexity and Heterogeneity of the Pantanal Wetland. Braz. J. Biol. 2017, 78, 318–327. [Google Scholar] [CrossRef] [PubMed]
- Ikeda-Castrillon, S.K.; Oliveira-Junior, E.S.; Rossetto, O.C.; Saito, C.H.; Wantzen, K.M. The Pantanal: A Seasonal Neotropical Wetland Under Threat. In The Palgrave Handbook of Global Sustainability; Springer International Publishing: Cham, Switzerland, 2022; pp. 1–27. [Google Scholar]
- Peres, P.N.; Mioto, C.L.; Marcato Junior, J.; Paranhos Filho, A.C. Variation of the Pantanal’s Landcover from 2000 to 2015 by Remote Sensing with Free Software and Data. Anu. Inst. Geociênc.—UFRJ 2016, 39, 116. [Google Scholar] [CrossRef]
- Miranda, C.d.S.; Paranho Filho, A.C.; Pott, A. Changes in Vegetation Cover of the Pantanal Wetland Detected by Vegetation Index: A Strategy for Conservation. Biota Neotrop. 2018, 18, e20160297. [Google Scholar] [CrossRef]
- Li, X.; Song, K.; Liu, G. Wetland Fire Scar Monitoring and Its Response to Changes of the Pantanal Wetland. Sensors 2020, 20, 4268. [Google Scholar] [CrossRef] [PubMed]
- Marques, M.C.S.; Rodriguez, D.A. Impacts of the Landscape Changes in the Low Streamflows of Pantanal Headwaters—Brazil. Hydrol. Proces. 2022, 36, e14617. [Google Scholar] [CrossRef]
- Camilloni, I.A.; Saurral, R.I.; Montroull, N.B. Hydrological Projections of Fluvial Floods in the Uruguay and Paraná Basins under Different Climate Change Scenarios. Int. J. River Basin Manag. 2013, 11, 389–399. [Google Scholar] [CrossRef]
- Teixeira, A.; Padovani, C.; Andrade, R.; Leivas, J.; Victoria, D.; Galdino, S. Use of MODIS Images to Quantify the Radiation and Energy Balances in the Brazilian Pantanal. Remote Sens. 2015, 7, 14597–14619. [Google Scholar] [CrossRef]
- Galvanin, E.A.; Revollo, N.V.; de la Puente, F.J.; Gil, V.; da Silva Neves, S.M.; Zapperi, P. Monitoring and Mapping of the Brazilian Pantanal Wetland. In Vegetation Index and Dynamics—Methodologies for Teaching Plant Diversity and Conservation Status; IntechOpen: London, UK, 2023. [Google Scholar]
- Schwerdtfeger, J.; Da Silveira, S.; Zeilhofer, P.; Weiler, M. Coupled Ground- and Space-Based Assessment of Regional Inundation Dynamics to Assess Impact of Local and Upstream Changes on Evaporation in Tropical Wetlands. Remote Sens. 2015, 7, 9769–9795. [Google Scholar] [CrossRef]
- Muster, S.; Langer, M.; Abnizova, A.; Young, K.L.; Boike, J. Spatio-Temporal Sensitivity of MODIS Land Surface Temperature Anomalies Indicates High Potential for Large-Scale Land Cover Change Detection in Arctic Permafrost Landscapes. Remote Sens. Environ. 2015, 168, 1–12. [Google Scholar] [CrossRef]
- Libonati, R.; Geirinhas, J.L.; Silva, P.S.; Russo, A.; Rodrigues, J.A.; Belém, L.B.C.; Nogueira, J.; Roque, F.O.; DaCamara, C.C.; Nunes, A.M.B.; et al. Assessing the Role of Compound Drought and Heatwave Events on Unprecedented 2020 Wildfires in the Pantanal. Environ. Res. Lett. 2022, 17, 015005. [Google Scholar] [CrossRef]
- Kanianska, R. Agriculture and Its Impact on Land-Use, Environment, and Ecosystem Services. In Landscape Ecology—The Influences of Land Use and Anthropogenic Impacts of Landscape Creation; InTech: London, UK, 2016. [Google Scholar]
- Gomes, G.D.; Nunes, A.M.B.; Libonati, R.; Ambrizzi, T. Projections of Subcontinental Changes in Seasonal Precipitation over the Two Major River Basins in South America under an Extreme Climate Scenario. Clim. Dyn. 2022, 58, 1147–1169. [Google Scholar] [CrossRef]
- Spera, S.A.; Galford, G.L.; Coe, M.T.; Macedo, M.N.; Mustard, J.F. Land-use Change Affects Water Recycling in Brazil’s Last Agricultural Frontier. Glob. Chang. Biol. 2016, 22, 3405–3413. [Google Scholar] [CrossRef] [PubMed]
- Braga, A.; Laurini, M. Spatial Heterogeneity in Climate Change Effects across Brazilian Biomes. Sci. Rep. 2024, 14, 16414. [Google Scholar] [CrossRef] [PubMed]
- Amaral e Silva, A.; Braga, M.Q.; Ferreira, J.; Juste dos Santos, V.; do Carmo Alves, S.; de Oliveira, J.C.; Calijuri, M.L. Anthropic Activities and the Legal Amazon: Estimative of Impacts on Forest and Regional Climate for 2030. Remote Sens Appl 2020, 18, 100304. [Google Scholar] [CrossRef]
- Nobre, C.A.; Sampaio, G.; Borma, L.S.; Castilla-Rubio, J.C.; Silva, J.S.; Cardoso, M. Land-Use and Climate Change Risks in the Amazon and the Need of a Novel Sustainable Development Paradigm. Proc. Natl. Acad. Sci. USA 2016, 113, 10759–10768. [Google Scholar] [CrossRef] [PubMed]
- Alencar, A.A.; Brando, P.M.; Asner, G.P.; Putz, F.E. Landscape Fragmentation, Severe Drought, and the New Amazon Forest Fire Regime. Ecol. Appl. 2015, 25, 1493–1505. [Google Scholar] [CrossRef]
- Tomasella, J.; Cunha, A.P.M.A.; Simões, P.A.; Zeri, M. Assessment of Trends, Variability and Impacts of Droughts across Brazil over the Period 1980–2019. Nat. Hazards 2022, 116, 2173–2190. [Google Scholar] [CrossRef]
- Cunha, A.P.M.A.; Buermann, W.; Marengo, J.A. Changes in Compound Drought-Heat Events over Brazil’s Pantanal Wetland: An Assessment Using Remote Sensing Data and Multiple Drought Indicators. Clim. Dyn. 2024, 62, 739–757. [Google Scholar] [CrossRef]
- Calim Costa, M.; Marengo, J.A.; Alves, L.M.; Cunha, A.P. Multiscale Analysis of Drought, Heatwaves, and Compound Events in the Brazilian Pantanal in 2019–2021. Theor Appl Clim. 2024, 155, 661–677. [Google Scholar] [CrossRef]
- Silva, V.O.; de Mello, C.R.; Chou, S.C.; Guo, L.; Viola, M.R. Characteristics of Extreme Meteorological Droughts over the Brazilian Pantanal throughout the 21st Century. Front. Water 2024, 6, 1385077. [Google Scholar] [CrossRef]
- Marengo, J.; Alves, L.; Torres, R. Regional Climate Change Scenarios in the Brazilian Pantanal Watershed. Clim. Res. 2016, 68, 201–213. [Google Scholar] [CrossRef]
- Abreu, M.C.; Lyra, G.B.; de Oliveira-Júnior, J.F.; Souza, A.; Pobočíková, I.; de Souza Fraga, M.; Abreu, R.C.R. Temporal and Spatial Patterns of Fire Activity in Three Biomes of Brazil. Sci. Total Environ. 2022, 844, 157138. [Google Scholar] [CrossRef] [PubMed]
- Sa’adi, Z.; Shahid, S.; Ismail, T.; Chung, E.-S.; Wang, X.-J. Trends Analysis of Rainfall and Rainfall Extremes in Sarawak, Malaysia Using Modified Mann–Kendall Test. Meteorol. Atmos. Phys. 2019, 131, 263–277. [Google Scholar] [CrossRef]
- Miranda, J.d.R.; da Silva, R.G.; Juvanhol, R.S. Forest Fire Action on Vegetation from the Perspective of Trend Analysis in Future Climate Change Scenarios for a Brazilian Savanna Region. Ecol. Eng. 2022, 175, 106488. [Google Scholar] [CrossRef]
- Broquet, M.; Campos, F.S.; Cabral, P.; David, J. Habitat Quality on the Edge of Anthropogenic Pressures: Predicting the Impact of Land Use Changes in the Brazilian Upper Paraguay River Basin. J. Clean. Prod. 2024, 459, 142546. [Google Scholar] [CrossRef]
Disclaimer/Publisher’s Note: The statements, opinions and data contained in all publications are solely those of the individual author(s) and contributor(s) and not of MDPI and/or the editor(s). MDPI and/or the editor(s) disclaim responsibility for any injury to people or property resulting from any ideas, methods, instructions or products referred to in the content. |
© 2024 by the authors. Licensee MDPI, Basel, Switzerland. This article is an open access article distributed under the terms and conditions of the Creative Commons Attribution (CC BY) license (https://creativecommons.org/licenses/by/4.0/).