Article

Should Charging Stations Provide Service for Plug-In Hybrid Electric Vehicles During Holidays?

1
College of Business Administration, Capital University of Economics and Business, Beijing 100070, China
2
School of Management Engineering, Shandong Jianzhu University, Jinan 250101, China
3
China Unicom Digital Technology Corporation, Ltd., Beijing 100032, China
*
Author to whom correspondence should be addressed.
Sustainability 2025, 17(1), 336; https://doi.org/10.3390/su17010336
Submission received: 30 November 2024 / Revised: 26 December 2024 / Accepted: 26 December 2024 / Published: 4 January 2025
(This article belongs to the Special Issue Sustainable Transportation and Logistics Optimization)

Abstract

:
The development of the new energy vehicle (NEV) market in China has promoted the sustainability of the automotive industry, but has also brought pressures to NEV charging infrastructure. This paper aims to determine the strategic role of charging stations, particularly on whether they should provide service for plug-in hybrid electric vehicles (PHEVs) in the highway service area during peak holidays. Firstly, the charging service resource allocation for a charging station that provides services for both electronic vehicles (EVs) and PHEVs is studied. Secondly, different queueing disciplines are compared. At last, a comparison between scenarios where charging services are limited to EVs and those where services extend to both EVs and PHEVs is conducted. A queueing system considering customer balking and reneging is developed. The impacts of parameters, such as the NEV arrival rate and patience degree of different NEV drivers, on the optimal allocation plan, profit, and comparison results are discussed. The main conclusions are as follows: (1) If the EV arrival rate is greater than the charging service rate, the charging station should not provide charging services for PHEVs. Providing service only for EVs derives more revenues and profits and results in a shorter waiting queue. Conversely, if the total arrival rate of NEVs (including EVs and PHEVs) is lower than the charging service rate, then the charging station should also serve PHEVs. (2) If providing service for PHEVs, a mixed queueing discipline should be applied when the total arrival rate approximates the service rate. When the total NEV arrival rate is significantly lower than the charging service rate, the separate queueing discipline should be adopted. (3) When applying a separate queueing discipline, if a certain type of NEV has a higher arrival rate and the drivers exhibit greater patience, then more charging resources should be allocated to this type of NEV. If the charging service is less busy, the more patient the drivers are, the less service resources should be allocated to them, whereas, during peak times, the more patient the drivers are, the more service resources should be allocated to them.

1. Introduction

Recently, there is an increasing trend in global carbon emissions. According to the International Energy Agency (IEA), global energy-related CO2 emissions increased by 410 million tons (Mt) in 2023, reaching 37.4 billion tons (Gt), up from 36.99 Gt in 2022. The growth rate has decreased from 1.3% in 2022 to 1.1% in 2023. One of the effective means to reduce carbon emissions is the development of new energy vehicles (NEVs). The IEA highlights that global electric car sales reached 14 million units in 2023, marking a 35% increase, significantly influencing the global CO2 emissions trajectory. Without the escalating deployment of solar PV, wind, nuclear, heat pumps, and electric cars, the growth in emissions would have been three times greater.
To curtail CO2 emissions, a series of policies have been launched to encourage the development of NEVs, e.g., tax incentives and purchasing discount. These measures have significantly fostered the NEV market. Taking the Chinese NEV industry as an example, it has achieved rapid development. In the first half of 2024, the production of China’s new energy passenger vehicles reached 4.114 million, marking a 35.3% increase from the corresponding period of the previous year. Notably, electric vehicle (EV) production climbed to 2.357 million units, up by 12%, and the output of plug-in hybrid electric vehicles (PHEVs) skyrocketed to 1.757 million units, an impressive 87.7% increase.
However, charging has become a serious problem that limits the sustainable development of NEV. In comparison to traditional refueling, the charging process is considerably slower, leading to frequent lengthy queues of NEVs at highway charging stations, particularly during peak holiday periods. Some of the impatient NEV drivers choose to drive off the highway and take a detour to a distant charging station to charge and accept catering service there, which brings inconvenience to the drivers and reduces the service revenue of the charging station. The frustration caused by congestion and extended waiting times at charging stations has further dampened the purchasing intent of potential NEV buyers.
In addition to long-term measures such as investing in innovating battery technology and NEV charging infrastructure construction, the operation strategy of highway charging stations has been discussed to relieve the charging problem in the highway service area during holidays. Specifically, should a charging station provide charging service for plug-in hybrid electric vehicles (PHEVs) during peak arrivals? PHEVs can be driven by electric as well as gasoline power. If a PHEV chooses to refuel instead of charge, there will be a shorter queue and less congestion. To mitigate traffic in the highway service area and provide charging service for EVs during holidays, refusing to provide charging service to PHEVs seems to be an effective measure. However, given the rapid growth in PHEV numbers, a charging station achieves the potential to make more profit by serving PHEVs. If a charging station provides service to both electronic vehicles (EVs) and PHEVs, is it profitable to reserve maximum charging resources for different NEVs, thus the charging resources of EVs will not be occupied by the PHEVs?
Therefore, a charging station in the highway service area needs to evaluate the economic outcomes when providing service to PHEVs and when refusing to provide charging service to PHEVs during holidays. If there are PHEVs in a charging station, the service process becomes more complex and the charging station needs to decide how to serve PHEVs and EVs in order to maximize the profit. According to Zhang et al. [1], some service providers apply the mixed queuing discipline to serve the customers. In this situation, PHEVs and EVs share a single queue and are served on a “first come, first serve” policy, while, in order to meet the needs of EVs, a charging station can apply separate queueing discipline and set maximum charging resource for PHEVs and EVs. In this instance, there exist maximum charging capacities for two kinds of NEVs. When the charging resources are all occupied by EVs/PHEVs, newly incoming EV/PHEVs need to wait in the queue. It is crucial for charging stations to identify an optimal resource allocation strategy to efficiently serve both PHEVs and EVs. The study of the problems above can help the charging stations in the highway service area make operation decisions and deliver efficient charging services to NEVs. Relieving the charging queue problem in the highway service area during holidays can, in turn, encourage greater NEV adoption, which is instrumental in reducing CO2 emissions and advancing sustainability goals.
In this paper, queuing theory is applied to describe the charging process of the NEVs in a charging station. A queueing system considering customer balking and reneging is developed. We first study the charging resource allocation for a charging station employing a separate queuing discipline to serve two types of NEVs. The optimal charging resource allocation plan and maximum profit are derived. Then, the profits under a mixed queuing discipline and separate queuing discipline are compared, and the maximum profit when a charging station serve two types of NEVs is revealed. At last, we contrast the economic outcomes when there are no PHEVs and when there are both types of NEVs. The impacts of parameters, such as the arrival rate of NEVs and the patience degree of NEV drivers, on the optimal allocation strategy, profit, and comparison results are discussed. We find that when the EV arrival rate exceeds the charging service rate, a charging station should not provide charging services for PHEVs. Focusing solely on EVs derives more revenues and profits and results in shorter waiting queues. Conversely, when the total NEV arrival rate is below the service rate, it is advantageous for the station to serve both EVs and PHEVs. If providing service for PHEVs, a mixed queueing discipline is recommended when the total arrival rate is closed to the service rate. When the total NEV arrival rate is significantly lower than the charging service rate, the separate queueing discipline should be adopted. When applying separate queueing discipline, if a certain type of NEV has a higher arrival rate and drivers exhibit high patience, then more charging resources should be allocated for this type of NEV. Intriguingly, when the charging service is less busy, allocating fewer resources to more patient drivers is optimal; conversely, during peak times, the more patient the drivers are, the more service resources should be allocated to them.
The remainder of the paper is organized as follows. A literature review is conducted in Section 2. In Section 3, a basic model, without considering impatient NEV drivers, is derived. Section 4.1 extends the model to including impatient NEV drivers with a constant leaving rate. A queueing system considering customer balking and reneging with variable leaving rate is developed in Section 4.2. The optimal charging resource allocation plan, different queuing disciplines and, economic situation of serving PHEVs are studied in Section 3 and Section 4. Section 5 summarizes the conclusions and future research.

2. Literature Review

The charging of NEVs has received significant attention in recent years. A common research framework is optimizing the charging schedule under various constraints such as time windows [2,3,4] and capacity [5,6,7]. Jarvis et al. [2] minimizes the total amount of energy used with the constraint of clean energy time windows. Deep learning is applied to predict the clean energy time windows after building the Mixed Integer Programming (MIP) optimization model. The multi-period model (MPM) reactive method and single-period model (SPM) reactive method are compared based on real instances. Kim et al. [4] considers electricity tariff policies and EV users’ inflow rate and behavior to optimize the capacity of EV charging facilities. The relationship between various monetary factors and contract powers is developed, and the contract power is applied in practice to examine the model.
The location of the charging station is another popular field of research. Esmaeilnejad et al. [8] takes the location, charging duration, and types of charging stations into consideration for the charging planning process. Wu et al. [9] proposes a location planning model for the electric bus transit system to minimize the sum of the construction cost, operation and maintenance costs, travel cost, and the cost of power loss for charging stations at the established bus terminus. Yin et al. [10] studies the optimal allocation model of EV charging stations to optimize grid loss. Except for the optimizing of the charging schedule and location, there is also research focusing on the pricing of the charging service. Wang et al. [11] studies a new charging station operation model by jointly optimizing the EV admission control, pricing, and charging scheduling to maximize and characterize the average charging station profit. Amia et al. [12] provides a review on EVs’ optimal charging and scheduling under dynamic pricing. A detailed comparison of Real Time Pricing (RTP), Time of Use (ToU), Critical Peak Pricing (CPP), and Peak Time Rebates (PTRs) is presented in the research. Yun et al. [13] investigates the choice of the charging location with global positioning system (GPS) trajectories of 700 PHEV users, as well as of the charging facility data in Shanghai. Results show that 16% of PHEVs are similar to EVs, and 9% of PHEV drivers rely solely on public charging stations, similarly to internal combustion engine vehicles.
There are also some papers studying the operation of NEVs. Ma et al. [14] discuss that EVs are one of the most promising applications. They propose network-related vehicle operating cost functions and a logit-based choice model to analyze the adoption of EVs. Zhu et al. [15] and Wu et al. [16] discuss the traveling salesman problem for a PHEV. They apply the mixed-integer linear program and nonlinear programming models to describe the optimization problem. Kim et al. [17] study the profit-optimal management of a PHEV charging station under a realistic environment, addressing various types of vehicles and waiting time guarantees for PHEV customers.
Queue theory has drawn scholars’ attention in studying NEV charging operation. Zhu et al. [18] develop a model for PHEV charging station location problems. They apply the M/M/c queuing model to determine optimal locations and capacities for the charging stations by minimizing the sum of the installation costs and management costs of charging stations and the station access cost and charging cost of the users. There are some other papers that adopt the M/M/c queuing model [19,20]. Xiao et al. [21] apply an M/M/S/N queueing model to determine the quantity of chargers allocated at the charging station and the capacities of EV charging infrastructure to minimize the total cost. Meng et al. [22] use the M/M/S/N queueing model to describe the charging process of EVs when public electric bus charging stations are open to the public. Oonsivilai et al. [23] apply M/M/S/N queues to optimize the distribution system’s distributed generation sizing and PHEV charging. Their objective is minimizing total power loss. Esmailirad et al. [24] consider a M/M/K/K queue, which is a special M/M/S/N queue. They use queuing theory to analyze the performance of the model by considering solar power, electricity price, state of charge, amount of discharge, battery capacity, and vehicle arrival time. Liu et al. [25] propose an EV-to-charging station user equilibrium assignment model with a M/D/C queue approximation as a nondifferentiable nonlinear program. They assume that the service rate is constant.
Some research studies the queueing system when the arrival and service processes do not follow Poisson and exponential distribution. They loosen the assumptions by considering the general distributions of the arrival process or service process, which brings a lot of complexity to the problem. Wu et al. [26] optimize the location and capacity of charging stations under uncertain recharging demands. Erlang’s loss formula is applied to represent the service level requirement. They first build a robust optimization model and derive the deterministic dual following the linear approximation of the loss rate in queueing models. The robust distributed function is essential to derive the objective function [27]. Pourvaziri et al. [28] present a hybrid solution for the charging station location-capacity problem. With the objective of minimizing the total cost and waiting time, they build a mixed-integer nonlinear programming. The GI/GI/C queue is applied to model the waiting time, and a Deep Neural Network (DNN) is used to conduct the waiting time estimation. DNNs have a good effect on estimating the average waiting time, having been applied by other researchers [29]. Table 1 shows the applications of the queueing system in this field.
In this paper, an M/M/1 queuing system considering impatient customers is applied to describe the charging process of the NEVs in a charging station. We consider two types of NEVs simultaneously, i.e., PHEVs and EVs. The queueing parameters considering customer balking and reneging are derived. We first study the charging resource allocation for a charging station who uses separate queuing discipline to serve two types of NEVs. The optimal charging resource allocation plan and maximum profit are derived. Then, the profits under a mixed queuing discipline and separate queuing discipline are compared, and the maximum profit when a charging station serves two types of NEVs is revealed. At last, we make a comparison of the economic outcomes when there are no PHEVs and when there are both types of NEVs.

3. Basic Model

In this section, we focus on a basic model, where all NEV drivers are patient and will not leave the charging station even though there are waiting queues. We will loosen this assumption by considering impatient NEV drivers in Chapter 4.

3.1. Resource Allocation Plan

Consider a charging station whose charging service time follows negative exponential distribution and whose total charging service rate is μ . PHEVs and EVs arrive at the station following Poisson processes, and the arrival rates are λ P and λ E , respectively. λ P + λ E < μ is assumed to rule out the trivial case. The charging station earn r P / r E by serving one PHEV/EV. If all the charging resources for PHEVs/EVs are occupied, newly arriving PHEVs/EVs need to stay in the PHEV/EV queue. The charging stations are located in the parking space of the service area. The NEVs in the waiting queue give rise to the congestion in the service area. So, each waiting NEV incurs a cost, c , per unit time. The decision variable is x ( x ( 0 , 1 ) ). x is the proportion of charging resource serving PHEVs. So, the charging service rate available for PHEVs is x μ , and the EVs’ charging service rate is ( 1 x ) μ . The problem is to find the optimal x to maximize the charging station’s expected total profit. The notations used in this paper are listed in Table 2.
In order to make the queue reach a steady state, the decision variable x satisfies ρ P = λ P x μ < 1 and ρ E = λ E ( 1 x ) μ < 1 (this is feasible since λ P + λ E < μ ). Then, x must satisfy λ P / μ < x < 1 λ E / μ .
First, we analyze the PHEV queue. Since the drivers are patient, no one will leave as long as they arrive at the charging station. The actual arrival rate of PHEVs is i s = λ P . The average length of the PHEV queue is
i q = ρ P 2 1 ρ P = λ P 2 x 2 μ 2 x μ λ P .
The PHEV queue’s expected profit is
E P ( x ) = r P λ P c i q = r P λ P c λ P 2 x 2 μ 2 x μ λ P .
Similarly, the actual arrival rate of EVs is j s = λ E and the average length of the EV queue is
j q = ρ E 2 1 ρ E = λ E 2 ( 1 x ) 2 μ 2 ( 1 x ) μ λ E .
The expected profit of EV queue is
E E ( x ) = r E λ E c i q = r E λ E c λ E 2 x 2 μ 2 x μ λ E .
The total expected profit of the charging station is
E ( x ) = E P ( x ) + E E ( x ) .
The problem is transformed into the optimization problem:
max λ P / μ < x < 1 λ E / μ , E ( x )   = r P λ P c λ P 2 x 2 μ 2 x μ λ P + r E λ E c λ E 2 ( 1 x ) 2 μ 2 ( 1 x ) μ λ E
Proposition 1.
E ( x )  is concave in the interval λ P μ ,   1 λ E μ .
Proof of Proposition 1.
See Appendix A. □
Proposition 2.
(i) The serving ability for PHEVs increases for the arrival rate of PHEVs  λ p  and decreases for the arrival rate of EVs  λ E ; (ii) The serving ability for EVs increases for the EV arrival rate  λ E  and decreases for the PHEV arrival rate  λ P ; (iii) The optimal allocation of service ability is irrelevant to the marginal profits  r P  and  r E .
Proof of Proposition 2.
See Appendix A. □
According to Proposition 2, the optimal allocation strategy is impacted by the arrival rates of PHEVs and EVs, and is not impacted by the marginal revenue. This is because the NEV owners are assumed to be patient. The cost incurred by the charging station is the waiting cost. So the larger the arrival rate of PHEVs/EVs is, the more charging resources should be allocated to PHEVs/EVs.
Based on Gross et al. [30], mixed queuing discipline is more efficient than separate queuing discipline. So when a charging station adopts online sales channel and all the NEV drivers are very patient, it is obvious that mixed queuing discipline is more profitable. Section 4 will loosen the assumption by considering impatient NEV drivers, which will derive some interesting results.

3.2. Economic Situation of Serving PHEVs

We discuss the impact of serving PHEVs on the charging station’s profit. If the charging station does not provide services for PHEVs, only EVs arrive at the charging station. Then, all the charging service resources are allocated to serve the EVs. The total expected profit is
E E = r E λ E c λ E 2 μ 2 μ λ E .
A numerical experiment is conducted to discuss the economic condition of serving PHEVs. The parameters are set as μ = 40 , r E = 100 , r P = 60 , λ P = 5 . Figure 1 depicts the changes in E / E E (the ratio of the profit for serving PHEVs over that without serving PHEVs) with respect to the EV arrival rate.
Figure 1 shows that E / E E is larger than 1 if the arrival rate of the EVs λ E is small (less than 30) and that E / E E is less than 1 if the arrival rate λ E of EVs is large. Moreover, this decreases very fast as λ E approaches μ . This means that it is beneficial for the charging station to provide service for PHEVs when the arrival rate of the EVs is small compared to the service rate. When the EV arrival rate is closed to the service rate, it is harmful for the charging station to provide service for PHEVs. Figure 1 also shows that the waiting cost c has little impact on the ratio E / E E if λ E is small, but has a large negative impact on E / E E when λ E is large. This means that when λ E is small, whether it is providing service for PHEVs or not is irrelevant to the waiting cost. When λ E is, respectively, large, larger waiting costs derive more economic loss incurred by providing service for PHEVs.

4. Extension to Including Impatient NEV Drivers

4.1. Queuing System with Balking

4.1.1. Resource Allocation Plan

This section extends the model by considering impatient NEV drivers. In this case, some of the newly coming NEVs will refuse to receive service and leave the charging station when there is a waiting queue. Let the leaving rate of PHEVs/EVs be 1 α P ( 1 α E ). Then, NEVs arrive to the system with a rate of λ P i = λ P          ( i = 0 ) α P λ P          ( i 1 ) and λ E j = λ E          ( j = 0 ) α E λ E          ( j 1 ) , where i ( j ) is the length of PHEVs/EVs queue. A fixed leaving rate is considered in this section. We will loosen the assumption in the next section.
In order to make the queue reach a steady state, x must satisfy ρ P = α P λ N \ P x μ < 1 and ρ E = α E λ E ( 1 x ) μ < 1 (this is feasible since λ P + λ E < μ , α P < 1 and α E < 1 ). Then, x satisfies α P λ P / μ < x < 1 α E λ E / μ .
In the PHEV queue, based on the birth and death process, we can obtain
p i = α P i 1 ρ P i p 0 ,   p 0 = 1 α P ρ 1 α P ρ P + ρ P .
The actual arrival rate is
i s = i = 0 p i λ P i = λ P 1 α P ρ P + ρ P = λ P μ x μ x α P λ P + λ P .
The queue’s average length is
i q = i = 1 ( i 1 ) p i = α P ρ P 2 ( 1 α P ρ P + ρ P ) ( 1 α P ρ P ) = α P λ P 2 ( μ x α P λ P + λ P ) ( μ x α P λ P ) .
Then, the PHEV queue’s expected profit is
R P ( x ) = r P i s c i q = r P λ P μ x μ x α P λ P + λ P c α P λ P 2 ( μ x α P λ P + λ P ) ( μ x α P λ P ) .
Similarly, the queueing parameters of EV queue are
p j = α E j 1 ρ E j p 0 ,   p 0 = 1 α E ρ E 1 α E ρ E + ρ E .
The actual arrival rate is
j s = j = 0 p j λ E j = λ E 1 α E ρ E + ρ E = λ E μ ( 1 x ) μ ( 1 x ) α E λ E + λ E .
The average length of the queue is
j q = j = 0 ( j 1 ) p j = α E ρ E 2 ( 1 α E ρ E + ρ E ) ( 1 α E ρ E )   = α E λ E 2 [ μ ( 1 x ) α E λ E + λ E ] [ μ ( 1 x ) α E λ E ] .
Then, the expected profit of the EV queue is
R E ( x ) = r E j s c j q = r E λ E μ ( 1 x ) μ ( 1 x ) α E λ E + λ E c α E λ E 2 [ μ ( 1 x ) α E λ E + λ E ] [ μ ( 1 x ) α E λ E ] .
The total expected profit of the charging station is
R ( x ) = R E ( x ) + R P ( x ) .
The problem is transformed into the following optimization problem:
max α P λ P / μ < x < 1 α E λ E / μ , R ( x )   = r E λ E μ ( 1 x ) μ ( 1 x ) α E λ E + λ E c α E λ E 2 [ μ ( 1 x ) α E λ E + λ E ] [ μ ( 1 x ) α E λ E ] + r P λ P μ x μ x α P λ P + λ P c α P λ P 2 ( μ x α P λ P + λ P ) ( μ x α P λ P ) .
Proposition 3.
R ( x )  is concave in the interval  α P λ P μ , 1 α E λ E μ .
Proof of Proposition 3.
See Appendix A. □
Proposition 4.
(i) The serving ability for PHEVs increases for the PHEV arrival rate  λ N , decreases for the EV arrival rate λ F , increases for the marginal revenue of serving PHEVs r N , and decreases for the marginal revenue of serving EVs  r F . (ii) The serving ability for EVs increases for the arrival rate of EVs  λ F , decreases for the arrival rate of PHEVs  λ N , increases for the marginal revenue of serving EVs  r F , and decreases for the marginal revenue of serving PHEVs  r N .
Proof of Proposition 4.
See Appendix A. □
According to Proposition 3, if the NEV drivers are impatient, the optimal charging resource allocation policy is impacted by both the arrival rates of NEVs and the marginal revenues of serving them. Specifically, the larger the arrival rate of either PHEVs or EVs and the higher the marginal revenue of serving those NEVs, the more charging resources should be allocated to them. This is because too few resources for either type of NEV may lead to a long queue, increasing the waiting costs and potentially causing some impatient customers to refuse service. This, in turn, would decrease the revenue generated from serving those NEVs. Therefore, when allocating charging resources, the charging station should consider not only the waiting costs but also the marginal revenues.
In this section, numerical experiments are conducted to analyze the impacts of the NEV drivers’ leaving rates and NEV arrival rates on the optimal policy. The parameters are set as follows: μ = 40 , r E = 100 , r P = 60 , c = 10 , λ P = 15 . Figure 2 and Figure 3 show the impacts of the leaving rates on the optimal policy under different EV arrival rates. Note that there is a small EV arrival rate in Figure 2 and a large one in Figure 3.
Figure 2 shows that if there is a small number of EVs, the optimal policy x increases in α E for a given α P . So, for a given PHEV leaving rate, more resources should be allocated for PHEVs as the patience level of EV drivers increases. Comparing the three lines, we can find that for a given EV leaving rate, less resources should be allocated for PHEVs as the patience level of PHEV drivers increases. These results happen because compared to the charging service rate, the total NEV arrival rate is relatively small. So, the charging station is not busy and long waiting queue rarely occurs. More charging resources should be allocated to a certain type of NEVs whose drivers are not patient to avoid leaving and bulking.
However, as shown in Figure 3, when the total arrival rate is closed to the service rate, the optimal policy x first increases and then decreases in α E for a given α P . For a given α E , comparing the three lines in Figure 3, we can find that less resources should be allocated for PHEVs as the patience level of PHEV drivers increases. These results are particularly evident in the right part of the figure. This is because when the total arrival rate approaches or exceeds the service rate, the charging station is very busy. In order to reduce the waiting queue, more charging resources should be allocated for a certain type of NEVS. When the difference between the PHEV arrival rate and EV arrival rate is not significant and EV drivers are very patient, as shown in the left part of Figure 3, more resources should be allocated to PHEVs as the patience level of PHEV drivers decreases. This is because allocating more charging resources to the PHEVs can avoid leaving and bulking.

4.1.2. Comparison of Queueing Disciplines

From now on, we compare the performance of different queueing disciplines if a charging station provides service for PHEVs. The traditional mixed queuing model in Gross et al. [30] is extended to considering impatient customers. The notations used in this section are listed in Table 3.
Based on the birth and death process,
p n = ( λ P + λ E ) ( α P λ P + α E λ E ) n 1   μ n p 0 ,   p 0 = μ ( α P λ P + α E λ E ) μ ( α P λ P + α E λ E ) + ( λ P + λ E ) .
The actual arrival rate of PHEVs is
n P s = n = 0 p n λ P n = [ μ ( α P λ P + α E λ E ) + ( λ P + λ E ) α P ] λ P μ ( α P λ P + α E λ E ) + ( λ P + λ E ) .
The actual arrival rate of EVs is
n E s = n = 0 p n λ E n = [ μ ( α P λ P + α E λ E ) + ( λ P + λ E ) α E ] λ E μ ( α P λ P + α E λ E ) + ( λ P + λ E ) .
The average number of NEVs waiting in the queue is
n q = n = 1 ( n 1 ) p n = ( α P λ P + α E λ E ) ( λ P + λ E ) [ μ ( α P λ P + α E λ E ) + ( λ P + λ E ) ] [ μ ( α P λ P + α E λ E ) ] .
The total expected profit is
R m i x = r P n P s + r E n E s c n q .
The performances of separate queuing and mixed queuing disciplines are compared, and the results are depicted in Figure 4 and Figure 5.
Figure 4 and Figure 5 illustrate how the profits of the charging station vary with respect to the NEV leaving rates under different queuing disciplines. As shown in Figure 3 and the left part of Figure 4, when the total arrival rate is less than the service rate, the separate queueing discipline performs better under most situations. The difference in profits derived by two queuing disciplines first increases and then decreases as the patience level of EV drivers increases. The largest R m i x R arises when the patience level of EV drivers is slightly greater than that of PHEV derivers. The left part of Figure 4 reveals that when the total arrival rate is greater than the service rate and PHEV drivers are patient, R m i x R increases as the patience level of EV drivers increases. The mixed queueing discipline performs better when NEV drivers are patient.
Comparing the results of the four situations, we can find that when the total NEV arrival rate is less than the service rate and NEV drivers are not too patient, the charging station is not busy and a separate queueing discipline bring more profits. When the total NEV arrival rate is greater than the service rate and NEV drivers are patient, a mixed queueing discipline performs better. This happens because when the charging station is not busy and there is a short waiting queue, a separate queueing discipline can attract more NEVs, bring more revenue and increase the profit. When the charging station is busy and there is a long waiting queue, a mixed queueing discipline can reduce the waiting length, decrease the waiting cost, and increase the profit.

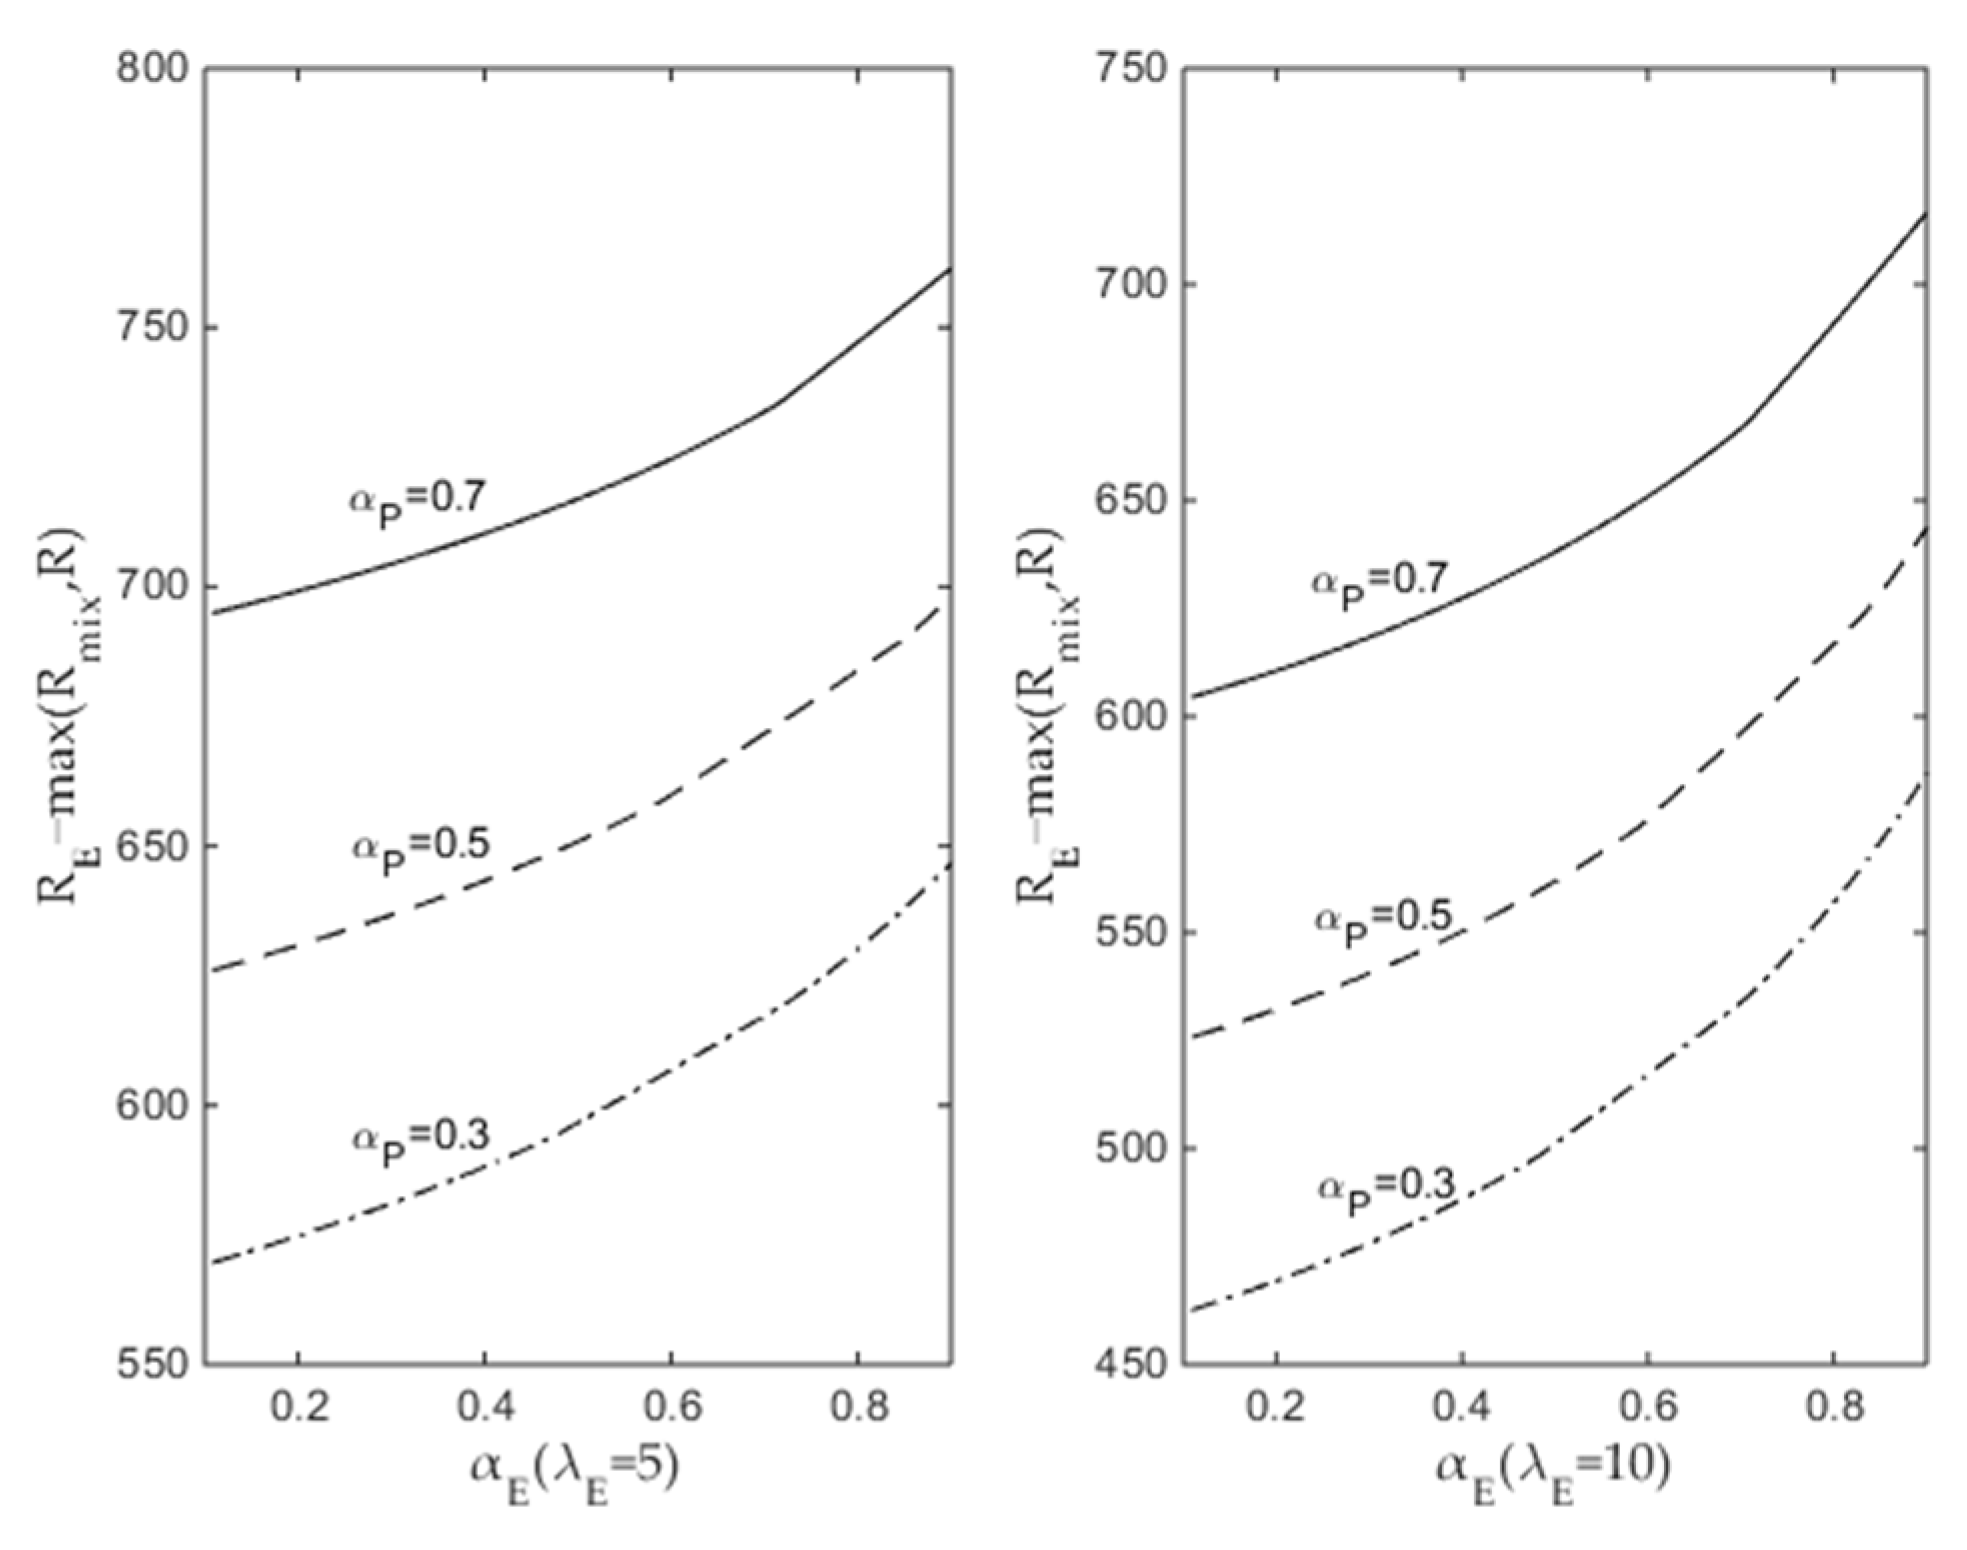
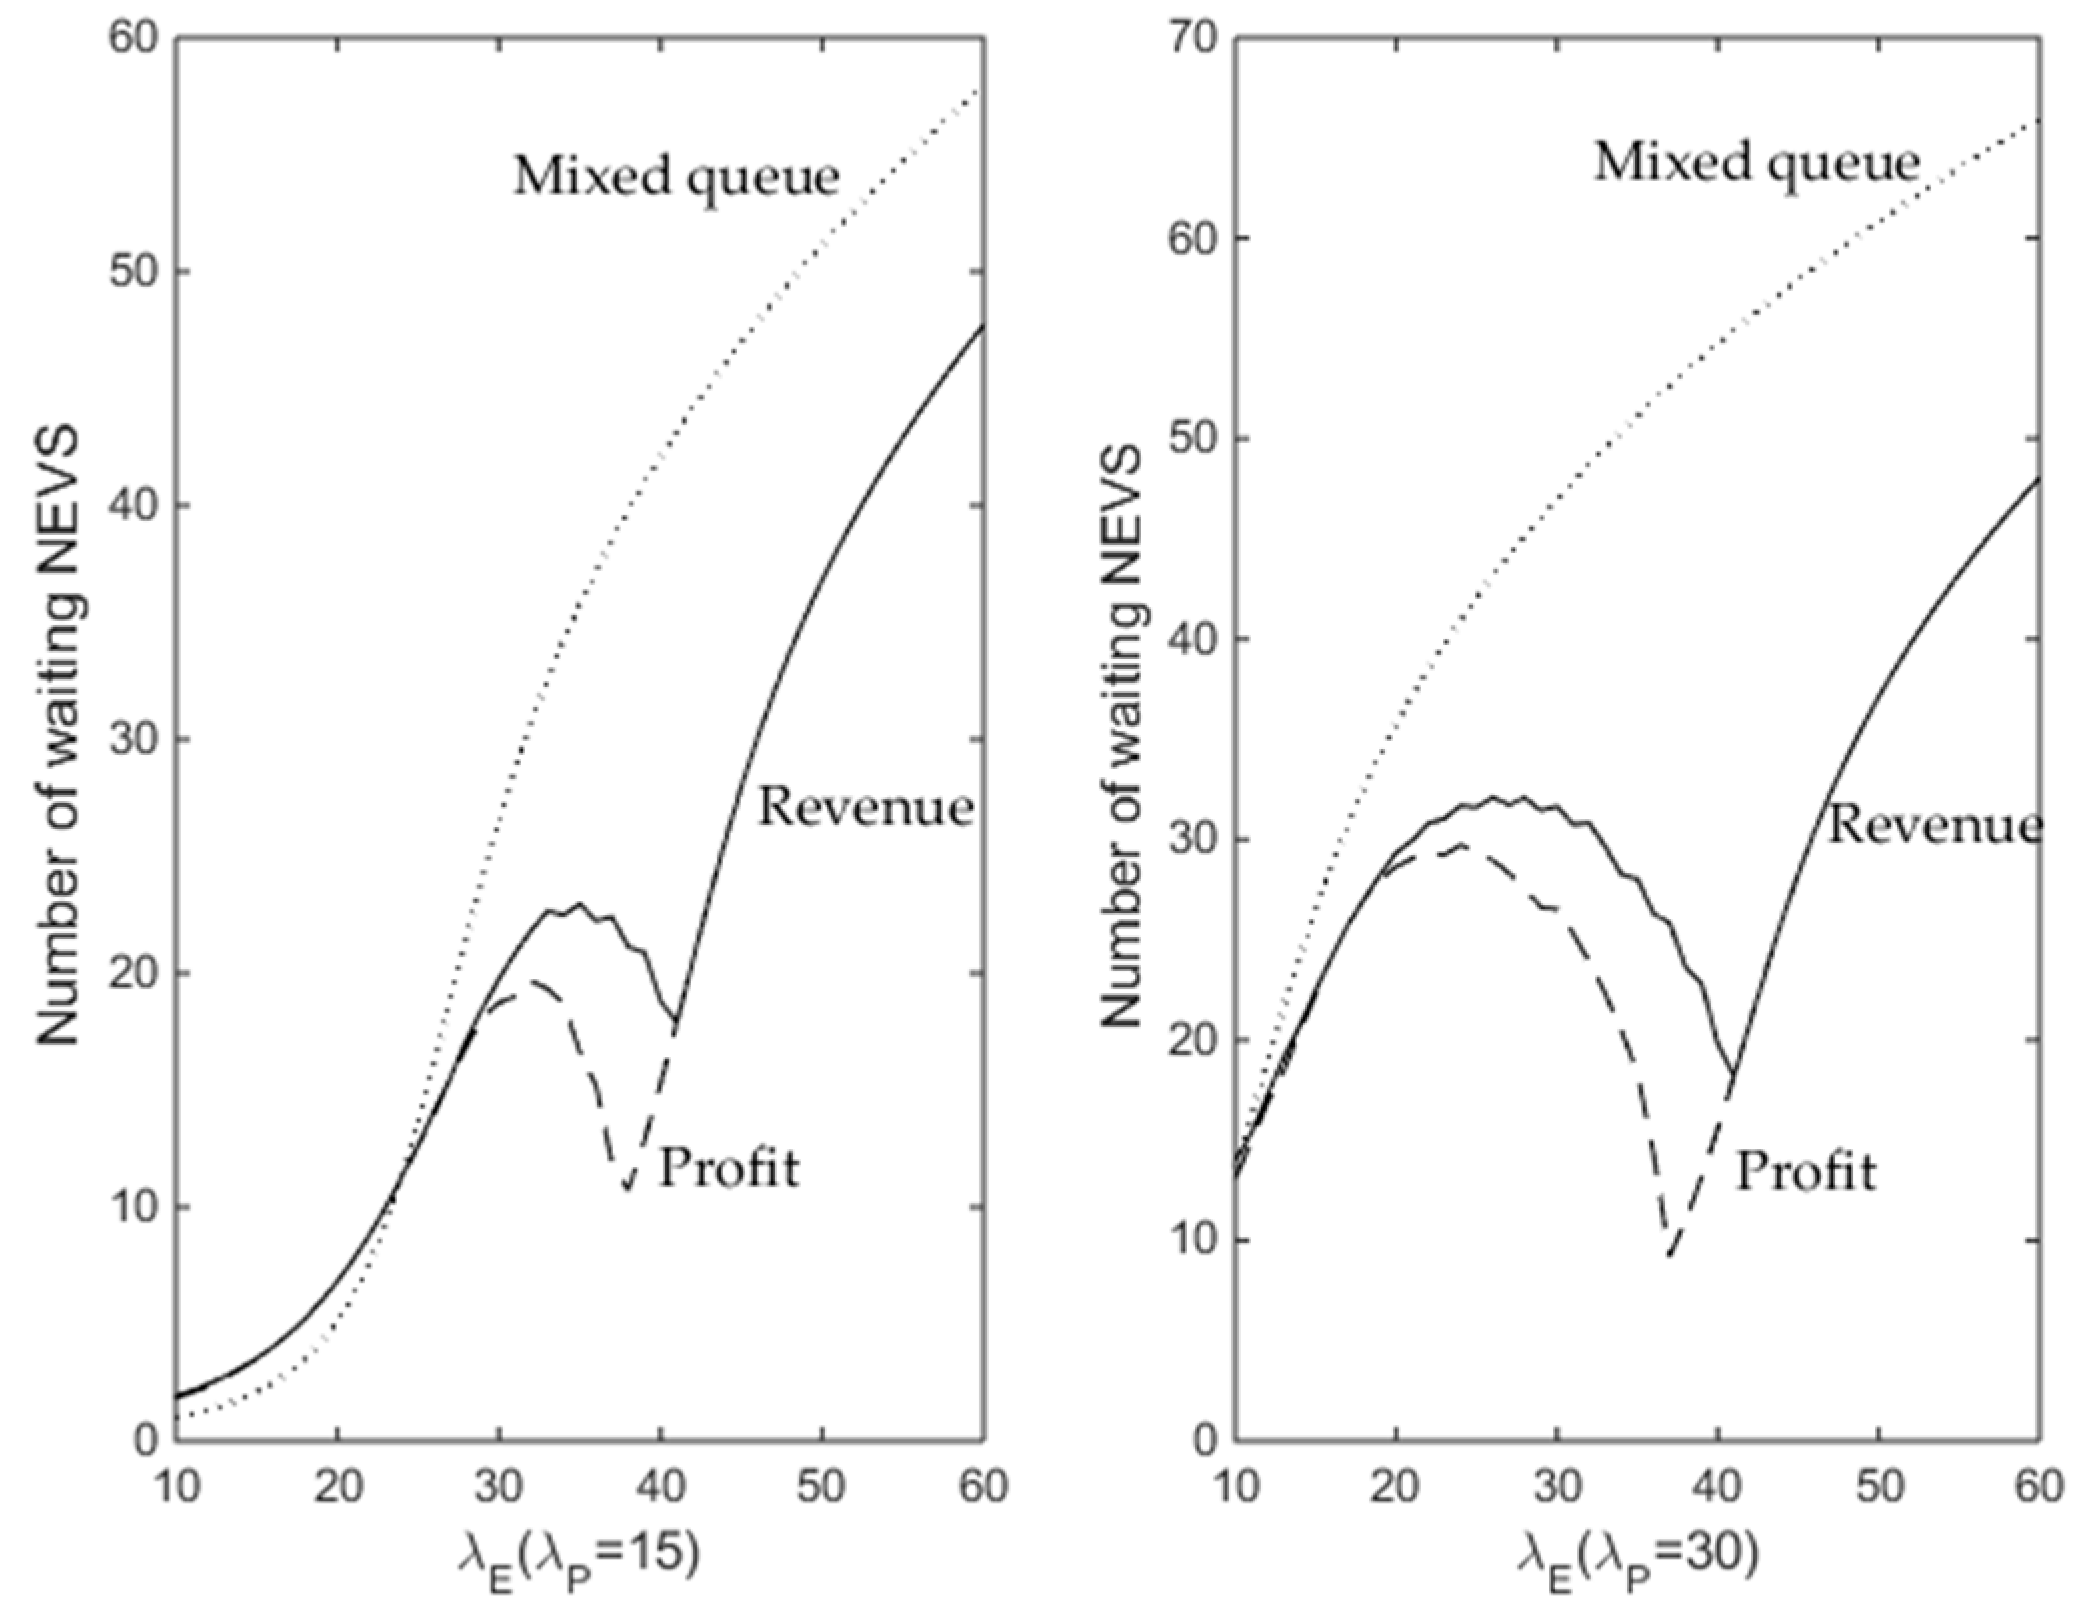
4.1.3. Economic Situation of Serving PHEVs

In this section, impacts of serving PHEVs are discussed on the profit of a charging station. Without providing service for PHEVs, the profit of the charging station is
R E = r E j s c j q = r E λ E μ μ α E λ E + λ E c α E λ E 2 ( μ α E λ E + λ E ) ( μ α E λ E ) .
Figure 6 and Figure 7 illustrate the changes in the profit difference R E max R m i x , R with respect to the patience level of NEV drivers and EV arrival rates, where R max represents the max profit of a charging station when it provides service for PHEVs.
Figure 6 and Figure 7 show that when there is a small number of NEVs, providing service for PHEVs is always beneficial to a charging station. That is because there are enough charging resources when the arrival rate of the NEVs is small. Providing charging services for PHEVs derives more charging demand and increases the charging revenue. When there is a large number of NEVs and both types of the NEV drivers are patient, as shown by the solid line in the right part of Figure 7, even though providing charging services for PHEVs is profitable, the profit decreases rapidly as the patience level of EV drivers increases. In particular, the profit difference becomes negative, which means providing charging services for PHEVs is not profitable when the patience degree of the NEV drivers is very large. For the consistency of parameters’ values and achieving a steady state, we do not show this situation in the figure. More discussions will be conducted in the next section.

4.2. Queuing System with Balking and Reneging

This section considers the queueing system with customer balking and reneging. Unlike the previous section, the probability of NEVs entering the queue is impacted by the length of the queue, i.e., the longer the queue, the lower the probability. Following Gross et al. [30], NEVs arrive to the system with a rate of λ b n , where b n = e α n , n is the length of the queue. Except for the balking NEVs, some of the NEVs may become discouraged and leave the queue after waiting in the line for a while (reneging). The probability of a NEV reneging is influenced by the number of NEVs waiting in front of the NEV. The average number of NEVs that leave the queue, in unit time, after waiting for a while is expressed by the reneging function b n = 0      ( n = 0 ) 1 e α n n 1      ( n 1 ) .
In practice, it is not easy to estimate the waiting cost. Therefore, in this section, the function of revenue (without considering waiting cost) and profit (considering waiting cost) are developed and analyzed. In order to study the impact of waiting NEVs on congestion in the highway service area, average waiting lengths of different strategies are also derived and compared.
The steady-state distribution can be calculated by using the birth and death process:
p n = p 0 λ n i = 1 n b i 1 μ + b i   n 1 ,   p 0 = 1 + n = 1 λ n i = 1 n b i 1 μ + b i 1 .
The actual arrival rate is
n s = 1 1 + n = 1 λ n i = 1 n b i 1 μ + b i 1 μ .
The average length of the queue is
n q = i = 1 ( i 1 ) p i .
The queuing parameters of the PHEV queue, EV queue, and mixed queue can be derived by substitution.
When applying a separate queueing discipline, the total revenue of the NEVs is
I ( x ) = r E j s + r P i s .
The total number of average waiting NEVs is
j = j q + i q .
The total expected profit of the charging station is
R ( x ) = r E j s c j q + r P i s c i q .
When applying mixed queueing disciplines, the total revenue of the station is
I m i x ( x ) = r P n P s + r E n E s .
The total number of average waiting NEVs is n q , and the total expected profit of the charging station is
R m i x = r P n P s + r E n E s c n q .
When there is no service for PHEVs, the total revenue is r E j s , the number of average waiting EVs is j q , and the total expected profit of the charging station is
R E = r E j s c j q .
Based on the analysis in the previous section, we find that NEV arrival rates are the most significant parameters that affect the optimal charging service allocation strategy, the choosing of the queueing discipline, and the economic situation of serving PHEVs. In this section, since NEVs’ leaving rate and reneging function change with the change in the waiting length, the queue model has already reflected NEV drivers’ variable patience degree. Therefore, numerical experiments are conducted to derive the optimal policies with the objectives of maximum revenue and profit, discuss the impacts of the arrival rates on the optimal policies, compare the performances of different queueing disciplines, and study the economic situation of serving PHEVs. Since the leaving rate increases as the waiting length increases, the queue can achieve a steady state under a larger arrival rate than in the previous section. Therefore, the numerical analysis can be conducted within a larger range of arrival rates, which is consistent with the real situation of the charging station during holidays.
Figure 8 shows the impacts of EV arrival rates on the optimal charging resource allocation plan under different objectives. The solid line and dash-dot line represent the optimal policies for maximizing the total revenue and maximizing the total profit, respectively. It can be seen that the charging resource allocated for PHEVs decreases as the EV arrival rate increases. When the EV arrival rate is closed to the charging rate, all the charging resources should be allocated for the EVs. The economic situation of providing service for PHEVs can be derived from Figure 8 and Figure 9.
Figure 9 shows the impacts of arrival rates on the revenues and profits under a separate queueing discipline and mixed queueing discipline. As can be seen in the figure, the separate queueing discipline brings more revenue and profit than the mixed queueing discipline when the total arrival rate exceeds the service rate. When the arrival rate is smaller than the charging service rate, the mixed queueing discipline brings more revenues and profits. The growth trends of the revenue and profit gradually slow down as the EV arrival rate increases. When the arrival rate is much higher than the service rate, the profit derived by the separate queueing discipline decreases because of the large waiting cost.
Based on Figure 8 and Figure 9, from an economic perspective, as long as the arrival rate of EVs exceeds the charging service rate, the service for PHEVs should be stopped. When there is a small EV arrival rate, charging for PHEVs is profitable.
Figure 10 shows the impacts of arrival rates on the waiting number of NEVs under different allocation policies. The solid line and dashed line represent the optimal policies for maximizing the total revenue and the total profit when applying the separate queueing discipline. The waiting length first increases, then decreases, and then increases again as the EV arrival rate increases. The decreasing trends occur because when there are more charging resources allocated for EVs, the number of EVs reduced in the EV queue is greater than the number of PHEVs increased in the PHEV queue. Comparing the waiting length of the mixed queueing discipline and separate queueing discipline, we can find that the mixed queueing discipline leads to longer waiting queues when the total arrival rate exceeds the charging service rate. When the total arrival rate is less than the charging service rate, the separate queueing discipline causes more waiting NEVs.
Therefore, when considering NEV balking and reneging with variable leaving rates, if the EV arrival rate is greater than the charging service rate, a charging station should not provide charging services for PHEVs. Serving only EVs derives more revenues, profits and shorter waiting queue. When the total NEV arrival rate is smaller than the charging service rate, the PHEVs should be served. Under this situation, a mixed queueing discipline should be applied if the total arrival rate is close to the service rate.

5. Conclusions

This paper studies charging resource allocation problem to charge EVs and PHEVs under a separate queuing discipline by using queuing theory. Optimal policies are characterized, and the impacts of parameters on the optimal policy considering patient and impatient NEV drivers are discussed. Numerical experiments are conducted to compare the performance between the mixed queuing discipline and separate queuing discipline and to study whether providing service for PHEVs is beneficial to a charging station. Results show that if the EV arrival rate is greater than the charging service rate, a charging station should not provide charging services for PHEVs. When the total NEV arrival rate is smaller than the charging service rate, the PHEVs should be served. When providing service for PHEVs, a mixed queueing discipline should be applied if the total arrival rate is close to the service rate. If the total NEV arrival rate is much smaller than the charging service rate, the separate queueing discipline should be adopted. When applying the separate queueing discipline, if a certain type of NEV has a higher arrival rate and the drivers are very patient, then more charging resources should be allocated for this type of NEVs. When the charging service is not busy, the more patient the drivers are, the less service resources should be allocated to them; when the charging service is busy, the more patient, the more resources.
Related to this research, the following topics can be studied further:
  • This research assumes that marginal revenue of charging one NEV is exogenous. In reality, charging stations can adjust the price based on the service ability and the arrival rate of the NEVs. Studying the service resource allocation problem with pricing is an interesting research topic.
  • Service resource management is assumed to be static, which means that the manager allocates a fixed amount of charging resources to different kinds of NEVs in advance. In actual operation management, managers may dynamically adjust the service allocation plan based on the length of the EV queue and PHEV queue. Dynamically adjusting resource allocation in order to charge the NEVs is also a promising topic.
  • The arrival and service processes are assumed to be Poisson distributed. In practice, the real processes may be more complex. Methods like deep learning can be applied to estimate the arrival and service processes. Expect for queue theory, applying scheduling methods for the operation of charging stations is another research option.

Author Contributions

Conceptualization, T.Z.; methodology, T.Z. and X.L.; software, C.S.; writing—original draft preparation, T.Z. and X.L.; writing—review and editing, Y.Z. All authors have read and agreed to the published version of the manuscript.

Funding

This research was funded by Shandong Provincial Natural Science Foundation, grant number ZR2022QG058; Humanities and Social Sciences Fund of the Ministry of Education of China, grant number 22YJC630070.

Institutional Review Board Statement

Not applicable.

Informed Consent Statement

Not applicable.

Data Availability Statement

The data in this study is available under the permission of all the authors.

Conflicts of Interest

Author Chenhui Shu was employed by the company China Unicom Digital Technology Corporation, Ltd. The remaining authors declare that the research was conducted in the absence of any commercial or financial relationships that could be construed as a potential conflict of interest.

Appendix A

Proof of Proposition 1. 
E ( x ) can be rewritten as follows:
E ( x )   = r P λ P c λ P 2 x 2 μ 2 x μ λ P + r E λ E c λ E 2 ( 1 x ) 2 μ 2 ( 1 x ) μ λ E = r P λ P + c λ P 1 x μ 1 x μ λ P + r E λ E + c λ E 1 ( 1 x ) μ 1 ( 1 x ) μ λ E .
Then,
E x = c λ P 1 x 2 μ + μ ( x μ λ P ) 2 + c λ E 1 ( 1 x ) 2 μ μ [ ( 1 x ) μ λ E ] 2
2 E x 2 = 2 c λ P μ x 3 2 c λ P μ 2 ( x μ λ P ) 3 + 2 c λ E μ ( 1 x ) 3 2 c λ E μ 2 [ ( 1 x ) μ λ E ] 3 = 2 c λ P μ 3 x 3 [ ( 1 λ P μ x ) 1 ] μ x 3 ( μ x λ P ) 3 + 2 c λ E μ 3 ( 1 x ) 3 [ ( 1 λ E μ ( 1 x ) ) 1 ] μ ( 1 x ) 3 [ μ ( 1 x ) λ E ] 3 = 2 c λ P 2 μ x ( μ x λ P ) 3 2 c λ E 2 μ ( 1 x ) [ μ ( 1 x ) λ E ] 3 < 0
Hence, the conclusion holds.
Note that lim x λ P μ E x = + and lim x 1 λ E / μ E x = , and the optimal solution x satisfies E x = 0 . So, the optimal solution can be derived by applying the Newton method. □
Proof of Proposition 2. 
First, prove that the optimal solution x is increasing in λ P and decreasing in λ F .
  • From the proof of Proposition 1, we hold that
E x = c λ P 1 x 2 μ + μ ( x μ λ P ) 2 + c λ E 1 ( 1 x ) 2 μ μ [ ( 1 x ) μ λ E ] 2 .
And x satisfies E x = 0 . That is, x satisfies
0 = c λ P 1 x 2 μ + μ ( x μ λ P ) 2 + c λ F 1 ( 1 x ) 2 μ μ [ ( 1 x ) μ λ E ] 2 .
Taking the derivative with respect to λ N on both sides of Equation (A5) leads to
0 = c ( 1 x 2 μ + μ ( x μ λ P ) 2 ) + 2 c λ P μ x 3 x λ P 2 c λ P μ ( x μ λ P ) 3 ( μ x λ P 1 )   + 2 c λ E μ ( 1 x ) 3 x λ P 2 c λ E μ 2 [ ( 1 x ) μ λ E ] 3 x λ P .
So,
x λ P = c λ P ( 2 x μ λ P ) x 2 μ ( x μ λ P ) 2 + 2 c λ P μ ( x μ λ P ) 3 2 c λ P 4 + 6 c μ x λ P 2 ( μ x λ P ) μ x 3 ( μ x λ P ) 3 + 2 c λ E 4 + 6 c μ ( 1 x ) λ E 2 [ μ ( 1 x ) λ E ] μ ( 1 x ) 3 [ μ ( 1 x ) λ E ] 3 .
Note that ρ P = λ P x μ < 1 and ρ E = λ E ( 1 x ) μ < 1 , i.e., λ P < x μ and λ E < ( 1 x ) μ , then x λ P > 0 , which implies that x increases in λ P and 1 x decreases in λ N . By similar arguments, we can obtain x λ E < 0 , which implies that x decreases in λ E and 1 x increases in λ F .
Summarizing the above, we prove (i) and (ii). From the previous section, it is easy to see that (iii) holds. □
Proof of Proposition 3. 
R ( x ) can be rewritten as follows:
R ( x ) = r P λ P μ x μ x α P λ P + λ P c α P λ P 2 ( μ x α P λ P + λ P ) ( μ x α P λ P ) + r E λ E μ ( 1 x ) μ ( 1 x ) α E λ E + λ E c α E λ E 2 [ μ ( 1 x ) α E λ E + λ E ] [ μ ( 1 x ) α E λ E ] = r P λ P μ x μ x α P λ P + λ P c α P λ P ( 1 μ x α P λ P 1 μ x α P λ P + λ P ) + r E λ E μ ( 1 x ) μ ( 1 x ) α E λ E + λ E c α E λ E ( 1 μ ( 1 x ) α E λ E 1 μ ( 1 x ) α E λ E + λ E ) .
Then,
R x = r P λ P 2 μ ( 1 α P ) ( μ x α P λ P + λ P ) 2 c α P λ P μ ( μ x α P λ P ) 2 + α P λ P μ ( μ x α P λ P + λ P ) 2 r E λ E 2 μ ( 1 α E ) [ μ ( 1 x ) α E λ E + λ E ] 2 c α E λ E μ [ μ ( 1 x ) α E λ E ] 2 α E λ E μ [ μ ( 1 x ) α E λ E + λ E ] 2 ,
and
2 R x 2 = r P 2 λ P 2 μ 2 ( 1 α P ) ( μ x α P λ P + λ P ) 3 c 2 α P λ P μ 2 ( μ x α P λ P ) 3 2 α P λ P μ 2 ( μ x α P λ P + λ P ) 3 r E 2 λ E 2 μ 2 ( 1 α E ) [ μ ( 1 x ) α E λ E + λ E ] 3 c 2 α E λ E μ 2 [ μ ( 1 x ) α E λ E ] 3 2 α E λ E μ 2 [ μ ( 1 x ) α E λ E + λ E ] 3 .
Note that ρ P = α P λ P x μ < 1 and ρ E = α E λ E ( 1 x ) μ < 1 . So, each item of Equation (A10) is less than 0; therefore, 2 R 2 x < 0 . Hence, the conclusion holds. By similar arguments in Section 3, the optimal allocation x satisfies R x = 0 . Hence, the optimal solution can be derived by applying the Newton method. □
Proof of Proposition 4. 
From the proof of Proposition 3,
R x = r P λ P 2 μ ( 1 α P ) ( μ x α P λ P + λ P ) 2 c α P λ P μ ( μ x α P λ P ) 2 + α P λ P μ ( μ x α P λ P + λ P ) 2 r E λ E 2 μ ( 1 α E ) [ μ ( 1 x ) α E λ E + λ E ] 2 c α E λ E μ [ μ ( 1 x ) α E λ E ] 2 α E λ E μ [ μ ( 1 x ) α E λ E + λ E ] 2 .
By the arguments following Proposition 3, x satisfies R x = 0 . That is, x satisfies
0 = r P λ P 2 μ ( 1 α P ) ( μ x α P λ P + λ P ) 2 c α P λ P μ ( μ x α P λ P ) 2 + α P λ P μ ( μ x α P λ P + λ P ) 2 r E λ E 2 μ ( 1 α E ) [ μ ( 1 x ) α E λ E + λ E ] 2 c α E λ E μ [ μ ( 1 x ) α E λ E ] 2 α E λ E μ [ μ ( 1 x ) α E λ E + λ E ] 2 .
Taking the derivative with respect to λ P on both sides of Equation (A12) leads to
0 = 2 λ P r P μ ( 1 α P ) ( μ x α P λ P + λ P ) 2 2 λ P 2 r P μ ( 1 α P ) ( μ x α P λ P + λ P ) 3 ( μ x λ P α P + 1 ) + c α P μ ( μ x α P λ P ) 2 c α P μ ( μ x α P λ P + λ P ) 2 2 c α P λ P μ ( μ x α P λ P ) 3 ( μ x λ P α P ) + 2 c α P λ P μ ( μ x α P λ P + λ P ) 3 ( μ x λ P α P + 1 ) 2 r E λ E 2 μ ( 1 α E ) [ μ ( 1 x ) α E λ E + λ E ] 3 μ x λ P μ x λ P 2 c α E λ E μ 2 [ μ ( 1 x ) α E λ E ] 3 2 c α E λ E μ 2 [ μ ( 1 x ) α E λ E + λ E ] 3 .
So,
x λ P = A B ,
where
A = 2 λ P μ ( 1 α P ) ( r P μ x + c α P ) ( μ x α P λ P + λ P ) 3 + 2 c α P 2 λ P μ ( μ x α P λ P ) 3 + c α P μ 1 ( μ x α P λ P ) 2 1 ( μ x α P λ P + λ P ) 2 ,
B = 2 λ P 2 r P μ 2 ( 1 α P ) ( μ x α P λ P + λ P ) 3 + 2 r E λ E 2 μ 2 ( 1 α E ) [ μ ( 1 x ) α E λ E + λ E ] 3 + 2 c α P λ P μ 2 1 ( μ x α P λ P ) 3 1 ( μ x α P λ P + λ P ) 3 + 2 c α E λ E μ 2 1 [ μ ( 1 x ) α E λ E ] 3 1 [ μ ( 1 x ) α E λ E + λ E ] 3 .
Note that ρ P = α P λ P x μ < 1 and ρ E = α E λ E ( 1 x ) μ < 1 , then each item of A and B is larger than 0. So x λ P > 0 , which means that x increases in λ P and 1 x decreases in λ P .
By similar arguments as above, x λ E < 0 , x r P > 0 , x r F < 0 , which means that x decreases in λ E and 1 x increases in λ E and in r P , 1 x decreases in r P and decreases in r F , and 1 x increases in r F . □

References

  1. Zhang, T.; Zhang, J.; Zhao, F.; Ru, Y.; Sutherland, J.W. Allocating resources for a restaurant that serves regular and group-buying customers. Electron. Commer. Res. 2020, 20, 883–913. [Google Scholar] [CrossRef]
  2. Jarvis, J.; Climent, L.; Arbelaez, A. Smart and sustainable scheduling of charging events for electric buses. Top 2024, 32, 22–56. [Google Scholar] [CrossRef]
  3. Bac, U.; Erdem, M. Optimization of electric vehicle recharge schedule and routing problem with time windows and partial recharge: A comparative study for an urban logistics fleet. Sustain. Cities Soc. 2021, 70, 102883. [Google Scholar] [CrossRef]
  4. Syla, A.; Rinaldi, A.; Parra, D.; Patel, M.K. Optimal capacity planning for the electrification of personal transport: The interplay between flexible charging and energy system infrastructure. Sustain. Cities Soc. 2024, 192, 114214. [Google Scholar] [CrossRef]
  5. Kim, J.; Oh, H.; Lee, J. Data-driven cost-effective capacity provisioning scheme in electric vehicle charging facility. Comput. Ind. Eng. 2022, 173, 108743. [Google Scholar] [CrossRef]
  6. Wu, Y.; Aziz, S.; Haque, M. Techno-economic modelling for energy cost minimization of a university campus to support electric vehicle charging with photovoltaic capacity optimization. Renew. Energy 2023, 219, 119427. [Google Scholar] [CrossRef]
  7. Jeon, S.; Park, J.; Kang, B.; Lee, H. Study on Battery Charging Strategy of Electric Vehicles Considering Battery Capacity. IEEE Access 2021, 9, 89757–89767. [Google Scholar] [CrossRef]
  8. Esmaeilnejad, S.; Kattan, L.; Wirasinghe, S.C. Optimal charging station locations and durations for a transit route with battery-electric buses: A two-stage stochastic programming approach with consideration of weather conditions. Transp. Res. Part C Emerg. Technol. 2023, 156, 104327. [Google Scholar] [CrossRef]
  9. Wu, X.; Feng, Q.; Bai, C.; Lai, C.; Jia, Y.; Lai, L. A novel fast-charging stations locational planning model for electric bus transit system. Energy 2021, 224, 120106. [Google Scholar] [CrossRef]
  10. Yin, W.; Ji, J.; Qin, X. Study on optimal configuration of EV charging stations based on second-order cone. Energy 2023, 284, 128494. [Google Scholar] [CrossRef]
  11. Wang, S.; Bi, S.; Zhang, Y.; Huang, J.; Huang, J. Electrical Vehicle Charging Station Profit Maximization: Admission, Pricing, and Online Scheduling. IEEE Trans. Sustain. Energy 2018, 9, 1722–1731. [Google Scholar] [CrossRef]
  12. Amin, A.; Tareen, W.U.K.; Usman, M.; Ali, H.; Bari, I.; Horan, B.; Mekhilef, S.; Asif, M.; Ahmed, S.; Mahmood, A. A Review of Optimal Charging Strategy for Electric Vehicles under Dynamic Pricing Schemes in the Distribution Charging Network. Sustainability 2020, 12, 10160. [Google Scholar] [CrossRef]
  13. Yun, B.; Sun, D.; Zhang, Y.; Deng, S.; Xiong, J. A Charging Location Choice Model for Plug-In Hybrid Electric Vehicle Users. Sustainability 2019, 11, 5761. [Google Scholar] [CrossRef]
  14. Ma, J.; Zhu, Y.; Chen, D.; Zhang, C.; Song, M.; Zhang, H.; Chen, J.; Zhang, K. Analysis of Urban Electric Vehicle Adoption Based on Operating Costs in Urban Transportation Network. Systems 2023, 11, 149. [Google Scholar] [CrossRef]
  15. Zhu, T.; Boyles, S.; Unnikrishnan, A. Plug-In Hybrid Electric Vehicle Traveling-Salesman Problem with Drone. Transp. Res. Rec. 2024, 03611981241278351. [Google Scholar] [CrossRef]
  16. Wu, F.; Adulyasak, Y.; Cordeau, J. Modeling and Solving the Traveling Salesman Problem with Speed Optimization for a Plug-In Hybrid Electric Vehicle. Transp. Sci. 2024, 58, 557–683. [Google Scholar] [CrossRef]
  17. Kim, T.; Kwak, J.; Chong, S. Dynamic Pricing, Scheduling, and Energy Management for Profit Maximization in PHEV Charging Stations. IEEE Trans. Veh. Technol. 2017, 66, 1011–1026. [Google Scholar] [CrossRef]
  18. Zhu, Z.; Gao, Z.; Zheng, J.; Du, H. Charging Station Planning for Plug-In Electric Vehicles. J. Syst. Sci. Syst. Eng. 2018, 27, 24–45. [Google Scholar] [CrossRef]
  19. Yi, T.; Cheng, X.-B.; Zheng, H.; Liu, J.-P. Research on Location and Capacity Optimization Method for Electric Vehicle Charging Stations Considering User’s Comprehensive Satisfaction. Energies 2019, 12, 1915. [Google Scholar] [CrossRef]
  20. Vijay, V.; Venkaiah, C.; Kumar, D. Multi objective queue theory based optimal planning of rapid charging stations and distributed generators in coupled transportation and distribution network. Energy Storage 2024, 6, e484. [Google Scholar] [CrossRef]
  21. Xiao, D.; An, S.; Cai, H.A.; Wang, J.; Cai, H. An optimization model for electric vehicle charging infrastructure planning considering queuing behavior with finite queue length. J. Energy Storage 2020, 29, 101317. [Google Scholar] [CrossRef]
  22. Meng, F.; Pei, W.; Zhang, Q.; Zhang, Y.; Ma, B.; Li, L. Research on the capacity of charging stations based on queuing theory and energy storage scheduling optimization sharing strategy. J. Energy Storage 2024, 96, 112673. [Google Scholar] [CrossRef]
  23. Oonsivilai, A.; Boribun, B.; Pao-la-or, P. Integration of Distributed Generation and Plug-in Electric Vehicles on Power Distribution System by Using Queuing Theory. Energies 2023, 16, 3146. [Google Scholar] [CrossRef]
  24. Esmailirad, S.; Ghiasian, A.; Rabiee, A. An Extended M/M/K/K Queueing Model to Analyze the Profit of a Multiservice Electric Vehicle Charging Station. IEEE Trans. Veh. Technol. 2021, 70, 3007–3016. [Google Scholar] [CrossRef]
  25. Liu, B.; Pantelidis, T.; Tam, S.; Chow, J. An electric vehicle charging station access equilibrium model with M/D/C queueing. Int. J. Sustain. Transp. 2023, 17, 228–244. [Google Scholar] [CrossRef]
  26. Wu, T.; Fainman, E.; Maïzi, Y.; Shu, J.; Li, Y. Allocate electric vehicles’ public charging stations with charging demand uncertainty. Transp. Res. Part D Transp. Environ. 2024, 130, 104178. [Google Scholar] [CrossRef]
  27. Huang, S.; Xiong, L.; Zhou, Y.; Gao, F.; Jia, Q.; Li, X.; Li, X.; Wang, Z.; Khan, M.W. Robust distributed fixed-time fault-tolerant control for shipboard microgrids with actuator fault. IEEE Trans. Transp. Electrif. 2024; early access. [Google Scholar] [CrossRef]
  28. Pourvaziri, H.; Sarhadi, H.; Azad, N.; Afshari, H.; Taghavi, M. Planning of electric vehicle charging stations: An integrated deep learning and queueing theory approach. Transp. Res. Part E 2024, 186, 103568. [Google Scholar] [CrossRef]
  29. Zhang, X.; Chan, K.; Li, H.; Wang, H.; Qiu, J.; Wang, G. Deep-Learning-Based Probabilistic Forecasting of Electric Vehicle Charging Load With a Novel Queuing Model. IEEE Trans. Cybern. 2021, 51, 3157–3170. [Google Scholar] [CrossRef] [PubMed]
  30. Gross, D.; Shortle, J.; Thompson, J.; Harris, C. Fundamentals of Queueing Theory; Wileys: Hoboken, NJ, USA, 2008. [Google Scholar] [CrossRef]
Figure 1. Changes in the profit ratio as λ E increases.
Sustainability 17 00336 g001
Figure 2. Optimal allocation policy x for different leaving rates (small EV arrival rate).
Sustainability 17 00336 g002
Figure 3. Optimal allocation policy x for different leaving rates (large EV arrival rate).
Sustainability 17 00336 g003
Figure 4. Difference in profits derived by different queuing disciplines (small EV arrival rate).
Sustainability 17 00336 g004
Figure 5. Difference in profits derived by different queuing disciplines (large EV arrival rate).
Sustainability 17 00336 g005
Figure 6. The changes in the profit difference with respect to leave rate (small EV arrival rate).
Sustainability 17 00336 g006
Figure 7. The changes in the profit difference with respect to leave rate (large EV arrival rate).
Sustainability 17 00336 g007
Figure 8. Optimal allocation policy x for different EV arrival rates.
Sustainability 17 00336 g008
Figure 9. Expected revenue and profit with respect to EV arrival rate.
Sustainability 17 00336 g009
Figure 10. Average number of waiting NEVs with respect to EV arrival rate.
Sustainability 17 00336 g010
Table 1. Applications of queueing system.
ObjectiveQueueing
Structures
Related Literature
Minimizing cost, driving distance, or waiting timeM/M/C[18,19,20]
Minimizing costM/M/S/N[21,22,24]
Minimizing power lossM/M/S/N[23]
Calculating waiting time M/D/C[25]
Minimizing costM/G/N/N[26]
Minimizing cost and
minimizing waiting time
GI/GI/C[28]
Table 2. Notations used in this paper.
PHEV QueueEV Queue
Length i j
Service rate x μ ( 1 x ) μ
Arrival rate λ P λ E
Traffic intensity ρ P ρ F E
Actual arrival rate i s j s
Length of the queue i q j q
Average revenue
of charging one NEV
r P r E
Waiting cost per NEV
per unit time
c
Profit E P E E
Table 3. Parameters and variables used in this section.
Mixed Queue
Length n
Service rate μ
Arrival rate λ n = λ P + λ E            ( n = 0 ) α P λ P + α E λ E    ( n 1 )
Actual arrival rate (PHEV) n P s
Actual arrival rate (EV) n E s
Length of the queue n q
Average revenue of
charging one PHEV
r P
Average revenue of
charging one EV
r E
Waiting cost of one NEV
per unit time
c
Profit R m i x
Disclaimer/Publisher’s Note: The statements, opinions and data contained in all publications are solely those of the individual author(s) and contributor(s) and not of MDPI and/or the editor(s). MDPI and/or the editor(s) disclaim responsibility for any injury to people or property resulting from any ideas, methods, instructions or products referred to in the content.

