Article

Livelihood Resilience and Its Influence on Livelihood Strategy of People in the State-Owned Forest Areas in Northeast China and Inner Mongolia

School of Management, Tianjin University of Commerce, Tianjin 300134, China
Sustainability 2025, 17(1), 298; https://doi.org/10.3390/su17010298
Submission received: 6 November 2024 / Revised: 29 December 2024 / Accepted: 31 December 2024 / Published: 3 January 2025

Abstract

:
In 2015, the Chinese government banned logging in the state-owned forest areas in Northeast China and Inner Mongolia. This is an enormous change for people who depend on the forest. Based on a survey of 1573 households in the state-owned forest areas in Northeast China and Inner Mongolia, our study constructs an evaluation index system of livelihood resilience composed of three dimensions: buffer capacity, self-organization, and learning capacity. The method of weighted sum is used to evaluate the livelihood resilience of local residents, and the influencing factors of livelihood strategy are analyzed by a multinomial logistic regression model. The results show that the overall level of livelihood resilience of local residents is neutral, and the self-organization is significantly higher than their buffer capacity and learning capacity. There are significant differences in livelihood resilience among the various livelihood strategies. The livelihood of households practicing forestry as a side job is most resilient followed by those practicing forestry as a main job, diversified livelihood, and forest-dependent. We found that per capita income and per capita housing area are key factors affecting the livelihood strategy shifts. Household size, household composed of multi-generations, and labor determine the basic direction of the livelihood strategy. We argued that the state-owned forest areas in Northeast China and Inner Mongolia need to establish a technical training system for local residents and to strengthen the role of social organizations, which would then improve livelihood resilience.

1. Introduction

In the face of an uncertain future and outside distractions, many scholars believe that resilience is the most effective way to enhance community livelihood and promote sustainable development [1,2,3]. Resilience thinking stems from ecology. In recent years, many scholars have introduced resilience into livelihood research as an expansion of the research field of resilience [1,4]. The research content mainly focuses on the impact of major external changes and challenges such as ecologically fragile areas [5,6], resettlement [7,8], and climate change [9,10]. The state-owned forest areas in Northeast China and Inner Mongolia are just facing such an external change and challenge—logging ban. In 2015, the Chinese government announced that it would stop commercial logging of natural forests in the state-owned forest areas in Northeast China and Inner Mongolia.
To realize national reconstruction, the Chinese government established 87 state forest enterprises (SFEs) in Northeast China in the 1950s. The main task is to produce wood to support national construction. As a result of exploitation, forest resources have been seriously damaged. High-intensity forest harvesting leads to a series of ecological problems. To promote forest restoration and forest protection, the Chinese government has formulated a series of forest protection policies. In 1998, the flooding of the Yangtze and Yellow Rivers made the Chinese government realize the extent of the overlogging in the upstream watersheds and the irreplaceability of forests in terms of their ecological function [11]. So, in 2000, the Chinese government announced the National Forest Protection Program to mediate deforestation and restore the forest. Since that time, SFEs’ logging were cut by 20 million cubic meters [12], and their timber production has taken a backseat [13]. On 1 April 2015, China launched an important policy that banned commercial logging in the state-owned forest areas in Northeast China and Inner Mongolia. Since then, the role of the state-owned forest areas in Northeast China and Inner Mongolia has changed fundamentally. The focus is no longer on timber production but on ecological protection. It is not a small challenge for SFEs. In the past 70 years, all the work of SFEs surrounded timber harvesting. They are the largest state-owned forests in China and important timber production based. By 2015, they had provided nearly 1.1 billion cubic meters of commercial timber, accounting for nearly half of the national commercial timber output during that period [14,15,16], and the local residents are also dominated by the employees of SFEs and their families [17,18].
However, when an economy relies on a single resource, it will be very vulnerable [1,3,19]. For the local residents, it may generate relatively isolated income sources and high livelihood risks [15,20,21]. The SFEs have had to change their main mission from “logging” to “reforestation” [22]. Workers have also experienced job transfers or even unemployment [16,23]. To ensure people’s livelihood, the government has issued some policies, such as a forest tending subsidy, afforestation subsidies, an ecological compensation, a silviculture fund, and a resettlement program [24]. The SFEs also actively explore new development directions of forestry, such as non-timber forest products, forest tourism, and forest medical treatment. Because of the impacts of these changes on local people, it is necessary to grasp the livelihood resilience of worker households in the state-owned forest areas in Northeast China and Inner Mongolia in a timely manner, especially after the logging ban.
Although there are many studies on the livelihood of the state-owned forest areas in Northeast China and Inner Mongolia after the logging ban, they mainly focus on the livelihood outcome such as income [25], employment [18], and welfare [11], and there is little research on their resilience. For the livelihoods of local residents, policy change is not an instantaneous impact but is a long-term impact. The impact of policies on livelihood cannot be obtained only through the superficial phenomenon of livelihood results. It should be further analyzed, the livelihood resilience, which can find the endogenous force of the livelihood of worker households. We hoped from this perspective to analyze the sustainability of worker households’ livelihood, which can then help the government and SFEs adjust policies in time, so as to improve the overall resilience of the state-owned forest areas in Northeast China and Inner Mongolia.

2. Construction of Index System of Livelihood Resilience

According to the relevant academic research [4,26], the definition employed by this study of livelihood resilience is the ability to deal with the adverse impact of external interference and improve their ability to adapt to the adverse impact in order to effectively maintain the operation of their own livelihoods when they are subjected to external interference. As the local residents mainly produce and live with the family as a unit, this study takes the worker households of SFEs, the state-owned forest areas in Northeast China and Inner Mongolia, as the research object. Based on the relevant findings of scholars and the actual situation examined in this study [1,4,27,28], we constructed an index system to evaluate livelihood resilience. The system was used to conduct an analysis from three dimensions, including buffer capacity, self-organization, and learning capacity (Table 1).
Buffer capacity includes the basic ability to cope with external shocks, reflects the accessibility of finances, plays an important role in the recovery ability of individual and household livelihood, and affects other dimensions to a certain extent [4]. It is the basic ability to deal with external shocks and risks. From the perspective of livelihood capital in the sustainable livelihood framework [5], human capital is characterized by the household size, household head health, and education and occupation type of the household head. Household size is a direct contributor to workers’ family productivity. Health is the fundamental guarantee for the normal livelihood activities of households [6,28]. Education reflects the knowledge and cultural level of the head of the household, which helps to perceive and avoid risks. Material capital is represented by the number of houses, housing type, and per capita housing region, which can reflect the quality of life of worker families. Financial capital is represented by the per capita income and bank savings. Per capita income reflects the economic level of workers, while bank savings represent the financial buffering of workers to deal with the crisis [3,27].
Self-organization is the social resources that individuals or households can use, that is, their capacity to exchange material, energy, and information with their social network in the face of external shocks [1,5,20]. People establish macrorelations through microinterconnection, which can affect livelihood resilience through the interaction of collective behavior and social relations. Endowment insurance and medical insurance are used to represent the basic social security situation of worker households. Home–road distance and home–hospital distance are used to characterize the transportation and medical treatment of worker households [2]. Household relationship and neighborhood relationship are the embodiments of psychological capital, and better psychological capital is an important driving force to improve livelihood resilience.
Learning capacity can be used to examine worker households’ potential learning and adaptation ability [1,5,20]. As a livelihood investment, the return on education expenditure is slow but long term. It can be used to inspect the degree of importance attached to education by worker households. The work experience and vocational training are important indicators to evaluate the experience of accumulating and obtaining new knowledge and skills, which is helpful to understand the new situation and promote the optimization of family livelihood strategies. Knowledge of policy can enable worker households to modify or replace traditional ideas or thinking patterns.

3. Study Area and Data

3.1. Study Area

The state-owned forest areas in Northeast China and Inner Mongolia (roughly 120° E and 135° E longitude and 38° N and 56° N latitude) are located in the Greater and lesser Xing ’an Range and Changbai Mountains in China. They are mainly coniferous deciduous broad-leaved mixed forests in the middle temperate zone. The state-owned forest areas in Northeast China and Inner Mongolia have a temperate continental climate, with cold and long winters and short, hot summers. Songhua River, Heilongjiang River, Yalu River, and other rivers originate here, which has great economic and ecological value. It is an important natural barrier for the northeast ecosystem.

3.2. Data

The data source of this study is drawn from Key State-Owned Forests Livelihood Monitoring Project. The project is organized by the State Forestry Administration of China and conducted by Northeast Forestry University in July and August of 2019 in order to understand the people’s livelihood in the state-owned forest areas in Northeast and Inner Mongolia after the logging ban. The survey covered 87 SFEs, and each SFE randomly selected 20~30 individuals. We used semistructured and face-to-face interviews in Chinese in field surveys. The respondents were all from SFEs, and each respondent was an adult family member representing the household. There was a total of 1961 respondents. After rejecting questionnaires with incomplete information, we obtained 1573 valid respondents. The basic characteristics of the survey sample is in Table 2.

4. Measurements

4.1. Evaluation Model of Livelihood Resilience

To analyze the livelihood resilience of worker households, we established a model to calculate livelihood resilience.
First, standardize the data. According to different indicator types, different data standardization formulas were selected.
Dichotomous variables were as follows:
X i j = 0                 x = 0 1                 x = 1
Continuous variables and virtual qualitative variables were as follows:
X i j = 0                         0 x i j   x i j m i n x i j x i j m i n x i j m a x x i j m i n               x i j m i n < x i j < x i j m a x 1             x i j x i j m a x
where i represents the dimension (buffer capacity, self-organization, and learning capacity), j represents the indicator, xij represents the indicator j of dimension I, xijmin represents the minimum value of xij, and xijmax represents the maximum value of xij. Xij is the data of column i and column j after normalization.
Second, determine the weight. In this study, we believed that the three dimensions (buffer capacity, self-organization, and learning capacity) were equally important, so the weights were set to 0.333. For the secondary indicators of each dimension, the weight formula is as follows:
    ω i j = ln 1 μ x i j ¯
Finally, add up with weights to calculate the livelihood resilience.
f x i = j = 1 k μ ¯ ( x i j ) × ω i j j = 1 k ω i j
The value range is [0, 1]; 1 indicates that livelihood resilience is in good condition, 0 indicates that livelihood resilience is in poor condition, and 0.5 indicates that livelihood resilience is in a neutral state.

4.2. Distribution Way of Livelihood Resilience

To understand the distribution of livelihood resilience of worker households, we divided the households into three groups using the mean and standard deviation of the distribution. According to the average value of the 2019 livelihood resilience of worker households in the state-owned forest areas in Northeast China and Inner Mongolia plus or minus standard deviation, the worker households in the state-owned forest areas in Northeast China and Inner Mongolia were divided into three groups: low group, medium group and high group. The less resilient group consists of households up to the point of minus one standard deviation from the mean while the more resilient group includes those from the point of one standard deviation above the mean of the resilience for the whole sample.

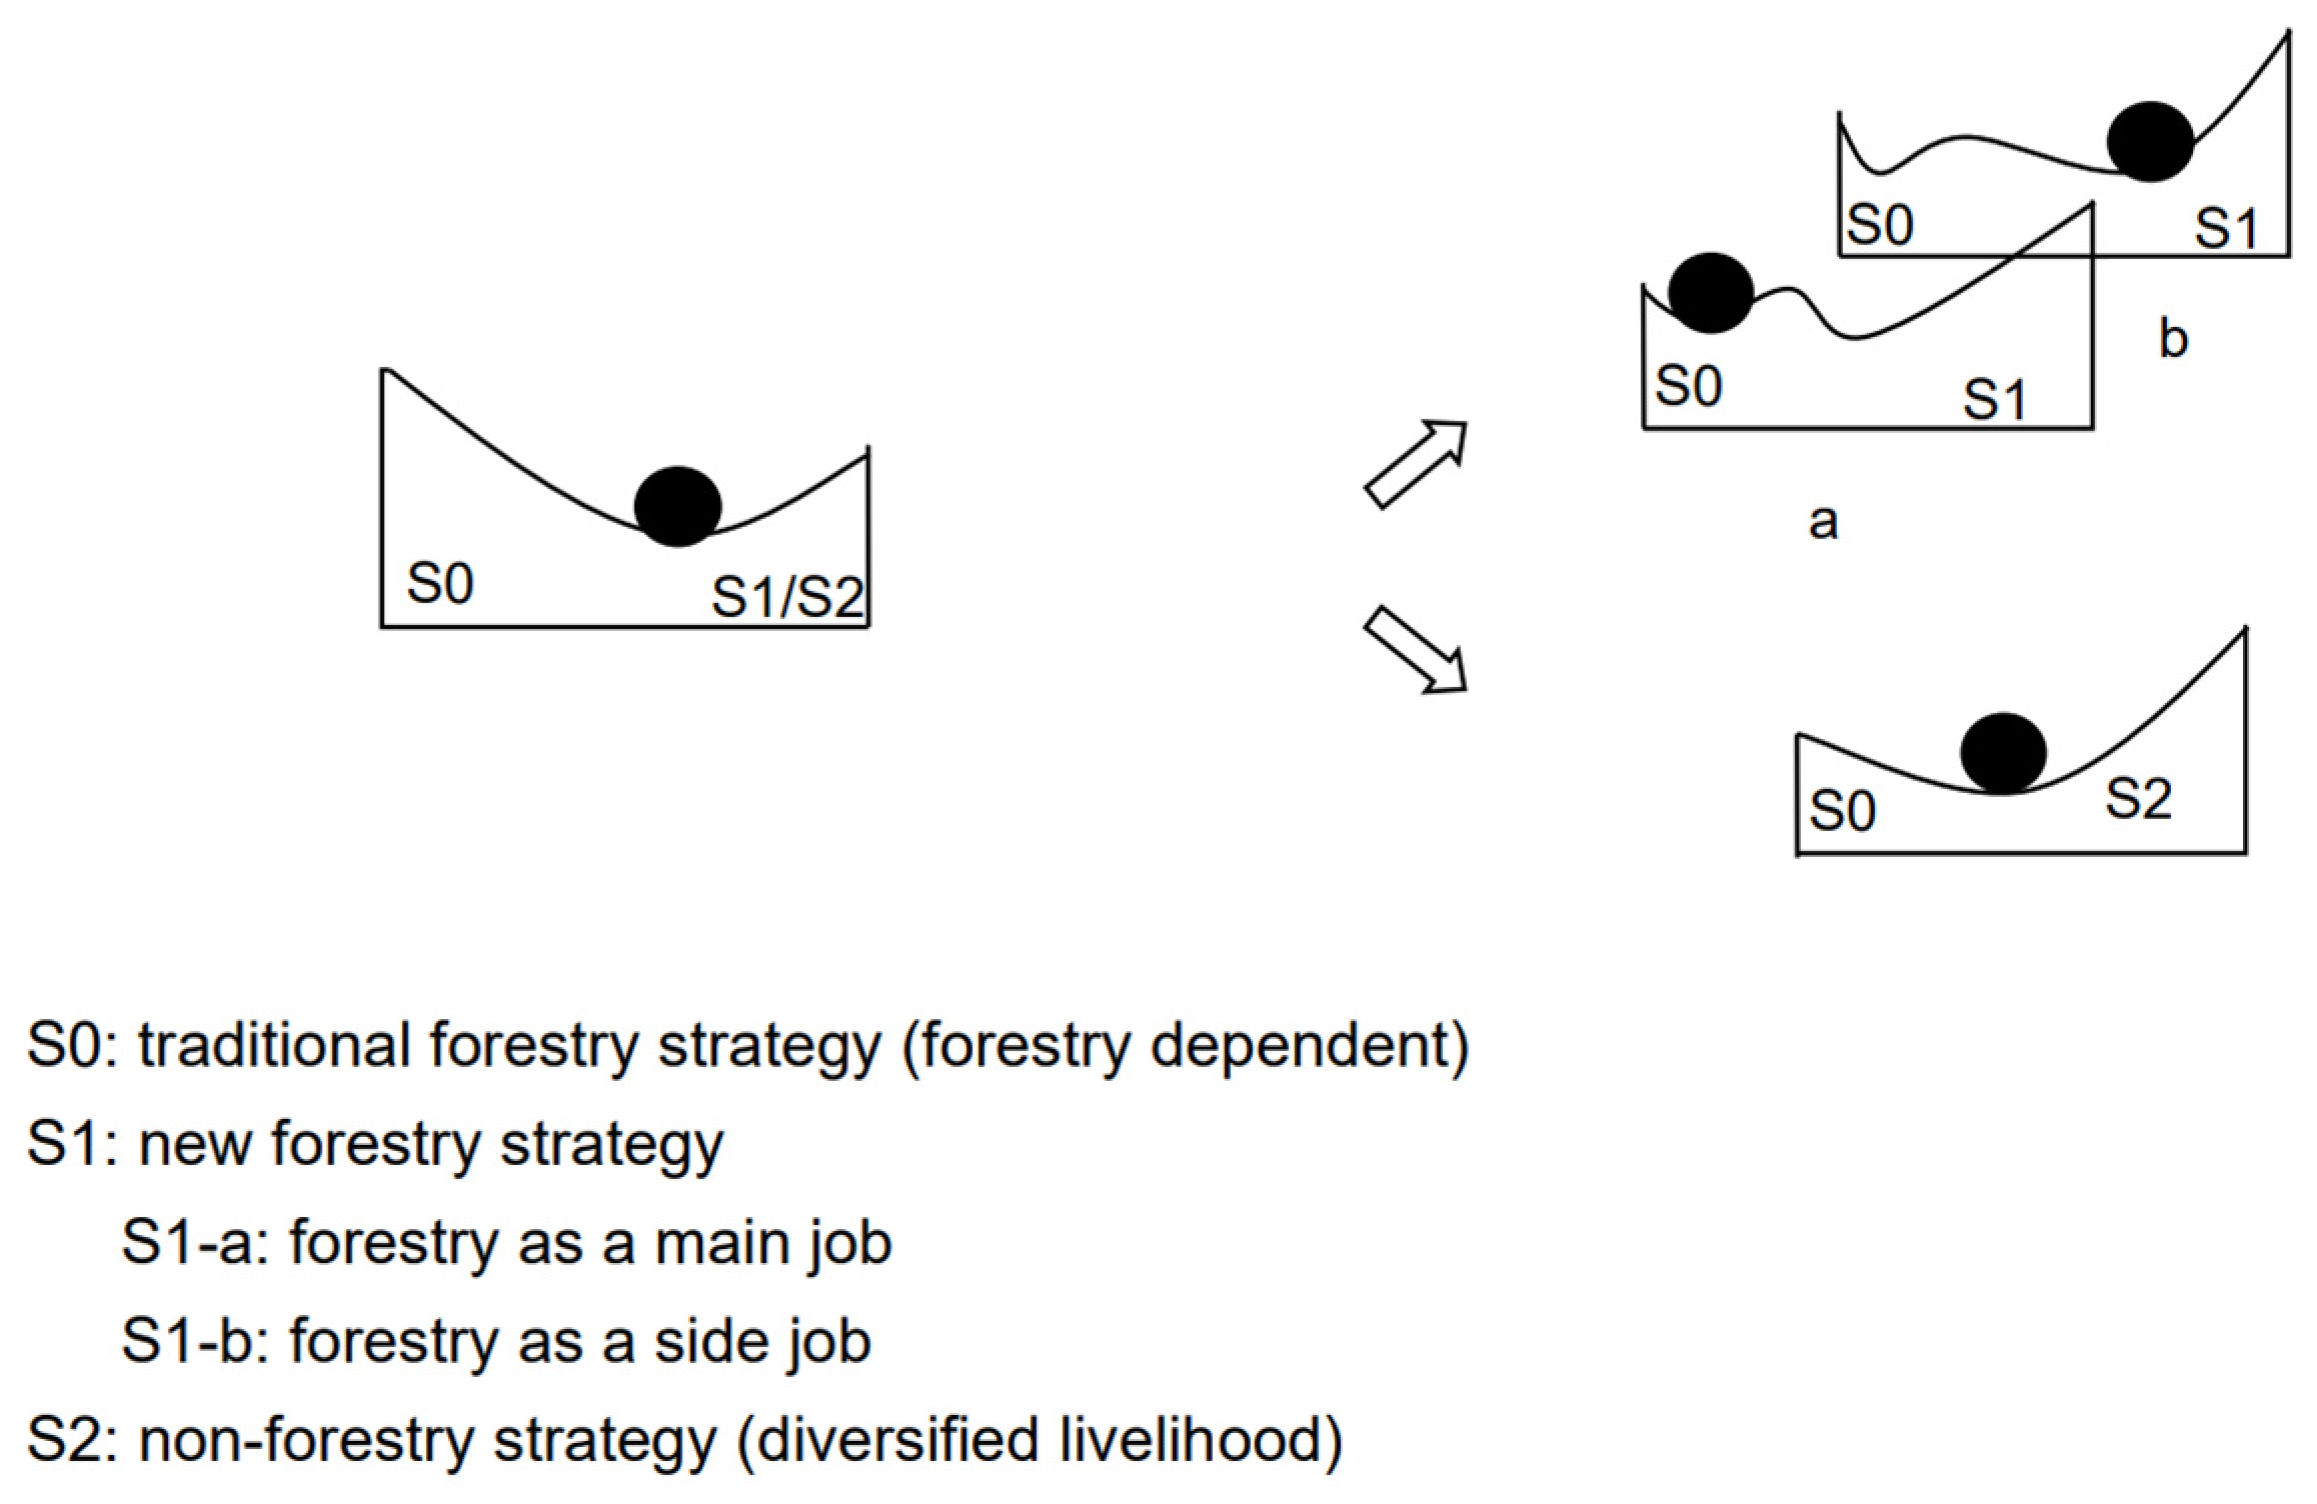
4.3. Ball-in-Basin Model

To describe the livelihood strategy shifts, we used the ball-in-basin model to explain [29] (Figure 1). The ball is in different basins or different positions in the same basin, which refers to the process of livelihood strategy shifts [30]. The ball is the state of livelihood strategy. The basin of attraction is the equilibrium state.

4.4. The Multinomial Logistic Regression Model

To explore the law of livelihood strategy shifts, we used the multinomial logistic regression to assess the role and intensity of explanatory variables in predicting the occurrence probability of categorical variables. Using STATA 14.0, the livelihood strategies were used as dependent variables (yk), namely forest-dependent, forestry as a main job, forestry as a side job, and diversified livelihood, which were assigned values of 1, 2, 3, and 4, respectively. The independent variables (xm) were the evaluation index of livelihood resilience and family demographic information (household composed of multi-generations and labor force). In this study, we take the forest-dependent strategy as a control group and establish multinomial logistic regression models.
The conditional probability of y is as follows:
p y = k x = k = 1 4 e x p ( y k ) 1 + k = 1 4 e x p ( y k )
The multinomial logistic regression model is as follows:
Model I:
y 2 = ln ( p 2 p 1 ) = α 2 + m = 1 m β 2 m x m
Model II:
y 3 = ln ( p 3 p 1 ) = α 3 + m = 1 m β 3 m x m
Model III:
y 4 = ln ( p 4 p 1 ) = α 4 + m = 1 m β 4 m x m
In the formula, pi represents the probability that worker households belong to a certain type, αi is the intercept, mx is the mth independent variable, and βim is the regression coefficient of the mth independent variable.

4.5. Livelihood Strategies

With the start of the logging ban in 2015, worker households in the state-owned forest areas in Northeast China and Inner Mongolia are also actively exploring ways of livelihood to adapt to the new social environment [25]. According to the survey data in 2019, we categorized livelihood strategies into four groups based on the average value of forestry income (43,972.87 RMB) and average value of the proportion of forestry income in total income (76.91%) [1,25,31]. The worker households in which forestry income is below the average and the proportion of forestry income is above the average are defined as forest-dependent. The worker households in which both forestry income and the proportion of forestry income are above the average are defined as forestry as main job. The worker households in which forestry income is above the average and the proportion of forestry income is below the average are defined as forestry as side job. The worker households that both forestry income and the proportion of forestry income are below the average are defined as diversified livelihood.

5. Results

5.1. The Result of Livelihood Resilience

5.1.1. The Livelihood Resilience of Overall Worker Households

The value of the estimated livelihood resilience level of households working in the state-owned forests of Northeast China and Inner Mongolia is 0.442 (Table 3). This indicates that the livelihood resilience of worker households in state-owned forest areas in Northeast and Inner Mongolia is at a lower middle level. Among the dimensions, self-organization, 0.822, is the highest, whereas buffer capacity and learning capacity are low—only 0.223 and 0.281, respectively.
In the buffer capacity dimension, housing type and household head health are the better indicators. However, the number of houses, per capita floor area, bank savings, and per capita income are low. These results show that, with the resettlement policy of forest farms, worker households generally find themselves in better housing. The head of household is in good physical condition, which is conducive to the improvement of livelihood resilience. In the self-organization dimension, the values of the secondary indicators are all at a high level, which shows that in the state-owned forest areas of Northeast China households generally have a good social security situation. In the learning capacity dimension, education expenditure and vocational training are relatively low, which suggests that the SFEs should pay attention to improving their knowledge. In the face of new external disturbances, gaining new knowledge is conducive to improving their own abilities, thereby enhancing their livelihood resilience. From the perspective of weight, per capita floor area, bank savings, and per capita income account for a larger proportion of buffer capacity. Neighborhood relationship, home–hospital distance, and household relationship account for a larger proportion of self-organization. Education expenditure and vocational training account for the largest proportion of learning capacity.

5.1.2. The Distribution of the Livelihood Resilience

We calculated the ranges of livelihood resilience of worker households surveyed and found a distribution ranging between 0.192 and 0.710 for the preset lower limit of zero and upper limit of one with a standard deviation of 0.081. We divided the households into three groups using the mean and standard deviation of the distribution (Table 4). The group with the medium level of resilience accounts for 69.61% of all households. The range of the low livelihood resilience group is 0.192~0.360. The range of the medium livelihood resilience group is 0.361~0.522. The range of the high livelihood resilience group is 0.523~0.710. There are big differences in resilience compared to the disturbance from forest policy change among worker households. Therefore, the timely identification of households with low livelihood resilience is the key to improving livelihood resilience in the state-owned forests of Northeast China. Compared with the higher resilience group, there were big gaps in the lower resilience group’s self-organization and learning capacity. This implies that strengthening self-organization and learning capacity is the key to the improvement of the livelihood resilience of the less-resilient group. We also found that the buffer capacity of worker households in the state-owned forests of Northeast China and Inner Mongolia is low as a whole, and the gap is not big.
Specifically, the gap in vocational training among the households is relatively large (Table 5). The estimated value of the livelihood resilience of the low resilient group is only 0.009, while that of groups with a medium and high level of livelihood resilience are 0.271 and 0.863, respectively. The second important factor influencing the livelihood resilience is the distance from their home to hospitals. The resilience index value of the low livelihood resilience group is only 0.400, while that of the medium and high groups are 0.844 and 0.927, respectively. These results indicate that the homes of those in the low livelihood resilience group are far away from hospitals and less accessible to medical services. The third important factor for determining livelihood resilience is occupation type. Depending on the type of occupation, the value of the livelihood index differs. The index value of the low resilient group is 0.188, while that of the medium and high resilient groups are 0.396 and 0.643, respectively. The fourth factor of influence on livelihood resilience is knowledge of government policy. The index value of the low livelihood resilience group is only 0.507, while that of the medium and high livelihood resilience groups are 0.766 and 0.957, respectively. Only half of those in the low group had a clear understanding of the logging ban policy. This means that the government and enterprises need to increase publicity so that workers fully understand the policy.

5.2. The Influence on Livelihood Strategy

5.2.1. The Shifts of Livelihood Strategies

According to the utilization degree of forestry and ball-in-basin model, there are two trends in the livelihood strategies of worker households: the new forestry strategy—S1—and the non-forestry strategy–S2 (Figure 2). Forest-dependent is the typical traditional forestry strategy (S0). Part of the worker households fully play with the advantages of forestry, and then they enter the early stage of a new system (new forestry strategy, S1): forestry as a main job (S1-a). The improvement of livelihood diversity for worker households marks the beginning of the late stage of S1: forestry as a side job (S1-b). At the same time, some worker households are actively looking for other ways to make a living and gradually leave forestry. These worker households begin to adopt another strategy: the non-forestry strategy (S2).

5.2.2. The Livelihood Resilience of Different Livelihood Strategies

It is very important to find out the characteristics of livelihood resilience of different types of worker households for formulating targeted strategies to enhance livelihood resilience (Table 6). The scores for livelihood resilience are as follows: Forestry as a side job (0.474) > Forestry as a main job (0.461) > Diversified livelihood (0.436) > Forest dependent (0.418). These results show that the new forestry strategy (S1) has better livelihood resilience than others. In the buffer capacity dimension, forestry as a side job (0.279) is the highest resilience index score followed by forestry as a main job (0.251), diversified livelihood (0.214), and forest-dependent (0.183). Compared with other livelihood strategies, the forest-dependent strategy has big differences in occupation type, per capita income, bank savings, and household size. In the self-organization dimension, forestry as a side job (0.850) is the highest resilience index score followed by forestry as a main job (0.826), diversified livelihood (0.818), and forest-dependent (0.815). In the learning capacity dimension, forestry as a main job (0.306) is the highest resilience index score follow by forestry as a side job (0.292), diversified livelihood (0.277), and forest-dependent (0.256). In the face of external disturbances, it is of great significance to grasp the new direction in time. Learning capacity is slightly higher than buffer capacity. It also appears that those who adopt the forest-dependent strategy have less knowledge of policy compared with those who adopt other livelihood strategies.

5.2.3. The Correlates of Livelihood Strategy

To further clarify the key factors affecting the livelihood strategy shifts, we used the multinomial logistic regression model. First, we needed to know whether there are differences in livelihood resilience among various livelihood strategies. We used a one-way ANOVA and pairwise comparison. The results show the F value is 23.310 with a p = 0.000 (<0.05). The pairwise comparison results are in Table 7. They indicate that there are obvious differences among the four livelihood types. Then, the multinomial logistic regression model can be used. The results are shown in Table 8.
Per capita income is a significant positive correlation in all three models. These results show that income is the key factor of livelihood strategy shifts. Through field research, worker households are actively exploring other income channels to reduce their dependence on forestry to maintain livelihood and family living standards. Per capita floor area reflects the material living conditions of worker households. Per capita floor area is a significant negative correlation in the diversified livelihood strategy. This shows that the larger the per capita floor area, the lower the probability for people to change their livelihood strategy. This is mainly because the residences of worker households in the state-owned forests of Northeast China and Inner Mongolia are relatively concentrated, and the floor area is also relatively similar. Especially with the resettlement program, the housing was arranged by the government and SFEs to form a new community. The worker households have almost the same housing. Therefore, there is a lack of motivation to improve the living environment. Household size, household intergeneration, and labor force are significantly correlated to forestry as a side job and the diversified livelihood strategies. Large household size and multiple generations mean that the family has a high dependency ratio and needs to increase the source of income to maintain family spending. The education of the household head only affects forestry as a side job. The survey found that the education level of SFEs’ workers is low. Workers with high education are more likely to have stable and decent jobs in SFEs. They can earn a more stable income. Occupation type and medical insurance indicate the degree of social security of worker households. Occupation type is the only significant correlation in the diversified livelihood strategy, and the coefficient is negative. Therefore, the more cadres or managers in the household, the less likely they are to adopt a diversified livelihood strategy. Similarly, the more worker households have medical insurance, the less willing they are to transform their livelihood strategy.

6. Discussion

Under the background of the logging ban in the state-owned forest areas of Northeast China and Inner Mongolia, it is very necessary to investigate the livelihood resilience of worker households in due course. In order to maintain and improve livelihood resilience, worker households are making changes in their livelihood strategies to adapt to the new situation. Different livelihood strategies show different livelihood resilience. Therefore, continue to explore what factors have affected livelihood strategy shifts.

6.1. The Livelihood Resilience of Worker Households

We try to analyze livelihood resilience from three aspects: buffer capacity, self-organization, and learning capacity. The buffer capacity of worker households in the state-owned forest areas of Northeast China is the lowest among the three dimensions, which indicates that the basic capacity of worker households to face external disturbances is weak. Compared with other industrial sectors, the household income of the forest industry is obviously lower [15]. This has a direct impact on the resilience of worker households. Livelihood resilience in terms of learning capacity is slightly better than the buffer capacity, but the level is still low, which indicates that members of worker households in the state-owned forests of Northeast China and Inner Mongolia still think conservatively. The self-organization situation is the best, which indicates that the worker households have strong social cohesion. Such cohesion can significantly decrease the vulnerability of households and improve their livelihood resilience [20,32].
Most of the worker households—69.61%—have a medium livelihood resilience. The low livelihood resilience group has a larger gap in adapting to a new environment than the middle and high groups. We found that the low group’s vocational training, home–hospital, occupation type, and knowledge of policy have big gaps compared to the middle and high groups. Worker households must consciously learn new policies and new technologies. The government and SFEs should strengthen their service awareness and provide learning channels and infrastructure construction.
Therefore, to improve the livelihood resilience of worker households, we should focus on improving material and financial capital. The relevant policy should provide more support and increase the household’s income. At the same time, family members and neighbors should pay attention to communication to increase mutual trust and harmony. This helps to enhance the liquidity of information, while also raising awareness of learner autonomy and helping people keep abreast of the latest policy. This indicates that if the government wants to improve the livelihood resilience of households, they must pay attention to the vocational and technical training of households. The government should enrich the knowledge reserves within these households and enhance the social competitiveness of less resilient households. The government and SFEs should also increase training opportunities for workers. They also suggest that the government should invest more in the provision of basic medical services so that people can receive timely care.

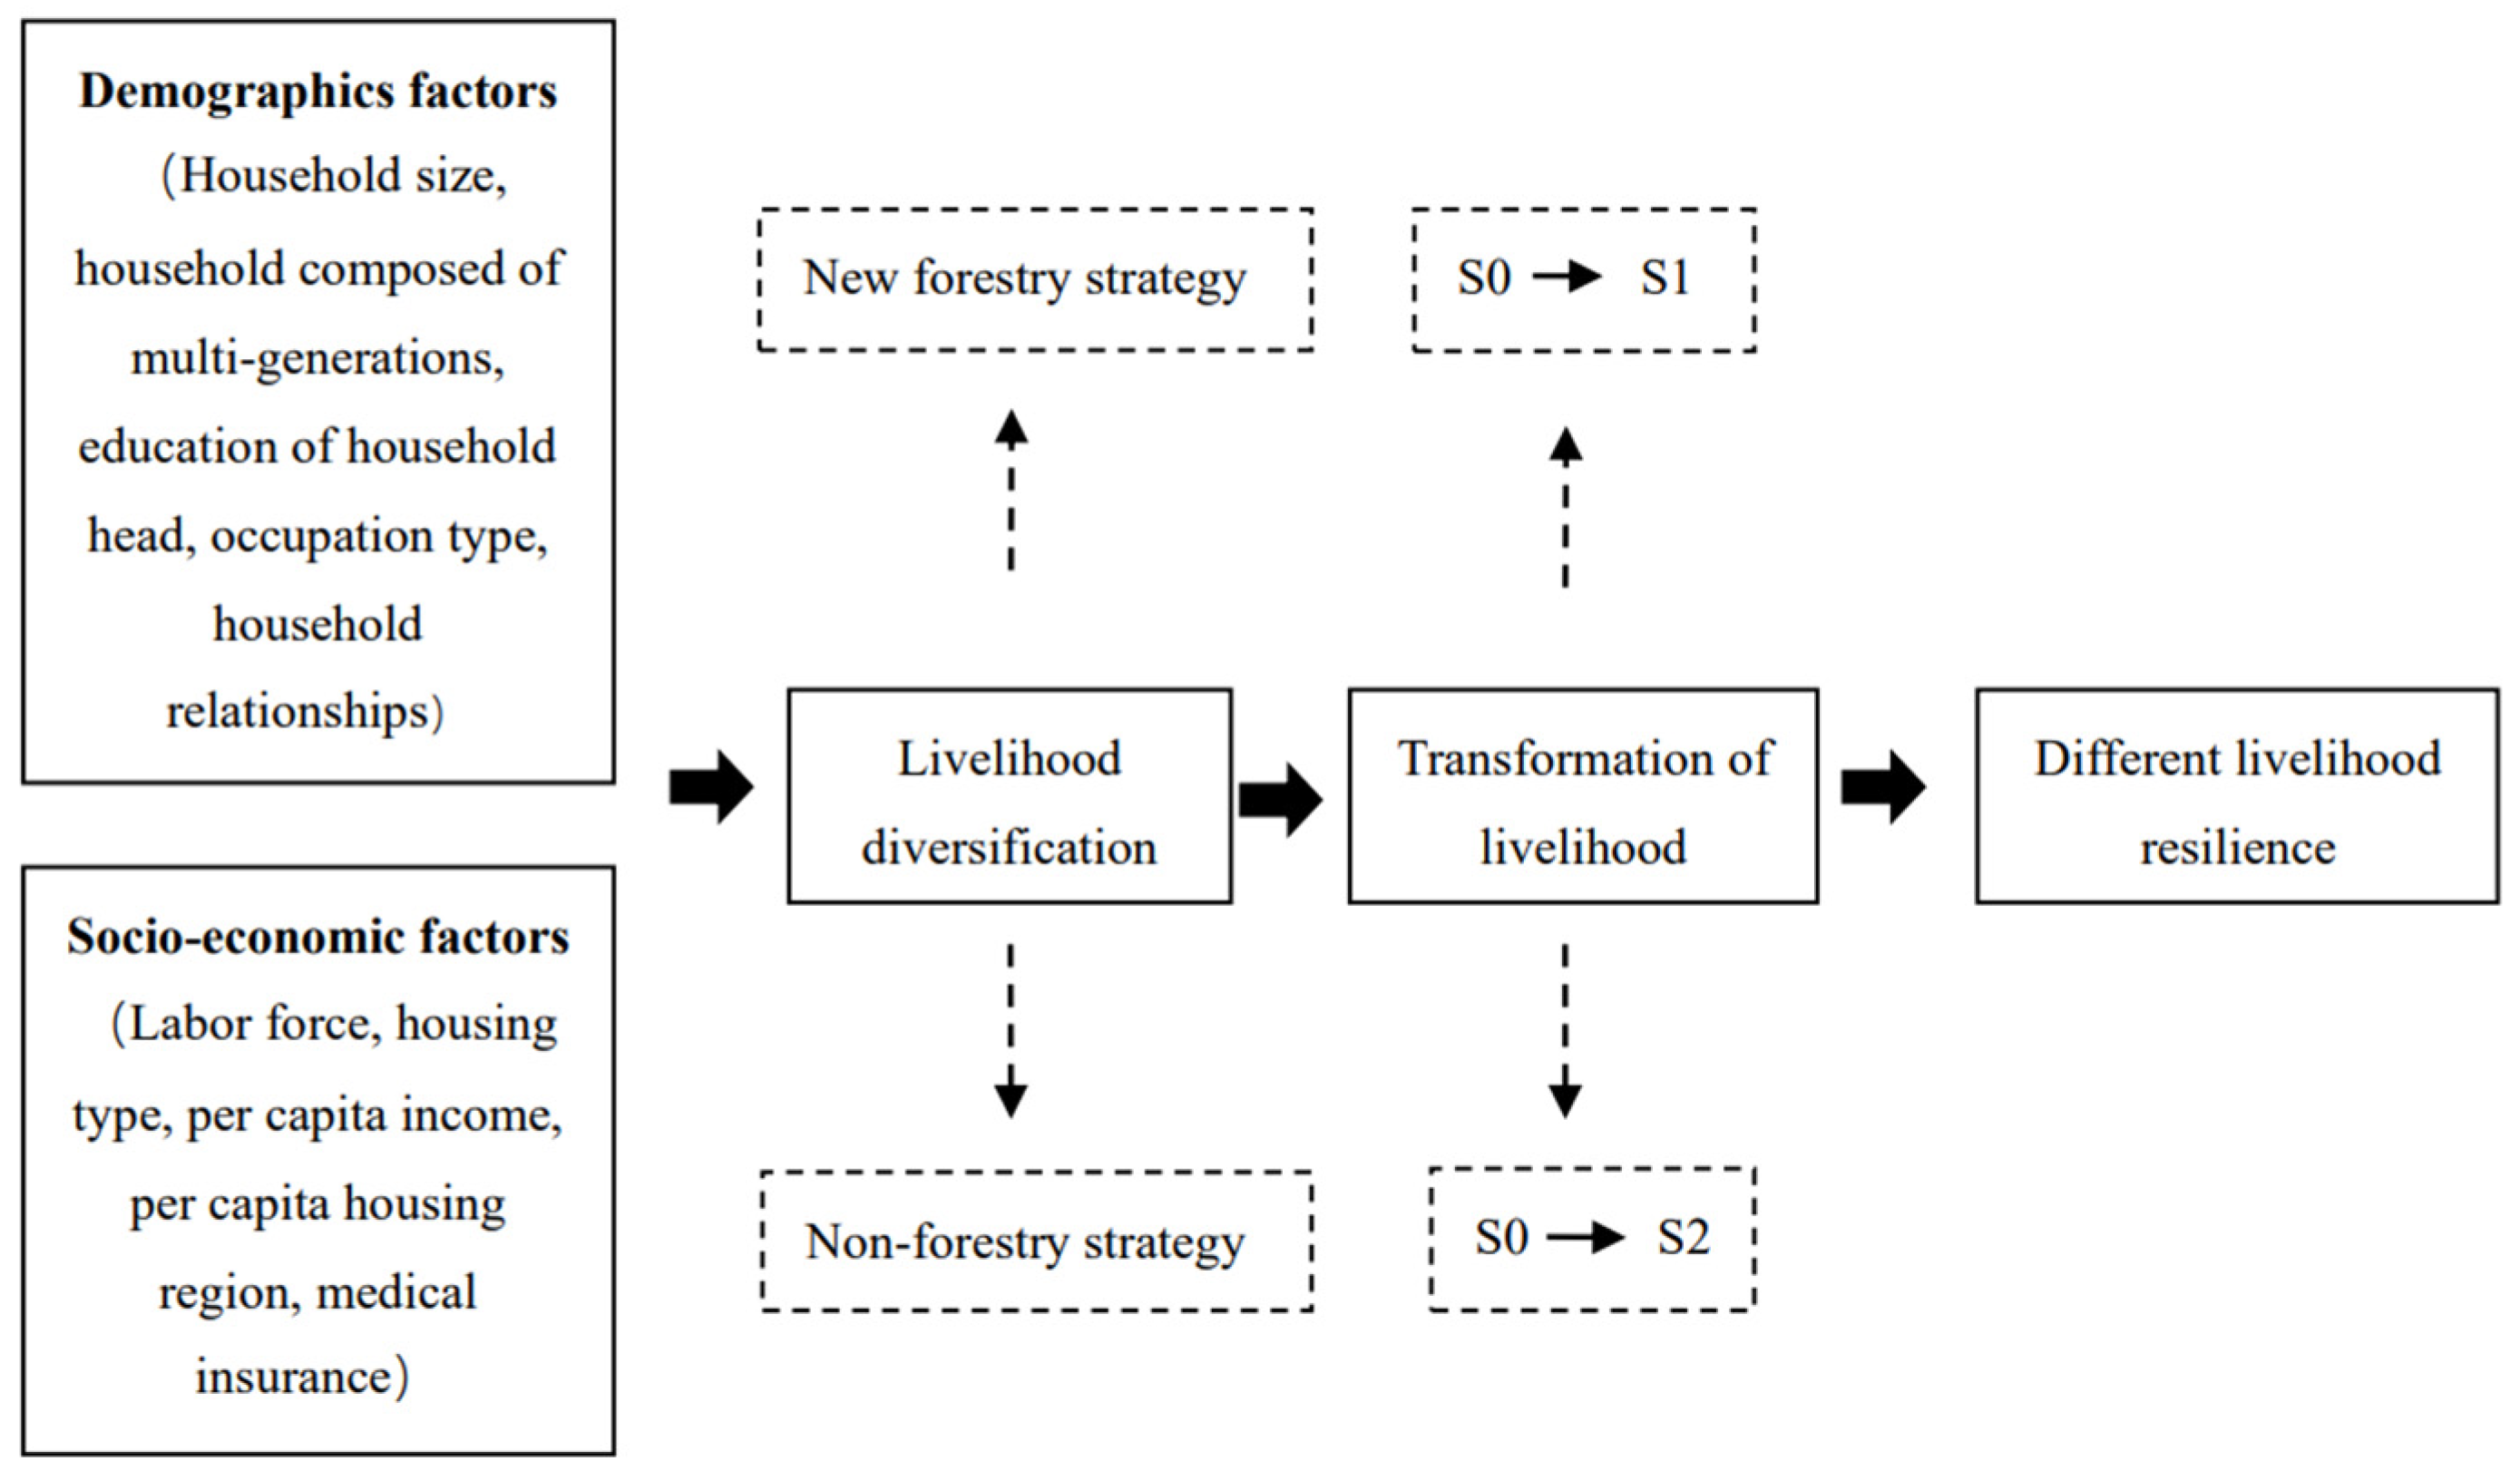
6.2. Influence Mechanism of Worker Households’ Livelihood Strategies

State policy for improving livelihood resilience should not only be concerned about maintaining the original livelihood state but also addressing the impact and consequences of the newly formed environment due to state interventions so that livelihood strategies are effectively transformed [7,28]. In response to economic and policy drivers, local residents try to do something to mitigate challenges from outside. SFEs actively develop NTFPs, forest tourism, carbon sinks, etc. In practice, worker households intend to diversify their income sources and avoid livelihood risks [25,33]. The diversification of livelihoods is conducive to improving the livelihood resilience of worker households [34,35]. Based on their livelihood capital, households choose different strategies to shield themselves from shocks [36]. Four adaptation strategies have been adopted gradually by worker households in the state-owned forests of northeast China and Inner Mongolia: forestry as a main job, forest-dependent, forestry as a side job, and diversified livelihood [25].
The different livelihood strategies of worker households reflect the heterogeneity of individual decision-making, resulting in various levels of livelihood resilience (Figure 3). From the results, there are two trends in livelihood strategies shifts: from traditional forestry strategy (S0) to new forestry strategy (S1) and non-forestry strategy (S2). Forestry as a side job (S1-b) has the best livelihood resilience, followed by forestry as a main job (S1-a), and diversified livelihood (S1). Forest-dependent (S0) is the worst strategy. The new forestry strategy (S1) has the best livelihood resilience compared to the traditional forestry strategy (S0) and non-forestry strategy (S2). Therefore, in order to enhance livelihood resilience, we should promote the adoption of the new forestry strategy (S1) by worker households. With the implementation of the policy that bans logging, S1 is rising in state-owned forest areas. The government has given a lot of policy support to encourage the transformation of the forestry economy, such as non-timber forest products, forest tourism, etc. In S1, the livelihood resilience of forestry as a side job (S1-b) is higher than that of forestry as a main job (S1-a). It shows that livelihood resilience is positively correlated with livelihood strategy shifts, which indicates that, with the deepening of the conversion degree of livelihood strategy, livelihood resilience can also be improved.
In a resource-based region, the loss of a resource advantage will have a greater impact on the livelihood of local households. Therefore, it is necessary to analyze the transformation mechanism of livelihood strategies and then promote the livelihood strategy shifts of worker households (Figure 3). Generally, the per capita floor area and per capita income play key roles in the livelihood strategy shifts of worker households. Household size, household intergeneration, and labor force determine the basic direction of livelihood strategy, specifically the choice of a new forestry strategy (S1) or non-forestry strategy (S2). The education of the household head, occupation type, household relationships, housing type, and medical insurance determine whether the households have the willingness to change their livelihood strategies. Specifically, households who do not have the capital and labor force to transform their livelihood strategy can only continue to rely on forestry. Therefore, for this part of worker households, the government and SFEs should help them expand the channels of capital, such as interest-free loans. At the same time, they should help them to join cooperatives and solve the problem of the labor shortage. In the case of a sufficient labor force, people are more inclined to change their livelihood strategy from forest-dependent to forest as a side job or diversified livelihood. This kind of household has a certain social status and social security. They are less willing to change their livelihood strategy. Given these findings, people may have the ability to change their minds and get out of their comfort zone.

7. Conclusions

On this basis, we analyzed the livelihoods of worker households and the differences among various livelihood strategies. Then, we analyzed the worker households’ livelihood strategy shifts by using the ball-in-basin model and analyzed the factors affecting livelihood strategy shifts by the multinomial logistic regression model. Our findings were as follows: (1) The overall livelihood resilience of worker households was moderate, which is neither good nor bad. Among dimensions, self-organization was the highest, and buffer capacity and learning capacity were poor. (2) There were obvious differences between the four livelihood strategies in regard to livelihood resilience. The better one was forestry as a side job, then forestry as a main job, diversified livelihood, and forest-dependent. (3) Per capita income and per capita floor area were key factors that affect livelihood strategy shifts. Household size, household intergeneration, and labor force determined the basic direction of livelihood strategies. The education of the household head, occupation type, household relationships, housing type, and medical insurance determined whether the households wanted to change their livelihood strategies.
The livelihood resilience of worker households, which is influenced by external policies, deserves extensive attention. Based on the above analysis, the following suggestions are put forward: (1) The buffer capacity should be enhanced. Continue to increase policy publicity and education to improve learning capacity. In addition to the support of national policies, we should enhance the quality and ability of worker households and stimulate the endogenous driving force for the survival and development of worker households in the state-owned forests of Northeast China. (2) Continue to improve the social security system and strengthen self-organization. The social security ability of the state-owned forests of Northeast China is impressive and should be maintained. It is necessary to provide worker households with better protection in terms of psychological health, which will enable individuals to cope with interference from the external environment and enhance overall livelihood resilience. (3) Take account of all of the advantages of forestry and promote the transformation of worker households to the new forestry strategy. The new forestry strategy should leverage the benefits of forestry and actively expand other livelihoods to mitigate the risks of less resilient livelihoods. The government and enterprises should provide funds, technology, and labor and establish cooperatives to help worker households transform their livelihood strategies.

Funding

This research received no external funding.

Institutional Review Board Statement

The study was conducted in accordance with the Declaration of Helsinki, and approved by National Forestry and Grassland Administration of China (JYC-2014-48).

Informed Consent Statement

Not applicable.

Data Availability Statement

The data are not publicly available due to the copyright of relevant data in the article belonging to the research group rather than to individuals.

Conflicts of Interest

The authors declare no conflict of interest.

References

  1. Liu, W.; Li, J.; Ren, L.; Xu, J.; Li, C.; Li, S. Exploring Livelihood Resilience and Its Impact on Livelihood Strategy in Rural China. Soc. Indic. Res. 2020, 150, 977–998. [Google Scholar] [CrossRef]
  2. Worku, A.; Pretzsch, J.; Kassa, H.; Auch, E. The significance of dry forest income for livelihood resilience: The case of the pastoralists and agro-pastoralists in the drylands of southeastern Ethiopia. For. Policy Econ. 2014, 41, 51–59. [Google Scholar] [CrossRef]
  3. Thulstrup, A.W. Livelihood Resilience and Adaptive Capacity: Tracing Changes in Household Access to Capital in Central Vietnam. World Dev. 2015, 74, 352–362. [Google Scholar] [CrossRef]
  4. Speranza, C.; Wiesmann, U.; Rist, S. An indicator framework for assessing livelihood resilience in the context of social–ecological dynamics. Glob. Environ. Chang. 2014, 28, 109–119. [Google Scholar] [CrossRef]
  5. Zhao, X.; Chen, H.; Zhao, H.; Xue, B. Farmer households’ livelihood resilience in ecological-function areas: Case of the Yellow River water source area of China. Environ. Dev. Sustain. 2021, 24, 9665–9686. [Google Scholar] [CrossRef]
  6. Tan, S.; Tan, Z. Grassland tenure, livelihood assets and pastoralists’ resilience: Evidence and empirical analyses from western China. Econ. Political Stud. 2017, 5, 381–403. [Google Scholar] [CrossRef]
  7. Wilmsen, B.; Webber, M. What can we learn from the practice of development-forced displacement and resettlement for organised resettlements in response to climate change? Geoforum 2015, 58, 76–85. [Google Scholar] [CrossRef]
  8. Liu, W.; Li, J.; Xu, J. Impact of the ecological resettlement program in southern Shaanxi Province, China on households’ livelihood strategies. For. Policy Econ. 2020, 120, 102310. [Google Scholar] [CrossRef]
  9. Ayeb-Karlsson, S.; van der Geest, K.; Ahmed, I.; Huq, S.; Warner, K. A people-centred perspective on climate change, environmental stress, and livelihood resilience in Bangladesh. Sustain. Sci. 2016, 11, 679–694. [Google Scholar] [CrossRef] [PubMed]
  10. Thijs, P.; Mustafa, B.M.; Duong, V.N.; Anh, T.T. Climate change and livelihood resilience capacities in the Mekong Delta: A case study on the transition to rice–shrimp farming in Vietnam’s Kien Giang Province. Clim. Chang. 2021, 164, 9. [Google Scholar]
  11. Geng, Y.; Sun, S.; Yeo-Chang, Y. Impact of Forest Logging Ban on the Welfare of Local Communities in Northeast China. Forests 2021, 12, 3. [Google Scholar] [CrossRef]
  12. Xu, J.; Katsigris, E.; White, T.A. Implementing the Natural Forest Protection Program and the Sloping Land Conversion Program: Lessons and Policy Recommendations; China Forestry Publishing House: Beijing, China, 2002. [Google Scholar]
  13. Wang, S.; Cornelis van Kooten, G.; Wilson, B. Mosaic of reform: Forest policy in post-1978 China. For. Policy Econ. 2004, 6, 71–83. [Google Scholar] [CrossRef]
  14. Geng, Y.; Wan, Z.; Wei, L.; Min, L. Study on Process and Policies of the Reform of Stated-owned Forest Regions—Based on the Investigations on Forestry Industrial Group of Longjiang and Forestry Group of Daxing’anling Region. For. Econ. 2017, 2, 2–11. [Google Scholar]
  15. Zhu, H.; Hu, S.; Ren, Y.; Ma, X.; Cao, Y. Determinants of engagement in non-timber forest products (NTFPs) business activities: A study on worker households in the forest areas of Daxinganling and Xiaoxinganling Mountains, northeastern China. For. Policy Econ. 2017, 80, 125–132. [Google Scholar] [CrossRef]
  16. Wan, Z.; Liu, X.; Liu, J.; Ren, Y.; Cao, Y. Formation and evolution of China’s state-owned forest management system. World For. Res 2024, 1, 1–8. [Google Scholar]
  17. Dai, L.; Li, S.; Zhou, W.; Qi, L.; Zhou, L.; Wei, Y.; Li, J.; Shao, G.; Yu, D. Opportunities and challenges for the protection and ecological functions promotion of natural forests in China. For. Ecol. Manag. 2018, 410, 187–192. [Google Scholar] [CrossRef]
  18. Zhang, X.; Kang, L.; Huang, W. Study on the Vocational Adaptability of Re-Employment Workers in Northeast State-Owned Forest Region: Based on the Empirical Data of Yichun Forest Region. Issues For. Econ. 2017, 37, 8–13. [Google Scholar]
  19. Eriksson, H.; Blythe, J.; Osterblum, H.; Olsson, P. Beyond social-ecological traps: Fostering transformations towards sustainability. Ecol. Soc. 2021, 26, 13. [Google Scholar] [CrossRef]
  20. Quandt, A. Measuring livelihood resilience: The household livelihood resilience approach (HLRA). World Dev. 2018, 107, 253–263. [Google Scholar] [CrossRef]
  21. Liu, S.; Xu, J. Livelihood mushroomed: Examining household level impacts of non-timber forest products (NTFPs) under new management regime in China’s state forests. For. Policy Econ. 2019, 98, 44–53. [Google Scholar] [CrossRef]
  22. Jiang, X.; Gong, P.; Bostedt, G.; Xu, J. Impacts of policy measures on the development of state-owned forests in northeast China: Theoretical results and empirical evidence. Environ. Dev. Econ. 2014, 19, 74–91. [Google Scholar] [CrossRef]
  23. Wang, H.; Zhang, H.; Xu, J. Impact of reform on household income in the key state-owned forest areas. J. Zhejiang AF Univ. 2016, 33, 680–688. [Google Scholar]
  24. Yu, D.; Zhou, L.; Zhou, W.; Ding, H.; Wang, Q.; Wang, Y.; Wu, X.; Dai, L. Forest management in Northeast China: History, problems, and challenges. Environ. Manag. 2011, 48, 1122–1135. [Google Scholar] [CrossRef]
  25. Zhu, H.; Hu, S. The Effect on Livelihood Styles Differentiation of Worker Households in Key National Forest Areas by Comprehensive “Stop Cutting” Policy. For. Econ. 2016, 38, 8–12. [Google Scholar]
  26. Liu, W.; Xu, J.; Li, J. The influence of poverty alleviation resettlement on rural household livelihood vulnerability in the western mountainous areas, China. Sustainability 2018, 10, 2793. [Google Scholar] [CrossRef]
  27. Fang, Y.-P.; Zhu, F.-B.; Qiu, X.-P.; Zhao, S. Effects of natural disasters on livelihood resilience of rural residents in Sichuan. Habitat Int. 2018, 76, 19–28. [Google Scholar] [CrossRef]
  28. Sina, D.; Chang-Richards, A.Y.; Wilkinson, S.; Potangaroa, R. A conceptual framework for measuring livelihood resilience: Relocation experience from Aceh, Indonesia. World Dev. 2019, 117, 253–265. [Google Scholar] [CrossRef]
  29. Shi, C.P.; Yang, X.J.; Wang, Z.Q.; Chen, J.; Liu, Q. Peasant household system regime shift and its influence mechanism based on drought vulnerability: A case study of zhonglianchuan township in yuzhong county. Hum. Geogr. 2015, 30, 77–82. [Google Scholar]
  30. Müller, D.; Sun, Z.; Vongvisouk, T.; Pflugmacher, D.; Xu, J.; Mertz, O. Regime shifts limit the predictability of land-system change. Glob. Environ. Chang. 2014, 28, 75–83. [Google Scholar] [CrossRef]
  31. Jie, L.I. On Rural Households’ Forestry-related Livelihood Choice in the Mountainous Areas in West of China and Influencing Factors. China Popul. Resour. Environ. 2010, 87, 8–16. [Google Scholar]
  32. Adams, A.M.; Cekan, J.; Sauerborn, R. Towards a conceptual framework of household coping: Reflections from rural West Africa. Africa 1998, 68, 263–283. [Google Scholar] [CrossRef]
  33. Liu, K.; Liang, Y.; He, H.S.; Wang, W.J.; Huang, C.; Zong, S.; Wang, L.; Xiao, J.; Du, H. Long-Term Impacts of China’s New Commercial Harvest Exclusion Policy on Ecosystem Services and Biodiversity in the Temperate Forests of Northeast China. Sustainability 2018, 10, 1071. [Google Scholar] [CrossRef]
  34. Marschke, M.J.; Berkes, F. Exploring strategies that build livelihood resilience: A case from Cambodia. Ecol. Soc. 2006, 11, 42. [Google Scholar] [CrossRef]
  35. Purcell, S.; Tagliafico, A.; Cullis, B.; Gogel, B. Socioeconomic impacts of resource diversification from small-scale fishery development. Ecol. Soc. 2021, 26, 14. [Google Scholar] [CrossRef]
  36. Jezeer, R.E.; Verweij, P.A.; Boot, R.G.; Junginger, M.; Santos, M.J. Influence of livelihood assets, experienced shocks and perceived risks on smallholder coffee farming practices in Peru. J. Environ. Manag. 2019, 242, 496–506. [Google Scholar] [CrossRef]
Figure 1. The scheme of system regime shift.
Sustainability 17 00298 g001
Figure 2. Schematic diagram of the livelihood strategy shifts.
Sustainability 17 00298 g002
Figure 3. Influence mechanism of worker households’ livelihood strategies.
Sustainability 17 00298 g003
Table 1. The evaluation index system of worker households’ livelihood resilience.
DimensionIndicatorIndicator Assignment and Meaning (Units)
Buffer capacityHousehold sizeThe population of each household (Number)
Household head healthVery bad = 1; poor = 2; general = 3; good = 4; very good = 5
Education of household headSchool years of household head (Years)
Number of housesThe number of houses for each household (Number)
Housing typeReinforced concrete = 1; Brick = 0
Per capita housing regionPer capita housing region (m2)
Per capita incomePer capita income (RMB)
Bank savings<10,000 RMB = 1; 20,000–30,000 RMB = 2; 30,000–50,000 RMB = 3; 50,000–100,000 RMB = 4; >100,000 RMB = 5
Occupation typeManager = 1; worker = 0
Self-organizationEndowment insuranceWhether household head has endowment insurance (Yes = 1; No = 2)
Medical insuranceWhether household head has medical insurance (Yes = 1; No = 2)
Home–road distance>11 km = 1; 5~10 km = 2; 3~5 km = 3; 1~3 km = 4; <1 km = 5
Home–hospital distance>11 km = 1; 5~10 km = 2; 3~5 km = 3; 1~3 km = 4; <1 km = 5
Household relationshipVery unsatisfactory = 1; unsatisfactory = 2; neutral = 3; basic satisfaction = 4; very satisfied = 5
Neighborhood relationshipVery unsatisfactory = 1; unsatisfactory = 2; neutral = 3; basic satisfaction = 4; very satisfied = 5
Learning capacityEducation expenditureThe education expenditure of household (RMB)
Work experienceThe work experience of household head (Years)
Vocational trainingWhether household head has vocational training (Yes = 1; No = 0)
Knowledge of policyUnderstand clearly = 1; understand unclearly = 0
Table 2. Basic characteristics of survey sample.
CategoriesNumberProportion
Gender of household headMale145792.63%
Female1167.37%
Marital status of household headUnmarried136286.59%
Married956.04%
Age of household head (years)≤301308.26%
31–4034521.93%
41–5073546.73%
51–6036022.89%
>6130.19%
Educational level of household headPrimary school00.00%
Junior middle school39925.37%
High school46229.37%
University or above71245.26%
Household size≤3140689.38%
>416710.62%
Table 3. The livelihood resilience of worker households in the state-owned forest areas in Northeast China and Inner Mongolia.
DimensionWeightValueIndicatorWeightValue
Livelihood resilience
0.442
Buffer capacity0.3330.223Household size0.0830.369
Household head health0.0400.620
Education of household head0.0800.379
Number of houses0.2200.070
Housing type0.0310.689
Per capita housing region0.1690.130
Per capita income0.1440.175
Bank savings0.1590.146
Occupation type0.0740.407
Self-organization0.3330.822Endowment insurance0.0150.990
Medical insurance0.0180.987
Home–road distance0.0650.955
Home–hospital distance0.3270.795
Household relationship0.2470.840
Neighborhood relationship 0.3290.793
Learning capacity0.3330.281Education expenditure0.4820.128
Work experience0.1930.439
Vocational training0.2600.330
Knowledge of policy 0.0640.760
Table 4. Internal distribution of livelihood resilience.
LevelLivelihood ResilienceNumberProportion
Low0.192~0.36022314.18%
Medium0.361~0.522109569.61%
High0.523~0.71025516.21%
Table 5. The resilience of worker households with low, medium, and high level.
Low
Group
Medium
Group
High
Group
Differences Between Low and High Group
Buffer capacity0.1550.2190.2980.143
Household size0.3660.3680.3760.010
Household head health0.5370.6230.6810.144
Education of household head0.2980.3770.4560.158
Number of houses0.0200.0650.1350.115
Housing type0.4800.7090.7880.308
Per capita housing region0.1080.1310.1430.035
Per capita income0.1400.1710.2270.087
Bank savings0.0480.1350.2790.231
Occupation type0.1880.3960.6430.455
Self-organization0.6420.8380.9110.269
Endowment insurance0.9780.9901.0000.022
Medical insurance0.9690.9881.0000.031
Home–road distance0.8670.9670.9820.115
Home–hospital distance0.4000.8440.9270.527
Household relationship0.7620.8390.9160.154
Neighborhood relationship 0.7160.7920.8670.151
Learning capacity0.1740.2670.4370.263
Education expenditure0.1080.1300.1380.030
Work experience0.4480.4380.437−0.011
Vocational training0.0090.2710.8630.854
Knowledge of policy 0.5070.7660.9570.450
Livelihood resilience0.3240.4420.5480.224
Table 6. The resilience of worker households with different livelihood strategies.
Forest-Dependent (S0)Forestry as Main Job (S1-a)Forestry as Side Job (S1-b)Diversified Livelihood (S2)
Buffer capacity0.1830.2510.2790.214
Household size0.3230.3820.4310.375
Household head health0.5970.6680.6430.592
Education of household head0.3560.4570.3780.331
Number of houses0.0390.0730.1370.073
Housing type0.6560.7740.6870.644
Per capita housing region0.1470.1240.1250.123
Per capita income0.0980.1910.2910.190
Bank savings0.0830.1650.2210.157
Occupation type0.3110.5600.5110.325
Self-organization0.8150.8260.8500.818
Endowment insurance0.9900.9911.0000.986
Medical insurance0.9900.9911.0000.979
Home–road distance0.9510.9540.9470.962
Home–hospital distance0.7860.8080.8280.782
Household relationship0.8330.8400.8800.837
Neighborhood relationship 0.7870.7910.8150.795
Learning capacity0.2560.3060.2920.277
Education expenditure0.1190.1770.0940.103
Work experience0.3970.4040.4850.486
Vocational training0.3010.3500.3740.323
Knowledge of policy 0.6760.8010.8630.762
Livelihood resilience0.4180.4610.4740.436
Table 7. The pairwise comparison among different livelihood strategies.
Livelihood Strategy ILivelihood Strategy JMean
Difference
(I-J)
Std. ErrorSig.95% Confidence Interval
Lower BoundUpper Bound
Forest-dependent
(S0)
Forestry as main job−0.030 ***0.0050.000 −0.0410.041
Forestry as side job−0.062 ***0.0080.000 −0.078−0.017
Diversified livelihood−0.021 ***0.0050.000 −0.0310.019
Forestry as main job
(S1-a)
Forest-dependent0.030 ***0.0050.000 0.020−0.020
Forestry as side job−0.032 ***0.0080.000 −0.047−0.047
Diversified livelihood0.009 *0.0050.056 0.000−0.011
Forestry as side job
(S1-b)
Forestry as main job0.032 ***0.0080.000 0.0170.047
Forest-dependent0.062 ***0.0080.000 0.0470.078
Diversified livelihood0.042 ***0.0080.000 0.0260.056
Diversified livelihood
(S2)
Forestry as main job−0.009 *0.0050.056 −0.0190.000
Forest-dependent0.021 ***0.0050.000 0.0110.031
Forestry as side job−0.041 ***0.0080.000 −0.056−0.026
*** and * indicate significance at the 1% and 10% levels, respectively.
Table 8. Determinants of livelihood strategy choice.
VariableForestry as Main Job
(S1-a)
Forestry as Side Job
(S1-b)
Diversified Livelihood (S2)
CoefficientStd. ErrorCoefficientStd. ErrorCoefficientStd. Error
Constant−16.868 ***2.536−53.8981521.139−18.317 ***2.474
Per capita income0.000 ***0.0000.000 ***0.0000.000 ***0.000
Per capita housing region−0.062 ***0.013−0.035 **0.017−0.040 ***0.013
Household size2.8440.7912.167 **0.8612.037 ***0.757
Household composed of multi-generations0.5440.7281.414 *0.7571.418 **0.689
Labor force0.4710.7322.700 ***0.7811.691 **0.698
Education of household head0.125 **0.0500.0280.068−0.0150.048
Occupation type0.1520.2510.0520.337−0.433 *0.252
Household relationships0.1130.1980.474 *0.2810.0200.188
Housing type0.581 **0.2590.4950.3510.439 *0.244
Medical insurance−2.769 *1.4509.6031041.328−4.192 *1.340
Obs.1573
LR chi2(63)1433.730
Prob. > chi20.000
Pseudo R20.355
***, **, and * indicate significance at the 1%, 5%, and 10% levels, respectively.
Disclaimer/Publisher’s Note: The statements, opinions and data contained in all publications are solely those of the individual author(s) and contributor(s) and not of MDPI and/or the editor(s). MDPI and/or the editor(s) disclaim responsibility for any injury to people or property resulting from any ideas, methods, instructions or products referred to in the content.

