
Assessing Temperature Change Impact in the Wake of Ongoing Land Use Change: A Case Study at Lake Dianshan


Abstract
1. Introduction
2. Materials and Methods
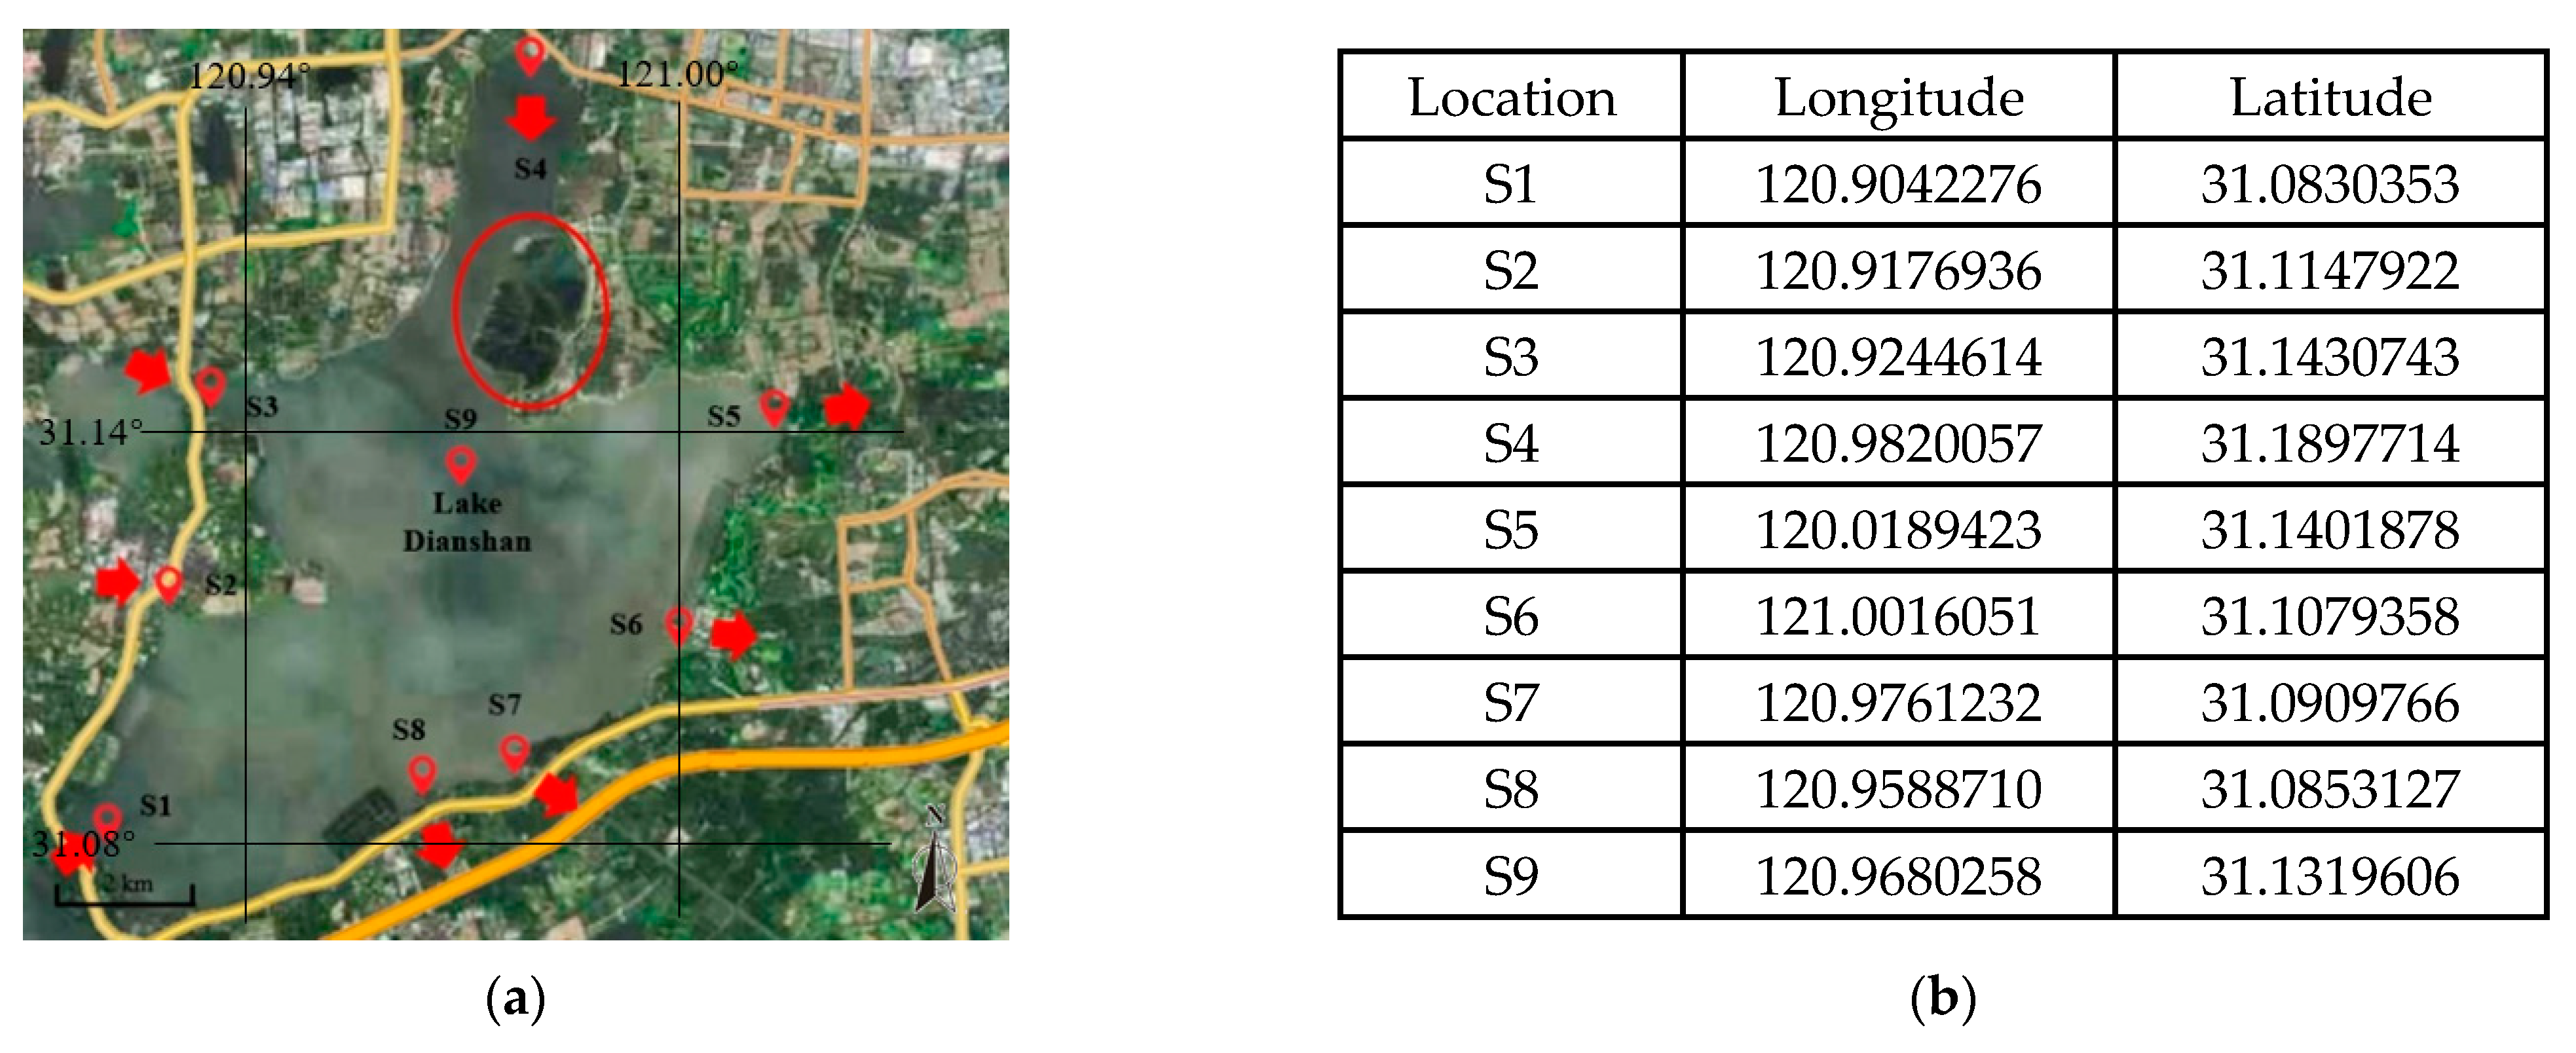
2.1. Study Area
2.2. Data Resource and Processing
2.3. Methods
3. Results
4. Discussion
5. Perspective and Outlooks
6. Conclusions
Author Contributions
Funding
Institutional Review Board Statement
Informed Consent Statement
Data Availability Statement
Conflicts of Interest
References
- Chuai, X.; Chen, X.; Yang, L.; Zeng, J.; Miao, A.; Zhao, H. Effects of climatic changes and anthropogenic activities on lake eutrophication in different ecoregions. Int. J. Environ. Sci. Technol. 2012, 9, 503–514. [Google Scholar] [CrossRef]
- Jeppesen, E.; Meerhoff, M.; Dvaidson, T.A.; Trolle, D.; Sondergaard, M.; Lauridsen, T.L.; Beklioglu, M.; Brucet, S.; Volta, P.; Gonzalez-Bergonzoni, I.; et al. Climate change impacts on lakes: An integrated ecological perspective based on a multi-faceted approach, with special focus on shallow lakes. J. Limnol. 2014, 73, 88–111. [Google Scholar] [CrossRef]
- Feuchtmayr, H.; Moran, R.; Hatton, K.; Connor, L.; Heyes, T.; Moss, B.; Harvey, I.; Atkinson, D. Global warming and eutrophication: Effects on water chemistry and autotrophic communities in experimental hypertrophic shallow lake mesocosms. J. Appl. Ecol. 2009, 46, 713–723. [Google Scholar] [CrossRef]
- Moe, S.J.; Couture, R.; Haande, S.; Lyche, S.A. Predicting Lake Quality for the Next Generation: Impacts of Catchment Management and Climatic Factors in a Probabilistic Model Framework. Water 2019, 11, 1767. [Google Scholar] [CrossRef]
- Longyang, Q. Assessing the effects of climate change on water quality of plateau deep-water lake—A study case of Hongfeng Lake. Sci. Total Environ. 2019, 647, 1518–1530. [Google Scholar] [CrossRef]
- Qin, B.; Deng, J.; Shi, K.; Wang, J.; Brookes, J.; Zhou, J.; Zhang, Y.; Zhu, G.; Paerl, H.W.; Wu, L. Extreme Climate Anomalies Enhancing Cyanobacterial Blooms in Eutrophic Lake Taihu, China. Water Resour. Res. 2021, 57, e2020WR029371. [Google Scholar] [CrossRef]
- Monchamp, M.; Spaak, P.; Domaizon, I.; Dubois, N.; Bouffard, D.; Pomati, F. Homogenization of lake cyanobacterial communities over a century of climate change and eutrophication. Nat. Ecol. Evol. 2018, 2, 317–324. [Google Scholar] [CrossRef] [PubMed]
- Moss, B.; Kosten, S.; Meerhoof, M.; Battarbee, R.W.; Jeppesen, E.; Mazzeo, N.; Havens, K.; Lacerot, G.; Liu, Z.; Meester, L.D.; et al. Allied attack: Climate change and eutrophication. Inland Waters 2011, 1, 101–105. [Google Scholar] [CrossRef]
- Pazzaglia, J.; Santillán-Sarmiento, A.; Helber, S.B.; Ruocco, M.; Terlizzi, A.; Marín-Guirao, L.; Procaccini, G. Does Warming Enhance the Effects of Eutrophication in the Seagrass Posidonia oceanica? Front. Mar. Sci. 2020, 7, 564805. [Google Scholar] [CrossRef]
- Deng, J.; Qin, B.; Sarvala, J.; Salmaso, N.; Zhu, G.; Ventelä, A.; Zhang, Y.; Gao, G.; Nurminen, L.; Kirkkala, T.; et al. Phytoplankton assemblages respond differently to climate warming and eutrophication: A case study from Pyhäjärvi and Taihu. J. Great Lakes Res. 2016, 42, 386–396. [Google Scholar] [CrossRef]
- Moss, B. Cogs in the endless machine: Lakes, climate change and nutrient cycles: A review. Sci. Total Environ. 2012, 434, 130–142. [Google Scholar] [CrossRef] [PubMed]
- Deng, J.M.; Zhang, Y.L.; Qin, B.Q.; Yao, X.L.; Deng, Y.B. Trends of publications related to climate change and lake research from 1991 to 2015. J. Limnol. 2017, 76, 439–450. [Google Scholar] [CrossRef]
- Sinha, E.; Michalak, A.M.; Balaji, V. Eutrophication will increase during the 21st century as a result of precipitation changes. Science 2017, 357, 405–408. [Google Scholar] [CrossRef]
- Liao, M.N.; Yu, G.; Guo, Y. Eutrophication in Poyang Lake (Eastern China) over the last 300 years in response to changes in climate and lake biomass. PLoS ONE 2017, 12, e0169319. [Google Scholar] [CrossRef] [PubMed]
- Kraemer, B.M.; Anneville, O.; Chandra, S.; Dix, M.; Kuusisto, E.; Livingstone, D.M.; Rimmer, A.; Schladow, S.G.; Silow, E.; Sitoki, L.M.; et al. Morphometry and average temperature affect lake stratification responses to climate change. Geophys. Res. Lett. 2015, 42, 4981–4988. [Google Scholar] [CrossRef]
- García-Girón, J.; Fernández-Aláez, C.; Fernández-Aláez, M.; Nistal-García, A. Changes in climate, land use and local conditions drive macrophyte assemblages in a Mediterranean shallow lake. Limnetica 2018, 37, 159–172. [Google Scholar] [CrossRef]
- Adrian, R.; Zagarese, H.; Baines, S.B.; Hessen, D.O.; Keller, W.; Livingstone, D.M.; Sommaruga, R.; Straile, D.; Donk, E.V.; Weyhenmeyer, G.A.; et al. Lakes as sentinels of climate change. Limnol. Oceanogr. 2009, 54 Pt 2, 2283–2297. [Google Scholar] [CrossRef] [PubMed]
- Chen, L.; Zhao, J.J.; Zhang, Z.P.; Shen, Z.W.; Dong, W.M.; Ma, R.; Chen, J.; Niu, L.L.; Chen, S.Q.; Wu, D.; et al. Lake eutrophication in northeast China induced by the recession of the East Asian summer monsoon. Quat. Sci. Rev. 2022, 281, 107448. [Google Scholar] [CrossRef]
- Davidson, T.A.; Audet, J.; Jeppesen, E.; Landkildehus, F.; Lauridsen, T.L.; Søndergaard, M.; Syväranta, J. Synergy between nutrients and warming enhances methane ebullition from experimental lakes. Nat. Clim. Chang. 2018, 8, 156–160. [Google Scholar] [CrossRef]
- Brias, A.; Mathias, J.; Deffuant, G. Inter-annual rainfall variability may foster lake regime shifts: An example from Lake Bourget in France. Ecol. Model. 2018, 389, 11–18. [Google Scholar] [CrossRef]
- Wang, J.; Zhao, Q.; Pang, Y.; Hu, K. Research on nutrient pollution load in Lake Taihu, China. Environ. Sci. Pollut. Res. 2017, 24, 17829–17838. [Google Scholar] [CrossRef] [PubMed]
- Qin, B.; Zhang, Y.; Zhu, G.; Gao, G. Eutrophication control of large shallow lakes in China. Sci. Total Environ. 2023, 881, 163494. [Google Scholar] [CrossRef] [PubMed]
- Raulino, J.B.S.; Silveira, C.S.; Neto, I.E.L. Assessment of climate change impacts on hydrology and water quality of large semi-arid reservoirs in Brazil. Hydrol. Sci. J. 2021, 66, 1321–1336. [Google Scholar] [CrossRef]
- Radbourne, A.D.; Ryves, D.B.; Madgwick, G.; Anderson, N.J. The Influence of Climate Change on the Restoration Trajectory of a Nutrient-Rich Deep Lake. Ecosystems 2020, 23, 859–872. [Google Scholar] [CrossRef]
- Huo, S.; He, Z.; Ma, C.; Zhang, H.; Xi, B.; Xia, X.; Xu, Y.; Wu, F. Stricter nutrient criteria are required to mitigate the impact of climate change on harmful cyanobacterial blooms. J. Hydrol. 2019, 569, 698–704. [Google Scholar] [CrossRef]
- Wang, L.; Zeng, X.; Yu, H. Association between lake sediment nutrients and climate change, human activities: A time-series analysis. Environ. Manag. 2022, 70, 117–133. [Google Scholar] [CrossRef] [PubMed]
- Hu, C.; Xu, H.; Shi, S.; Lan, J.; Zhou, K.; Zhang, J.; Song, Y.; Wang, J.; Fu, P. Sedimentary organic matter molecular composition reveals the eutrophication of the past 500 years in Lake Daihai, Inner Mongolia. Environ. Res. 2023, 227, 115753. [Google Scholar] [CrossRef] [PubMed]
- Fang, Z.; Ding, T.; Chen, J.; Xue, S.; Zhou, Q.; Wang, Y.; Wang, Y.; Huang, Z.; Yang, S. Impacts of land use/land cover changes on ecosystem services in ecologically fragile regions. Sci. Total Environ. 2022, 831, 154967. [Google Scholar] [CrossRef]
- Zhang, Z.; Wei, Y.; Li, X.; Wan, D.; Shi, Z. Study on Tianjin Land-Cover Dynamic Changes, Driving Factor Analysis, and Forecasting. Land 2024, 13, 726. [Google Scholar] [CrossRef]
- Lv, Z.; Wang, F.; Cui, G.; Benediktsson, J.A.; Sun, W. Spatial–Spectral Attention Network Guided with Change Magnitude Image for Land Cover Change Detection Using Remote Sensing Images. IEEE Trans. Geosci. Remote Sens. 2022, 60, 1–12. [Google Scholar] [CrossRef]
- Xiao, Q.; Duan, H.; Qin, B.; Hu, Z.; Zhang, M.; Qi, T.; Lee, X. Eutrophication and temperature drive large variability in carbon dioxide from China’s Lake Taihu. Limnol. Oceanogr. 2021, 67, 379–391. [Google Scholar] [CrossRef]
- GB/T 17141-1997; Soil Quality-Determination of Lead, Cadmium-Graphite Furnace Atomic Absorption Spectrophotometry. Ministry of Ecology and Environment of the PRC: Bejing, China, 1998.
- HJ 632-2011; Soil-Determination of Total Phosphorus by Alkali Fusion–Mo-Sb Anti Spectrophotometric Method. Ministry of Ecology and Environment of the PRC: Bejing, China, 2012.
- HJ 711-2014; Solid Waste—Determination of Phenolic Compounds—Gas Chromatography. Ministry of Ecology and Environment of the PRC: Bejing, China, 2015.
- HJ 962-2018; Soil—Determination of pH Potentiometry. Ministry of Ecology and Environment of the PRC: Bejing, China, 2019.
- NY/T52-1987; Method for the Determination of Soil Water Content. Ministry of Ecology and Environment of the PRC: Bejing, China, 1987.
- HJ634-2012; Soil-Determination of Ammonium, Nitrite and Nitrate by Extraction with Potassium Chloride Solution-Spectrophotometric Methods. Ministry of Ecology and Environment of the PRC: Bejing, China, 2012.
- HJ 803-2016; Soil and Sediment-Determination of Aqua Regia Extracts of 12 Metal Elements-Inductively Coupled Plasma Mass Spectrometry. Ministry of Ecology and Environment of the PRC: Bejing, China, 2016.
- Dong, L.; Gong, C.; Huai, H.; Wu, E.; Lu, Z.; Hu, Y.; Li, L.; Yang, Z. Retrieval of Water Quality Parameters in Dianshan Lake Based on Sentinel-2 MSI Imagery and Machine Learning: Algorithm Evaluation and Spatiotemporal Change Research. Remote Sens. 2023, 15, 5001. [Google Scholar] [CrossRef]


| Site | TP [mg/L] | TN [mg/L] | Chl-a [μg/L] | NO3-N [mg/L] | Sb [mg/L] | CODMn [mg/L] |
|---|---|---|---|---|---|---|
| S1 | 0.16 | 2.25 | 106.04 | 0.114 | 0.0020 | 3.44 |
| S2 | 0.07 | 1.32 | 35.42 | 0.651 | 0.0018 | 3.96 |
| S3 | 0.12 | 0.66 | 28.83 | 0.041 | 0.0016 | 3.72 |
| S4 | 0.10 | 1.31 | 67.36 | 0.442 | 0.0015 | 4.07 |
| S5 | 0.15 | 1.74 | 56.94 | 0.056 | 0.0019 | 4.98 |
| S6 | 0.16 | 0.95 | 41.47 | 0.019 | 0.0018 | 3.88 |
| S7 | 0.09 | 0.93 | 6.03 | 0.342 | 0.0019 | 3.62 |
| S8 | 0.05 | 1.11 | 6.22 | 0.533 | 0.0019 | 3.81 |
| S9 | 0.14 | 1.04 | 70.20 | 0.008 | 0.0018 | 3.99 |
| Site | TP [mg/L] | TN [mg/L] | Chl-a [μg/L] | NO3-N [mg/L] | Sb [mg/L] | CODMn [mg/L] |
|---|---|---|---|---|---|---|
| S1 | 0.14 | 1.34 | 14.95 | 0.342 | 0.0017 | 3.32 |
| S2 | 0.13 | 2.18 | 11.34 | 1.270 | 0.0015 | 2.06 |
| S3 | 0.15 | 1.28 | 10.22 | 0.486 | 0.0015 | 2.09 |
| S4 | 0.20 | 1.34 | 9.67 | 0.697 | 0.0012 | 2.22 |
| S5 | 0.16 | 1.31 | 12.96 | 0.101 | 0.0013 | 2.60 |
| S6 | 0.14 | 0.82 | 11.04 | 0.216 | 0.0015 | 2.34 |
| S7 | 0.13 | 1.37 | 7.05 | 0.628 | 0.0016 | 2.57 |
| S8 | 0.17 | 2.07 | 25.11 | 0.568 | 0.0017 | 3.52 |
| S9 | 0.14 | 1.34 | 15.33 | 0.342 | 0.0017 | 3.32 |
| Site | TP [mg/L] | TN [mg/L] | Chl-a [μg/L] | NO3-N [mg/L] | Sb [mg/L] | CODMn [mg/L] |
|---|---|---|---|---|---|---|
| S1 | 0.23 | 0.92 | 2.01 | 1.440 | 0.0021 | 3.24 |
| S2 | 0.18 | 0.76 | 2.21 | 1.760 | 0.0023 | 3.31 |
| S3 | 0.17 | 0.71 | 1.67 | 0.549 | 0.0008 | 3.58 |
| S4 | 0.17 | 0.81 | 4.41 | 1.600 | 0.0019 | 3.51 |
| S5 | 0.15 | 0.92 | 3.28 | 0.852 | 0.0019 | 3.92 |
| S6 | 0.14 | 0.82 | 3.16 | 0.470 | 0.0021 | 3.74 |
| S7 | 0.16 | 0.81 | 3.03 | 0.913 | 0.0021 | 3.86 |
| S8 | 0.16 | 0.86 | 2.44 | 1.190 | 0.0024 | 3.30 |
| S9 | 0.23 | 0.92 | 1.98 | 1.440 | 0.0021 | 3.23 |
| Site | TP [g/kg] | TN [g/kg] | pH | Moisture Content | Sb [mg/kg] | Cd [mg/kg] | Pb [mg/kg] | Cr [mg/kg] |
|---|---|---|---|---|---|---|---|---|
| S1 | 2.46 | 1.75 | 7.32 | 58.4 | 1.4 | 0.11 | 27.0 | 58.0 |
| S2 | 2.11 | 1.21 | 7.63 | 48.4 | 0.9 | 0.20 | 34.1 | 62.0 |
| S3 | 2.37 | 1.41 | 7.73 | 42.6 | 0.8 | 0.18 | 32.8 | 48.0 |
| S4 | 2.22 | 1.30 | 7.62 | 51.7 | 0.9 | 0.15 | 34.3 | 53.0 |
| S5 | 2.46 | 1.42 | 7.84 | 43.8 | 1.1 | 0.19 | 27.6 | 42.0 |
| S6 | 2.73 | 0.78 | 7.81 | 38.9 | 0.9 | 0.17 | 19.6 | 32.0 |
| S7 | 2.31 | 0.87 | 7.86 | 35.3 | 0.7 | 0.13 | 28.0 | 44.0 |
| S8 | 2.54 | 0.91 | 7.77 | 40.1 | 1.3 | 0.12 | 26.8 | 39.0 |
| S9 | 2.57 | 1.31 | 7.45 | 49.7 | 1.2 | 0.14 | 34.7 | 50.0 |
| Year | ||||||
|---|---|---|---|---|---|---|
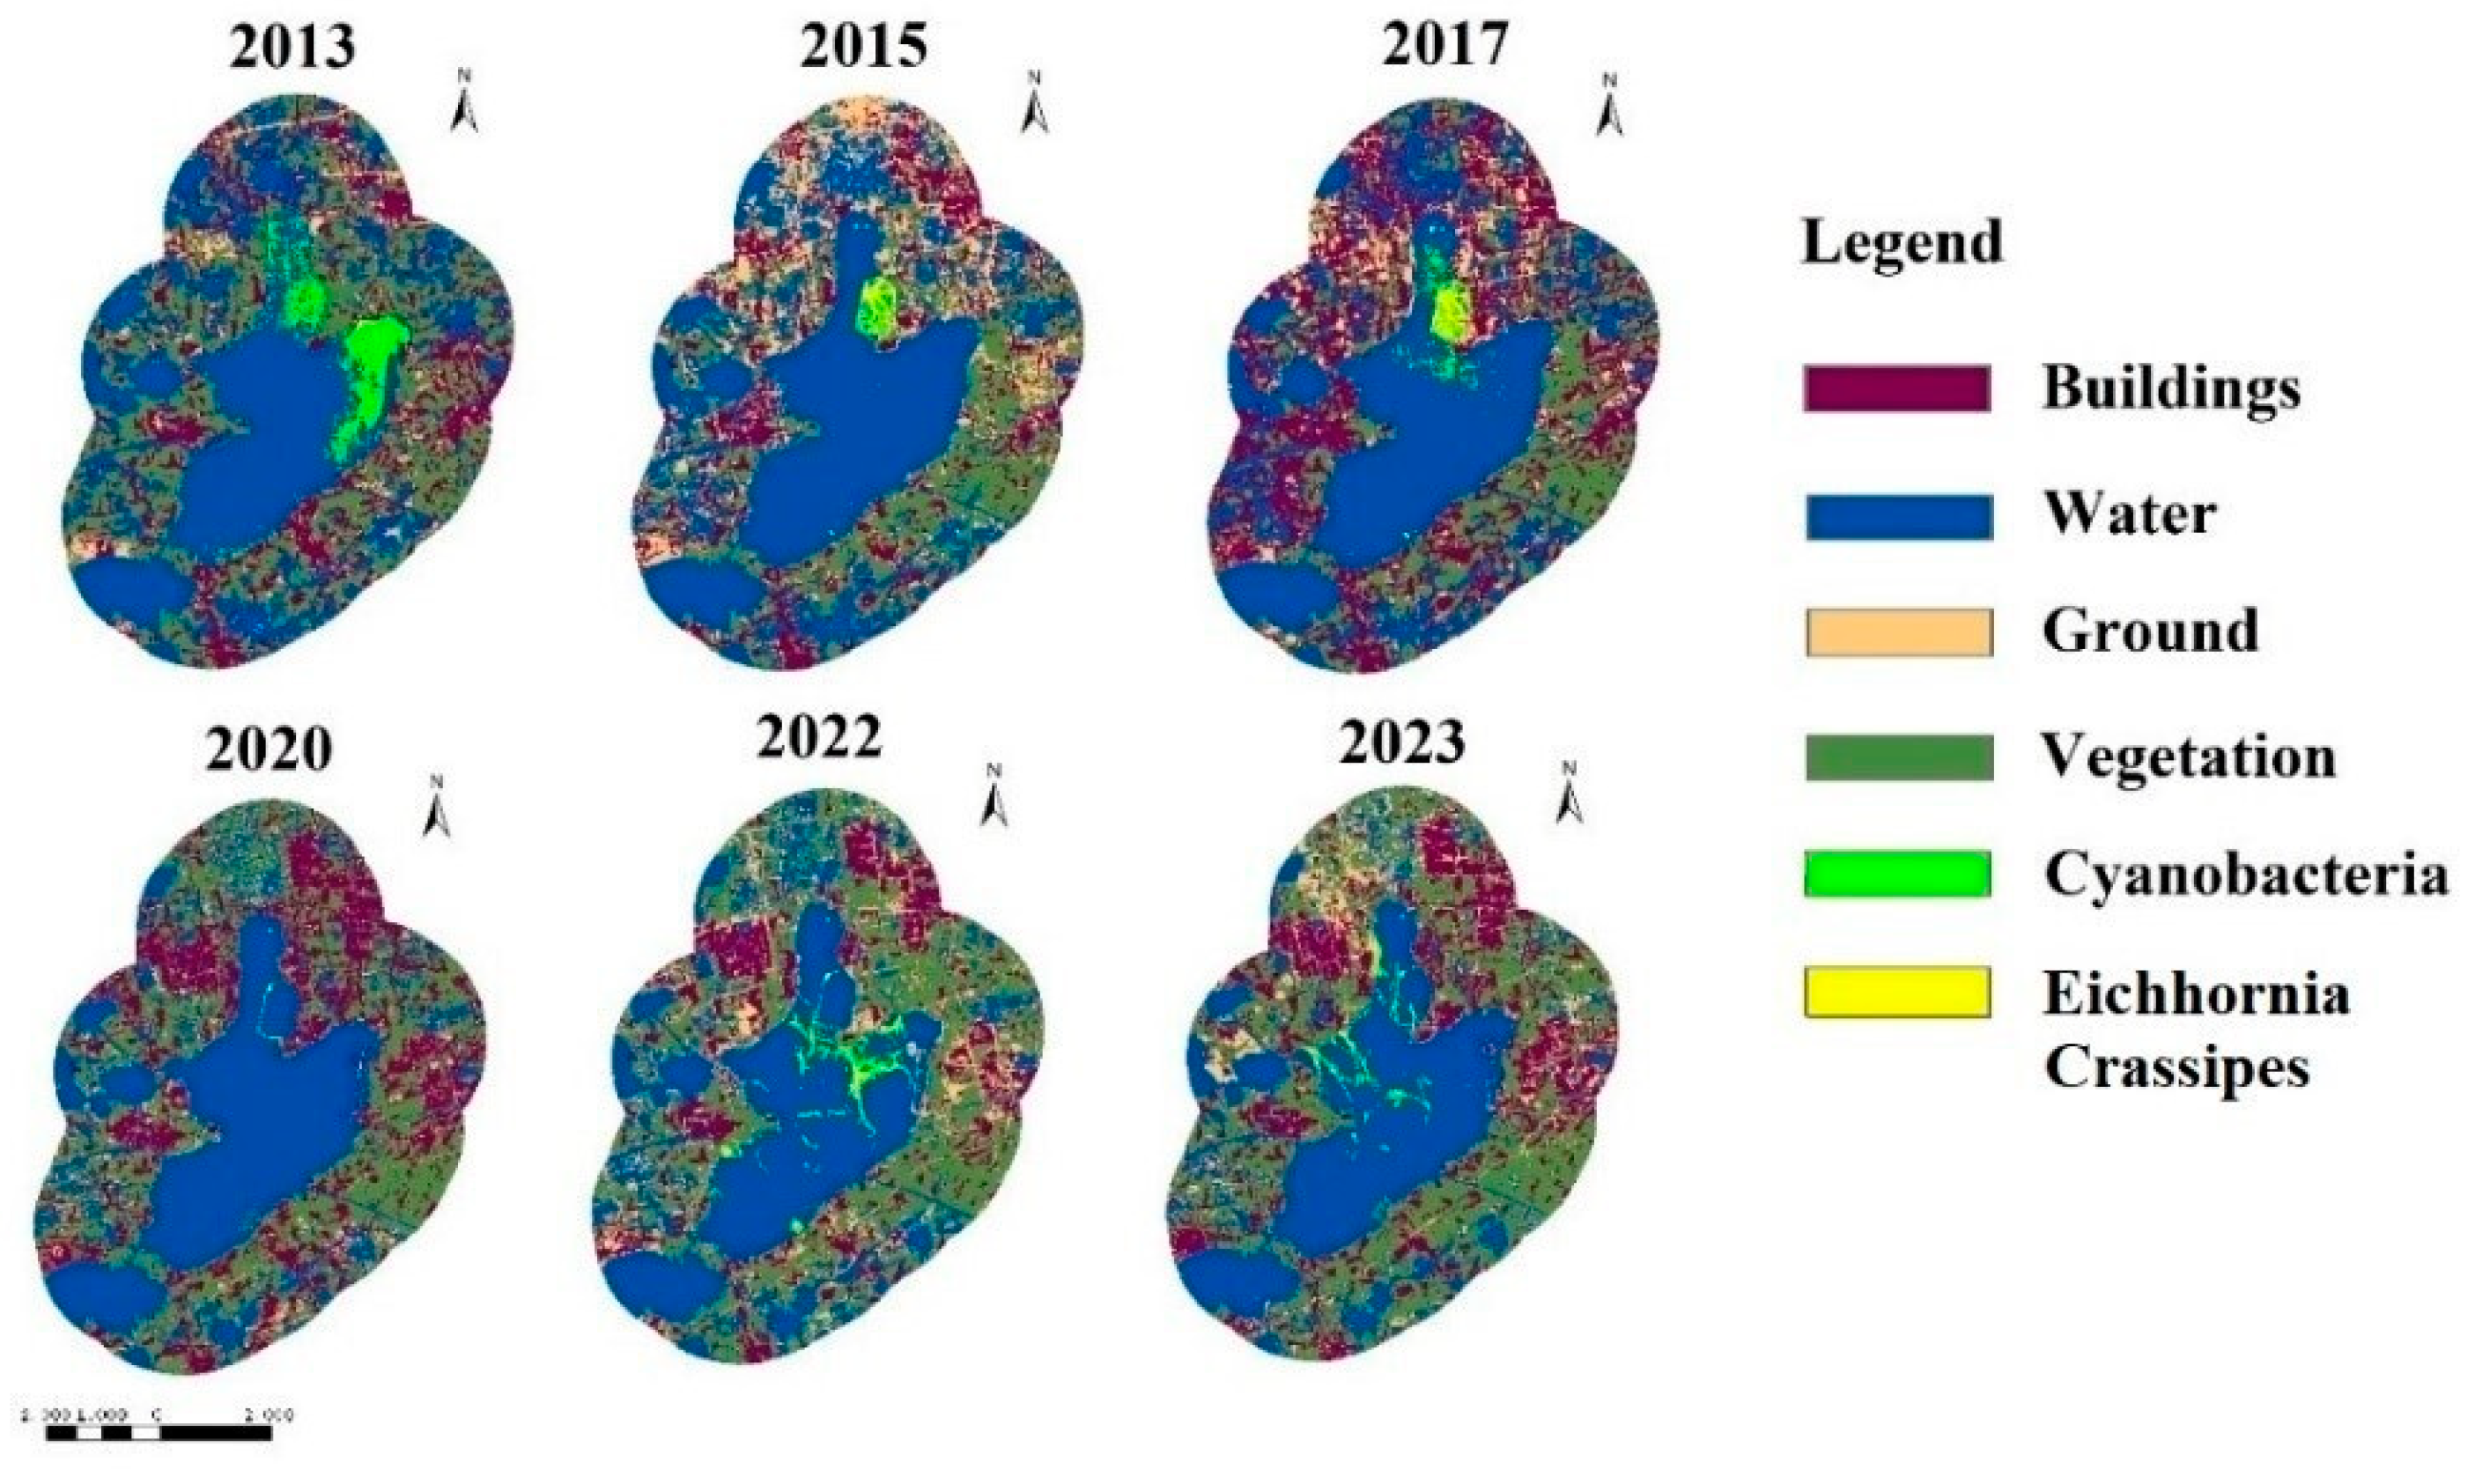
| Area (km2) | 2013 | 2015 | 2017 | 2020 | 2022 | 2023 |
| Eichhornia Crassipes | 0.38 | 0.86 | 1.54 | 0.13 | 1.31 | 2.16 |
| Building | 26.54 | 30.86 | 46.35 | 35.63 | 30.46 | 32.64 |
| Algal bloom | 10.70 | 2.66 | 3.74 | 0.11 | 1.39 | 1.33 |
Disclaimer/Publisher’s Note: The statements, opinions and data contained in all publications are solely those of the individual author(s) and contributor(s) and not of MDPI and/or the editor(s). MDPI and/or the editor(s) disclaim responsibility for any injury to people or property resulting from any ideas, methods, instructions or products referred to in the content. |
© 2024 by the authors. Licensee MDPI, Basel, Switzerland. This article is an open access article distributed under the terms and conditions of the Creative Commons Attribution (CC BY) license (https://creativecommons.org/licenses/by/4.0/).
Share and Cite
Liu, H.; Zhou, X. Assessing Temperature Change Impact in the Wake of Ongoing Land Use Change: A Case Study at Lake Dianshan. Sustainability 2025, 17, 28. https://doi.org/10.3390/su17010028
Liu H, Zhou X. Assessing Temperature Change Impact in the Wake of Ongoing Land Use Change: A Case Study at Lake Dianshan. Sustainability. 2025; 17(1):28. https://doi.org/10.3390/su17010028
Chicago/Turabian StyleLiu, Hua, and Xuefei Zhou. 2025. "Assessing Temperature Change Impact in the Wake of Ongoing Land Use Change: A Case Study at Lake Dianshan" Sustainability 17, no. 1: 28. https://doi.org/10.3390/su17010028
APA StyleLiu, H., & Zhou, X. (2025). Assessing Temperature Change Impact in the Wake of Ongoing Land Use Change: A Case Study at Lake Dianshan. Sustainability, 17(1), 28. https://doi.org/10.3390/su17010028