Abstract
Floods have catastrophic effects worldwide, particularly in monsoonal Asia. This systematic review investigates the literature from the past two decades, focusing on the use of remote sensing (RS), Geographic Information Systems (GISs), and technologies for flood disaster management in South Asia, and addresses the urgent need for effective strategies in the face of escalating flood disasters. This study emphasizes the importance of tailored GIS- and RS-based flood disaster studies inspired by diverse research, particularly in India, Pakistan, Bangladesh, Sri Lanka, Nepal, Bhutan, Afghanistan, and the Maldives. Our dataset comprises 94 research articles from Google Scholar, Scopus, and ScienceDirect. The analysis revealed an upward trend after 2014, with a peak in 2023 for publications on flood-related topics, primarily within the scope of RS and GIS, flood-risk monitoring, and flood-risk assessment. Keyword analysis using VOSviewer revealed that out of 6402, the most used keyword was “climate change”, with 360 occurrences. Bibliometric analysis shows that 1104 authors from 52 countries meet the five minimum document requirements. Indian and Pakistani researchers published the most number of papers, whereas Elsevier, Springer, and MDPI were the three largest publishers. Thematic analysis has identified several major research areas, including flood risk assessment, flood monitoring, early flood warning, RS and GIS, hydrological modeling, and urban planning. RS and GIS technologies have been shown to have transformative effects on early detection, accurate mapping, vulnerability assessment, decision support, community engagement, and cross-border collaboration. Future research directions include integrating advanced technologies, fine-tuning spatial resolution, multisensor data fusion, social–environmental integration, climate change adaptation strategies, community-centric early warning systems, policy integration, ethics and privacy protocols, and capacity-building initiatives. This systematic review provides extensive knowledge and offers valuable insights to help researchers, policymakers, practitioners, and communities address the intricate problems of flood management in the dynamic landscapes of South Asia.
1. Introduction
Flood disasters represent complex and multifaceted challenges with significant global socioeconomic and environmental impacts. As natural phenomena, floods transcend geographical boundaries and are an enduring aspect of human history. Floods, defined as the inundation of dry land, can result from various factors such as heavy rainfall, storm surges, snowmelt, or dam failures [1,2]. Their occurrence threatens human settlements, agriculture, infrastructure, and ecosystems substantially. In recent decades, the frequency and intensity of flood events has increased, underscoring the importance of robust flood management strategies. Owing to its diverse topography and climate, South Asia is highly susceptible to various forms of flooding. For instance, the devastating floods in Bangladesh in 1998, often referred to as the “Great Flood”, underscore the scale of impact that can be witnessed in densely populated regions [3,4]. Flood geography is not uniform and varies in its occurrence, with certain regions being more susceptible to riverine flooding, while others face the threat of coastal inundation. Recognizing this variation is crucial for developing targeted flood management approaches that address the unique susceptibility of different areas.
The socioeconomic consequences of flood disasters are profound, affecting millions of people and causing extensive damage to their physical infrastructure, agriculture, and livelihoods [5]. In-depth analyses of case studies from these countries shed light on the cascading impacts of floods, including the displacement of communities, loss of lives, destruction of crops, and disruptions to critical infrastructure, such as transportation networks and water supply systems. In 2010, a significant flood in Pakistan impacted approximately 884,715 dwellings over 70,238 km2 [6,7]. A second, more significant flood in 2011 inundated 21,200 km2, affecting 5.88 million people, 1500 km of roads, 382 km of railway tracks, 498 km2 of forests, and 16,440 km2 of agricultural area [6,7]. Likewise, UN reports reveal that flooding in Afghanistan between April and July 2014 may have affected up to 140,000 people, with hundreds of presumed deaths primarily in the northern provinces due to floods and landslides [8]. Similarly, heavy monsoonal rains in southern Asia in July-August 2015 resulted in hundreds of deaths and rendered approximately one million homeless. A significant loss of life and displacement have occurred across various parts of South Asia, including northern India, Afghanistan, Pakistan, and Nepal.
Research that specifically examines and evaluates the susceptibility of particular demographic groups is crucial for implementing tailored interventions. Findings from Pakistan demonstrate the diverse consequences of floods on women, children, and elderly individuals, highlighting the necessity of incorporating gender-sensitive and comprehensive disaster management approaches [9]. Quantifying the socioeconomic consequences of flood disasters is crucial for assessing their overall impacts on communities and economies. Studies that analyze the direct and indirect costs of floods contribute to a better understanding of their long-term implications. For instance, research in India has explored the economic losses caused by floods, including infrastructure damage and supply chain disruption. Studies in Bangladesh and India have focused on the impact of floods on the agricultural sector, providing insights into the loss of crops, livestock, and livelihoods [10,11]. Flood disasters in South Asia are not independent occurrences but rather complex occurrences that are influenced by a variety of factors. These factors differ across regions owing to variations in climate, topography, and land use. For instance, the geographical location and seasonal climate have a significant impact on flooding processes in Bangladesh. Similarly, the southern Himalayas experience severe flooding and destruction annually during the monsoon season [12]. Natural disasters often have a disproportionate impact on vulnerable populations, including those living in informal settlements, low-income communities, and remote areas.
Insightful flood assessments are vital to inform policies that address the immediate needs of affected communities and facilitate long-term recovery. Land use planning and urban development in flood-prone regions require a nuanced understanding of the flood risks. Flood disaster studies contribute to the formulation of land-use policies that balance development aspirations with the need to mitigate flood risks. For example, research in Sri Lanka highlighted that integrating flood risk assessments into urban planning processes would create resilient and sustainable cities [13]. South Asian countries share river basins and floods often transcend political boundaries. Collaborative studies on transboundary river management and flood risk reduction foster cooperation among neighboring countries. For instance, research on the Indus River Basin in Pakistan and India has highlighted the need for joint efforts to address shared flood risks [14,15]. Floodplains and wetlands play crucial roles in regulating floodwaters and supporting biodiversity. Flood disaster studies contribute to our understanding of these ecosystems and advocate for their conservation. Research has highlighted the significance of preserving natural floodplain areas in India, as this helps reduce the impacts of flooding and maintain ecological balance [16].
Exploring institutional frameworks and disaster governance structures in specific countries provides insights into the preparedness, response, and recovery mechanisms in place. Nepal’s academics, Non-Governmental Organizations (NGOs), and government agencies have conducted many studies on flood disasters [17]. Analyzing community resilience and adaptive capacity in the face of recurring floods offers valuable lessons for enhancing local-level strategies. Factors such as early warning systems, community-based disaster risk reduction initiatives, and traditional knowledge are integral components of this discussion. Technological advances, including remote sensing (RS) and GIS applications, have transformed flood disaster monitoring and management. This extensive exploration of flood disasters provides a foundation for understanding the intricate dynamics of flooding in South Asian countries. The historical, geographical, socioeconomic, and technological dimensions provide a holistic perspective, setting the stage for subsequent discussions on the importance of flood disaster studies in South Asia and the role of RS and GIS in flood disaster management.
With sophisticated RS and GIS techniques, spatial datasets have provided diverse methods for geospatial decision making [18,19,20,21,22,23,24]. GIS has contributed to the speed and efficiency of the overall planning process because of its quick and efficient access to a large amount of information [19]. GIS tools enable users to capture, store, manipulate, analyze, manage, and interpret spatial data while integrating database operations, such as queries and spatial analysis. Initiated in the early 1960s as a land administration system, GIS has evolved significantly with advancements in computer technology, data storage, and mapping [16]. The latest sophisticated GIS includes a range of features, such as spatial data analysis, data integration and management, visualization and mapping, and real-time data processing. GIS tools and techniques can address the impacts and challenges posed by natural disasters. This provides critical information for disaster management by supporting hazard and risk mapping, evacuation planning, and situational analysis [17,18]. Additionally, it aids in recovery efforts and damage assessment following a disaster, particularly floods, by enabling the development of spatial models and performing analyses, such as generating risk and vulnerability maps [18]. Furthermore, GIS is inherently equipped to manage data to identify risk zones and assess critical infrastructure facilities. It can also assist in detecting the most suitable locations for evacuation centers [19,20,21,22]. RS involves retrieving information regarding an object or area from a distance using satellites or sensors [23,24]. These sensors capture data across various wavelengths in the electromagnetic spectrum. Currently, RS data are widely used for environmental monitoring, disaster management, and natural resource management. Recently, RS has also played a critical role in natural disaster management worldwide, including flood management. RS technology and multitemporal data are the most effective approaches for comprehending landscape dynamics on any geographical scale [25,26]. The latest advancements, such as the use of unmanned aerial vehicles (UAVs), are now extensively employed for evacuation planning and damage assessment. GIS and RS technologies have become indispensable tools for flood management, offering valuable insights into understanding, monitoring, and mitigating the impacts of floods. GIS facilitates spatial analysis, enabling the creation of flood hazard maps that depict areas prone to flooding.
In Nepal, GIS has been used to develop flood hazard maps for river basins, identify vulnerable regions, and inform land-use planning [17,27]. Similarly, GIS-based flood hazard mapping has been employed in Bangladesh to delineate areas susceptible to riverine and coastal floods, formulate evacuation plans, and develop infrastructure [28]. The real-time monitoring capabilities of GIS and RS technologies are instrumental in the development of early warning systems. In India, GIS-based systems have been integrated with meteorological data and river discharge measurements to provide timely alerts and evacuation plans to reduce loss of life and property during floods [29,30]. RS and GIS support flood inundation modeling, allowing the simulation of potential flood scenarios. In Sri Lanka, flood modeling has been employed to assess the impacts of different flood events, aiding the development of strategies for flood risk reduction and response planning [31,32]. In India and Bangladesh, GIS has been used to delineate floodplains and formulate land-use policies that balance development with flood risk considerations [33,34,35]. In India, GIS applications have aided in zoning regulations, ensuring that construction in flood-prone areas adheres to safety guidelines and contributes to resilient urban development [36,37]. RS technologies monitor changes in hydrological conditions such as river flow and watershed dynamics. RS technologies have been instrumental in monitoring glacial lakes and their potential to trigger glacial lake outburst floods, thereby contributing to proactive risk management [33,37]. After a flood event, RS and GIS technologies are pivotal for assessing the damage and planning recovery efforts [36,37,38]. In Nepal, RS technologies aid in the rapid assessment of flood-induced damage, facilitating timely initiation of recovery measures [17]. RS and GIS contribute to a comprehensive approach for addressing flood disaster complexities through spatial analysis, real-time monitoring, modeling, and community engagement [35,39].
This review provides a comprehensive understanding of the existing research, offering a holistic perspective on how remote sensing and GIS have been utilized to study flood disasters in South Asia. It identifies existing research gaps by highlighting areas with insufficient studies, thereby guiding future research to address these gaps and improve disaster-management strategies. By categorizing studies into themes, this review aids researchers and practitioners in grasping the focus areas and methodologies used in the field. Bibliometric analysis reveals trends in research productivity, collaboration networks, and influential publications, facilitating the identification of key contributors and impactful work. Given the regional context of South Asia, which experiences frequent and severe flood events, this review emphasizes an understanding of region-specific challenges and solutions, ensuring that research outputs are effectively tailored to the socio-environmental context. Furthermore, this review bridges the gap between academic research and practical applications, offering valuable insights into how remote sensing and GIS technologies can enhance flood disaster management and inform policymaking in this highly vulnerable region.
This study aimed to systematically review the application of RS and GIS technologies in flood disaster management across South Asia between 2004 and 2024. The primary objectives of this study were to: (1) assess the evolution of research trends and the utilization of RS and GIS in flood disaster studies in this region; (2) analyze the geographical distribution of these studies to identify underrepresented areas; (3) conduct a bibliometric analysis that highlights key contributors, collaborations, and thematic focus areas; and (4) provide recommendations for future research, particularly in advancing the integration of technology with socio-environmental dimensions and addressing gaps in current knowledge. This study seeks to contribute to a deeper understanding of how RS and GIS technologies can enhance flood disaster resilience and management strategies in the diverse and dynamic contexts of South Asia.
2. Materials and Methods
2.1. Study Area
South Asia is a diverse and vibrant geographical landscape located in the southern part of Asia, encompassing the specified countries of Nepal, Bhutan, Bangladesh, Pakistan, Sri Lanka, India, Afghanistan, and Maldives (Figure 1). The region is located at 25.0376 N 76.4663 E and comprises around 5.1 million km2, about 11.5% of the Asian continent and 3.4% of the world’s land surface [8,38]. The northern boundary of South Asia is defined by the major Himalayas, which stretch across several countries, including India, Nepal, Bhutan, and Pakistan. The vast and fertile Indo-Gangetic Plain lies to the south of the Himalayas and is one of the most densely populated regions in the world. This plain is watered by the Ganges, Brahmaputra, and Indus Rivers, which provide water for agriculture and support millions of livelihoods. South Asia experiences a range of climates, from hot and humid plains to cold and snowy Himalayan peaks. Monsoon rains arrive in summer and are crucial for agriculture; however, they can also cause devastating floods. This region is home to some of the world’s most populous cities including Delhi, Dhaka, and Karachi. These countries were selected based on the information outlined in the abstract, reflecting the regional diversity of topography, climate, and socioeconomic factors that influence flood disaster management.
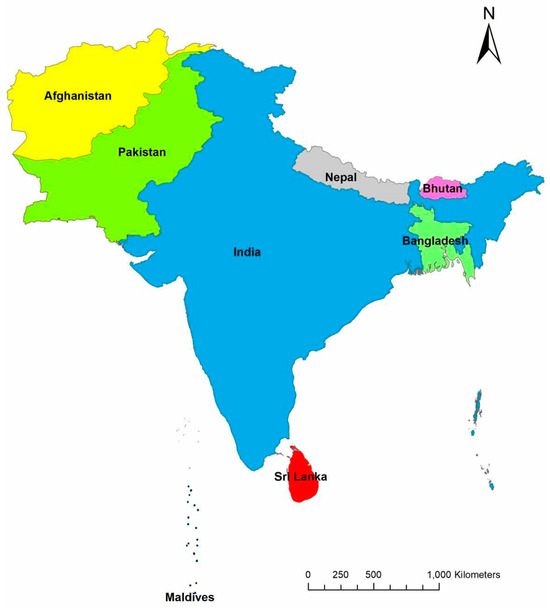
Figure 1.
Geographic and political map of South Asia generated using ArcMap 10.8 by ESRI. The map highlights India (blue), which is centrally located and shares borders with Pakistan (green) to the northwest, Nepal (gray) to the north, Bhutan (pink) to the northeast, and Bangladesh (light-green) to the east. Afghanistan (yellow) is northwest Pakistan. Sri Lanka (red) is depicted as an island nation to the south of India, whereas the Maldives (black dots) are a group of islands situated southwest of India and Sri Lanka. The map includes a scale bar to indicate distances in kilometers, providing a clear spatial reference for understanding the relative sizes and proximities of these countries.
2.2. Materials
The materials employed in this systematic review comprised of multiple peer-reviewed articles, review papers, and book chapters sourced from reputable academic databases. A reasonable selection of the literature is crucial to ensure the inclusion of comprehensive and updated information on the application of RS and GIS technologies in flood management across specific South Asian countries. This systematic review employed the Preferred Reporting Items for Systematic reviews and Meta-Analyses (PRISMA) method to collect, analyze, and synthesize data related to RS and GIS applications in flood management. Data collection involved extracting pertinent details from the selected materials, including study objectives, methodologies, key findings, and technological advancements. This review considered various RS and GIS applications such as flood mapping, hazard assessment, risk analysis, early warning systems, and post-disaster recovery. A comprehensive search strategy was devised to identify relevant materials to ensure methodological rigor in this systematic review. The primary databases used for the literature search were Google Scholar, Scopus, and ScienceDirect.
Selecting the literature from sources such as ScienceDirect and Scopus for our study offers several advantages: (1) These platforms curate high-quality articles from peer-reviewed reputable journals, ensuring that the literature selected is of high academic quality and credibility; (2) Scopus is one of the largest abstract and citation databases, covering a broad range of disciplines. ScienceDirect provides access to a vast repository of full-text articles; (3) Both platforms ensure the inclusion of the latest research, enabling us to remain current with emerging trends and developments; (4) Scopus provides detailed bibliographic metadata, including citation counts, author affiliations, keywords, and abstracts, which are invaluable for conducting bibliometric analysis. This metadata allows us to analyze trends, map networks, and evaluate the impact of studies systematically; (5) By sourcing from these platforms, we can readily explore cross-disciplinary insights and identify interconnections between fields; (6) Tools for exporting data in formats compatible with bibliometric software we utilized (VOSviewer) facilitate the use of articles from these databases for bibliometric mapping and visualizations.
The search strings were tailored to the syntax and search functionalities of each database to optimize the precision and recall of the results. Articles and keywords between 2004 and 2024 were used as search parameters, and 2024 articles were limited to English. For systematic data collection, the keywords “Flood” and “South Asia” were used in three different databases (Table 1). The datasets were queried on 16 January 2024. The initial search yielded many articles, and the subsequent steps were performed to filter the results. Duplicate entries were removed, and titles and abstracts were screened against the inclusion criteria. The reference lists of the relevant articles were also scrutinized for additional sources, ensuring comprehensive coverage of the available literature.

Table 1.
Queries used in this review.
2.3. Methods
2.3.1. Bibliometric Analysis
The survey focused on research articles, review papers, and chapters on flood management in South Asia. The terms “GIS”, “RS”, and “flood disasters” were included to broaden the search query and encompass various flood-management terms. In total, 195 papers were published during the study period. VOSviewer version 1.6.20, was used to draw a network of recurrent keywords, authors, and countrywise clusters in the research domain. VOSviewer is a software tool for constructing and visualizing bibliometric networks, such as journals, researchers, and individual publications, based on citations, bibliographic coupling, co-citations, and co-authorship relations. In this study, VOSviewer helped to identify key trends, influential authors, and collaborative networks, providing a detailed overview of the research landscape in RS and GIS applications in flood management.
2.3.2. Thematic Analysis
This qualitative data analysis method systematically identifies, manages, and offers insight into the patterns of themes across a dataset. Thematic analysis was conducted on common topics concerning RS and GIS in flood disaster management using PRISMA method, which is a widely used and popular method in systematic reviews. The PRISMA method provides a systematic framework for conducting bibliometric analysis. The process begins by defining objectives to maintain focus and relevance. A comprehensive search is performed across databases (Google Scholar, Scopus, and ScienceDirect) using specified keywords and strategies, with the search process meticulously documented, including databases, date ranges, and inclusion/exclusion criteria. The screening involves two stages: initial screening to remove duplicates and full-text screening to evaluate remaining studies for relevance. Clear inclusion and exclusion criteria were established to ensure alignment with research objectives. Relevant information, such as authors, publication year, keywords, and citations, was extracted. Subsequently, bibliometric analysis was conducted using VOSviewer to create visualizations such as co-authorship networks, keyword maps, and citation trends. Finally, the findings were reported, ensuring a transparent and reproducible approach to bibliometric analysis that enables academics to integrate several theories and concepts into a common theme. Readers can comprehend a theme profoundly without reading each document. PRISMA helped to narrow down and shortlist the dataset without bias (Figure 2). The critical stages of this process included identification, screening, eligibility determination, and inclusion. In the identification phase, 195 papers were found across the three databases and downloaded after eliminating 11 duplicates. Notably, 20 papers were excluded because they focused on other natural hazards, laws, and medical sciences. Ultimately, 94 articles were selected for thematic analysis.
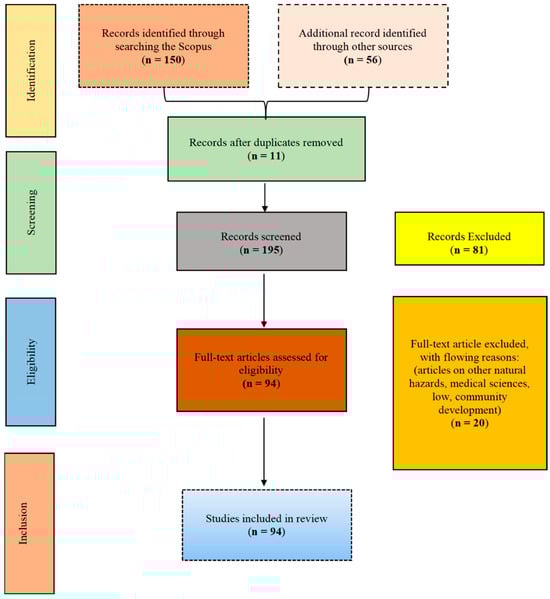
Figure 2.
PRISMA-based systematic review process used in this study. Initially, 150 records were identified through a search of the Scopus database, with additional 56 records identified from other sources, resulting in a total of 206 records. After removing duplicates, 195 records remained for screening. During the screening phase, 81 articles were excluded, resulting in 94 full-text articles that were assessed for eligibility. Of these, 20 were excluded for reasons such as focusing on other natural hazards, the medical sciences, law, or community development. Finally, 94 studies were included in the final review. The dashed boxes represent the numbers of papers being selected through the review process.
3. Results
Over the past two decades (2004–2024), the application of remote sensing (RS) and Geographic Information Systems (GISs) has significantly contributed to advancing flood management studies [40]. The integration of diverse spatial and temporal datasets, along with innovative methodologies, has enabled researchers to assess flood susceptibility, hazard vulnerability, and disaster risk in various regions [37,39]. This section presents an analysis of the trends, methodologies, and thematic focuses of RS- and GIS-based flood studies in South Asia. Table 2 provides a comprehensive overview of key flood-related studies, showcasing the diversity of methods, datasets, and spatial-temporal resolutions employed in this field. It also highlights the versatility of multispectral remote sensing and other geospatial tools in addressing flood challenges across different terrains and climatic conditions [34,36], and establishes a critical basis for the comprehensive bibliometric, keyword, citation, institutional, and journal analyses explored in the subsequent subsections.
Table 2.
Features and domains of flood-related studies using multispectral remote sensing data from 2004 to 2024.
3.1. Bibliometric Analysis Results
Devastating flood events in Bangladesh, Afghanistan, Nepal, and India during 2010–2015 and, most recently, in Pakistan in 2022, have led to an increase in academic interest in conducting research on RS- and GIS-based flood disaster studies, particularly after 2014 (Figure 3a). By 2023, the peak of this research was 18 publications per year. This increasing number of citations illustrates South Asia’s growing trend in flood disaster research. As an individual entity, most publications were from India, about 37 (Figure 3b).
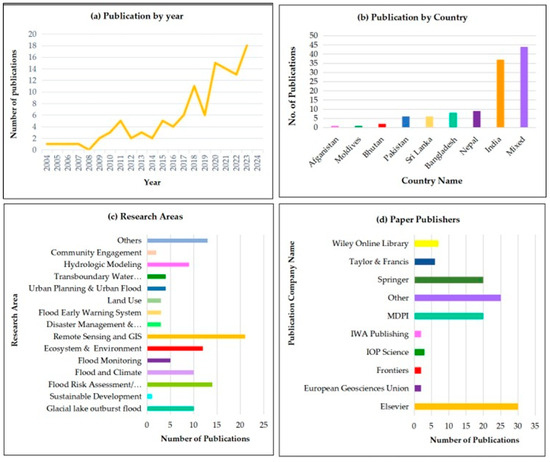
Figure 3.
Overview of the dataset analyzed in this study. (a) The number of publications per year, showing a general upward trend from 2004 to 2024 with notable increases in recent years. (b) Distribution of publications by country, with India and mixed-country studies having the highest number of publications. (c) The research areas of the publications highlight significant contributions in fields such as disaster management and vulnerability, hydrologic modeling, remote sensing, and GIS. (d) This graph identifies the publisher of papers, with Elsevier and Springer being the most prominent, followed by other publishers such as Taylor and Francis, and MDPI.
Most publications during this period focused on three research areas: Remote sensing and GIS, flood risk assessment, and ecosystem and environment. Sustainable development has received the least amount of attention (Figure 3c). Most publications were published by Elsevier, Springer, and MDPI (Figure 3d).
3.2. Keyword Analysis
Keyword analysis is essential for identifying the research trends and themes. By examining the frequency and context of key terms in academic literature, researchers can pinpoint emerging topics, shifts in focus, and interdisciplinary connections by examining the frequency and context of key terms in the academic literature. It helps map the development of a field, highlights influential studies, and forecasts future directions, ultimately guiding informed decision making and advancing knowledge. According to Waseem et al. [57], keyword co-occurrence analysis is a powerful technique for identifying linkages between keywords in the literature, providing insights into primary topics and emerging issues within the research domain. By analyzing the frequency and connections between keywords, researchers can uncover central themes, popular research topics, and potential gaps in the existing literature. This analysis helps to map the intellectual structure of the field and guide future research directions. Keyword analysis was conducted using VOSviewer software. The results show that 6402 total keywords were used in South Asia’s RS and GIS-based flood management from 1 January 2004 to 16 January 2024.
Considering the minimum number of occurrences, 481 keywords met the threshold. Table 3 lists the most frequently used keywords and their total link strengths. The total link strength indicates the cumulative strength of connections between a given keyword and all other keywords in the dataset, thereby reflecting how frequently and strongly they co-occur within the analyzed documents and highlights the relational importance of each keyword in the conceptual network, beyond its standalone frequency of occurrence. The keyword “climate change” was the most frequently used keyword in the literature, with a frequency of 360. The second most repeated keyword was “vulnerability”, with a frequency of 224. The third most frequently repeated keyword was “risk”, with a frequency of 199. VOSviewer graphically represents these keyword connections and simultaneous occurrences (Figure 4). This figure visualizes the keywords as having a minimum of five occurrences in eight clusters.
Table 3.
Top ten author’s keywords and link strengths.
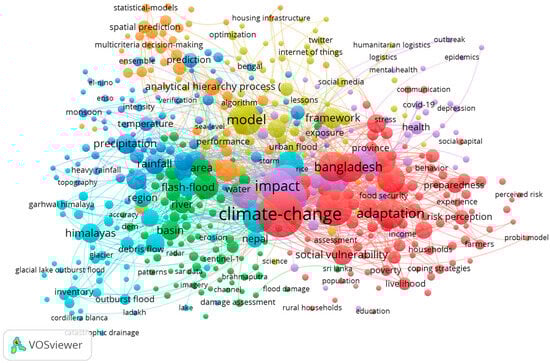
Figure 4.
Keywords map. This illustrates the co-occurrence of keywords with a minimum occurrence of five in publications from 2004 to 2024. The map depicts clusters of frequently occurring keywords, highlighting the main research focus areas. Prominent keywords such as “climate change”, “impact”, “adaptation”, “Bangladesh”, and “model” are shown with larger nodes, indicating higher occurrences and centrality within the network. The map visually represents the interconnectedness of various research topics, emphasizing significant themes, such as social vulnerability, precipitation, rainfall, flood risk, and health.
The focus on “vulnerability” indicates a strong interest in identifying and assessing the populations, regions, and infrastructure most at risk of flooding, which is crucial for targeted interventions and resource allocation. The frequent mention of “risk” highlights the emphasis on risk assessment and management in flood-prone areas. This involves evaluating the likelihood of flood events and their potential impact, which is essential for developing effective mitigation and response strategies. Research on the “impact” of floods encompasses economic, social, and environmental consequences, which are vital for comprehending the full scope of flood disasters and informing efforts to build recovery and resilience. “Adaptation” focuses on strategies and measures to adjust to the changing flood patterns due to climate change, including infrastructure modifications, community preparedness programs, and policy changes to reduce flood risk. The high frequency of the keyword “management” indicates the importance of comprehensive management practices in reducing the adverse effects of floods, as effective flood management involves planning, implementing, and monitoring actions to mitigate flood risks.
3.3. Citation Analysis
The objective of citation analysis is to identify the most frequently cited research articles on this topic [58]. The study titled “A typology of compound weather and climate events by [1] garnered the highest number of citations, totaling 669, according to the analysis (Table 4). Then, Sanyal & Lu’s “Application of remote sensing in flood management with special reference to monsoon Asia: A review.” published in 2004 had the second highest number of citations, totaling 621. Furthermore, a research paper written by Bassi et al. (2021) [59] entitled “Status of wetlands in India: A review of extent, ecosystem benefits, threats, and management strategies” ranks third in terms of the highest number of citations, amounting to 551 according to the analysis. Bibliometric analysis identified 11 clusters that met a minimum of five documents per author (Figure 5). According to the documents per author, citations, and link strength, Islam, Shah, and Rana were the main authors in the author cluster (Table 5).
Table 4.
Top ten most cited publications.
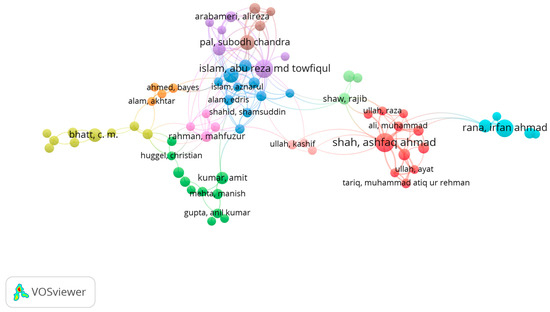
Figure 5.
Authorship map, showing authors with a minimum of five publications between 2004 and 2024. The map reveals clusters of authors who frequently collaborate. Different colors represent distinct clusters of collaborating authors that illustrate collaborative networks within the research community. Some authors listed in Table 5 below (e.g., Chakrabortty, Talukdar, Ye, Jamshed, and Chowdhuri) do not appear in this figure because they lacked significant co-authorship connections with other authors, resulting in their exclusion from the map. This figure focuses on visualizing collaborative networks rather than isolated authors.
Table 5.
Top ten most cited authors according to citations and link strength.
3.4. Institution Analysis
The analysis revealed that 10 institutions from 52 countries were engaged in studies that focused on RS- and GIS-based flood management. The topic “A typology of compound weather and climate events”, authored by Zscheischler and published by the University of Bern, Switzerland, stands out as the most cited research paper with 669 total citations (Table 6). According to the analysis, research papers from the National University of Singapore (621), the University of Delhi (551), the University of Toronto (436), Jadavpur University (432), and the London School of Economics and Political Science (333) had the highest citation rates. While Figure 6 demonstrates the institutional strength of publications and citations, Figure 7 provides insights into the most popular countries that published papers in the research domain. While Figure 6 demonstrates the institutional strength of publications and citations, Figure 7 provides insights into the most popular countries that published papers in the research domain. It must be noted that appearance of the Chinese Academy of Sciences (CAS) in Figure 6, but the absence of China in Figure 7, is due to the threshold criteria applied during the VOSviewer analysis. In Figure 6, institutions were analyzed individually based on their citation frequency and co-citation strength, with a minimum threshold of 9 documents or equivalent citation links. This allows prominent institutions like the CAS to appear. In Figure 7, however, the analysis aggregated data at the country level, and only countries meeting the minimum thresholds (at least 10–15 collaborative links or approximately 600–700 citations) are included. Consequently, while institutions from China contribute significantly at the institutional level, their aggregated data at the country level did not meet the inclusion threshold for Figure 7. This highlights the entities that exhibit stronger collaborative/citation relationships, leading to the exclusion of certain countries despite individual institutional prominence. This is a necessary step as it reduces noise in the visualization and highlight the most influential networks within the research domain.
Table 6.
Top ten universities/institutions ranked by their most-cited individual publication, highlighting key contributions in the field.
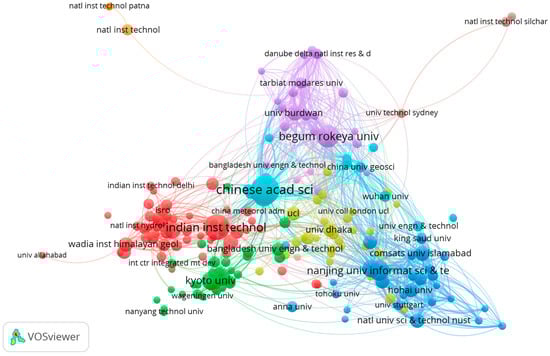
Figure 6.
Network map of citations by institution that highlights the interconnectedness and citation relationships among various academic and research institutions from 2004 to 2024. Major institutions, such as the Chinese Academy of Sciences, Indian Institutes of Technology, and Begum Rokeya University, are prominent, indicating a high citation frequency and centrality within the network. Different colors represent distinct clusters of institutions that frequently cite each other’s work, depicting collaborative and influential relationships in the research community.
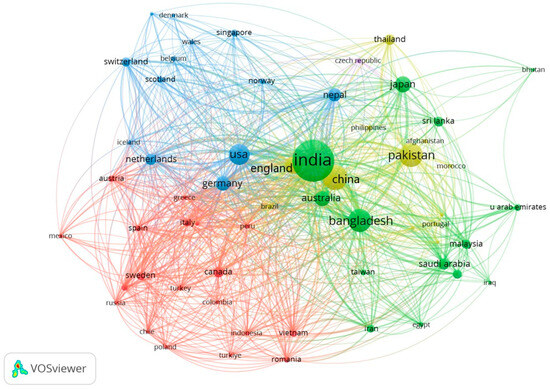
Figure 7.
Network map of citations by country that highlights the citation relationships among countries from 2004 to 2024. Key countries, such as India, the USA, Germany, and Bangladesh, are prominent, indicating high citation frequency and centrality within the network. Different colors represent distinct clusters of countries that frequently cite each other’s work, illustrating global collaboration and influence in the research community.
Five clusters were identified as being dominated by India, Pakistan, the USA, Canada, and the Czech Republic. India, Pakistan, and Bangladesh have the most publications from universities and institutes, with the most citations. As per the total documents, citations, and total link strength, the Chinese Academy of Sciences, the Indian Institute of Technology, and Begum Rokeya University are the top three organizations (Table 7) by 16 January 2024.
Table 7.
Top ten universities/institutions ranked by their aggregate bibliometric performance, including total documents, cumulative citations, and link strength.
3.5. Journal Analysis
Journal analysis shows that the nine clusters of publications are dominated by three journals: The International Journal of Disaster Risk Reduction, Natural Hazards, and Sustainability (Figure 8 and Figure 9). While the International Journal of Disaster Risk Reduction was cited in 218 documents, Natural Hazards and Sustainability were cited in 128 and 59, respectively. In addition, the three journals received 4254, 2528, and 692 citations, respectively.
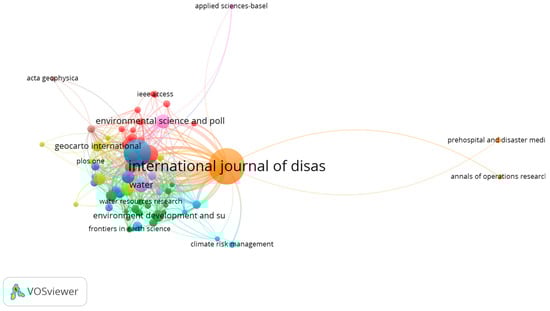
Figure 8.
Map of citations by journal. The map depicts the citation relationships among various academic journals from 2004 to 2024. The “International Journal of Disaster Risk Reduction” was prominent, indicating a high frequency of citations and centrality within the network. Other significant journals include “Environmental Science and Pollution Research”, “Water Resources Research”, and “Geocarto International”. Different colors represent distinct clusters of journals that frequently cite each other’s work, illustrating the interconnectedness and influence among journals in the research community.
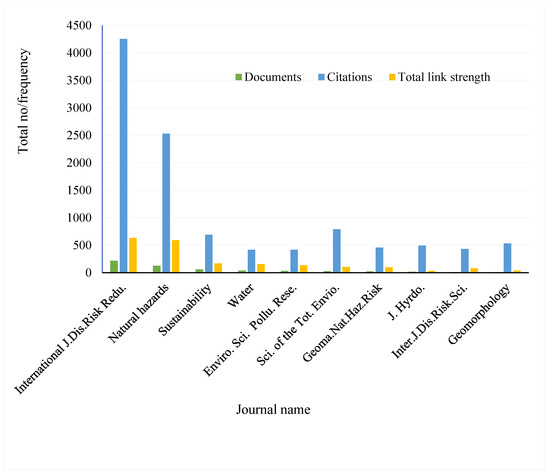
Figure 9.
Statistics for the top 10 journals in terms of citations and total link strength as of 16 January 2024. The graph compares the number of documents, citations, and the total link strength for each journal. Notably, the journal “Natural Hazards” has the highest number of citations, followed by “Sustainability” and “International Journal of Disaster Risk Reduction”. The bars indicate the frequency of documents (yellow), citations (green), and the total link strength (brown) for each journal.
4. Discussion
4.1. Characteristics of RS and GIS Flood Management Studies
Over the past 20 years, various remote sensing datasets with diverse spatial and temporal resolutions and image characteristics have been used in these studies (Table 2). RS and GIS flood management studies exhibit diverse characteristics that reflect the evolving landscape of technological advancements, methodologies, and applications for addressing flood-related challenges [59,60,61]. A prominent characteristic of RS and GIS flood management studies is their diverse spatial dimension [64,65,66,67]. These studies span a wide range of topographies, including mountainous terrain, river deltas, coastal regions, and urban landscapes, and they reflect the varied landscapes of the subregion. Notably, studies in Nepal, Bhutan, and the Maldives have focused on the Himalayan region, emphasizing the challenges posed by glacial lake outbursts and flash floods [57,66,67,68]. From 2004 to 2024, a diverse array of RS and GIS studies was conducted using satellite remote sensing and other ancillary data from flood-related studies in South Asia. Some researchers have focused on machine learning approaches, whereas others have relied on geospatial modeling to estimate glacial-related flood events, flood risk mapping, and hazard forecasting. As listed in Table 2, various models have recently been employed in flood-related studies. Among these, probabilistic forecasting utilizes statistical methods to estimate the likelihood of events and their impacts, offering a range of probabilities rather than deterministic predictions through model development, simulation, and risk assessment. Bivariate statistical modeling in flood disaster analysis involves examining the relationship between two variables to understand their interaction and influence each other. For instance, analyzing the relationship between rainfall intensity and flood magnitude can reveal correlations between these two factors. Additionally, Gradient-boosted decision tree (GBDT) is a robust machine learning model for flood risk assessment. It constructs nonlinear relationships among variables and efficiently handles large datasets. GBDT provides insights into feature importance and enhances predictive accuracy by combining the predictions of multiple decision trees. The Geophysical Fluid Dynamics Laboratory-Coupled Model (GFDL-CM) integrates multiple interacting components of the land surface. It also analyzes the behavior of fluids in motion along with climate variables, facilitating a comprehensive understanding of climate dynamics and interactions. The Soil and Water Assessment Tool (SWAT) is a versatile hydrological model utilized in flood management. It contributes to this field by simulating watershed hydrology, assessing land-use impacts, and modeling soil properties, among other functions.
The temporal dimensions vary, with some adopting a cross-sectional approach to assess specific flood events and others embracing longitudinal studies to analyze changes over time. Cross-sectional studies often focus on the immediate impact of floods, such as damage assessment and post-disaster recovery planning. In contrast, longitudinal studies have explored the temporal evolution of flood dynamics, considering factors such as land use changes, climate variability, and the effectiveness of mitigation measures. These studies frequently adopt interdisciplinary approaches, integrating insights from various fields such as geography, environmental science, engineering, and social sciences. The interdisciplinary nature of these studies is evident in the incorporation of diverse methodologies and data sources, such as hydrological modeling and social vulnerability assessment strategies [66,67,68]. Advancements in RS and GIS technologies have continually shaped the characteristics of flood management studies by introducing high-resolution satellite imagery, LiDAR data, and UAVs to capture detailed spatial information [69]. UAVs have revolutionized real-time flood monitoring and damage assessment because of their ability to quickly capture high-resolution imagery and access hard-to-reach areas. For instance, studies have utilized UAVs for rapid damage assessment and mapping inundated areas immediately after flood events, thereby providing critical data for emergency response [64,70].
Similarly, LiDAR technology has significantly improved the accuracy of topographic models used in flood-risk assessments. By generating high-resolution DEMs, LiDAR data allow for the precise mapping of flood-prone areas. In the Netherlands, LiDAR-based models have been instrumental in designing flood defenses and planning urban infrastructure to minimize flood risks [71]. In addition, satellite-based remote sensing, such as Sentinel-1 SAR data, has been pivotal for monitoring large-scale flood events in Bangladesh, enabling the assessment of flood extent and impact on infrastructure and agriculture [72].
The scale of analysis in RS- and GIS-based flood management studies varies from local to regional. Local-scale studies have often focused on specific river basins, urban areas, or vulnerable communities. For example, studies in Sri Lanka have applied GIS to assess flood vulnerability at the local scale, guide community-level interventions, and improve resilience [73,74,75]. On a regional scale, studies may encompass broader river basins or coastal zones to address the challenges of managing floods across larger landscapes. The integration of these advanced technologies highlights the dynamic and multifaceted nature of contemporary flood management research, emphasizing the importance of leveraging cutting-edge tools to enhance the accuracy and effectiveness of flood risk assessment and mitigation strategies.
4.2. Data Used in the Studies
These data are pivotal in shaping the accuracy, reliability, and comprehensiveness of flood management studies. The spatial and spectral characteristics of the RS data enable researchers to capture detailed information about land cover, water bodies, and flood extents. Using high-resolution optical imagery, such as that from Sentinel-2, allows the identification of flood-prone areas and assessment of flood impacts on infrastructure, thereby facilitating the development of flood vulnerability models [43]. In Bangladesh, the integration of Sentinel-2 data has been instrumental in monitoring large-scale flood events and evaluating their impact on agricultural land [71]. SAR imagery, such as that from Sentinel-1, is beneficial for detecting floods under cloud cover and at night, providing crucial data for continuous monitoring.
LiDAR data are commonly used in RS- and GIS-based flood management studies to create accurate topographic models, particularly in urban areas and regions with complex topography. This technology helps generate high-resolution DEMs, which are essential for precise flood modeling. Meteorological and hydrological data are crucial components of RS- and GIS-based flood management studies, and are integrated with spatial information to model flood events. In Nepal, studies have incorporated meteorological data to model the impact of extreme rainfall events on glacial lake outburst floods [41,46,51]. Similarly, in Pakistan, integrating hydrological data is essential for assessing river discharge and predicting floods in the Indus River basin [15]. In Sri Lanka, socio-economic data has been integrated into GIS-based models to assess the economic losses and recovery needs of communities affected by floods [31,56,74].
GIS data layers are integrated into GIS platforms to create comprehensive spatial databases that support various analyses and modeling efforts. In India, studies have explored the use of social media data for flood mapping and monitoring [76,77]. Integrating these diverse datasets, including optical and SAR imagery; LiDAR; and meteorological, hydrological, and socioeconomic data, reflects the interdisciplinary nature of flood management research, emphasizing the need for comprehensive and contextualized approaches.
4.3. Data Pre-Processing Involved in the Studies
Data pre-processing is a crucial step in RS- and GIS-based flood management studies, involving the manipulation, correction, and enhancement of raw data to ensure its suitability for analysis. Image calibration and atmospheric correction were performed to ensure the accuracy of the spectral information. Calibration techniques, such as radiometric calibration, remove sensor-specific distortions and inconsistencies. For example, the Landsat program employs radiometric calibration to adjust digital numbers to the at-sensor radiance, thereby ensuring consistent reflectance values across different sensors and dates. Atmospheric correction methods, such as the Moderate Resolution Imaging Spectroradiometer (MODIS) atmospheric correction algorithm, compensate for the impact of atmospheric conditions, including aerosols and water vapor, on incoming radiation. These corrections are essential for achieving standardized reflectance values across different scenes and sensors, and datasets with varying spatial resolutions are often resampled to a standard grid size. Spatial resampling techniques such as nearest-neighbor, bilinear, and cubic convolution resampling have standardized satellite imagery and elevation data resolution, ensuring seamless integration for flood mapping and vulnerability assessment [78,79]. Quality control and accuracy assessment are integral components of data preprocessing. Researchers have implemented stringent quality control measures to identify and rectify errors in remote-sensing imagery, LiDAR data, and GIS layers.
Accuracy assessments involve comparing model outputs with observed data or ground-truth information to provide insight into the reliability and precision of flood extent predictions. Quantitative metrics, such as the Root Mean Square Error (RMSE) and accuracy percentages, are commonly used. RMSE was employed to quantify the difference between the predicted and observed values, offering a measure of the precision of the model. The accuracy percentages derived from the confusion matrices indicated the proportion of correctly classified pixels in the flood extent maps. RS- and GIS-based flood management studies may involve excluding areas with clouds or shadows from remote sensing imagery, masking irrelevant land cover types, or excluding low-quality data to ensure high quality and reliable outputs.
4.4. Methods and Techniques Utilized in the Studies
These studies have employed many methods and techniques to analyze spatial data, model flood dynamics, and derive actionable insights, including flood mapping classification and hydrological modeling. Various methods have been employed to delineate flood extents, identify inundated areas, and classify different types of floods based on their characteristics [80]. Hydrological modeling is fundamental in RS and GIS-based flood management studies, simulating water movement through river systems and floodplains, especially the Himalayas [81]. In Pakistan, hydrological models have been applied to assess river discharge and predict flood events in the Indus River basin [82]. In India, machine learning algorithms have been employed to evaluate flood vulnerability by integrating socioeconomic data, land use, and climate variables [83]. The flexibility of machine learning (ML) and artificial intelligence (AI) approaches allows the extraction of complex patterns from large datasets, thereby enhancing the predictive capabilities of flood management models.
Three-dimensional (3D) modeling and visualization techniques enhance the representation of flood dynamics by incorporating elevation information and spatial context. RS and GIS technologies facilitate the creation of 3D models that simulate flood scenarios, visualize inundation extents, and assess potential impacts on infrastructure [84,85]. Risk assessment methodologies and multi-criteria decision analysis (MCDA) are utilized in RS and GIS-based flood management studies to evaluate the potential impacts of floods on human populations, infrastructure, and the environment [86]. In Bangladesh, GIS-based early warning systems have been implemented to provide timely alerts to communities in flood-prone areas [87]. Participatory mapping has been employed to involve communities in identifying flood-prone areas and sharing local knowledge, especially in India [88]. Furthermore, Decision Support Systems (DSS) integrate RS and GIS technologies to assess flood risk and guide land-use planning efforts [89]. Thus, the methods and techniques employed in RS- and GIS-based flood management studies are diverse and multifaceted, reflecting the complex nature of flood-related challenges.
4.5. Planning Implications
The planning implications encompass various considerations, ranging from spatially informed decision making to developing resilient infrastructure and community engagement strategies. Spatial data generated through flood mapping, risk assessments, and vulnerability analyses provide crucial insights for planners and policymakers. 3D modeling has been employed to assess the vulnerability of urban infrastructure to floods to guide retrofitting efforts [90]. In Nepal, GIS-based early warning systems have been integrated with evacuation route planning to ensure that communities in flood-prone areas receive timely alerts and have access to safe evacuation routes [91,92]. Similarly, in Sri Lanka, decision support systems have informed the establishment of emergency shelters and coordinated evacuation efforts during floods [93]. These planning implications reduce potential loss of life and property during floods. In India, mobile applications and social media have been leveraged to disseminate real-time flood information and engage citizens in reporting flood impacts [94,95]. In Nepal and India, collaborative efforts have been initiated to share hydrological data and coordinate flood management strategies in the Ganges River basin [90,91,92]. GIS-based flood vulnerability mapping in Sri Lanka has informed climate-resilient urban design strategies [88,93].
GIS applications have been integrated into policy formulations to support the development of adaptive strategies for flood risk reduction and sustainable development [96,97]. In India, GIS applications have supported the integration of nature-based solutions into flood management strategies [95,96]. A critical planning implication of RS and GIS applications in flood management is the need to monitor and update spatial databases continuously for effective vulnerability assessments and to provide robust mitigation strategies [97,98,99,100]. In Nepal, continuous glacial lake outburst flood potential monitoring has been integrated into GIS platforms [46,47]. These implications highlight the transformative impact of spatial technologies on decision-making processes and the development of holistic strategies for mitigating the effects of floods in South Asia.
5. Conclusions, Limitations, and Future Prospects
This systematic review comprehensively evaluates the role of RS and GIS technologies in flood disaster management across South Asia. This review highlights current trends, methodologies, and future research directions. The primary objectives were to assess the extent of RS and GIS research for flood management, identify key themes, and provide actionable insights for future studies and policy development. The bibliometric analysis revealed a steady increase in research output, particularly after 2014, reflecting growing academic and practical interest in this area. The analysis highlighted three predominant keywords—climate change, vulnerability, and risk—indicating the key concerns and focus areas within the research community. India and Pakistan emerged as the leading contributors, accounting for the most publications between 2004 and 2024. The most prolific publishers of this research were Elsevier, Springer, and MDPI. Thematic analysis identified six critical research areas: flood risk assessment, flood monitoring, early flood warning systems, hydrological modeling, urban planning, and the integration of RS and GIS technologies. Collectively, these thematic areas emphasize the multifaceted role of RS and GIS in improving flood management strategies. The transformative impacts of these technologies were evident in enhanced early detection capabilities, precise vulnerability mapping, and support for decision-making, community engagement, and cross-border collaboration. While the progress is significant, multiple gaps and limitations remain, warranting further research. A major limitation is the uneven geographic distribution of studies, with most research focused on India and Pakistan, while flood-prone countries like Bhutan, Maldives, and Afghanistan remain underexplored. This regional disparity highlights the need for region-specific studies to address unique flood management challenges in underrepresented areas. Additionally, many studies emphasize technological advancements, but the integration of social and environmental dimensions, such as community engagement and socioeconomic impacts, remains limited. Ethical and privacy concerns related to the use of geospatial data are often overlooked, necessitating stronger data protection protocols. Furthermore, research on the long-term effectiveness of RS and GIS applications is limited, as most studies focus on short-term outcomes. Improved interoperability and data sharing between RS and GIS platforms could facilitate cross-border collaboration and data-driven decision-making. The potential of ML and AI to enhance flood risk modeling is still underexplored, presenting fertile ground for future studies to examine their applicability and impact. To address these gaps, this review proposes several future research directions. These include the integration of advanced technologies like ML, AI, and multi-sensor data fusion for real-time flood risk monitoring. Efforts should focus on enhancing spatial resolution, ensuring data interoperability, and strengthening cross-border collaboration to improve data-driven decision-making. Future studies should investigate ethical and privacy concerns and develop clear data protection protocols. To address climate-induced flood risks, researchers should explore climate change adaptation strategies, such as nature-based solutions and sustainable urban planning. Given that land use and land cover changes (e.g., deforestation and urbanization) significantly increase flood risks, future studies should assess these changes using RS and GIS technologies to inform sustainable development policies. Community-centric early warning systems and policy integration should be emphasized to enhance resilience. Utilizing CMIP6 (the Sixth Coupled Model Intercomparison Project) data for hydrological modeling, scenario analysis, and impact assessment could significantly improve predictive modeling and adaptation strategies. In this study, we aimed to consolidate a wealth of knowledge on the role of RS and GIS in flood disaster management, thereby offering valuable insights for researchers, policymakers, and disaster management practitioners. By addressing the identified gaps and utilizing the proposed future research directions, communities and governments in South Asia can enhance their resilience and improve flood management strategies. Moreover, the insights from this review have broader relevance for global flood management practices, through providing a model that can be adapted to other flood-prone regions worldwide. Sharing best practices, methodologies, and frameworks from South Asia would inform global strategies to mitigate the increasing risks of climate-induced flooding.
Author Contributions
Conceptualization: N.C.W., P.K.M., P.K. and G.M.; Methodology: N.C.W., P.K.M., C.G.K. and G.M.; Software: J.A.T.M. and N.C.W.; Validation: J.A.T.M., N.C.W. and P.K.M.; Formal Analysis: J.A.T.M. and N.C.W.; Investigation: N.C.W., P.K.M., C.G.K. and G.M.; Resources: N.C.W., P.K.M. and C.G.K.; Data Curation: J.A.T.M. and N.C.W.; Writing—Original Draft Preparation: J.A.T.M., N.C.W., P.K.M. and G.M.; Writing—Review and Editing: P.K.M., P.K. and G.M.; Visualization: J.A.T.M. and N.C.W.; Supervision: P.K.M., C.G.K. and G.M.; Project Administration: P.K.M. and P.K. All authors have read and agreed to the published version of the manuscript.
Funding
This research received no external funding.
Institutional Review Board Statement
Not applicable.
Informed Consent Statement
Not applicable.
Data Availability Statement
The data supporting the reported results are available on reasonable request to the first author.
Conflicts of Interest
The authors declare no conflicts of interest.
References
- Zscheischler, J.; Martius, O.; Westra, S.; Bevacqua, E.; Raymond, C.; Horton, R.M.; van den Hurk, B.; AghaKouchak, A.; Jézéquel, A.; Mahecha, M.D.; et al. A typology of compound weather and climate events. Nat. Rev. Earth Environ. 2020, 1, 333–347. [Google Scholar] [CrossRef]
- Andersen, T.K.; Shepherd, J.M. Floods in a changing climate. Geogr. Compass 2013, 7, 95–115. [Google Scholar] [CrossRef]
- Ashrafuzzaman, M.; Santos, F.D.; Dias, J.M.; Cerdà, A. Dynamics and causes of sea level rise in the coastal region of southwest Bangladesh at global, regional, and local levels. J. Mar. Sci. Eng. 2022, 10, 779. [Google Scholar] [CrossRef]
- Parks, B.C.; Roberts, J.T. Globalization, vulnerability to climate change, and perceived injustice. Soc. Nat. Resour. 2006, 19, 337–355. [Google Scholar] [CrossRef]
- Khayyam, U. Floods: Impacts on livelihood, economic status, and poverty in the north-west region of Paki-stan. Nat. Hazards 2020, 102, 1033–1056. [Google Scholar] [CrossRef]
- Memon, A.A.; Muhammad, S.; Rahman, S.; Haq, M. Flood monitoring and damage assessment using water indices: A case study of Pakistan flood-2012. Egypt. J. Remote Sens. Space Sci. 2015, 18, 99–106. [Google Scholar] [CrossRef]
- Sajjad, A.; Lu, J.; Chen, X.; Chisenga, C.; Saleem, N.; Hassan, H. Operational monitoring and damage assessment of riverine flood-2014 in the Lower Chenab Plain, Punjab, Pakistan, using remote sensing and GIS techniques. Remote Sens. 2020, 12, 714. [Google Scholar] [CrossRef]
- Dasvarma, G.L. Population and environmental issues in South Asia. In South Asia; Higgins, N., Ed.; Routledge: London, UK, 2016; pp. 64–76. [Google Scholar]
- Memon, F.S. Climate change and violence against women: Study of a flood-affected population in the rural area of Sindh, Pakistan. Pak. J. Women’s Stud. 2020, 27, 65–85. [Google Scholar] [CrossRef]
- Ranger, N.; Hallegatte, S.; Bhattacharya, S.; Bachu, M.; Priya, S.; Dhore, K.; Rafique, F.; Mathur, P.; Naville, N.; Henriet, F.; et al. An assessment of the potential impact of climate change on flood risk in Mumbai. Clim. Chang. 2011, 104, 139–167. [Google Scholar] [CrossRef]
- Geekiyanage, D.; Fernando, T.; Keraminiyage, K. Modelling interrelationships of the factors impeding community engagement in risk-sensitive urban planning: Evidence from Sri Lanka. Sustainability 2023, 15, 146–162. [Google Scholar] [CrossRef]
- Uddin, M.J.; Hasan, M.M.; Eisenreich, S.J.; Quevauviller, P. Strengthening pluvial flood risk management in the southeast region of Bangladesh: Lessons learned from the EU policy and practice. Environ. Proc. 2019, 6, 859–881. [Google Scholar] [CrossRef]
- Parvin, G.; Shimi, A.; Shaw, R.; Biswas, C. Flood in a changing climate: The impact on livelihood and how the rural poor cope in Bangladesh. Climate 2016, 4, 60. [Google Scholar] [CrossRef]
- Mirza, M.M.Q. Climate change, flooding in South Asia and implications. Reg. Environ. Chang. 2011, 11, 95–107. [Google Scholar] [CrossRef]
- Rizwan, M.; Li, X.; Chen, Y.; Anjum, L.; Hamid, S.; Yamin, M.; Chauhdary, J.N.; Shahid, M.A.; Mehmood, Q. Simulating future flood risks under climate change in the source region of the Indus River. J. Flood Risk Manag. 2023, 16, e12857. [Google Scholar] [CrossRef]
- Sarkar, U.K.; Borah, B.C. Flood plain wetland fisheries of India: With special reference to impact of climate change. Wetl. Ecol. Manag. 2018, 26, 1–15. [Google Scholar] [CrossRef]
- Sharma, T.P.; Zhang, J.; Koju, U.A.; Zhang, S.; Bai, Y.; Suwal, M.K. Review of flood disaster studies in Nepal: A remote sensing perspective. Int. J. Disaster Risk Reduct. 2019, 34, 18–27. [Google Scholar] [CrossRef]
- Wijesinghe, W.M.D.C.; Withanage, W.K.N.C. Detection of the changes in land use and land cover using remote sensing and GIS in Thalawa DS Division. Prathimana J. 2021, 14, 72–86. [Google Scholar]
- Withanage, N.C.; Wijesinghe, D.C.; Mishra, P.K.; Abdelrahman, K.; Mishra, V.; Fnais, M.S. An ecotourism suitability index for a world heritage city using GIS-multi criteria decision analysis techniques, Sri Lanka. Heliyon 2024, 10, e31585. [Google Scholar] [CrossRef]
- Wijesinghe, D.C.; Mishra, P.K.; Withanage, N.C.; Abdelrahman, K.; Mishra, V.; Tripathi, S.; Fnais, M.S. Application of GIS, Multi-Criteria Decision-Making Techniques for Mapping Groundwater Potential Zones: A Case Study of Thalawa Division, Sri Lanka. Water 2023, 15, 3462. [Google Scholar] [CrossRef]
- Wimalasena, K.H.M.D.P.; Withanage, W.K.N.C. A GIS-Based Spatial Variations Analysis of Water Quality in Domestic Wells in The Buttala Area, Sri Lanka. J. Soc. Sci. Hum. Rev. 2022, 6, 155–169. [Google Scholar] [CrossRef]
- Withanage, W.K.N.C.; Gunathilaka, M.D.K.L.; Mishra, P.K.; Wijesinghe, W.M.D.C.; Tripathi, S. Indexing habitat suitability and human-elephant conflicts using GIS-MCDA in a human-dominated landscape. Geogr. Sustain. 2023, 4, 343–355. [Google Scholar] [CrossRef]
- Jayasinghe, A.D.S.; Withanage, W.K.N.C. Geographical information system-based multi-criteria decision analysis of potato cultivation land suitability in Welimada divisional secretariat, Sri Lanka. Potato J. 2020, 47, 126–134. [Google Scholar]
- Withanage, W.K.N.C.; Mishra, P.K.; Jayasinghe, B.C. An Assessment of Spatio-temporal Land Use/Land Cover Dynamics Using Landsat Time Series Data (2008–2022) in Kuliyapitiya West Divisional Secretariat Division in Kurunagala District, Sri Lanka. J. Geospat. Surv. 2024, 4, 12–23. [Google Scholar] [CrossRef]
- Withanage, N.C.; Shi, K.; Shen, J. Extracting and Evaluating Urban Entities in China from 2000 to 2020 Based on SNPP-VIIRS-like Data. Remote Sens. 2023, 15, 4632. [Google Scholar] [CrossRef]
- Withanage, N.C.; Jingwei, S. Evaluating the Spatial-Temporal Dynamics of Urbanization in Prefecture Cities of China Using SNPP-VIIRS Nighttime Light Remote Sensing Data. Gazi Univ. J. Sci. Part A Eng. Innov. 2024, 11, 346–371. [Google Scholar] [CrossRef]
- Rijal, S.; Rimal, B.; Sloan, S. Flood hazard mapping of a rapidly urbanizing city in the foothills (Biren-dranagar, Surkhet) of Nepal. Land 2018, 7, 60. [Google Scholar] [CrossRef]
- Zzaman, R.U.; Nowreen, S.; Billah, M.; Islam, A.S. Flood hazard mapping of Sangu River basin in Bangladesh using multi-criteria analysis of hydro-geomorphological factors. J. Flood Risk Manag. 2021, 14, e12715. [Google Scholar] [CrossRef]
- Ali, K.; Bajracharyar, R.M.; Rau, N. Advances and challenges in flash flood risk assessment: A review. J. Geogr. Nat. Disasters 2017, 7, 195. [Google Scholar] [CrossRef]
- Faiz Ahmed, C.; Kranthi, N. Flood vulnerability assessment using geospatial techniques: Chennai, India. Indian J. Sci. Technol. 2018, 11, 1–13. [Google Scholar] [CrossRef]
- Samarasinghe, S.M.J.S.; Nandalal, H.K.; Weliwitiya, D.P.; Fowze, J.S.M.; Hazarika, M.K.; Samarakoon, L. Application of remote sensing and GIS for flood risk analysis: A case study at Kalu Ganga river, Sri Lanka. Int. Arch. Photogramm. Remote Sens. Spat. Inf. Sci. 2010, 18, 110–115. [Google Scholar]
- Nuwanka, M.W.R.; Withanage, W.K.N.C. A GIS-based framework for flood hazard vulnerability evaluation in Thudawa area, Sri Lanka. Int. J. Inf. Decis. Sci. 2024, 16, 90–108. [Google Scholar] [CrossRef]
- Saha, A.K.; Agrawal, S. Mapping and assessment of flood risk in Prayagraj district, India: A GIS and remote sensing study. Nanotechnol. Environ. Eng. 2020, 5, 11. [Google Scholar] [CrossRef]
- Vemula, S.; Srinivasa Raju, K.; Sai Veena, S. Modelling impact of future climate and land use land cover on flood vulnerability for policy support—Hyderabad, India. Water Policy 2020, 22, 733–747. [Google Scholar] [CrossRef]
- Ahmed, Y.; Choudhury, G.A.; Ahmed, M.S. Strategy formulation and adaptation pathways generation for sustainable development of western floodplain of Ganges. J. Water Resour. Prot. 2017, 9, 663–691. [Google Scholar] [CrossRef]
- Islam, M.M.; Ujiie, K.; Noguchi, R.; Ahamed, T. Flash flood-induced vulnerability and need assessment of wetlands using remote sensing, GIS, and econometric models. Remote Sens. Appl. 2022, 25, 100692. [Google Scholar] [CrossRef]
- Bunch, M.J.; Kumaran, T.V.; Josep, R. Using geographic information systems (GIS) for spatial planning and environmental management in India: Critical considerations. Int. J. Appl. Sci. Tech. 2012, 2, 40–54. [Google Scholar]
- Bhatta, B. Analysis of urban growth pattern using remote sensing and GIS: A case study of Kolkata, India. Int. J. Remote Sens. 2009, 30, 4733–4746. [Google Scholar] [CrossRef]
- Rahman, A. Application of remote sensing and GIS technique for urban environmental management and sustainable development of Delhi, India. In Applied Remote Sensing for Urban Planning, Governance and Sustainability; Springer: Berlin/Heidelberg, Germany, 2007; pp. 165–197. [Google Scholar] [CrossRef]
- Arnall, A.; Oswald, K.; Davies, M.; Mitchell, T.; Coirolo, C. Adaptive social protection: Mapping the evidence and policy context in the agriculture sector in South Asia. In IDS Working Papers; John Wiley & Sons Ltd.: Hoboken, NJ, USA, 2010; pp. 11–70. [Google Scholar]
- Sattar, A.; Haritashya, U.K.; Kargel, J.S.; Leonard, G.J.; Shugar, D.H.; Chase, D.V. Modeling lake outburst and down-stream hazard assessment of the Lower Barun Glacial Lake, Nepal Himalaya. J. Hydrol. 2021, 598, 126208. [Google Scholar] [CrossRef]
- Deroliya, P.; Ghosh, M.; Mohanty, M.P.; Ghosh, S.; Rao, K.; HV, D.; Karmakar, S. A novel flood risk mapping approach with machine learning considering geomorphic and socio-economic vulnerability dimensions. Sci. Total Environ. 2022, 851, 158002. [Google Scholar] [CrossRef]
- Singha, M.; Dong, J.; Sarmah, S.; You, N.; Zhou, Y.; Zhang, G.; Doughty, R.; Xiao, X. Identifying floods and flood-affected paddy rice fields in Bangladesh based on sentinel-1 imagery and google earth engine. ISPRS J. Photogramm. Remote Sens. 2020, 166, 278–293. [Google Scholar] [CrossRef]
- Fakhruddin, S.H.M.; Kawasaki, A.; Babel, M.S. Community responses to flood early warning system: Case study in Kaijuri Union, Bangladesh. Int. J. Disaster Risk Reduct. 2015, 14, 323–331. [Google Scholar] [CrossRef]
- Rinzin, S.; Zhang, G.; Wangchuk, S. Glacial Lake Area Change and Potential Outburst Flood Hazard Assessment in the Bhutan Himalaya. Front. Earth Sci. 2021, 9, 775195. [Google Scholar] [CrossRef]
- Shrestha, A.B.; Eriksson, M.; Mool, P.; Ghimire, P.; Mishra, B.; Khanal, N.R. Glacial lake outburst flood risk assessment of Sun Koshi basin, Nepal. Geomatics Nat. Hazards Risk 2010, 1, 157–169. [Google Scholar] [CrossRef]
- Rounce, D.R.; McKinney, D.C.; Lala, J.M.; Byers, A.C.; Watson, C.S. A new remote hazard and risk assessment framework for glacial lakes in the Nepal Himalaya. Hydrol. Earth Syst. Sci. 2016, 20, 3455–3475. [Google Scholar] [CrossRef]
- Sanyal, J.; Lu, X.X. Application of remote sensing in flood management with special reference to monsoon Asia: A review. Nat. Hazards 2004, 33, 283–301. [Google Scholar] [CrossRef]
- Sagintayev, Z.; Sultan, M.; Khan, S.D.; Khan, S.A.; Mahmood, K.; Yan, E.; Milewski, A.; Marsala, P. A remote sensing contribution to hydrologic modelling in arid and inaccessible watersheds, Pishin Lora basin, Pakistan. Hydrol. Process. 2012, 26, 85–99. [Google Scholar] [CrossRef]
- Parajuli, G.; Neupane, S.; Kunwar, S.; Adhikari, R.; Acharya, T.D. A GIS-based evacuation route planning in flood-susceptible area of Siraha municipality, Nepal. ISPRS Int. J. Geo-Inf. 2023, 12, 286. [Google Scholar] [CrossRef]
- Allen, S.K.; Sattar, A.; King, O.; Zhang, G.; Bhattacharya, A.; Yao, T.; Bolch, T. Glacial lake outburst flood hazard under current and future conditions: Worst-case scenarios in a transboundary Himalayan basin. Nat. Hazards Earth Syst. Sci. 2022, 22, 3765–3785. [Google Scholar] [CrossRef]
- Ahmed, R.; Rawat, M.; Wani, G.F.; Ahmad, S.T.; Ahmed, P.; Jain, S.K.; Meraj, G.; Mir, R.A.; Rather, A.F.; Farooq, M. Glacial lake outburst flood hazard and risk assessment of Gangabal Lake in the Upper Jhelum Basin of Kashmir Himalaya using geospatial technology and hydrodynamic modeling. Remote Sens. 2022, 14, 5957. [Google Scholar] [CrossRef]
- Bhuvana, N.; Aram, A.I. Facebook and WhatsApp as disaster management tools during the Chennai (India) floods of 2015. Int. J. Disaster Risk Reduct. 2019, 39, 101135. [Google Scholar] [CrossRef]
- Hoque, R.; Nakayama, D.; Matsuyama, H.; Matsumoto, J. Flood monitoring, mapping and assessing capabilities using RADARSAT remote sensing, GIS and ground data for Bangladesh. Nat. Hazards 2011, 57, 525–548. [Google Scholar] [CrossRef]
- Rehman, S.; Sayeed, M.; Hasan, U.; Rai, A.K.; Avtar, R.; Sajjad, H. Assessing flood-induced ecological vulnerability and risk using GIS-based in situ measurements in Bhagirathi sub-basin, India. Arab. J. Geosci. 2021, 14, 1520. [Google Scholar] [CrossRef]
- Wijesinghe, W.M.D.C.; Mishra, P.K.; Tripathi, S.; Abdelrahman, K.; Tiwari, A.; Fnais, M.S. Integrated flood hazard vulnerability modeling of Neluwa (Sri Lanka) using analytical hierarchy process and geospatial techniques. Water 2023, 15, 1212. [Google Scholar] [CrossRef]
- Waseem, B.H.; Rana, I.A. Floods in Pakistan: A state-of-the-art review. Nat. Hazards Res. 2023, 3, 359–373. [Google Scholar] [CrossRef]
- Blaschke, T. Object based image analysis for remote sensing. ISPRS J. Photogramm. 2010, 65, 2–16. [Google Scholar] [CrossRef]
- Bassi, N.; Kumar, M.D.; Shrma, A.; Pardha-Saradhi, P. Status of wetlands in India: A review of extent, ecosystem benefits, threats and management strategies. J. Hydrol. 2014, 2, 1–19. [Google Scholar] [CrossRef]
- Sheppard, S.R.J.; Cizek, P. The ethics of Google Earth: Crossing thresholds from spatial data to landscape visualisation. J. Environ. Manag. 2009, 90, 2102–2117. [Google Scholar] [CrossRef]
- Sun, A.Y.; Scanlon, B.R. How can Big Data and machine learning benefit environment and water management: A survey of methods, applications, and future directions. Environ. Res. Lett. 2019, 14, 073001. [Google Scholar] [CrossRef]
- Comiti, F.; Da Canal, M.; Surian, N.; Mao, L.; Picco, L.; Lenzi, M.A. Channel adjustments and vegetation cover dynamics in a large gravel-bed river over the last 200 years. Geomorphology 2010, 125, 147–159. [Google Scholar] [CrossRef]
- Sanyal, J.; Lu, X.X. Remote sensing and GIS-based flood vulnerability assessment of human settlements: A case study of Gangetic West Bengal, India. Hydrol. Process. 2005, 19, 3699–3716. [Google Scholar] [CrossRef]
- Kargel, J.; Furfaro, R.; Kaser, G.; Leonard, G.; Fink, W.; Huggel, C.; Kääb, A.; Raup, B.; Reynolds, J.; Wolfe, D.; et al. (Eds.) ASTER imaging and analysis of glacier hazards. In Land Remote Sensing and Global Environmental Change; Remote Sensing and Digital Image Processing; Springer: New York, NY, USA, 2010; Volume 11, pp. 323–373. [Google Scholar] [CrossRef]
- Neill, A.O. Analytical Hierarchical Modeling of Glacial Lake Outburst Flood Potential in the Khumbu Region, Nepal. Ph.D. Dissertation, Appalachian State University, Khumbu, Nepal, 2021. [Google Scholar]
- Gautam, M.R.; Timilsina, G.R.; Acharya, K. Climate change in the Himalayas: Current state of knowledge. Policy Res. Work. Pap. 2013, 6516, 1–64. [Google Scholar]
- Kaltenborn, B.P.; Nellemann, C.; Vistnes, I.I. (Eds.) High Mountain Glaciers and Climate Change: Challenges to Human Livelihoods and Adaptation; United Nations Environment Programme, GRID-Arendal; Birkeland Trykkeri AS: Birkeland, Norway, 2010; pp. 6–52. [Google Scholar]
- Guillaumont, P. Vulnerability and Resilience: A Conceptual Framework Applied to Three Asian Countries—Bhutan, Maldives, and Nepal; ADB South Asia working paper series; Asian Development Bank: Mandaluyong, Philippines, 2017; Volume 53, pp. 1–76. [Google Scholar]
- Emmanuel, O. Application of remote sensing and geographical information systems in flood management: A review. Res. J. Appl. Sci. 2013, 6, 1884–1894. [Google Scholar] [CrossRef]
- Yu, D.J.; Haeffner, M.; Jeong, H.; Pande, S.; Dame, J.; Di Baldassarre, G.; Garcia-Santos, G.; Hermans, L.; Muneepeerakul, R.; Nardi, F.; et al. On capturing human agency and methodological interdisciplinarity in socio-hydrology research. Hydrol. Sci. J. 2022, 67, 1905–1916. [Google Scholar] [CrossRef]
- Telli, K.; Kraa, O.; Himeur, Y.; Ouamane, A.; Boumehraz, M.; Atalla, S.; Mansoor, W. A comprehensive review of recent research trends on unmanned aerial vehicles (UAVs). Systems 2023, 11, 400. [Google Scholar] [CrossRef]
- Munawar, H.S.; Hammad, A.W.A.; Waller, S.T. A review on flood management technologies related to image processing and machine learning. Autom. Constr. 2021, 132, 103916. [Google Scholar] [CrossRef]
- Yuan, F.; Fan, C.; Farahmand, H.; Coleman, N.; Esmalian, A.; Lee, C.C.; Patrascu, F.I.; Zhang, C.; Dong, S.; Mostafavi, A. Smart flood resilience: Harnessing community-scale big data for predictive flood risk monitoring, rapid impact assessment, and situational awareness. Environ. Res. Infrastruct. Sustain. 2022, 2, 025006. [Google Scholar] [CrossRef]
- Amaratunga, D.; Malalgoda, C.; Haigh, R.; Panda, A.; Rahayu, H. Sound practices of disaster risk reduction at local level. Procedia Eng. 2018, 212, 1163–1170. [Google Scholar] [CrossRef]
- Rauf, A.; Ghumman, A. Impact assessment of rainfall-runoff simulations on the flow duration curve of the upper Indus River: A comparison of data-driven and hydrologic models. Water 2018, 10, 876. [Google Scholar] [CrossRef]
- Sattaru, J.S.; Bhatt, C.M.; Saran, S. Utilizing geosocial media as a proxy data for enhanced flood Monitoring. J. Indian Soc. Remote Sens. 2021, 49, 2173–2186. [Google Scholar] [CrossRef]
- Li, Y.; Osei, F.B.; Hu, T.; Stein, A. Urban flood susceptibility mapping based on social media data in Chengdu City, China. Sustain. Cities Soc. 2023, 88, 104307. [Google Scholar] [CrossRef]
- Helmrich, A.M.; Ruddell, B.L.; Bessem, K.; Chester, M.V.; Chohan, N.; Doerry, E.; Eppinger, J.; Garcia, M.; Goodall, J.L.; Lowry, C.; et al. Opportunities for crowdsourcing in urban flood monitoring. Environ. Model. Softw. 2021, 143, 105124. [Google Scholar] [CrossRef]
- Amante, C.J.; Love, M.; Carignan, K.; Sutherland, M.G.; MacFerrin, M.; Lim, E. Continuously updated digital elevation models (CUDEMs) to support coastal inundation modeling. Remote Sens. 2023, 15, 1702. [Google Scholar] [CrossRef]
- Ban, H.J.; Kwon, Y.J.; Shin, H.; Ryu, H.S.; Hong, S. Flood monitoring using satellite-based RGB composite imagery and refractive index retrieval in visible and near-infrared bands. Remote Sens. 2017, 9, 313. [Google Scholar] [CrossRef]
- Khan, S.I.; Flamig, Z.; Hong, Y. Flood monitoring system using distributed hydrologic modeling for Indus River Basin. In Water Security and Sustainability; Elsevier: Amsterdam, The Netherlands, 2019; pp. 335–355. [Google Scholar] [CrossRef]
- Kilsedar, C.E.; Fissore, F.; Pirotti, F.; Brovelli, M.A. Extraction and visualization of 3D building models in urban areas for flood simulation. Int. Arch. Photogramm. Remote Sens. Spat. Inf. Sci. 2019, 19, 669–673. [Google Scholar] [CrossRef]
- Vamvakeridou-Lyroudia, L.S.; Chen, A.S.; Khoury, M.; Gibson, M.J.; Kostaridis, A.; Stewart, D.; Wood, M.; Djordjevic, S.; Savic, D.A. Assessing and visualizing hazard impacts to enhance the resilience of critical infrastructures to urban flooding. Sci. Total Environ. 2020, 707, 136078. [Google Scholar] [CrossRef]
- Bhuyan, M.J.; Deka, N.; Saikia, A. Micro-spatial flood risk assessment in Nagaon district, Assam (India) using GIS-based multi-criteria decision analysis (MCDA) and analytical hierarchy process (AHP). Risk Anal. 2023, 44, 817–832. [Google Scholar] [CrossRef]
- Sukhwani, V.; Shaw, R. Operationalizing crowdsourcing through mobile applications for disaster management in India. Prog. Disaster Sci. 2020, 5, 100052. [Google Scholar] [CrossRef]
- Mahmoud, S.H.; Gan, T.U. Urbanization and climate change implications in flood risk management: Developing an efficient decision support system for flood susceptibility mapping. Sci. Total Environ. 2018, 636, 152–167. [Google Scholar] [CrossRef]
- Shadabfar, M.; Mahsuli, M.; Zhang, Y.; Xue, Y.; Ayyub, B.M.; Huang, H.; Medina, R.A. Resilience-based design of infrastructure: Review of models, methodologies, and computational tools. ASCE-ASME J. Risk Uncertain. Eng. Syst. 2022, 8, 03121004. [Google Scholar] [CrossRef]
- Cooray, M.S.S.; Bandara, A.A.N.S.; Perera, A.A.H.; Lankeshwarie, A.B.D.; Dassanayake, S.M.; Prasanna, R. Com-munity-based evacuation routes for hydrometeorological hazards resilience: A case study of Ratnapura district in Sri Lanka. In Proceedings of the 6th International Conference on Business Research (ICBR 2023), Moratuwa, Sri Lanka, 4 December 2023; pp. 1–12. [Google Scholar] [CrossRef]
- Kumar, S.; Thomas, A.; Panicker, V.V. Analysis of community engagement on social networking sites during the Kerala floods in 2018. In Recent Advances in Mechanical Engineering. ICRAMERD 2022; Lecture Notes in Mechanical Engineering; Tripathy, S., Samantaray, S., Ramkumar, J., Mahapatra, S.S., Eds.; Springer: Singapore, 2022; pp. 117–126. [Google Scholar] [CrossRef]
- Karki, M.B.; Shrestha, A.B.; Winiger, M. Enhancing knowledge management and adaptation capacity for integrated management of water resources in the Indus River Basin. Mt. Res. Dev. 2019, 31, 242–251. [Google Scholar] [CrossRef]
- Rasul, G. Why Eastern Himalayan countries should cooperate in transboundary water resource management. Water Policy 2014, 16, 19–38. [Google Scholar] [CrossRef]
- Krivtsov, V.; Ahilan, S.; Arthur, S.; Birkinshaw, S.; Dawson, D.; Everett, G.; Glenis, V.; Kapetas, L.; Kilsby, C.; Lamond, J.; et al. Blue-Green cities: Achieving urban flood resilience, water security, and biodiversity. In The Palgrave Encyclopedia of Urban and Regional Futures; Springer International Publishing: New York, NY, USA, 2022; pp. 86–93. [Google Scholar] [CrossRef]
- Jayasiri, G.P.; Siriwardena, C.S.A.; Hettiarachchi, S.S.L.; Dissanayake, P.B.R.; Bandara, C.S. Evaluation of community resilience aspects of Sri Lankan coastal districts. Int. J. Adv. Sci. Eng. Inf. Tech. 2018, 8, 2161. [Google Scholar] [CrossRef]
- Ran, J.; Nedovic-Budic, Z. Integrating spatial planning and flood risk management: A new conceptual framework for the spatially integrated policy infrastructure. Comput. Environ. Urban Syst. 2016, 57, 68–79. [Google Scholar] [CrossRef]
- Dhyani, S.; Lahoti, S.; Khare, S.; Pujari, P.; Verma, P. Ecosystem based disaster risk reduction approaches (EBDRR) as a prerequisite for inclusive urban transformation of Nagpur City, India. Int. J. Disaster Risk Reduct. 2018, 32, 95–105. [Google Scholar] [CrossRef]
- Saikia, P.; Nag, A.; Kumari, R.; Kumar, A.; Khan, M.L. Forest degradation prevention through nature-based solutions. In Handbook of Ecological and Ecosystem Engineering; Wiley: Hoboken, NJ, USA, 2021; pp. 333–352. [Google Scholar] [CrossRef]
- Rather, M.A.; Meraj, G.; Farooq, M.; Shiekh, B.A.; Kumar, P.; Kanga, S.; Singh, S.K.; Sahu, N.; Tiwari, S.P. Identifying the potential dam sites to avert the risk of catastrophic floods in the Jhelum Basin, Kashmir, NW Himalaya, India. Remote Sens. 2022, 14, 1538. [Google Scholar] [CrossRef]
- Meraj, G.; Romshoo, S.A.; Yousuf, A.R.; Altaf, S.; Altaf, F. Assessing the influence of watershed characteristics on the flood vulnerability of Jhelum basin in Kashmir Himalaya. Nat. Hazards 2015, 77, 153–175. [Google Scholar] [CrossRef]
- Debnath, J.; Sahariah, D.; Mazumdar, M.; Lahon, D.; Meraj, G.; Hashimoto, S.; Kumar, P.; Singh, S.K.; Kanga, S.; Chand, K.; et al. Evaluating flood susceptibility in the brahmaputra river basin: An insight into Asia’s Eastern Himalayan floodplains using machine learning and multi-criteria decision-making. Earth Syst. Environ. 2023, 7, 733–760. [Google Scholar] [CrossRef]
- Debnath, J.; Sahariah, D.; Nath, N.; Saikia, A.; Lahon, D.; Islam, M.N.; Hashimoto, S.; Meraj, G.; Kumar, P.; Singh, S.K. Modelling on assessment of flood risk susceptibility at the Jia Bharali River basin in Eastern Himalayas by integrating multicollinearity tests and geospatial techniques. Model. Earth Syst. Environ. 2024, 10, 2393–2419. [Google Scholar] [CrossRef]
Disclaimer/Publisher’s Note: The statements, opinions and data contained in all publications are solely those of the individual author(s) and contributor(s) and not of MDPI and/or the editor(s). MDPI and/or the editor(s) disclaim responsibility for any injury to people or property resulting from any ideas, methods, instructions or products referred to in the content. |
© 2024 by the authors. Licensee MDPI, Basel, Switzerland. This article is an open access article distributed under the terms and conditions of the Creative Commons Attribution (CC BY) license (https://creativecommons.org/licenses/by/4.0/).