3. Results
3.1. LULC Changes
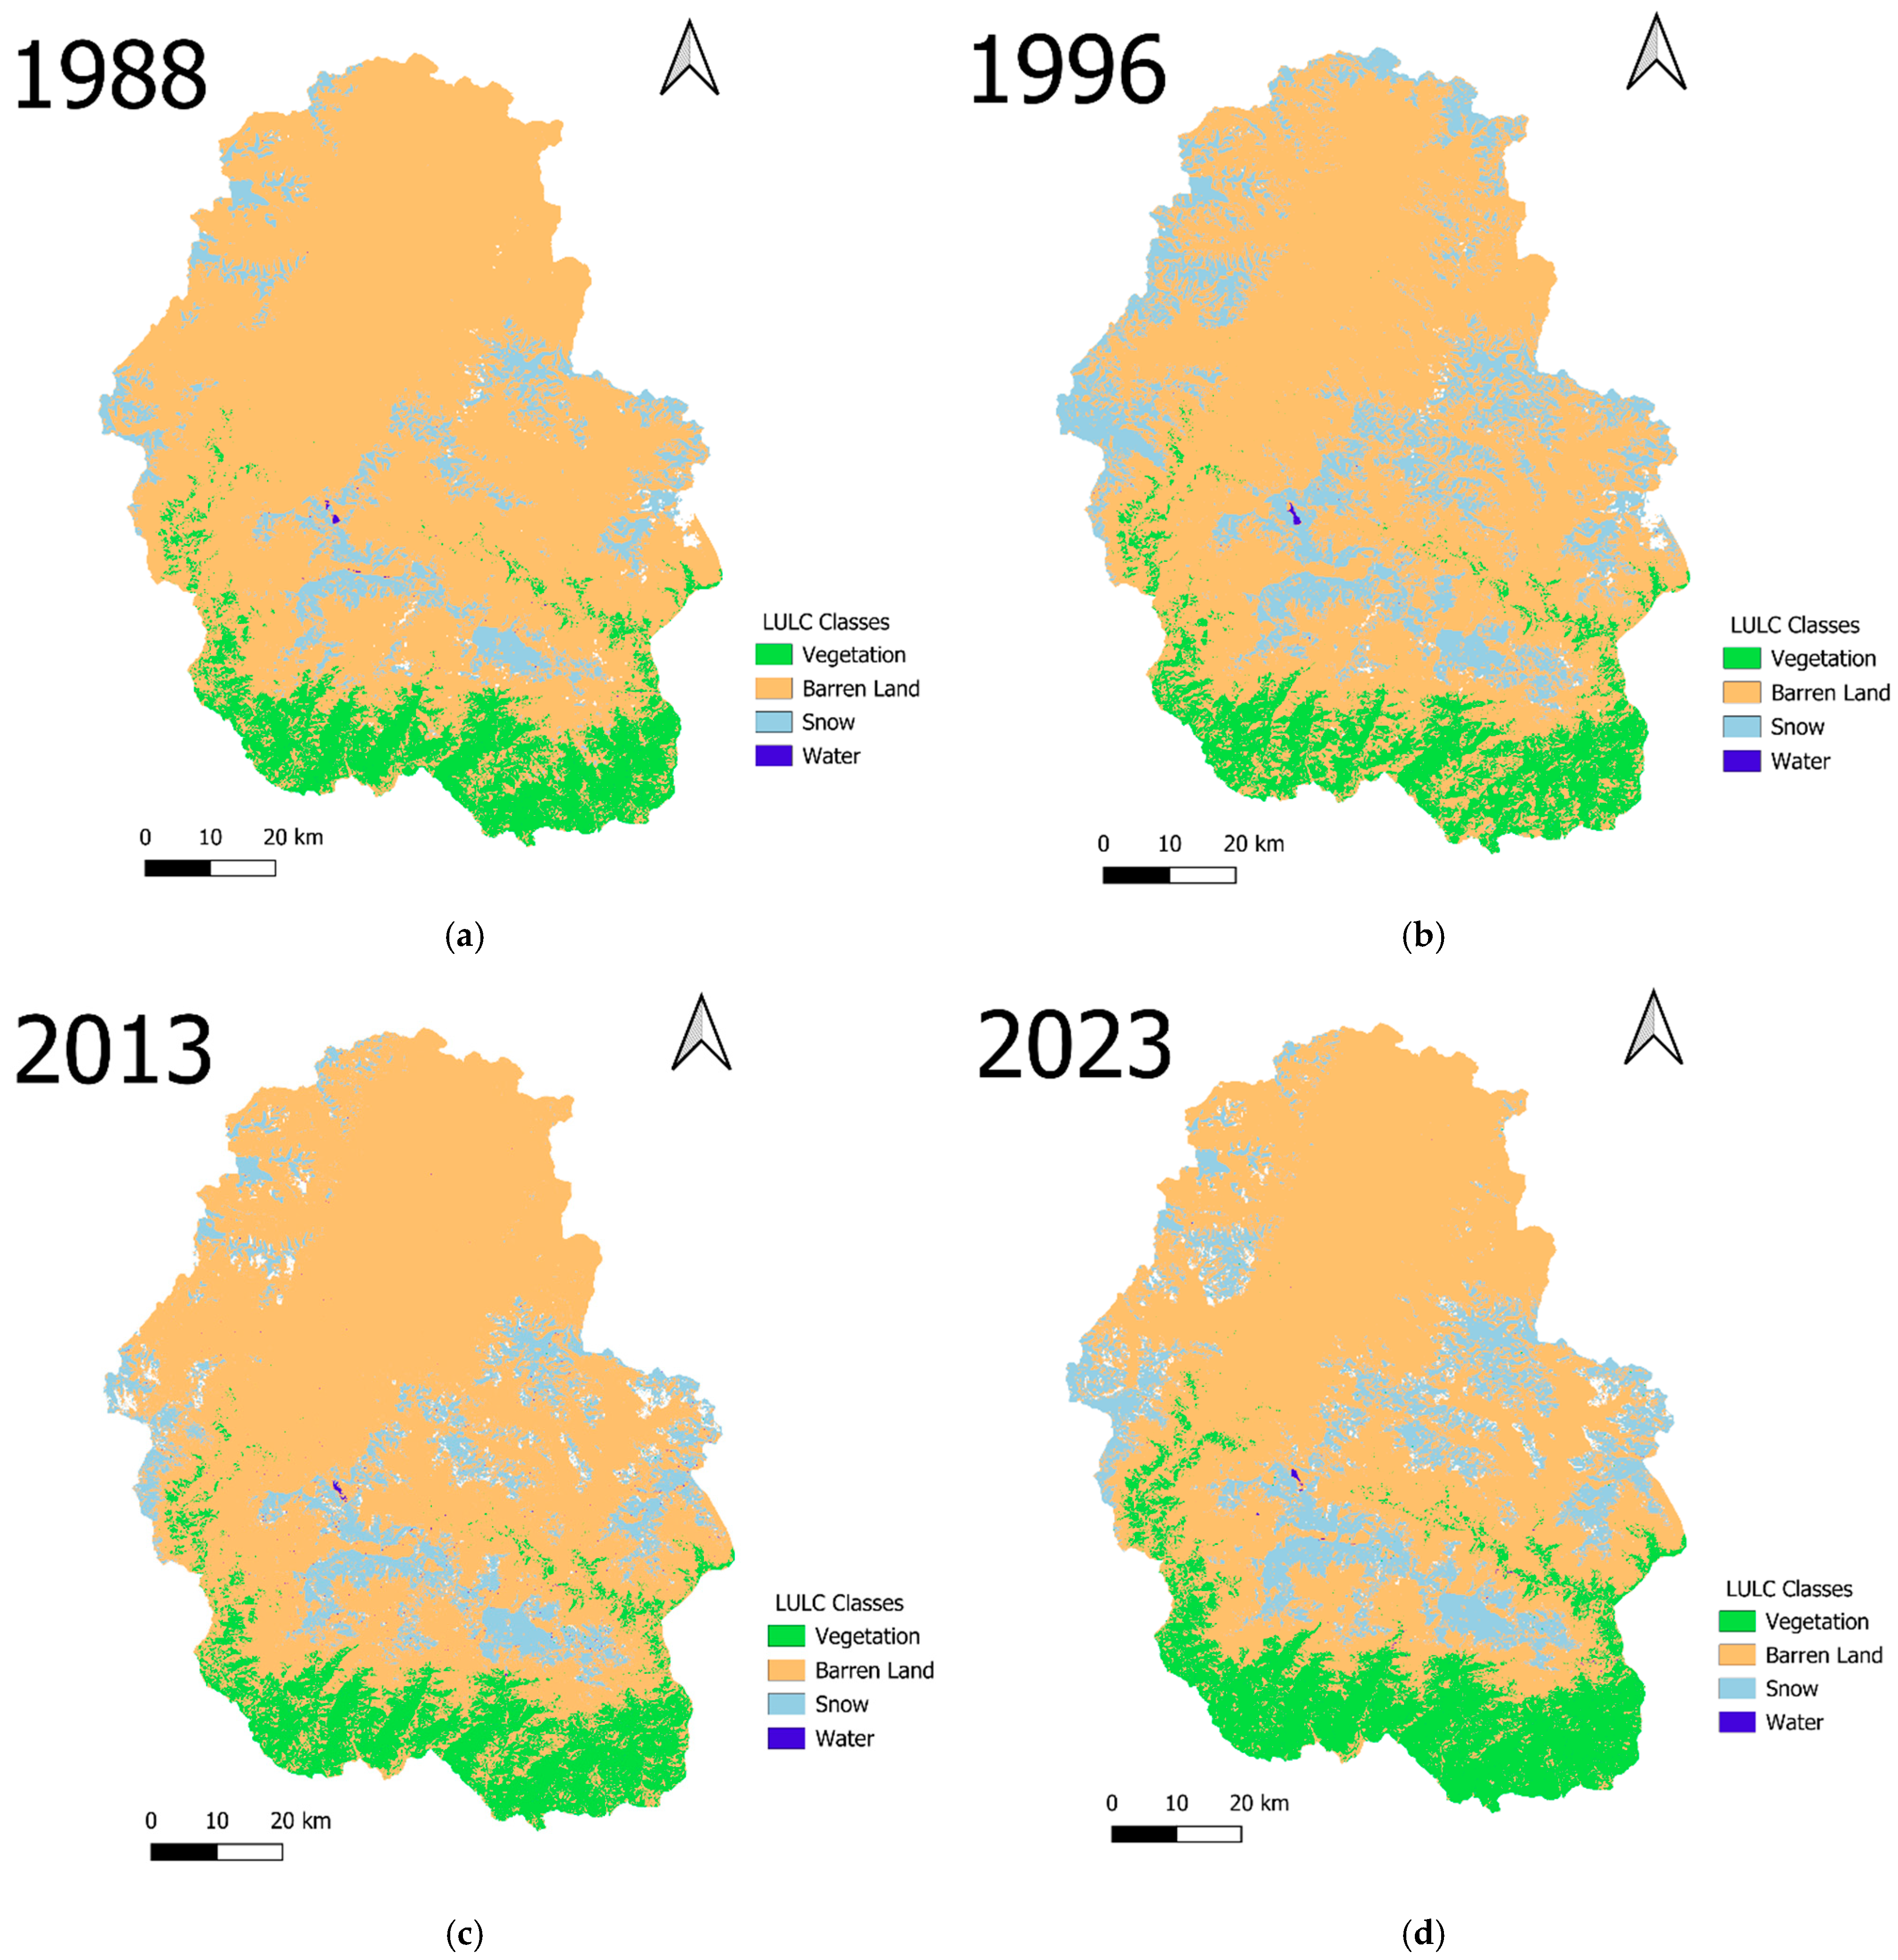
The supervised classification of Landsat images for the years 1988, 1996, 2013, and 2023 revealed significant changes in the distribution of land cover classes as shown in
Figure 3.
Table 3 provides a quantitative analysis of changes in LULC classes over the study period, revealing key trends such as the expansion of vegetation cover and reductions in barren land.
From 1988 to 2023, notable changes were observed across all land cover classes in the Annapurna region. Vegetation cover expanded significantly from 57,858.84 ha in 1988 to 77,634.27 ha in 2023, reflecting conservation efforts, afforestation programs, and the effects of climate-induced shifts in vegetation zones. Snow cover exhibited variability, peaking at 95,991.75 ha in 1996 but declining to 80,323.38 ha in 2023, indicating the impact of reduced snowfall and temperature increases. Barren land decreased consistently over the study period, from 389,018.9 ha in 1988 to 331,252.8 ha in 2023, driven by afforestation and land restoration efforts. Water bodies, while showing some fluctuations, remained relatively stable, increasing slightly from 207.72 ha in 1988 to 222.93 ha in 2023. These trends illustrate the interplay of conservation initiatives, climatic changes, and land use dynamics in shaping the region’s landscape.
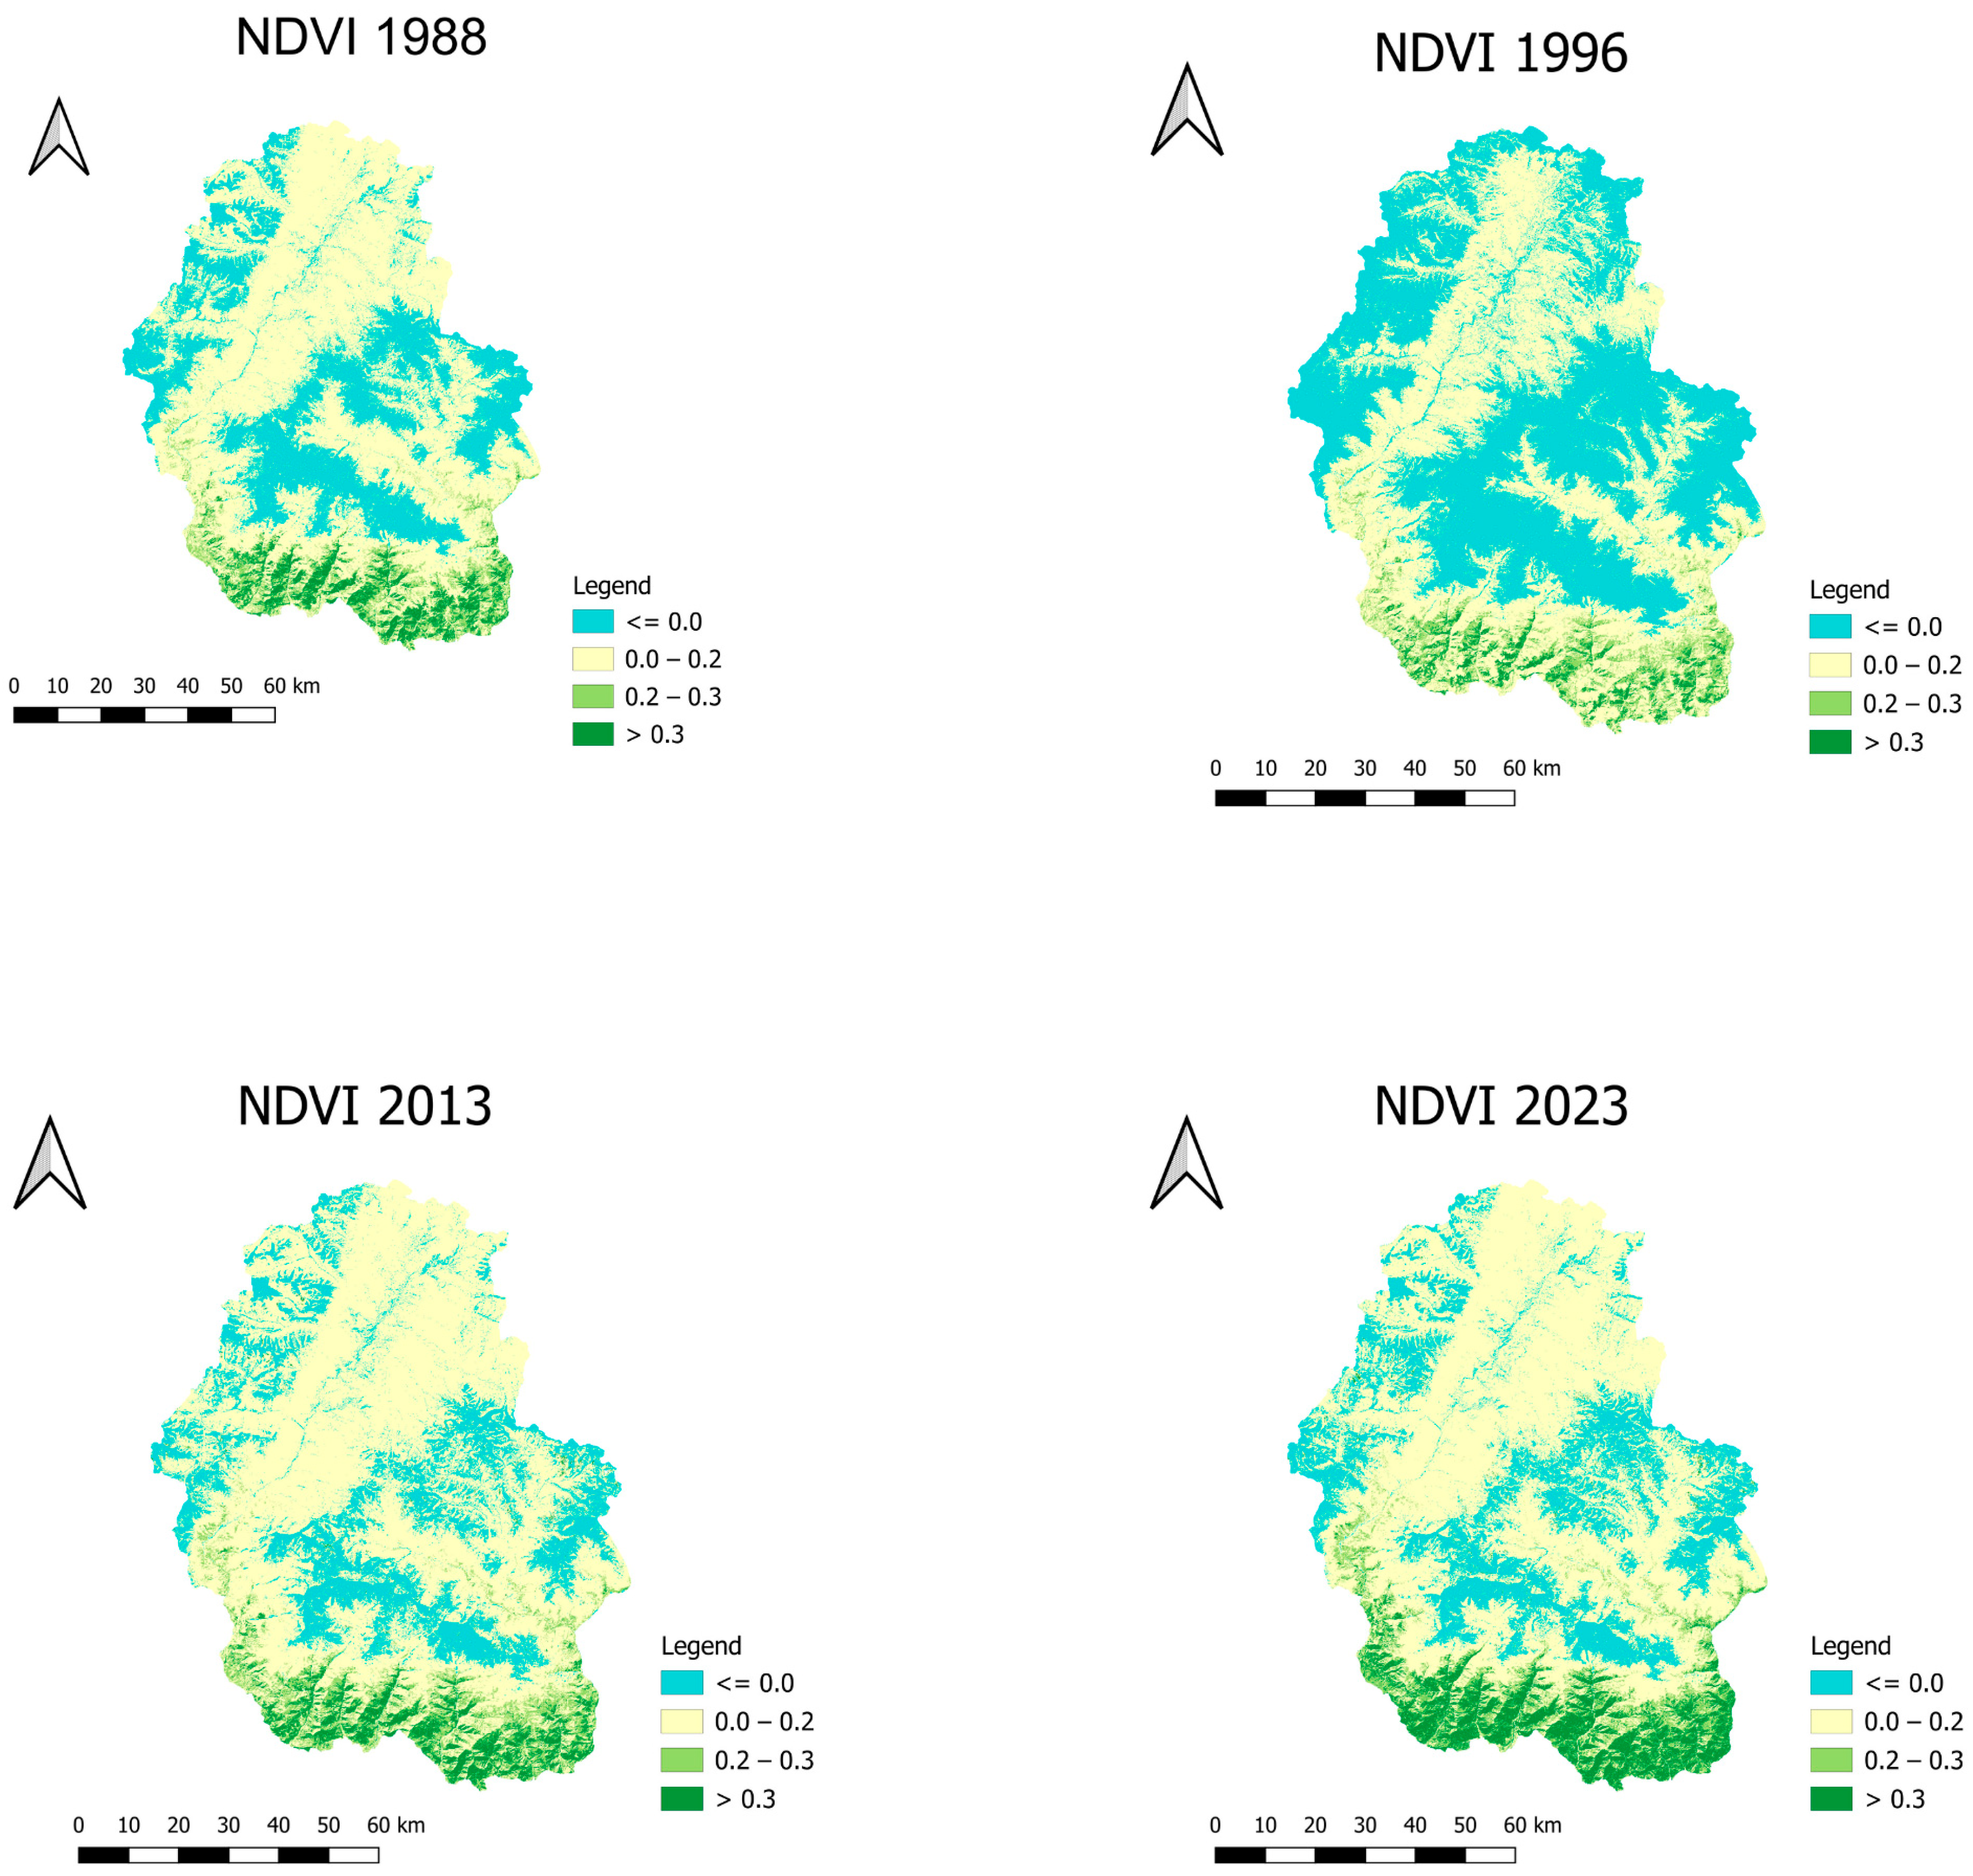
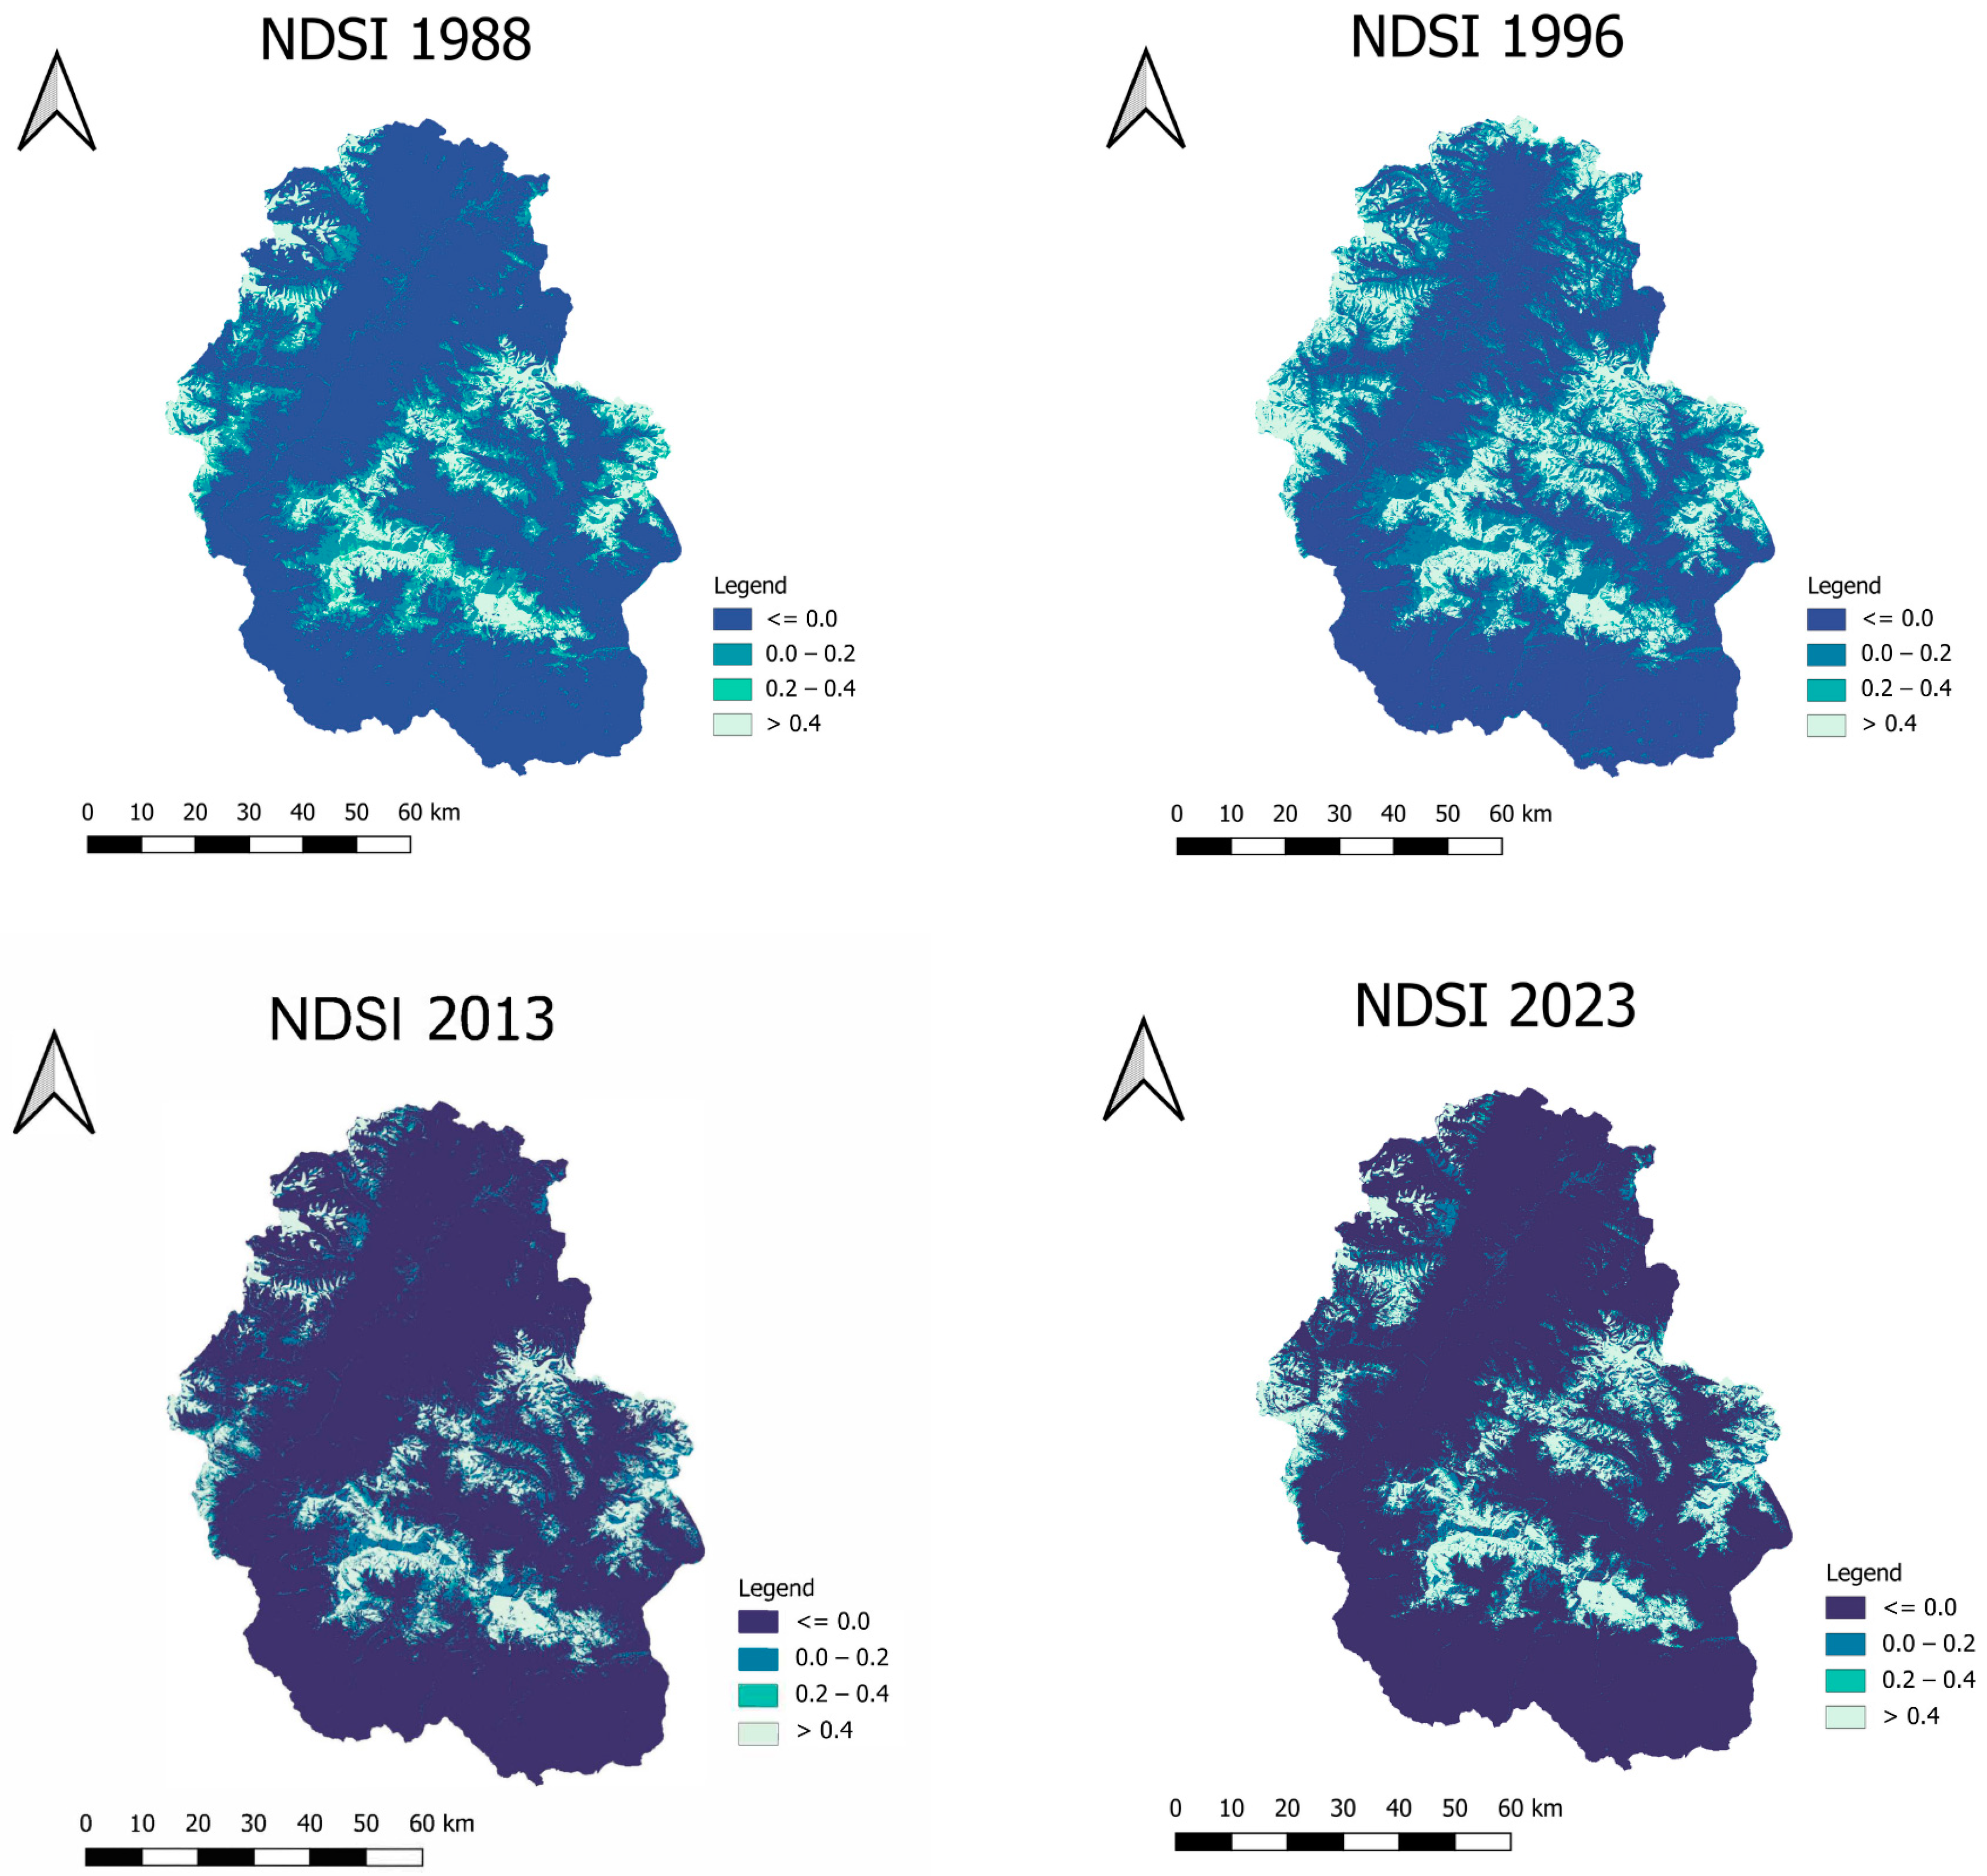
3.2. Vegetation Health and Snow Cover Trends
NDVI values increased significantly, with the highest values observed in 2023 (up to +0.98) compared to the lowest in 1988 (up to +0.46) as shown in
Table 4. Areas with high NDVI values expanded over time.
For NDSI, the values in 2023 and 2013 averaged −0.109 and −0.094, respectively, suggesting a lower range of snow cover. The earlier years, 1996 and 1988, showed average values of 0.176 and 0.157, respectively, more than that of later years. For details, check
Appendix A.
Table 4 presents the minimum, maximum, and average NDVI and NDSI values.
3.3. Climate Variability Analysis
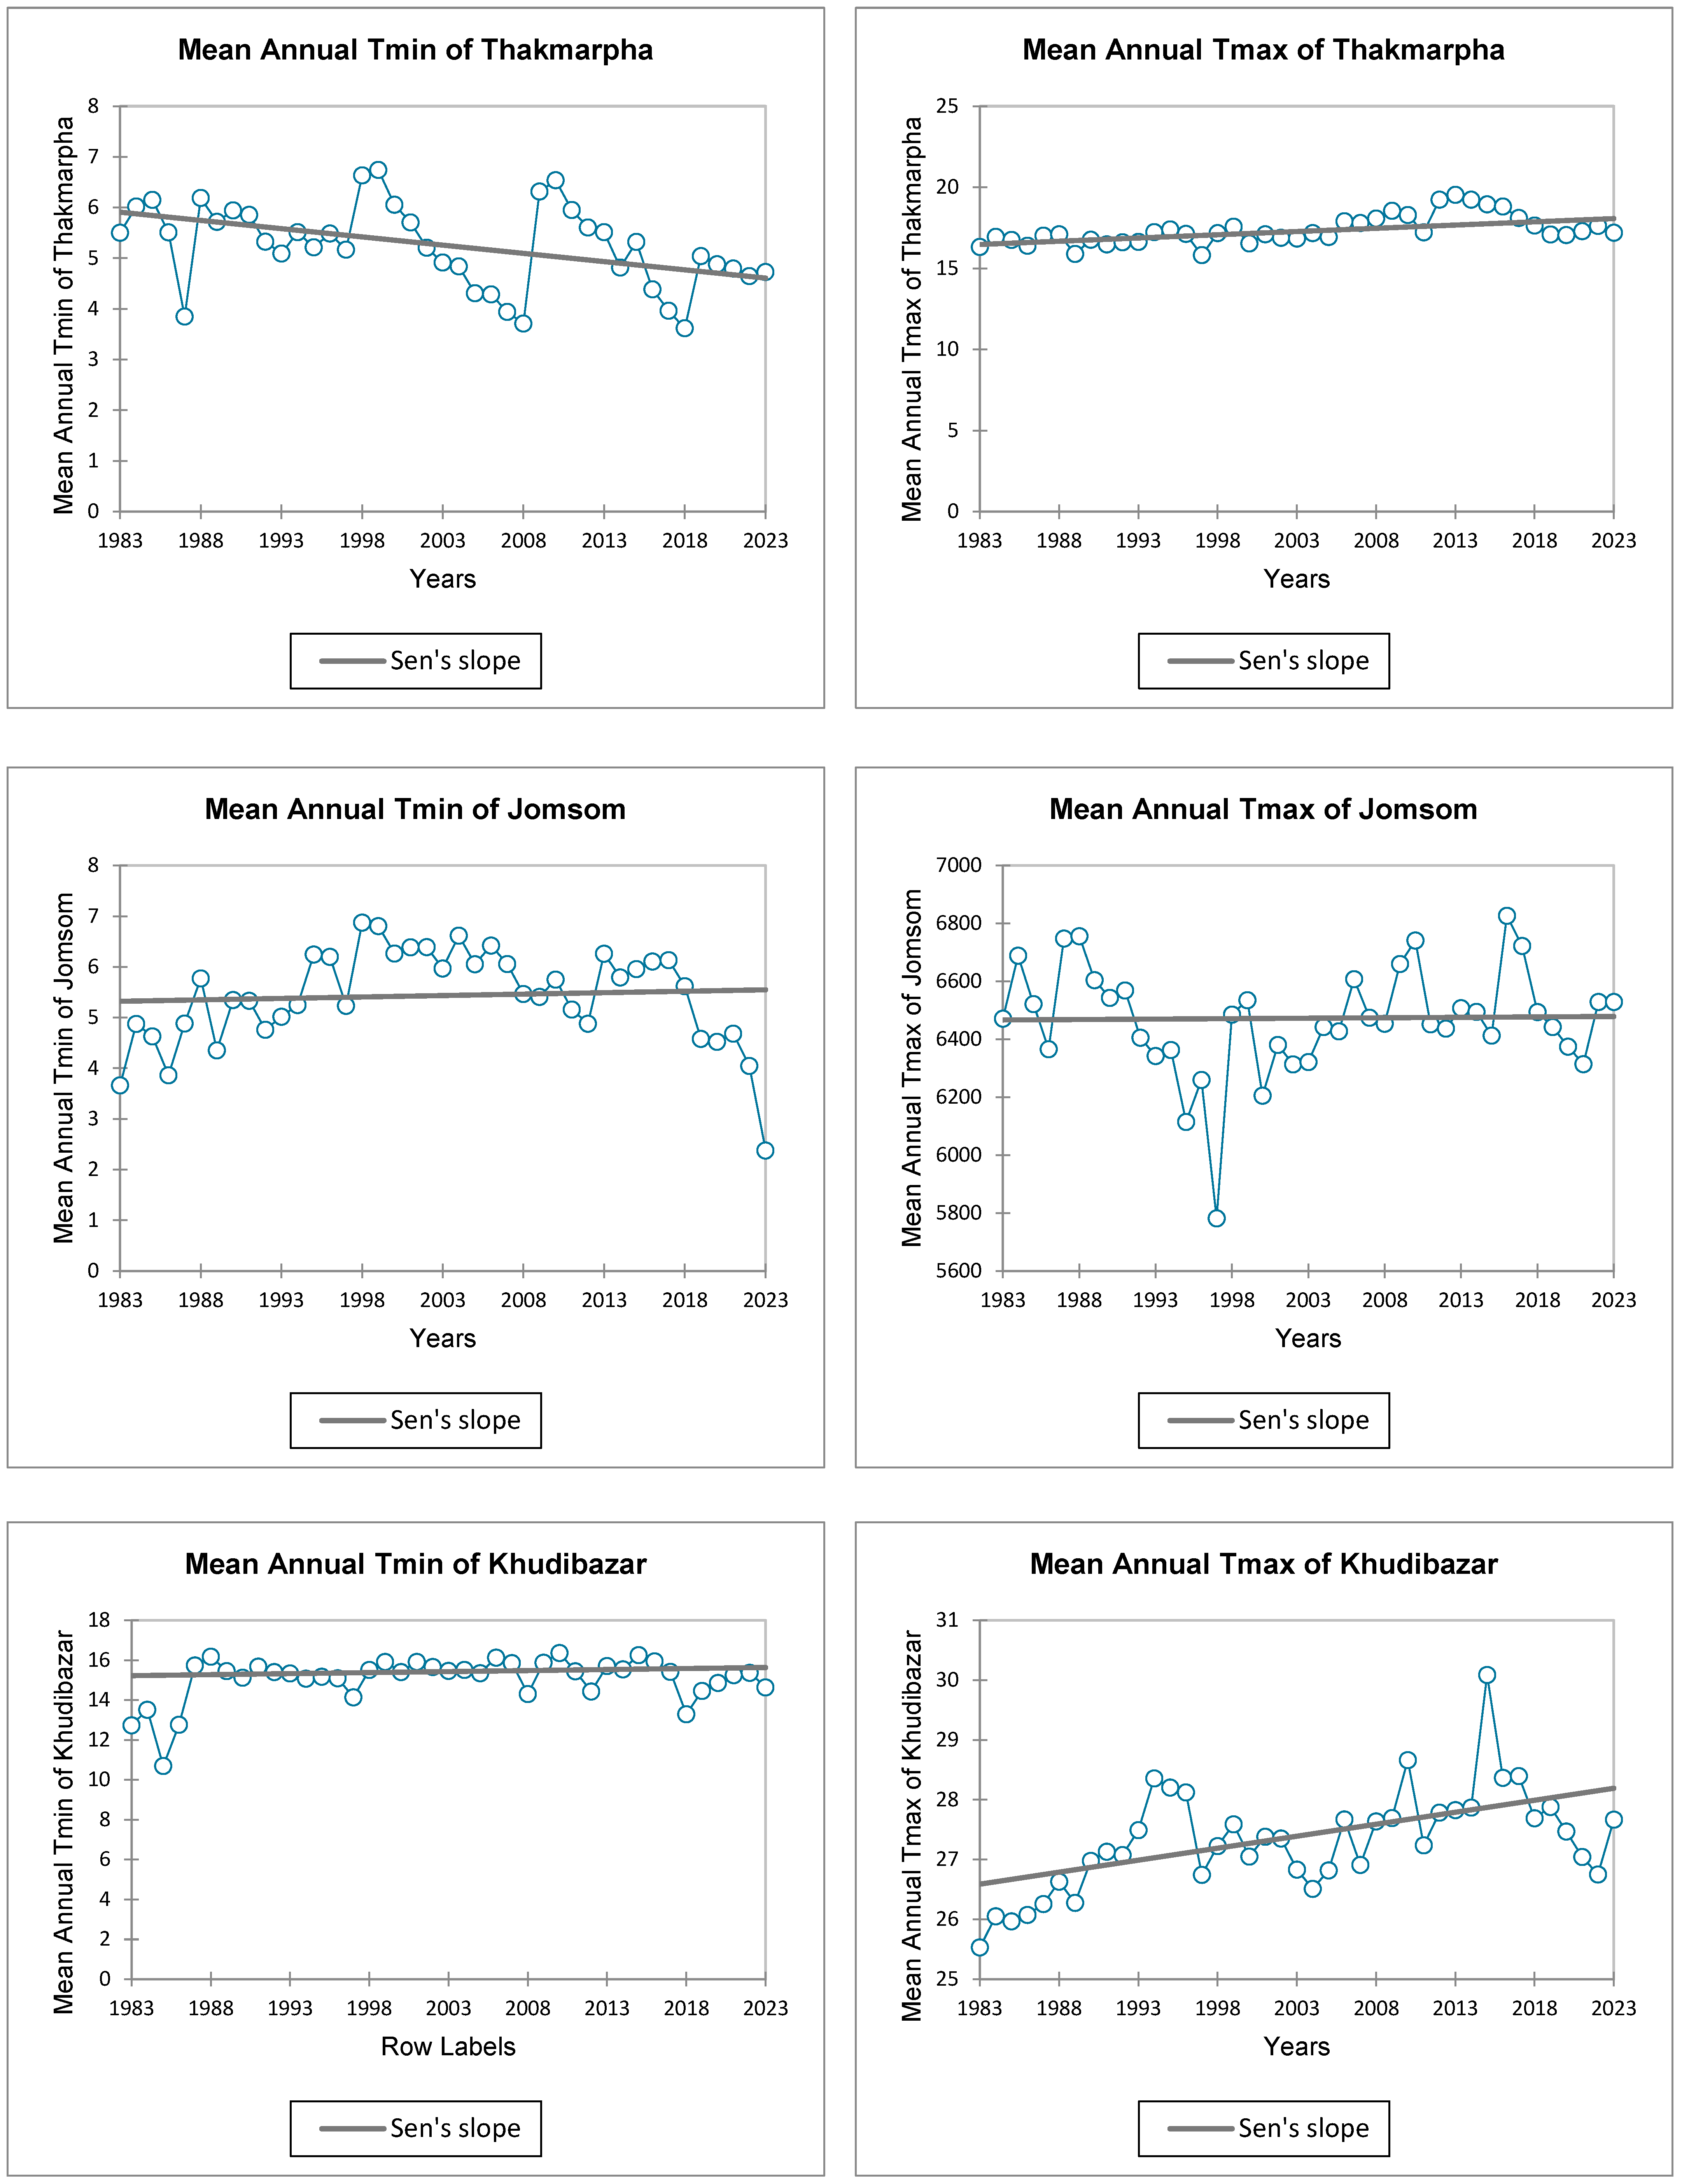
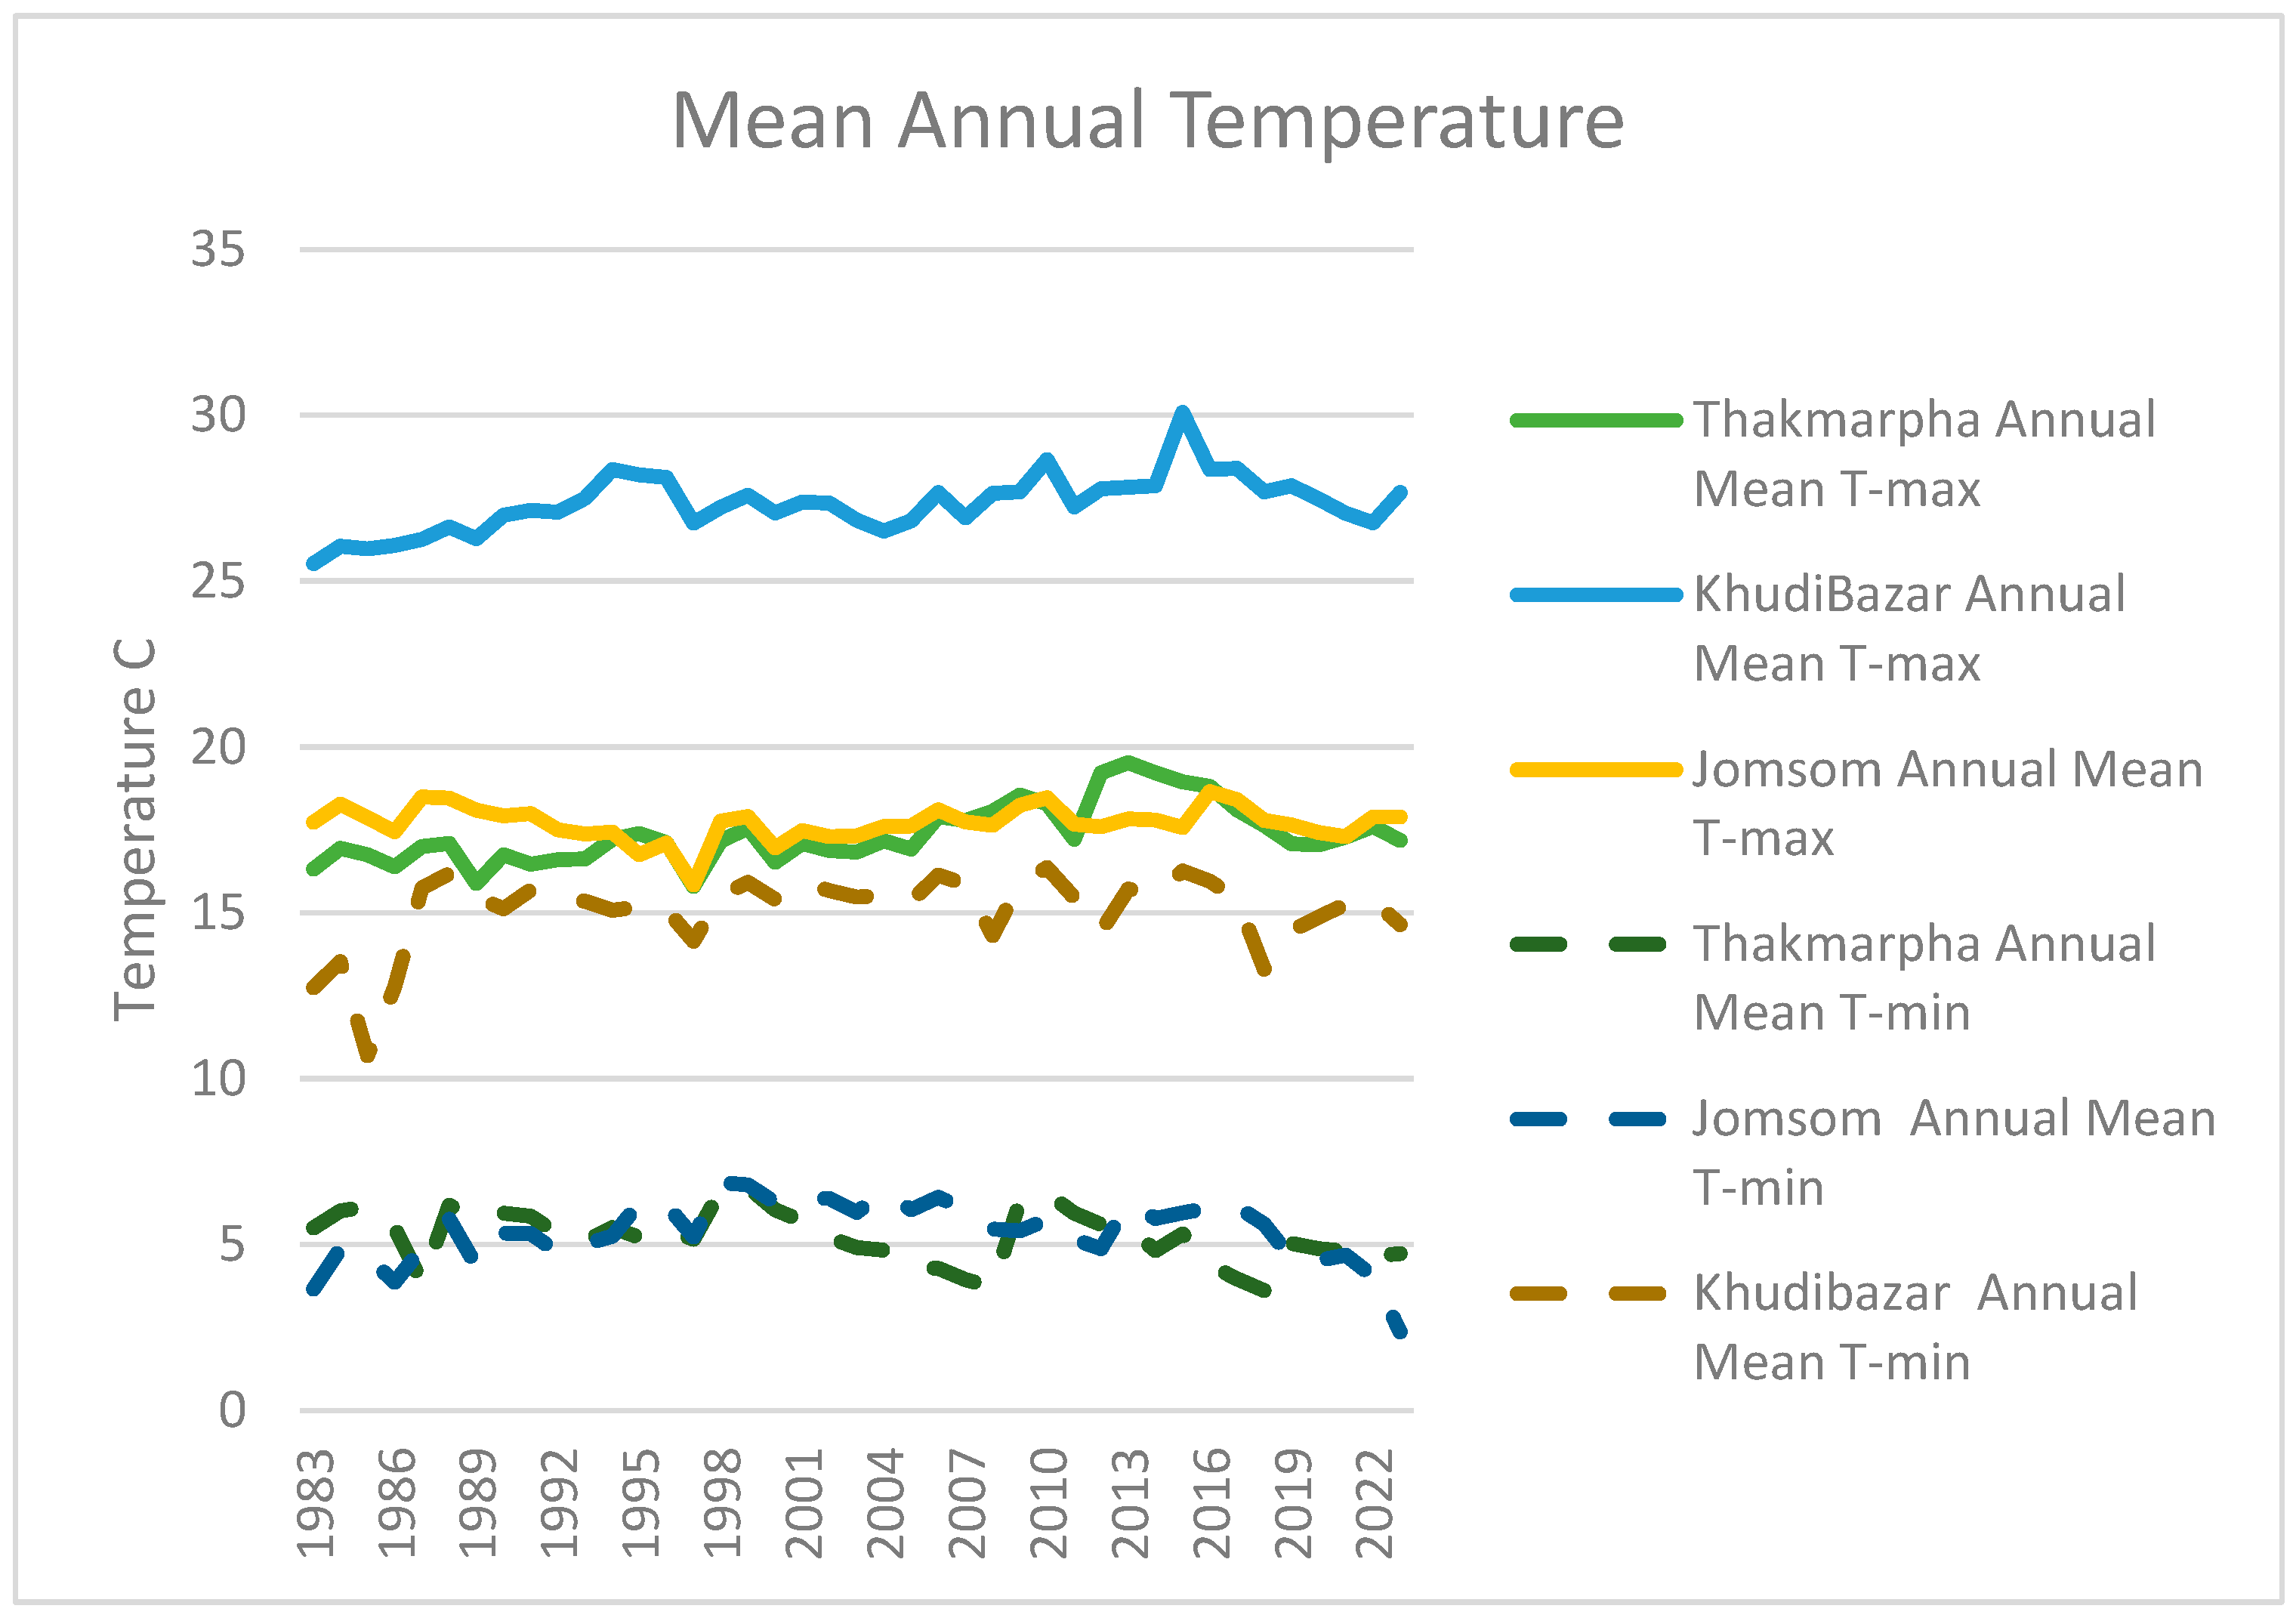
Temperature data from the meteorological stations were analyzed to identify trends in Tmax and Tmin temperatures.
Figure 4 visualizes the annual mean Tmax and Tmin temperatures from 1983 to 2023, capturing long-term climatic trends and variability across the ACA.
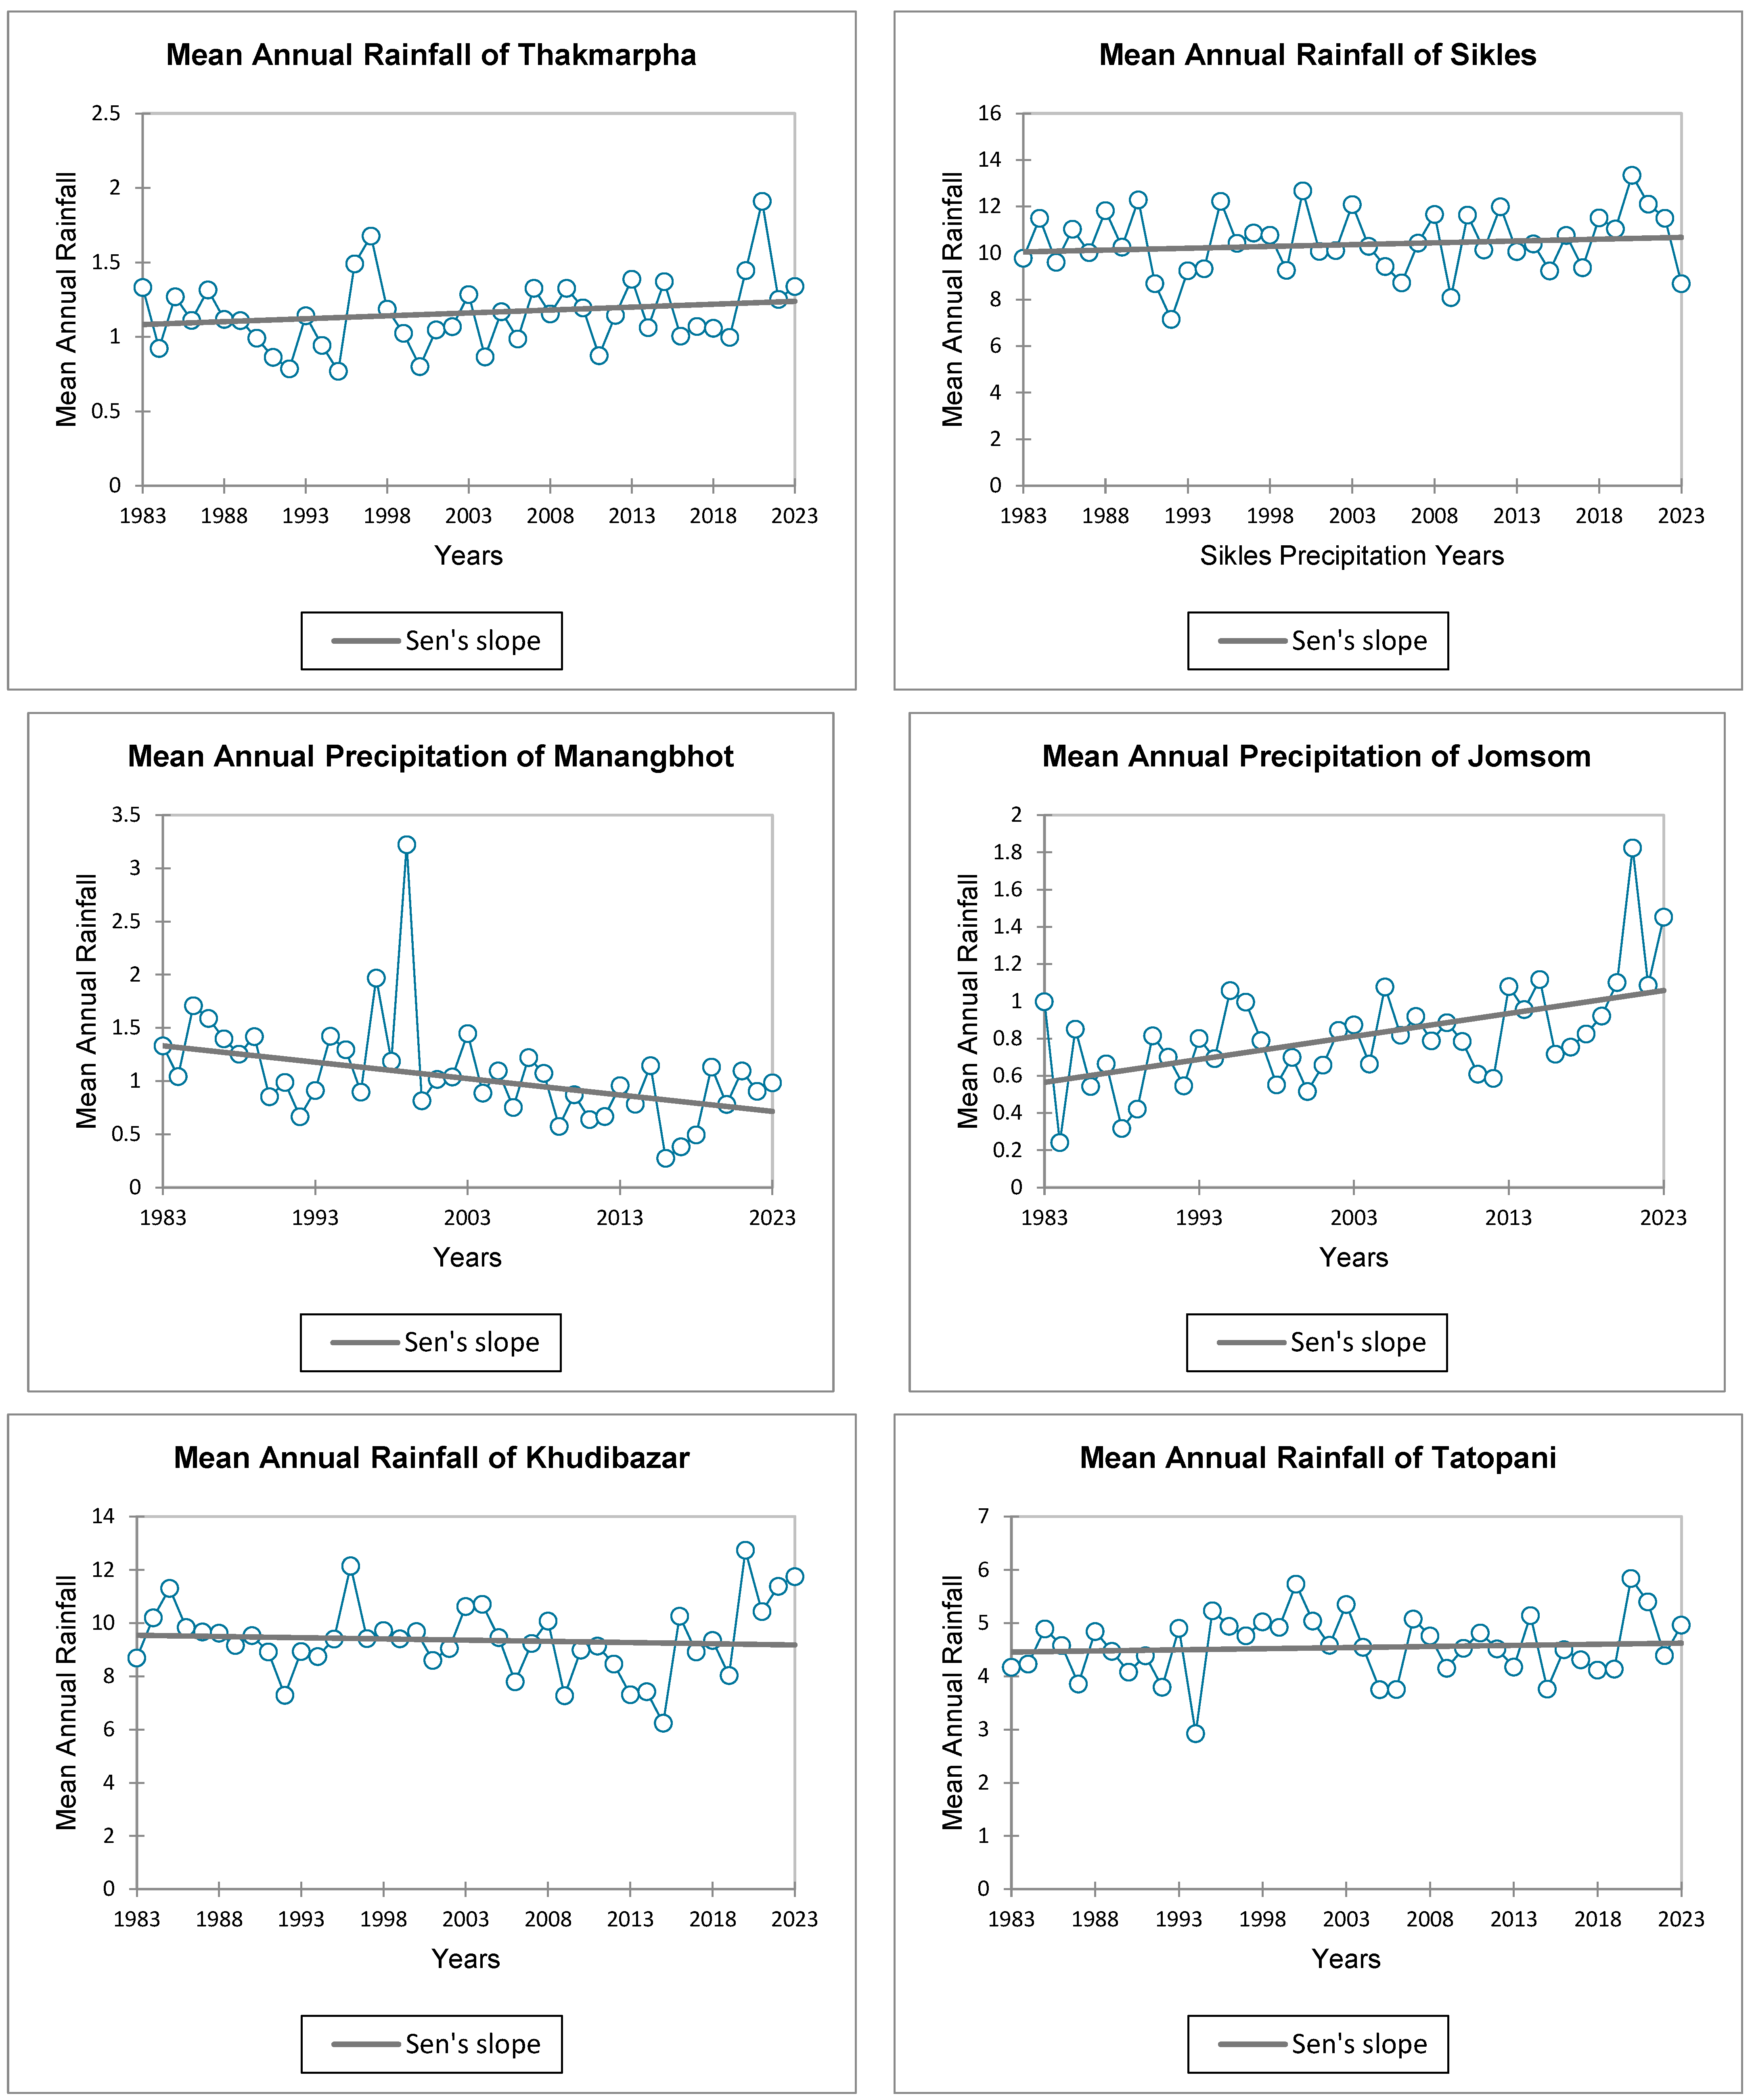
Similarly, to the temperature data, annual precipitation data were analyzed for trends using the Mann–Kendall test.
Figure 5 shows the annual precipitation trends for the stations.
Positive trends: Thakmarpha and Jomsom exhibited positive trends in precipitation, with Jomsom’s trend being statistically significant (p < 0.001);
Negative trends: Khudi Bazar showed a negative but non-significant trend. Manang Bhot displayed a significant negative trend (p = 0.001);
Variability: Precipitation patterns were highly variable, with anomalies such as droughts and extreme rainfall events.
Table 6 provides the Mann–Kendall test results for precipitation.
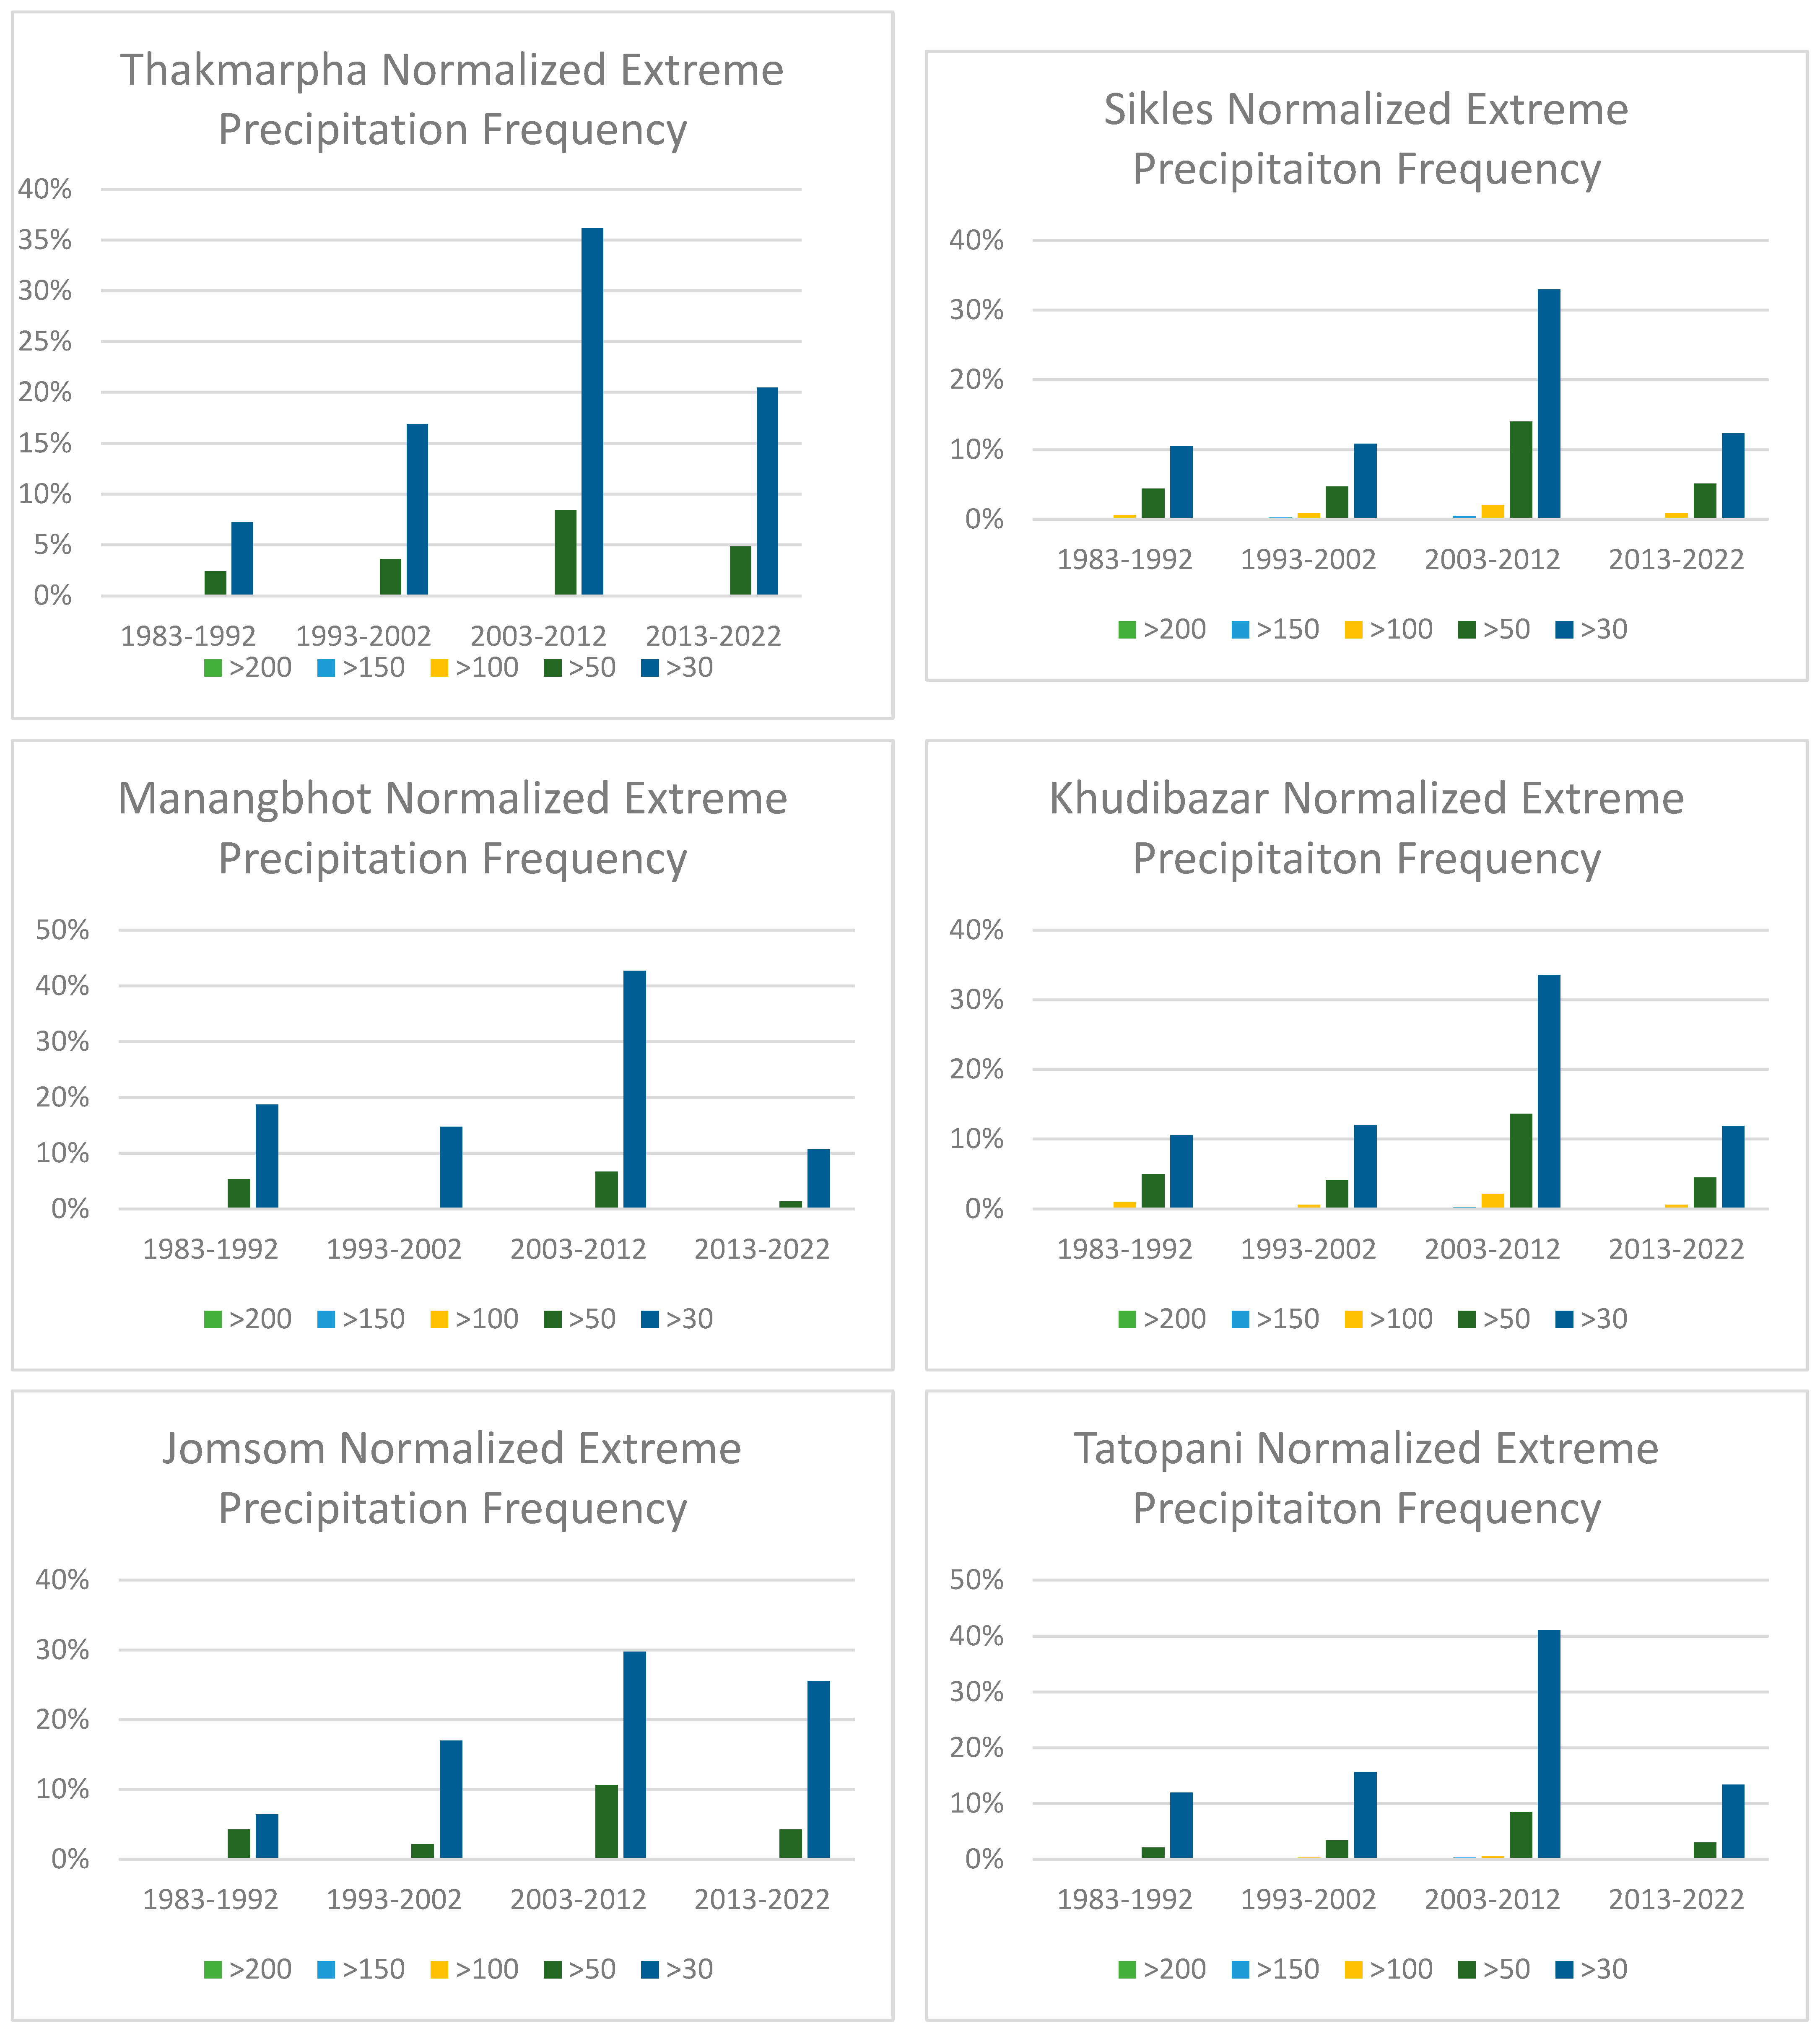
The frequency of extreme precipitation events in the Annapurna region has exhibited notable changes over the past four decades. An analysis of the data reveals that days with significant rainfall have generally increased across all stations.
Figure 6 illustrates the normalized frequency of extreme precipitation events over the past four decades, emphasizing changes in rainfall patterns that influence flood risk and water resource management.
Increase in moderate extreme events: The percentage of days with rainfall exceeding 30 mm increased substantially over the decades. In 1983–1992, this percentage ranged from 6% to 12%, rising to 33% to 43% in 2003–2012. Days with rainfall over 50 mm also increased, from 2 to 5% in 1983–1992 to 8 to 14% in 2003–2012. Despite the increase in moderate extremes, occurrences of rainfall exceeding 100 mm remain relatively rare, with only a slight rise from 0 to 1% in 1983–1992 to 2% in 2003–2012. The most recent decade (2013–2022) suggests a stabilization or slight decline in the frequency of these extreme events compared to the previous decade. The percentage of days with rainfall over 30 mm and 50 mm has not shown the same rate of increase as observed earlier.
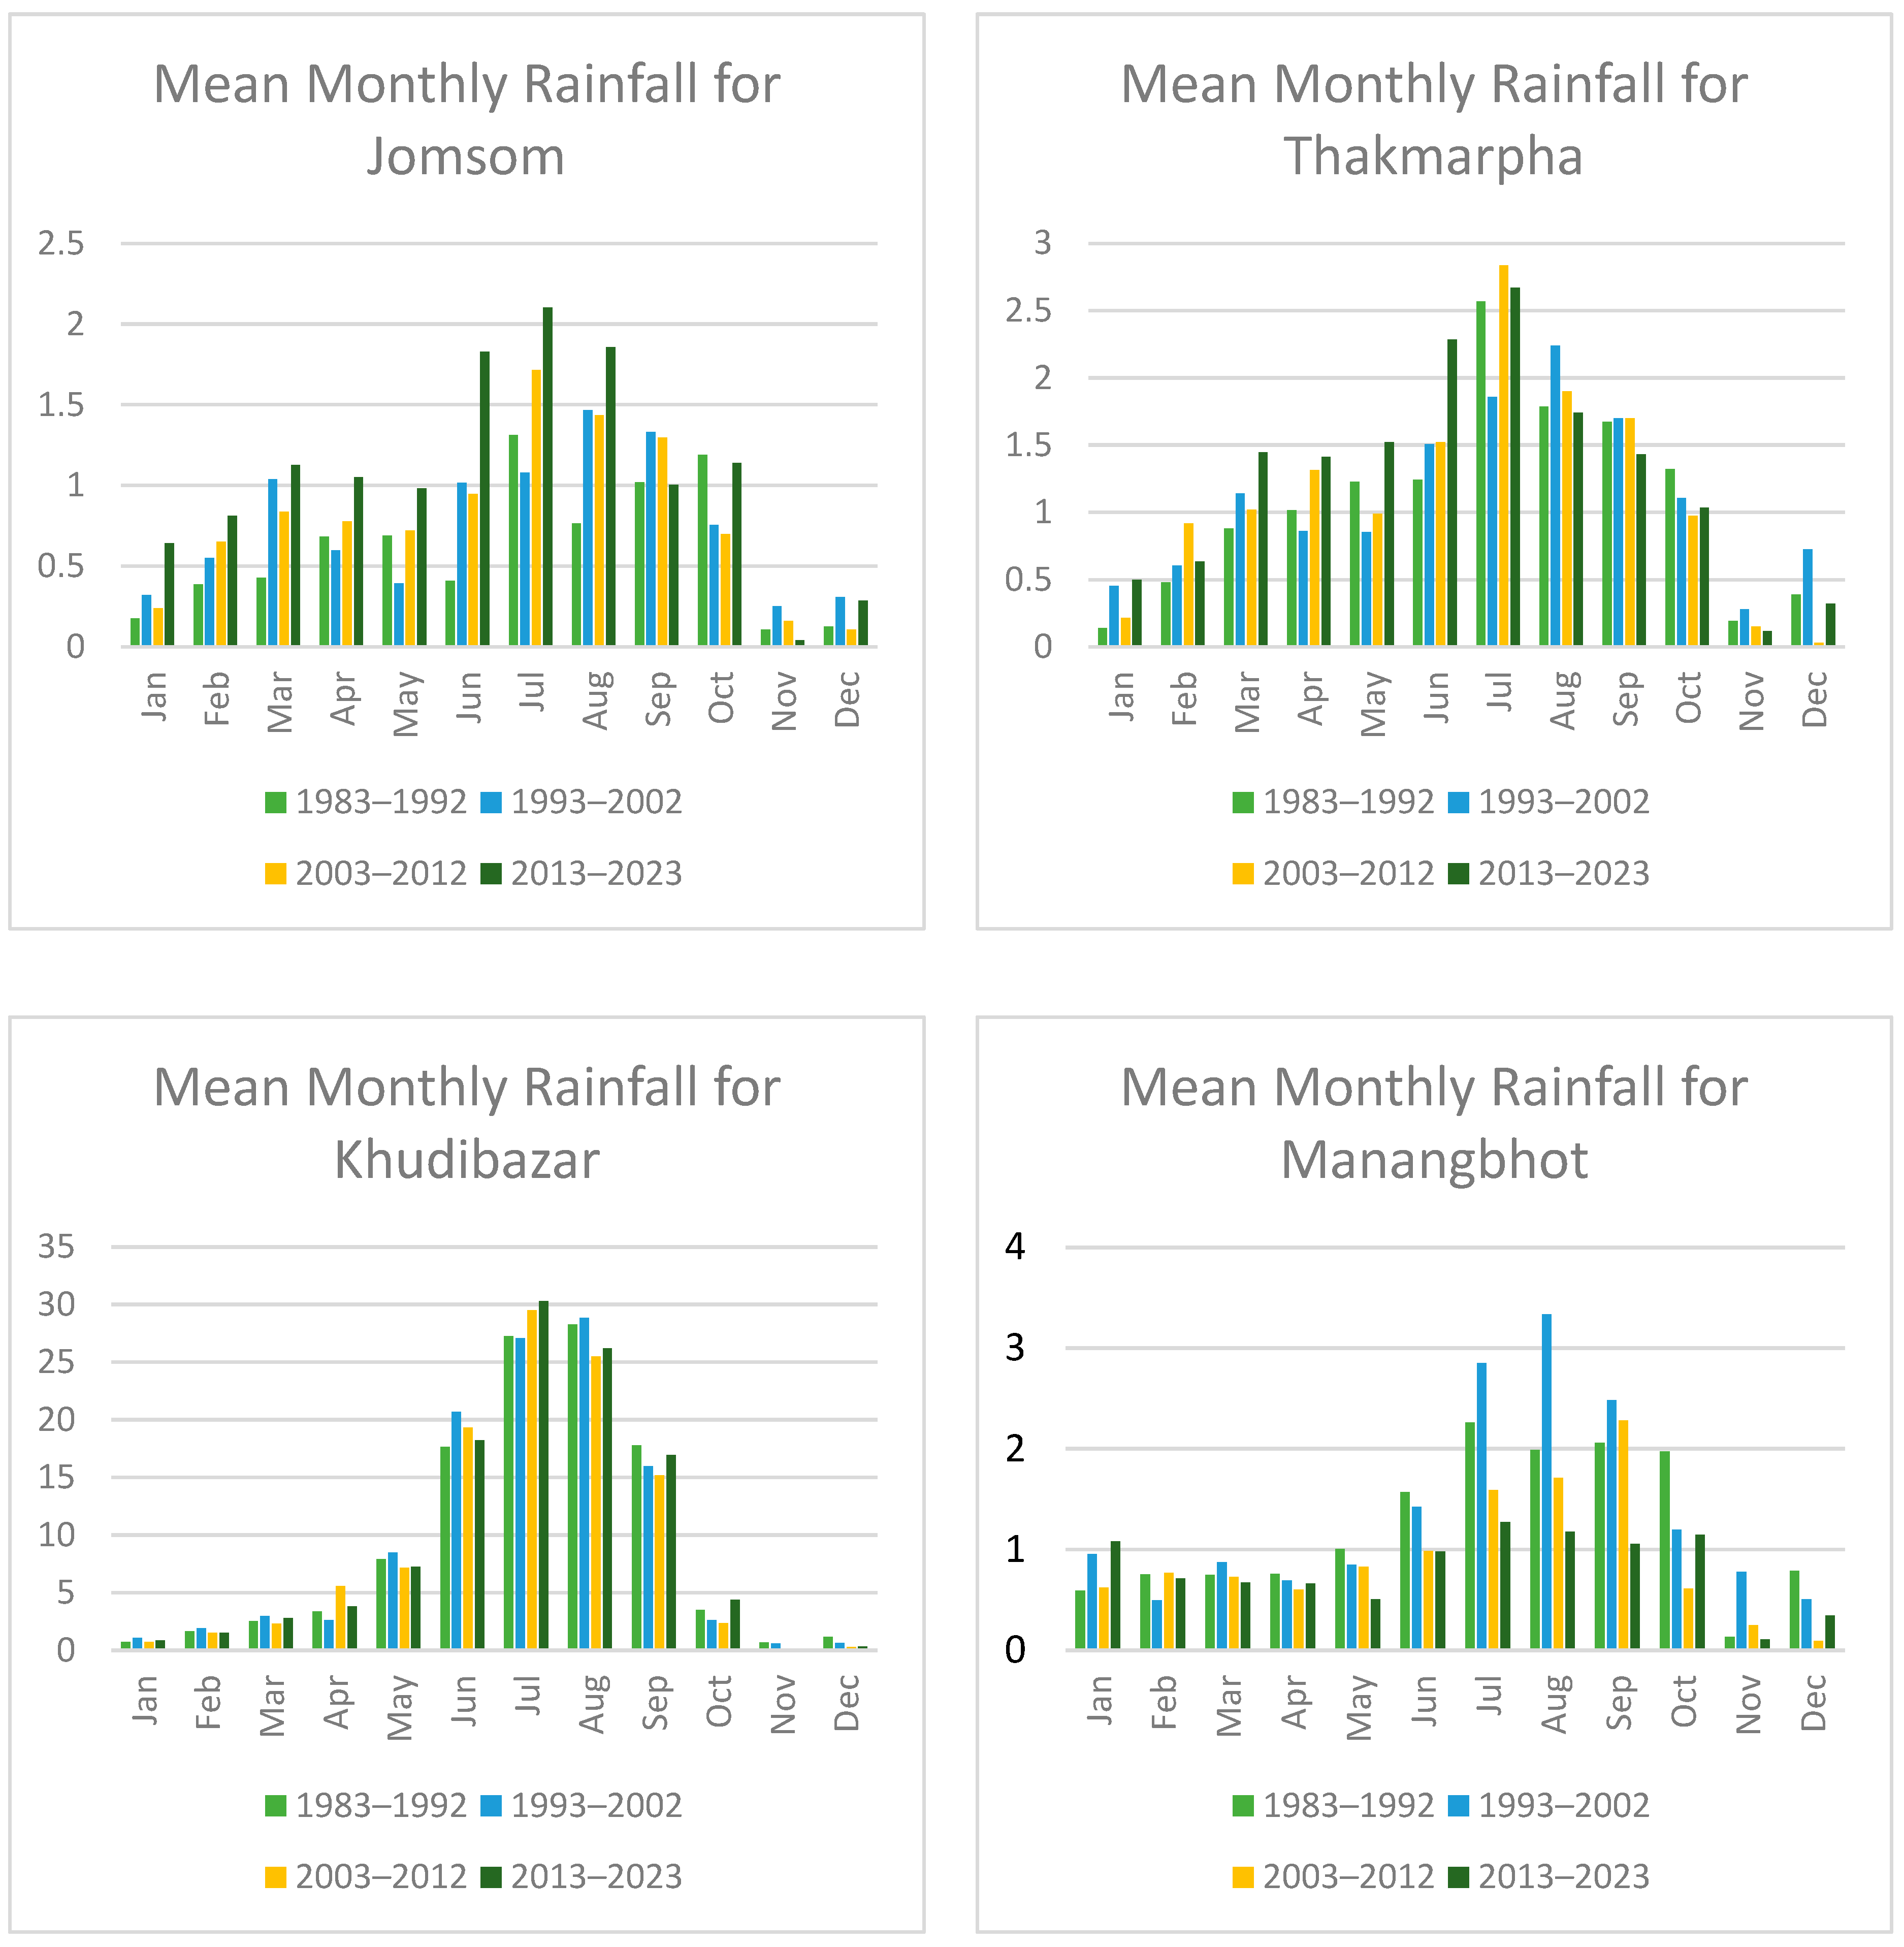
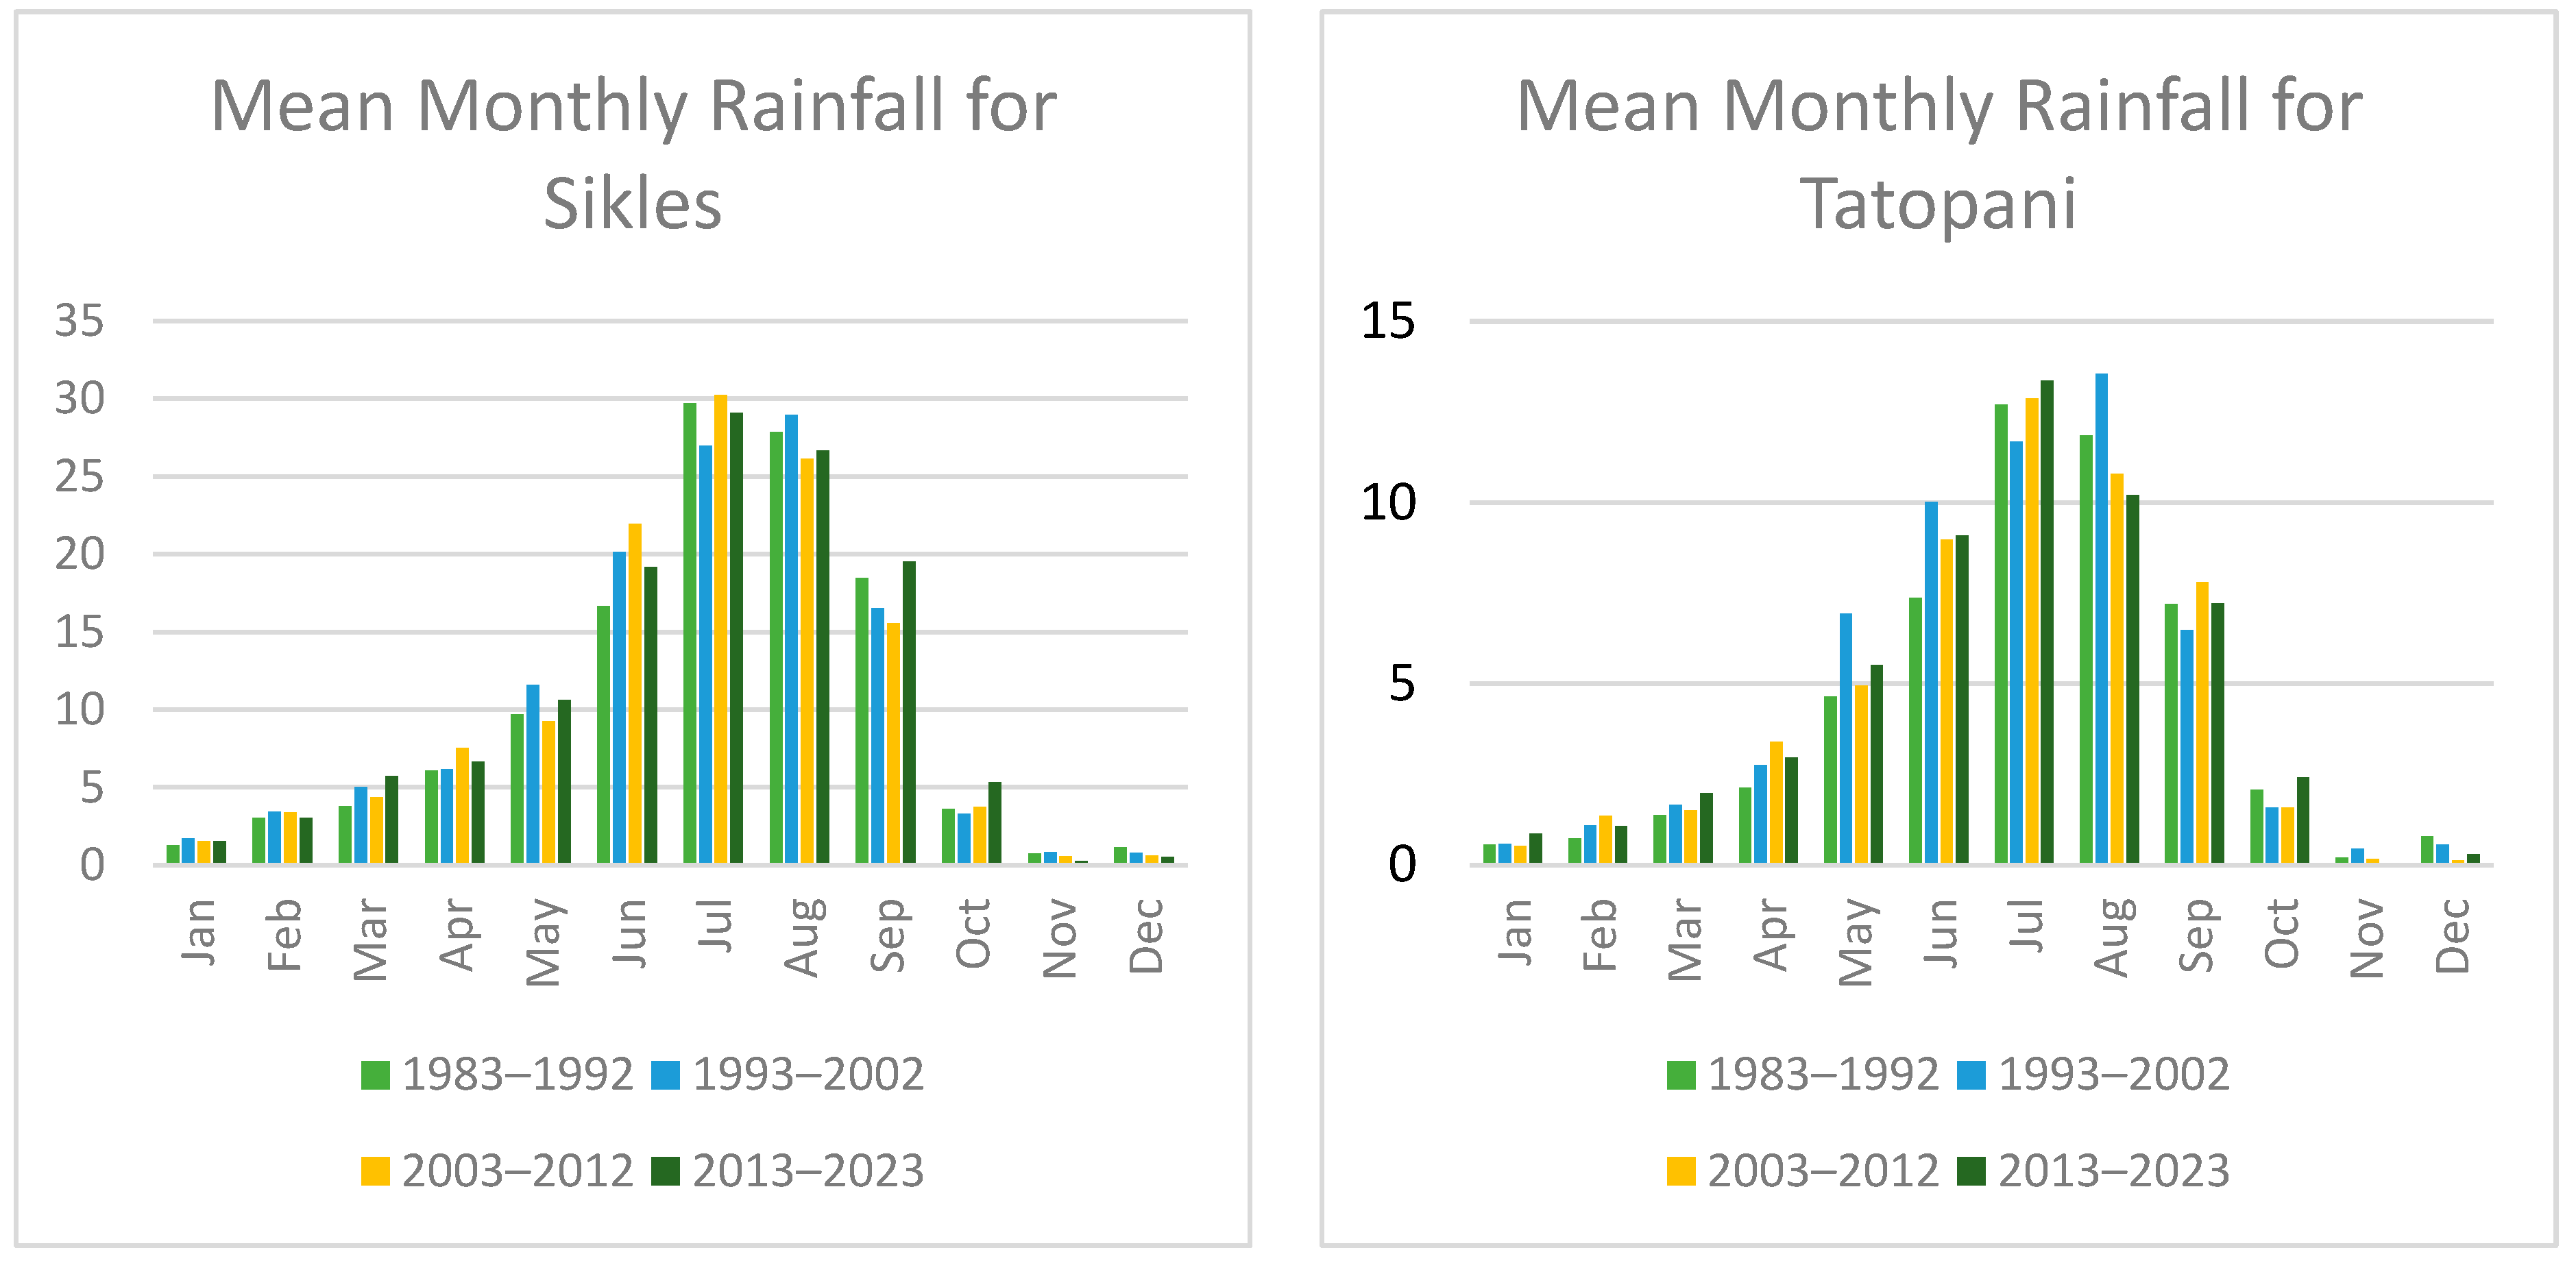
An analysis of rainfall patterns across the Annapurna region reveals significant changes over the decades, with notable differences between higher elevation and lower elevation stations which is shown in
Figure 7.
Higher elevation stations such as Thakmarpha, Manang Bhot, and Jomsom exhibited a consistent increase in mean monthly rainfall during the monsoon months (July and August). Thakmarpha’s July rainfall rose from 2.57 mm in 1983–1992 to 2.67 mm in 2013–2023. Jomsom’s July rainfall increased from 1.31 mm to 2.10 mm over the same period.
Lower elevation stations like Sikles, Tatopani, and Khudi Bazar showed substantial increases in rainfall during the monsoon months. Sikles recorded July rainfall increases from 29.71 mm in 1983–1992 to 30.30 mm in 2013–2023. Khudi Bazar’s July rainfall rose from 27.25 mm to 30.30 mm over the same period.
3.4. Community Perceptions and Adaptive Strategies
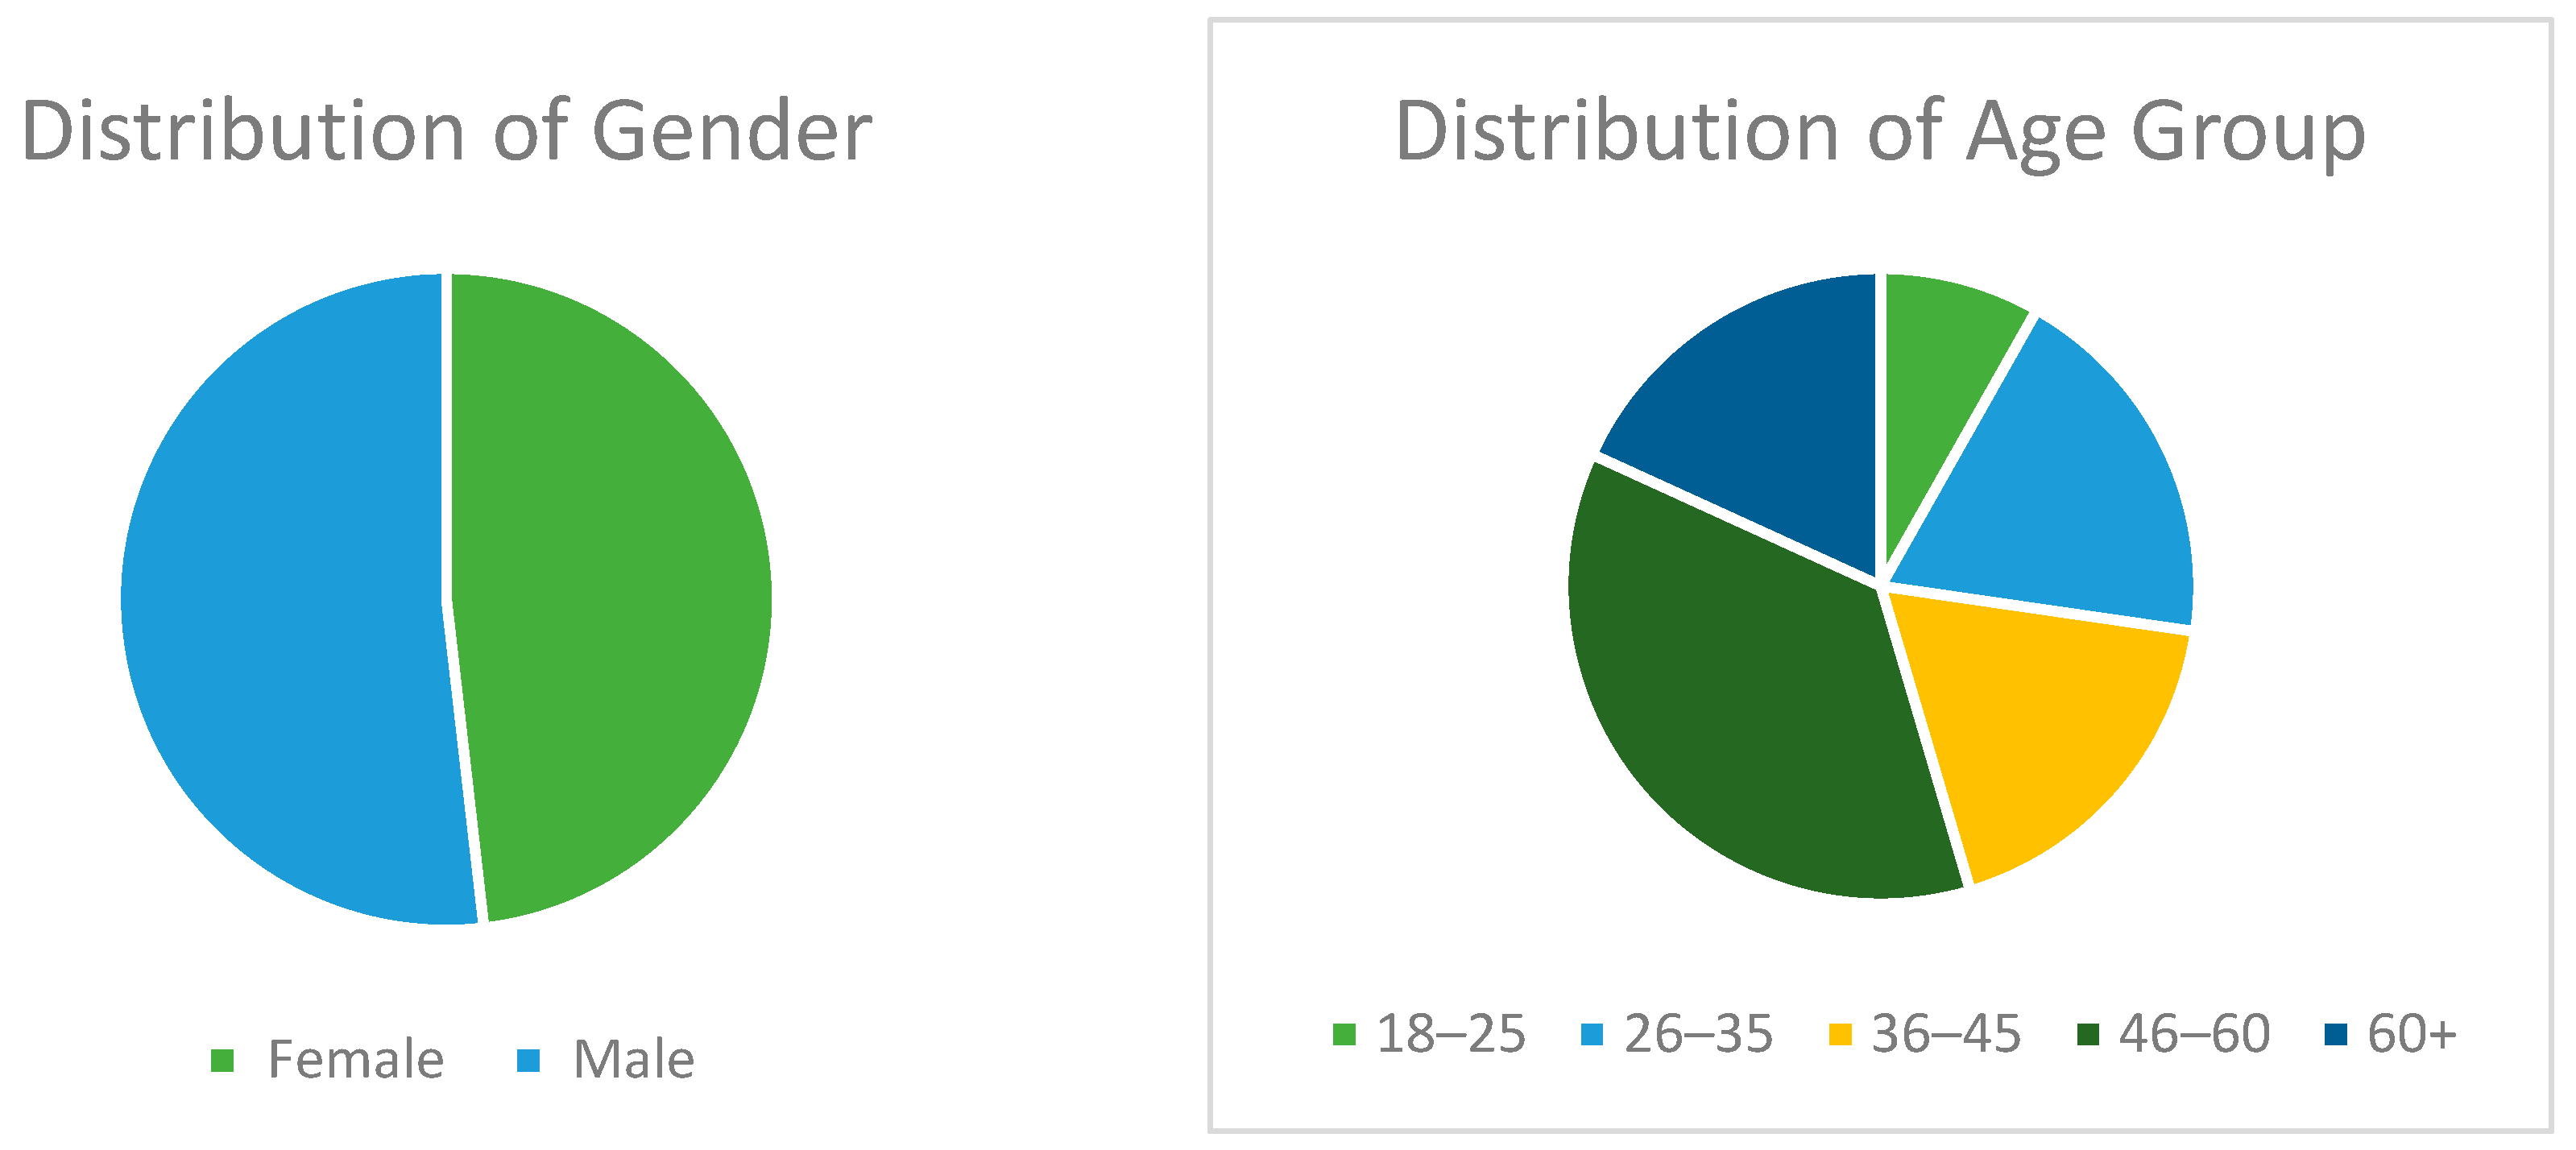
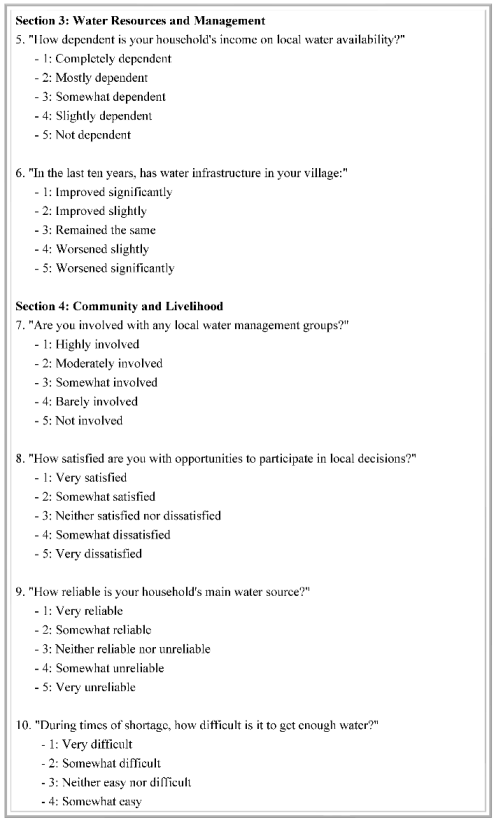
Appendix C includes the questionnaire and the demographic overview of the respondents.
Perception of climate change: Surveys conducted in 11 villages within the ACA indicate a high level of awareness regarding climate change among residents. (
Figure 8) A significant majority (85%) reported noticeable changes in climatic patterns, particularly a decrease in snowfall and alterations in precipitation. Approximately 70% of respondents noted changes in water availability, which they attributed to these climatic shifts. Residents observed that these changes directly impacted on their agricultural practices, with shifts in crop types and growing seasons becoming necessary to adapt to the new conditions.
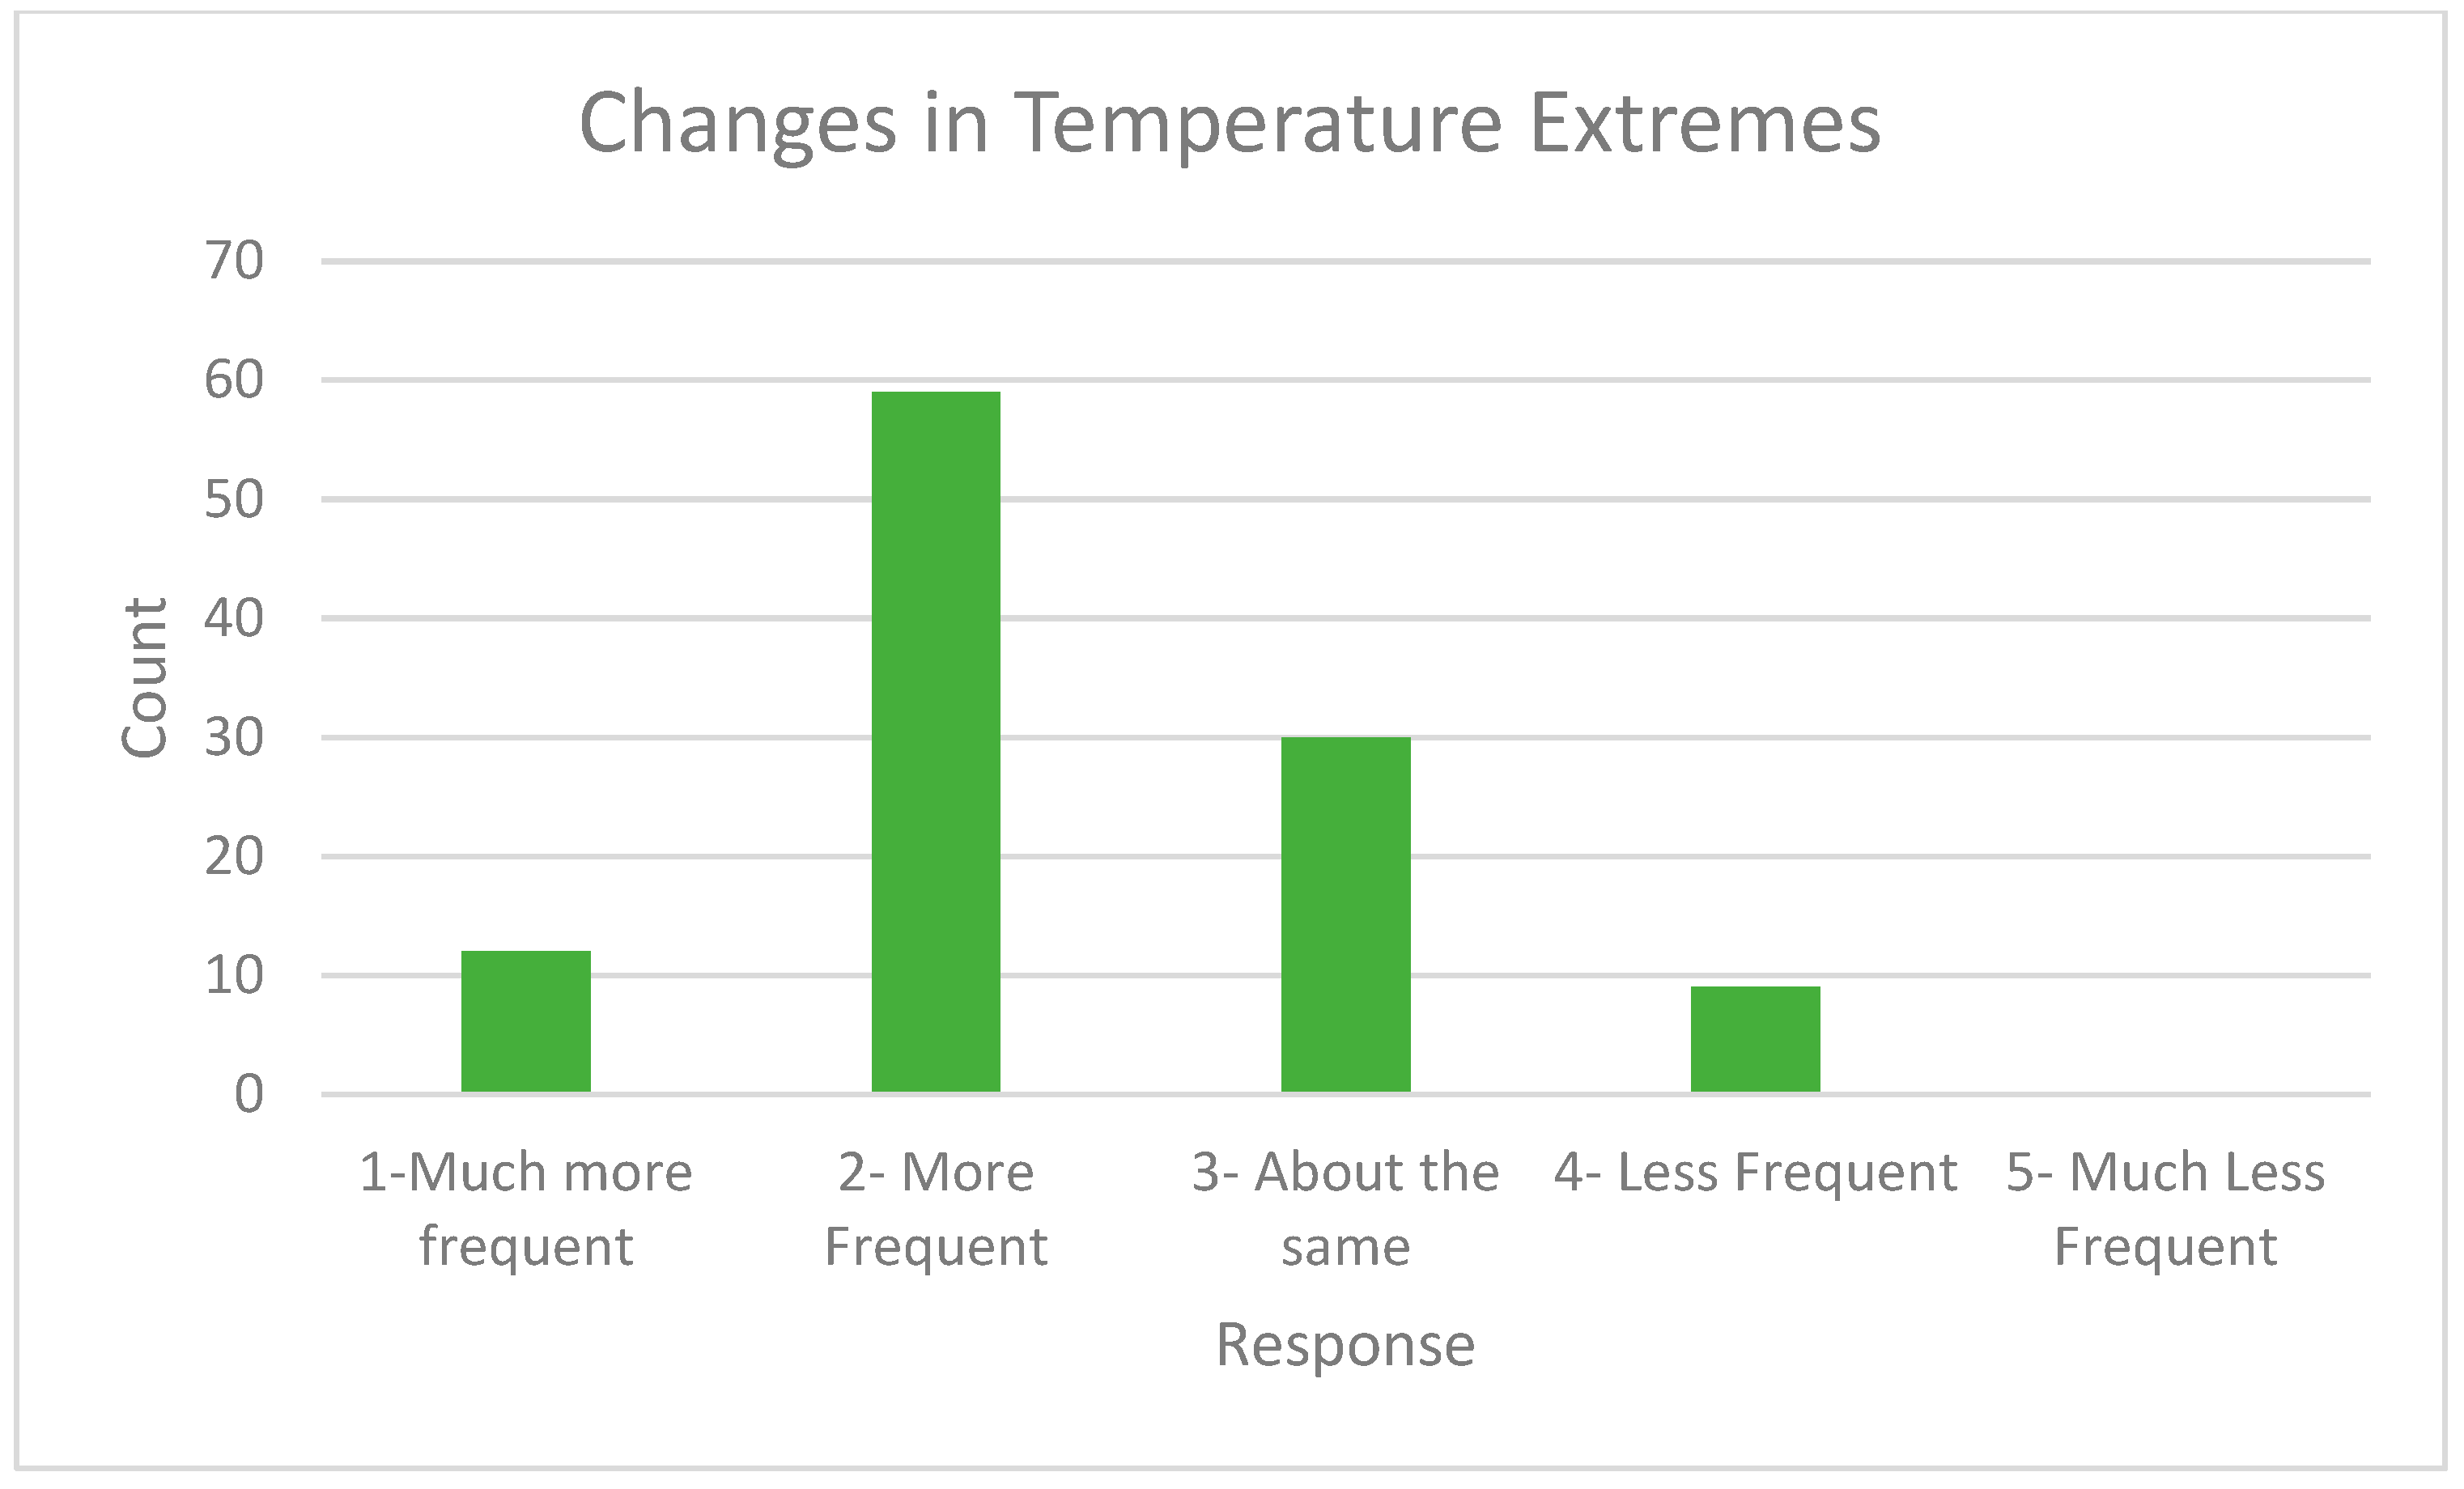
Temperature extremes and weather patterns: The community’s perception of climate change is notably well-informed, with a majority acknowledging its impacts on local ecosystems and livelihoods. Survey respondents have observed significant changes in local weather patterns, including more pronounced and frequent extreme weather events.
A significant number of respondents have observed changes in temperature extremes, with some noting that water now freezes less often, indicating milder winters. Rainfall patterns have been described as unpredictable, and several individuals have reported less snowfall, which aligns with the concerns about shorter winter seasons.
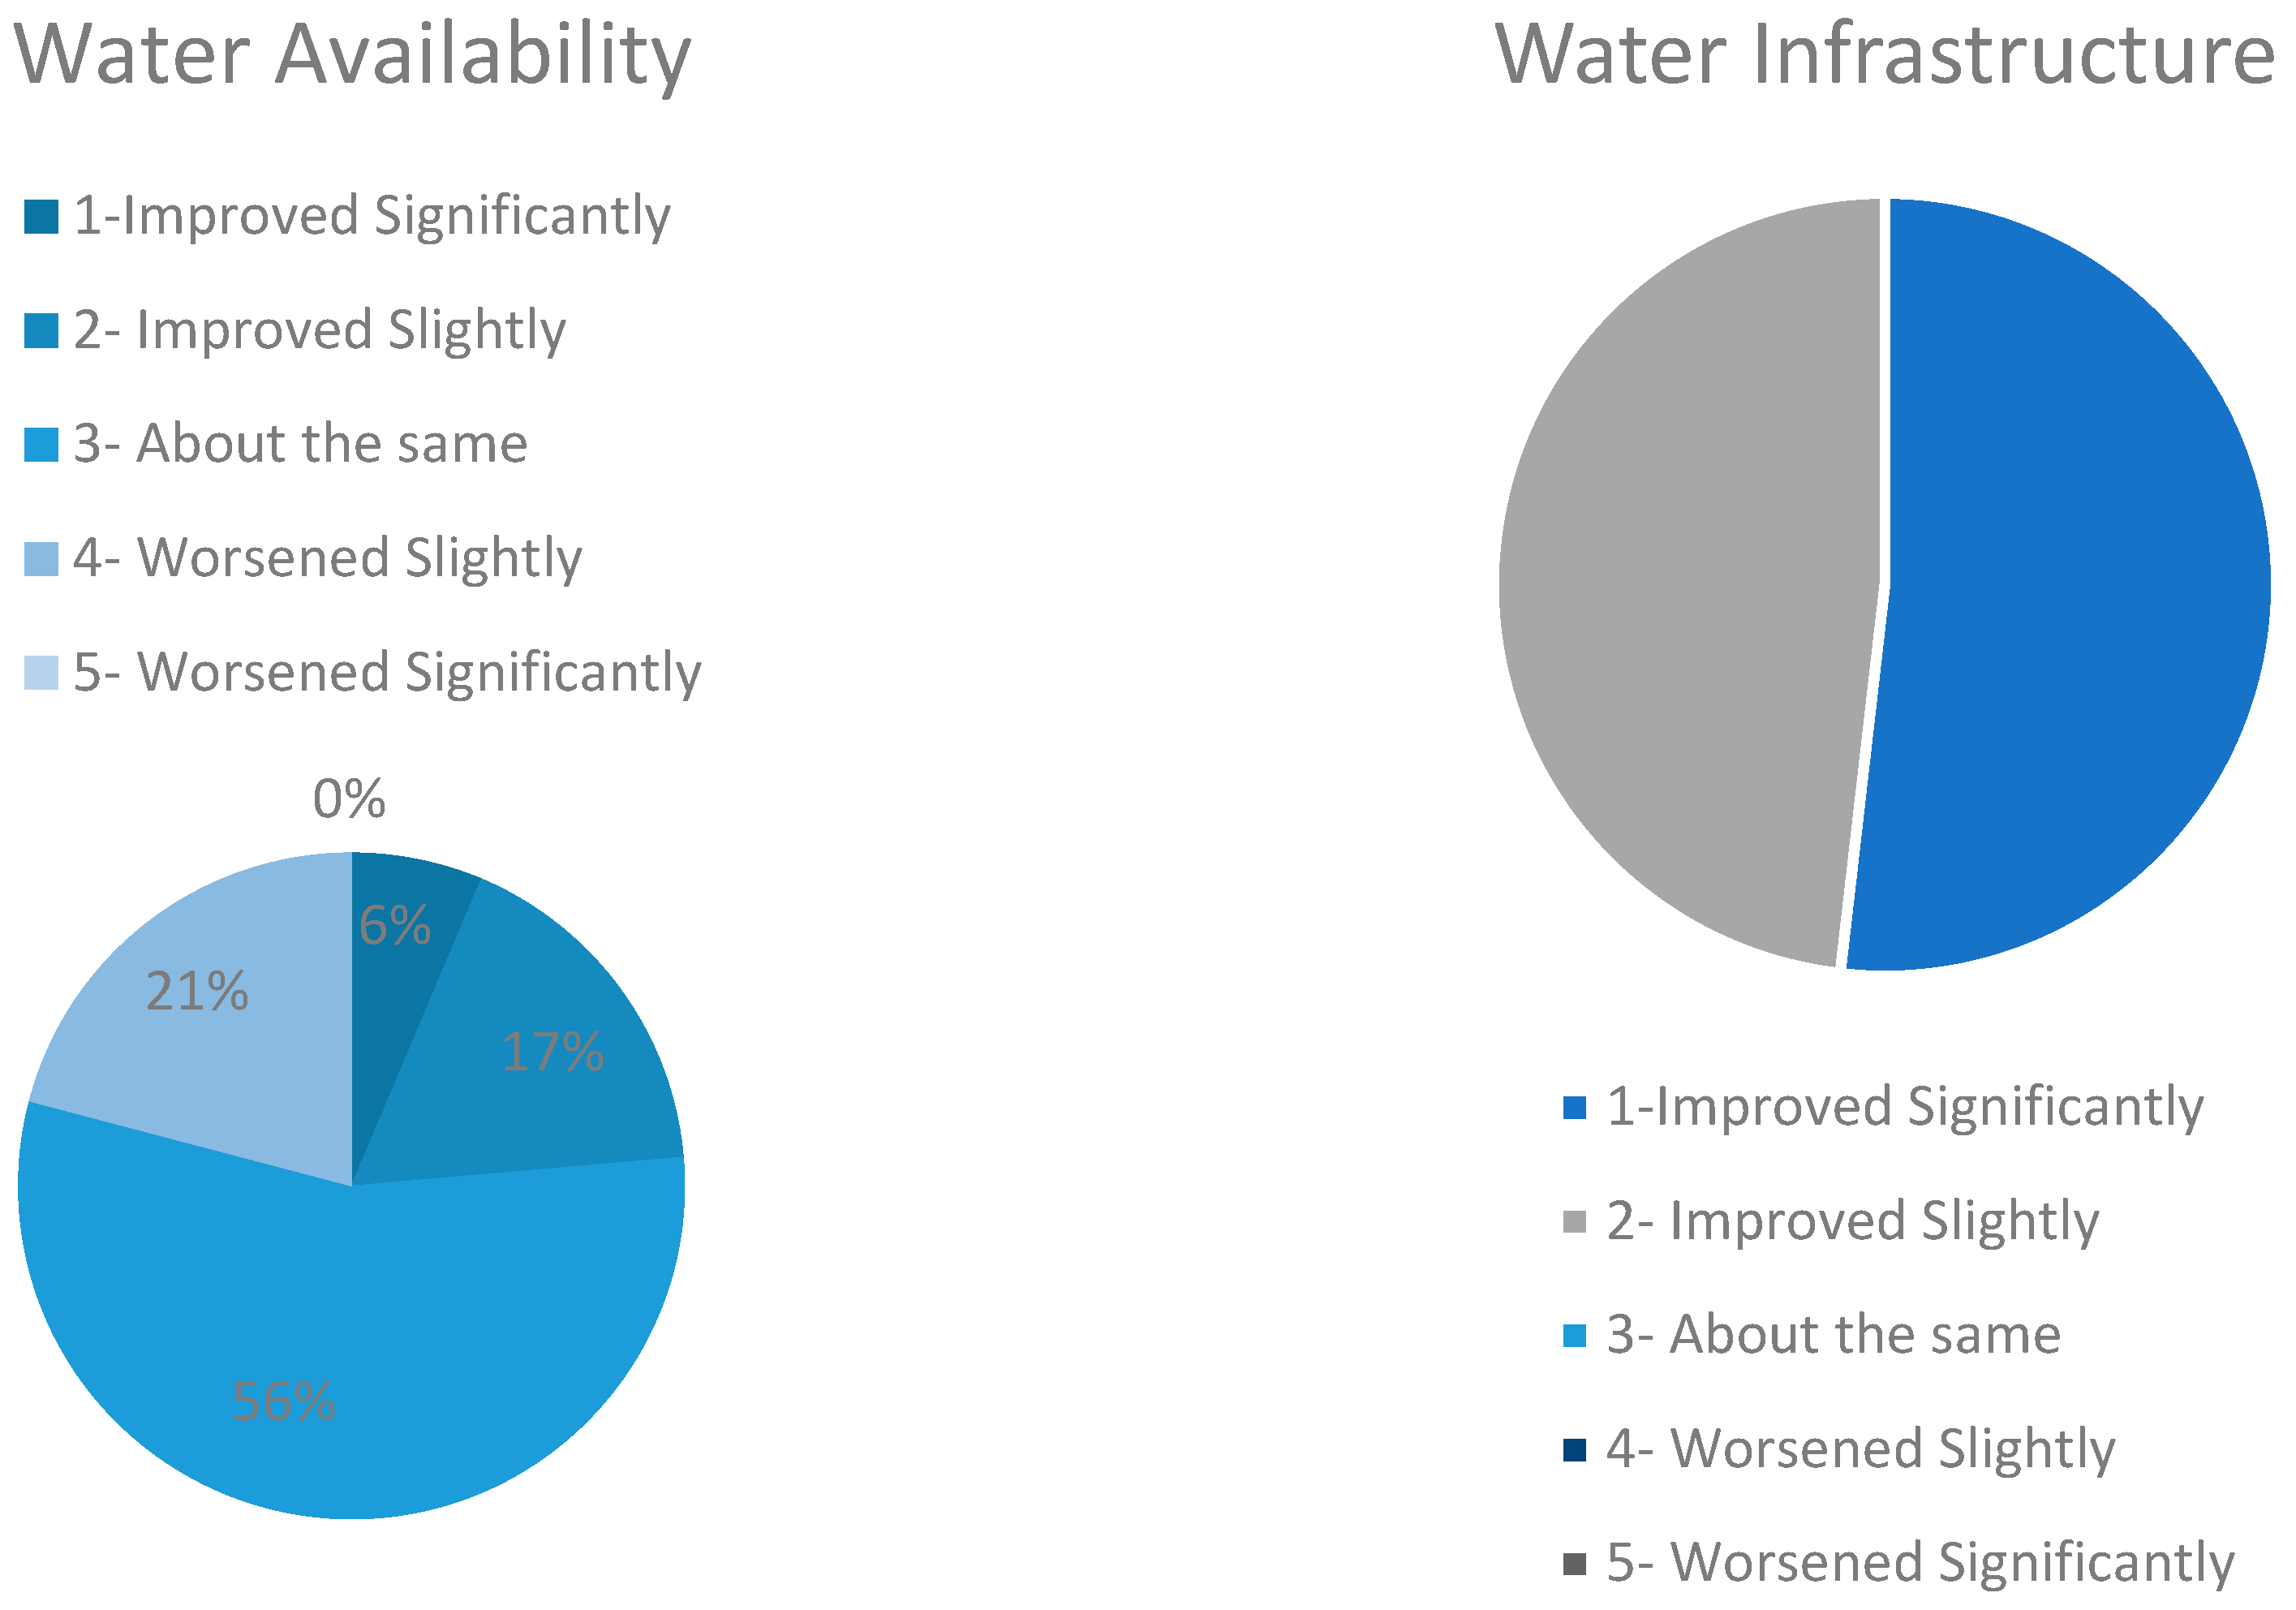
Water availability and infrastructure: As shown in
Figure 9, the survey results present an encouraging trend in water availability and infrastructure within the community. Contrary to the challenges often faced in many regions, our data shows a marked improvement in access to water resources. Currently, all surveyed households report having access to piped water, a significant development compared to just a few years prior when such amenities were limited to a fraction of the population. It aligns with the 2023 Joint Monitoring Program (JMP), and National Water, Sanitation and Hygiene (NWASH) data, which is also on a positive trend in achieving SDG 6 [
35].
This progress in water infrastructure is a testament to successful policy implementation and investment in the community’s essential services. The upgrade has likely contributed to the community’s well-being, as reliable access to clean water is a cornerstone of public health, economic development, and environmental sustainability. This positive shift also reflects a growing recognition of the importance of water security in the face of climate change, prompting proactive measures to ensure resilience and adaptability in water management systems.
The improved infrastructure sets a solid foundation for future initiatives to manage water resources sustainably. It is also a crucial step toward achieving related SDGs, particularly SDG 6, which calls for clean water and sanitation for all. The survey’s findings can thus be a springboard for discussions on maintaining and furthering these gains, ensuring that water security remains a priority in policy planning and community development efforts.
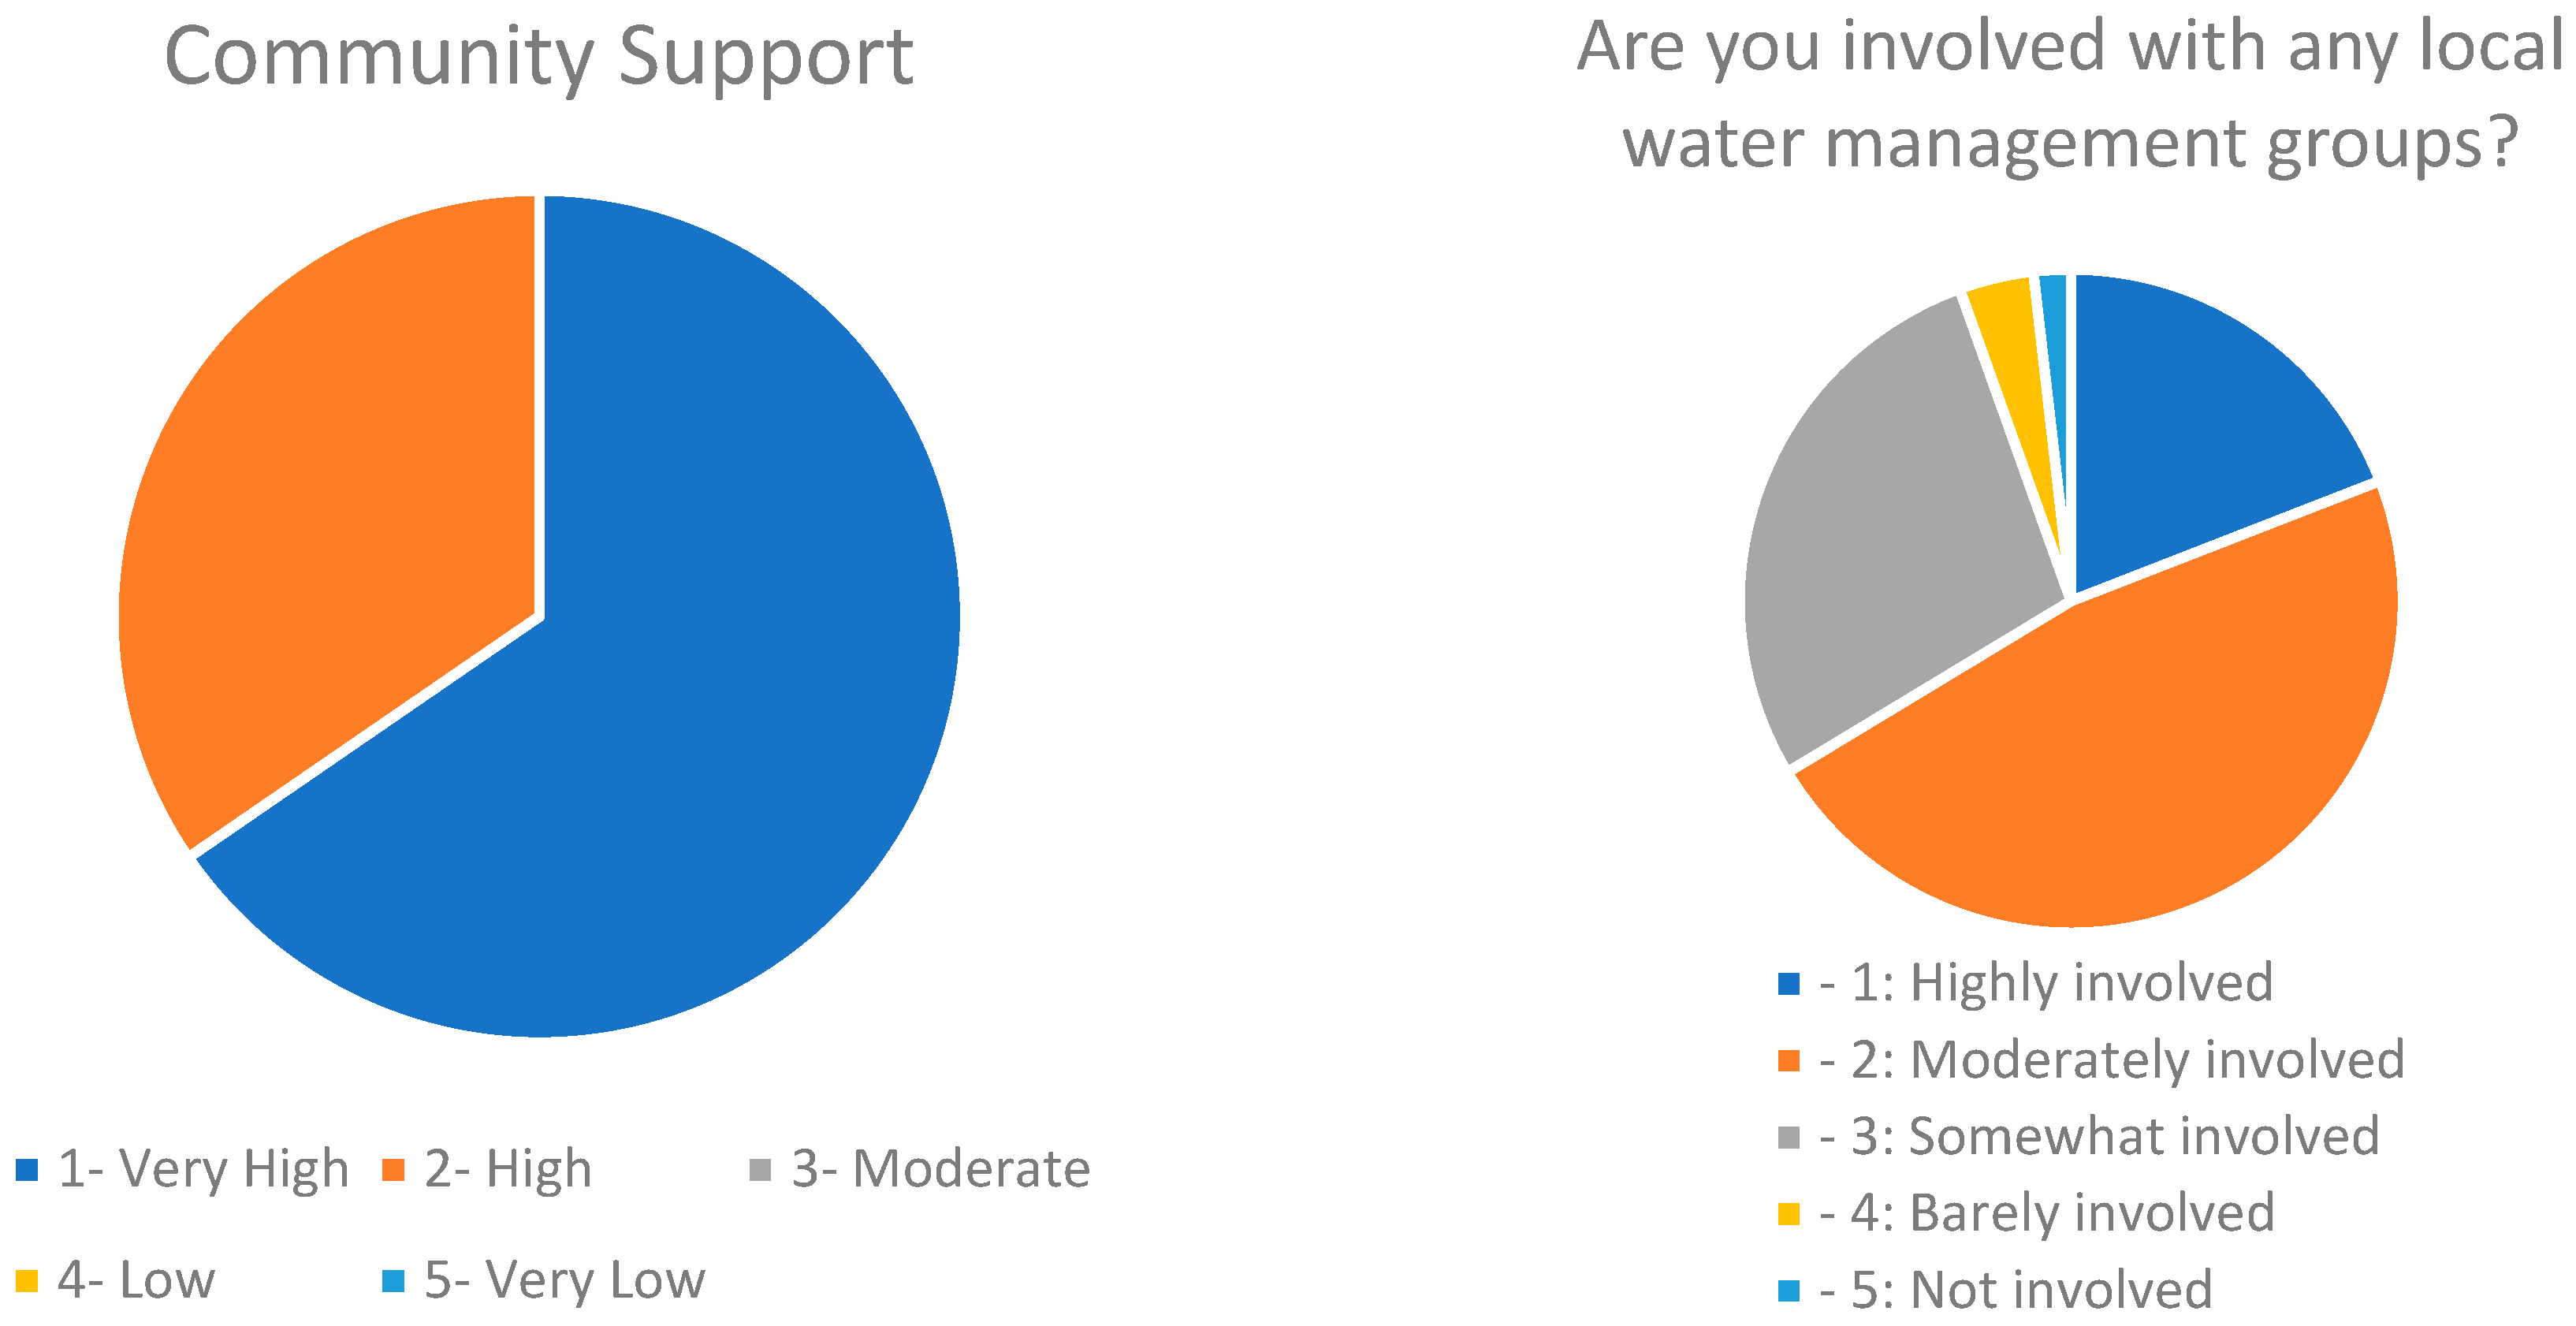
Community involvement and social support:
Figure 10 shows that the community engagement in local water management groups is mixed, with a significant number of respondents indicating moderate to high levels of involvement. This engagement suggests a community that is somewhat active and potentially receptive to initiatives for improving local resilience to climate change. On the other hand, a portion of the population is less involved, which may reflect barriers to participation or differing priorities. Understanding the factors that drive or hinder community involvement can inform strategies to foster more significant collective action in response to environmental challenges.
Open-ended responses: Open-ended responses highlight specific incidents, such as floods and landslides, directly impacting businesses and agriculture. Concerns about the changing climate patterns affecting the availability and quality of water sources are evident, with some respondents attributing these changes to climate change, deforestation, and natural variations. The survey data analysis reveals a community experiencing and observing tangible environmental changes due to climate change. There is a clear indication of altered weather patterns, water scarcity issues, and shifts in agricultural practices. Despite these challenges, the community’s solid social support network and involvement in local environmental management suggest a capacity for resilience and adaptation. The data underscores the need for continued monitoring, community engagement, and adaptive strategies to mitigate the impacts of climate change on these vulnerable mountain communities.
4. Discussion
4.1. LULC, Vegetation and Snow Cover Trends
The analysis of Landsat satellite imagery, corrected for topographical distortions, reveals significant land use and land cover (LULC) changes in the ACA over the 35-year period from 1988 to 2023. Vegetation cover increased substantially, expanding from 57,859 hectares in 1988 to 77,634 hectares in 2023, with a net gain of 19,775 hectares. This growth corresponds with a reduction in barren land, which decreased by 57,766 hectares, reflecting a shift toward afforestation and land reclamation. Snow cover displayed notable variability, peaking in 1996 before declining in subsequent years. Water bodies, meanwhile, exhibited relatively minor fluctuations over the study period. NDVI trends demonstrate a consistent improvement in vegetation health, with average NDVI values increasing from 0.069 in 1988 to 0.340 in 2023, and maximum values reaching 0.983, highlighting enhanced vegetation cover and a potential upward shift in vegetation zones to higher elevations due to warming temperatures.
The increase in vegetation cover aligns with regional findings by [
26], who observed greening trends across the Central Himalayas due to warming-induced expansion of vegetation into higher elevations. Additionally, Bandyopadhyay et al., [
17] documented a 28% reduction in areas devoid of vegetation (including glaciers) from 2000 to 2014, with these areas transitioning into vegetated land, particularly in the eastern Himalayas. Studies from other mountainous regions, such as the Scandinavian Mountain Range, have also documented increases in total tree canopy cover and field vegetation in alpine areas, while noting shifts in vegetation composition [
36]. These findings further emphasize how regions adjacent to retreating glaciers or with favorable climatic conditions are transforming into vegetated landscapes. Our study builds on these findings by providing a longer-term, temporally consistent analysis spanning 35 years while incorporating topographical corrections to improve classification accuracy—a crucial step in mountainous terrains.
The observed increase in vegetation can be linked to several mechanisms. First, the establishment of the ACA as a protected area has significantly reduced deforestation while promoting natural regeneration and afforestation through community-led conservation programs [
6]. Second, warming temperatures over recent decades may have extended the growing season and enabled vegetation to establish in areas previously covered by snow or barren land. This trend aligns with studies not just in the Himalayas but also in other mountain areas, which highlight the upward shift in vegetation zones under climate warming. Furthermore, sustainable land management practices adopted by local communities have likely contributed to stabilizing degraded lands, as indicated by reduced barren areas. This trend highlights not only an expansion of vegetation cover but also a likely shift in vegetation zones toward higher elevations, as warming temperatures create favorable growing conditions in previously barren or snow-covered areas. This upward expansion, commonly observed in other mountainous regions worldwide, aligns with global findings on vegetation responses to climate change. For instance, similar trends have been reported in the Alps [
37], Andes [
38], and other regions of the Himalayas [
21,
39], where vegetation zones are migrating upward due to rising temperatures and extended growing seasons.
In contrast, the NDSI trends reveal a concerning pattern of declining snow cover over time, which aligns with broader global observations of shrinking cryospheric zones. Snow cover in the ACA showed significant seasonal fluctuations, with marked reductions during the winter months. Average NDSI values decreased from 0.157 in 1988 to −0.109 in 2023, reflecting a loss of snow cover extent and density. These trends are consistent with observations from similar mountain ecosystems [
37,
38,
39]. The interplay between vegetation expansion and snow cover reduction underscores the complex ecological impacts of climate change in the ACA. On one hand, warmer temperatures and reduced snow cover provide opportunities for vegetation growth, particularly in alpine zones. On the other hand, the loss of snowpack has cascading effects on water availability, hydrological cycles, and habitat suitability for snow-dependent species. Declining snow cover also poses a threat to flagship species like the snow leopard in the ACA [
40], which relies on snow-laden environments for prey availability and movement patterns. Moreover, communities downstream may experience altered water flow regimes due to changes in snowmelt timing and volume, emphasizing the critical need for adaptive water resource management.
The fluctuations in snow cover observed during the study period reflect the combined effects of rising temperatures and variable winter precipitation. While snow cover peaked in 1996, subsequent declines align with regional studies that attribute reduced snow accumulation to increased warming and melting in the Himalayas [
17,
41,
42]. This loss of snowpack disrupts hydrological cycles, diminishing streamflow availability and impacting water-dependent agricultural and ecological systems. Snowpack reductions also pose risks to downstream ecosystems and communities, which rely on snowmelt during drier months. As snow serves as a critical natural reservoir, its loss could have far-reaching consequences for regional water security and ecological stability [
41].
While these findings align with global trends, the ACA presents a unique case where both natural and anthropogenic factors interplay to drive ecological outcomes. The observed improvements in vegetation health suggest that conservation policies, such as afforestation and protection from deforestation, have effectively contributed to ecological resilience. However, the persistent loss of snow cover calls for urgent attention to mitigate its impacts on the region’s hydrology and biodiversity. Further research should aim to disentangle the relative contributions of climate-driven changes and conservation measures, offering a more nuanced understanding of how to sustain these ecosystems under accelerating climatic pressures. By integrating scientific and local knowledge, future conservation strategies can better address these complex interactions and foster resilience in this vulnerable mountain ecosystem.
4.2. Climate Variables and Extremes
The analysis of temperature data across the ACA indicates a clear warming trend, particularly in maximum temperatures (Tmax). All meteorological stations showed positive trends in Tmax, with statistically significant increases observed at Thakmarpha and Khudi Bazar (
p < 0.001). For example, Thakmarpha recorded a sen-slope of +0.040 °C per year. These findings align with previous studies, which report similar warming trends across the Himalayan region [
22]. In contrast, trends in minimum temperatures (Tmin) were more variable. Thakmarpha exhibited a significant decline in Tmin (sen-slope of −0.033 °C per year,
p = 0.001), while Jomsom and Khudi Bazar recorded positive but non-significant trends. These divergent patterns may reflect the influence of microclimatic conditions, such as local topography, elevation, and vegetation cover, as well as variations in nighttime cooling rates in mountainous terrain.
Precipitation trends exhibited significant spatial variability across the ACA. Stations such as Jomsom showed a statistically significant increase in annual precipitation (
p < 0.001, sen-slope of +0.012 mm/year), while Manang Bhot experienced a significant decline (
p = 0.001, sen-slope of −0.015 mm/year). Thakmarpha and Sikles recorded positive but non-significant trends, whereas Khudi Bazar showed a non-significant negative trend. This spatial heterogeneity aligns with findings from [
22], which emphasize the complex interactions between monsoonal dynamics and local topography in determining precipitation patterns in the Himalayas. An increasing frequency of extreme precipitation events was observed, particularly at lower elevation stations. Days with rainfall exceeding 30 mm increased significantly, rising from 6 to 12% in the 1983–1992 period to 33 to 43% in 2003–2012. Similarly, the frequency of days with rainfall exceeding 50 mm doubled, from 2 to 5% to 8 to 14% over the same period. However, rainfall exceeding 100 mm remained relatively rare, with only a slight increase from 0 to 1% to 2% during the study period. The most recent decade (2013–2023) suggested a stabilization or slight decline in the frequency of these extreme events, reflecting natural variability in precipitation patterns.
These trends are consistent with projections from global climate studies, which link warming-induced intensification of the hydrological cycle to an increased frequency of extreme rainfall events [
43]. The spatial patterns observed in the ACA—greater intensification at lower elevations—may result from orographic effects and the enhanced capacity of warmer air to retain and release moisture during convective activity. Decadal analyses revealed contrasting trends between higher and lower elevations. At higher elevation stations, such as Thakmarpha and Jomsom, monsoonal rainfall during July and August showed consistent increases. For instance, Thakmarpha’s mean July rainfall rose from 2.57 mm in 1983–1992 to 2.67 mm in 2013–2023. In contrast, lower elevation stations such as Sikles and Khudi Bazar exhibited more pronounced increases in monsoonal rainfall. Sikles recorded a July rainfall increase from 29.71 mm to 30.30 mm over the same period, reflecting the amplified impact of atmospheric warming and moisture availability at lower altitudes.
The observed climatic trends in the ACA can be attributed to a combination of global and regional mechanisms. Rising temperatures, driven by anthropogenic greenhouse gas emissions, are intensifying the hydrological cycle, leading to more frequent and intense rainfall events. The variability in precipitation trends across stations highlights the influence of local factors, including topography, vegetation cover, and proximity to moisture sources. At higher elevations, warming temperatures are likely accelerating glacial melt, contributing to altered streamflow regimes and seasonal water availability [
44]. These dynamics are consistent with broader trends observed in other mountain regions.
The climatic changes observed in the ACA have profound implications for ecosystems, water resources, and human livelihoods. Increased Tmax and extreme precipitation events at lower elevations heighten the risks of flooding, soil erosion, and infrastructure damage. These changes pose challenges for agriculture, as altered rainfall patterns can disrupt planting schedules and reduce crop yields. At higher elevations, the retreat of glaciers and reductions in snow cover threaten water security for downstream communities, particularly during the dry season [
41].
4.3. Community Perception and Adaptation
The perceptions of local communities in the ACA regarding climate change provide critical insights into how environmental shifts are experienced and managed on the ground. Surveys conducted across 11 villages revealed a high level of awareness of climatic changes, with 85% of respondents noting a decrease in snowfall and alterations in precipitation patterns. These observations align with the environmental trends documented in this study, suggesting that communities are attuned to the impacts of climate variability. A significant proportion (70%) of respondents reported changes in water availability, attributing these to climatic shifts. The impacts on agriculture were particularly pronounced, with residents adjusting crop types and growing seasons to adapt to unpredictable rainfall and shorter winters. These findings echo those of, who similarly identified water conservation and crop diversification as primary adaptive strategies among Himalayan communities [
45,
46,
47,
48].
The community’s perception of changing temperature extremes further underscores their understanding of local climate dynamics. Many respondents observed milder winters, with water freezing less frequently, and described rainfall patterns as increasingly erratic. These observations align with our findings on temperature trends and precipitation variability, which indicate significant warming and an increase in extreme rainfall events. This alignment between observed climatic trends and community perceptions highlights the validity of local knowledge as a complement to scientific data in understanding climate change’s impacts.
Water availability and infrastructure improvements emerged as critical themes in the survey responses. Contrary to challenges often reported in other mountain regions, all surveyed households in the ACA now have access to piped water, reflecting significant progress in water infrastructure development. This improvement not only enhances community resilience to water scarcity but also aligns with global trends toward achieving SDG 6 (Clean Water and Sanitation). The community’s proactive measures, such as rainwater harvesting and efficient irrigation practices, demonstrate their capacity to adapt to changing water dynamics. However, sustained efforts are needed to ensure that these gains are maintained and expanded to remote areas that may still face challenges in water access.
Community engagement in local water management and environmental initiatives shows a mixed picture. While many respondents reported moderate to high involvement, others highlighted barriers to participation, such as limited resources or competing priorities. This variation underscores the importance of fostering inclusive approaches to community engagement, with targeted support for vulnerable groups who may face greater barriers to participation. Strengthening local capacity and providing technical assistance can further enhance collective action in managing climate risks.
The survey also revealed the broader socio-economic implications of climate change. Respondents frequently mentioned floods and landslides as direct impacts on agriculture and livelihoods. These events, driven by increased extreme precipitation, exacerbate existing vulnerabilities in the region. Despite these challenges, the community’s strong social support networks and active participation in conservation efforts reflect a capacity for resilience [
49].
The adaptive strategies employed by the ACA communities are shaped by their direct experiences of climatic changes. Water conservation measures, adjustments in crop types and planting schedules, and participation in environmental initiatives highlight their resilience in the face of environmental challenges. However, these strategies require further support to address emerging risks and ensure long-term sustainability. Enhanced policy frameworks, capacity-building initiatives, and investments in infrastructure are critical to strengthening adaptive capacities. For instance, integrating community-driven approaches into regional climate adaptation policies can ensure that strategies are both locally relevant and effective.
In conclusion, the alignment between community perceptions and observed climatic trends underscores the importance of integrating local knowledge into climate adaptation strategies. The proactive measures undertaken by the ACA communities provide valuable lessons for other mountain regions facing similar challenges. However, sustained policy support, capacity-building, and infrastructure investments are essential to build on these efforts and enhance the resilience of vulnerable mountain communities. By fostering stronger connections between scientific research and community-based initiatives, we can develop more effective and sustainable responses to the complex challenges posed by climate change.
4.4. Policy Implications and Sustainable Adaptation Strategies
By integrating scientific data, including remote sensing and meteorological analyses, with community insights, this study identifies key areas for policy intervention that align with SDG 6 and 13. These implications emphasize the interconnected nature of ecological, climatic, and socio-economic challenges and offer a pathway toward sustainable adaptation strategies.
The observed improvements in vegetation cover and reductions in barren land highlight the success of conservation efforts but also underscore the need for climate-smart resource management practices. Policies should prioritize initiatives such as promoting climate-resilient agriculture, including the introduction of drought-tolerant crop varieties and water-efficient irrigation systems, which can mitigate the risks posed by erratic rainfall patterns and water scarcity. Supporting agroforestry programs can enhance biodiversity, reduce soil erosion, and sequester carbon, offering both ecological and economic benefits. Moreover, addressing water resource challenges through the expansion of rainwater harvesting infrastructure and groundwater recharge systems is critical to ensuring year-round water availability for agriculture and household needs. Such measures will not only improve water security but also enhance resilience against seasonal variability and extreme weather events.
The findings related to snow cover fluctuations and the upward expansion of vegetation zones present unique challenges for biodiversity conservation. Cold-adapted species such as the snow leopard and red panda face shrinking habitats, while changes in snow cover threaten the hydrological cycles that sustain downstream ecosystems and communities. Conservation policies must incorporate measures to protect critical habitats, particularly in alpine and riparian zones, and promote the restoration of degraded ecosystems. Payment for Ecosystem Services (PES) programs could incentivize local communities to engage in conservation activities, such as afforestation, watershed management, and wildlife monitoring, ensuring both ecological preservation and community livelihoods.
Community perceptions of climate change impacts, such as reduced snowfall and changes in water availability, align closely with the scientific findings, reinforcing the importance of integrating local knowledge into policy frameworks. Strengthening the role of community-based water management groups through technical training and resource allocation can empower residents to manage water systems more effectively. Policymakers should also focus on enhancing the capacity of communities through education and training programs that promote awareness of climate adaptation strategies, such as sustainable farming practices and efficient water use. These initiatives should be designed to foster inclusivity, addressing barriers to participation faced by marginalized groups and ensuring that adaptation efforts are equitable.
The observed increase in extreme precipitation events, particularly at lower elevations, highlights the need for policies that address disaster risk reduction. Investments in resilient infrastructure, such as flood-resistant roads and bridges, are essential to mitigate the impacts of flooding and landslides on livelihoods and critical services. Early warning systems for extreme weather events, combined with localized emergency response plans, can enhance community preparedness and reduce vulnerabilities. The integration of these measures into national climate adaptation plans will ensure that they are implemented systematically and sustainably.
Effective governance frameworks are crucial for translating these findings into actionable policies. Collaborative governance models that bring together government agencies, conservation organizations, and local communities can ensure that interventions are both scientifically sound and culturally relevant. Strengthening communication channels between national policymakers and grassroots stakeholders will enable bottom-up feedback mechanisms, ensuring that local needs and priorities are reflected in broader climate adaptation strategies. Furthermore, scaling up education campaigns on climate resilience can foster a deeper understanding of the challenges and solutions, empowering individuals and communities to contribute proactively to sustainability efforts.
In addition to local interventions, this study highlights the importance of leveraging technology and data integration to inform policy decisions. Expanding meteorological monitoring networks in high-altitude and remote areas can improve the resolution of climate trend analyses, while GIS-based tools can provide real-time data on land use changes, vegetation health, and snow cover dynamics. These advancements will support evidence-based policymaking and enable adaptive management strategies that respond to emerging challenges.
The alignment of the study’s findings with SDGs 6 and 13 provides a clear framework for prioritizing policy actions.
Table 7 outlines how our study’s outcomes align with specific targets under SDGs 6 and 13, along with tailored recommendations to enhance sustainability efforts. For SDG 6, expanding access to clean water in underserved areas, promoting efficient irrigation techniques, and safeguarding water-related ecosystems are critical steps. For SDG 13, integrating local adaptation measures into national climate policies and providing technical and financial support for community-driven initiatives will strengthen resilience to climate-related hazards. Policymakers must ensure that these actions are coordinated and mutually reinforcing, balancing ecological conservation with socio-economic development.
4.5. Limitations and Future Research Directions
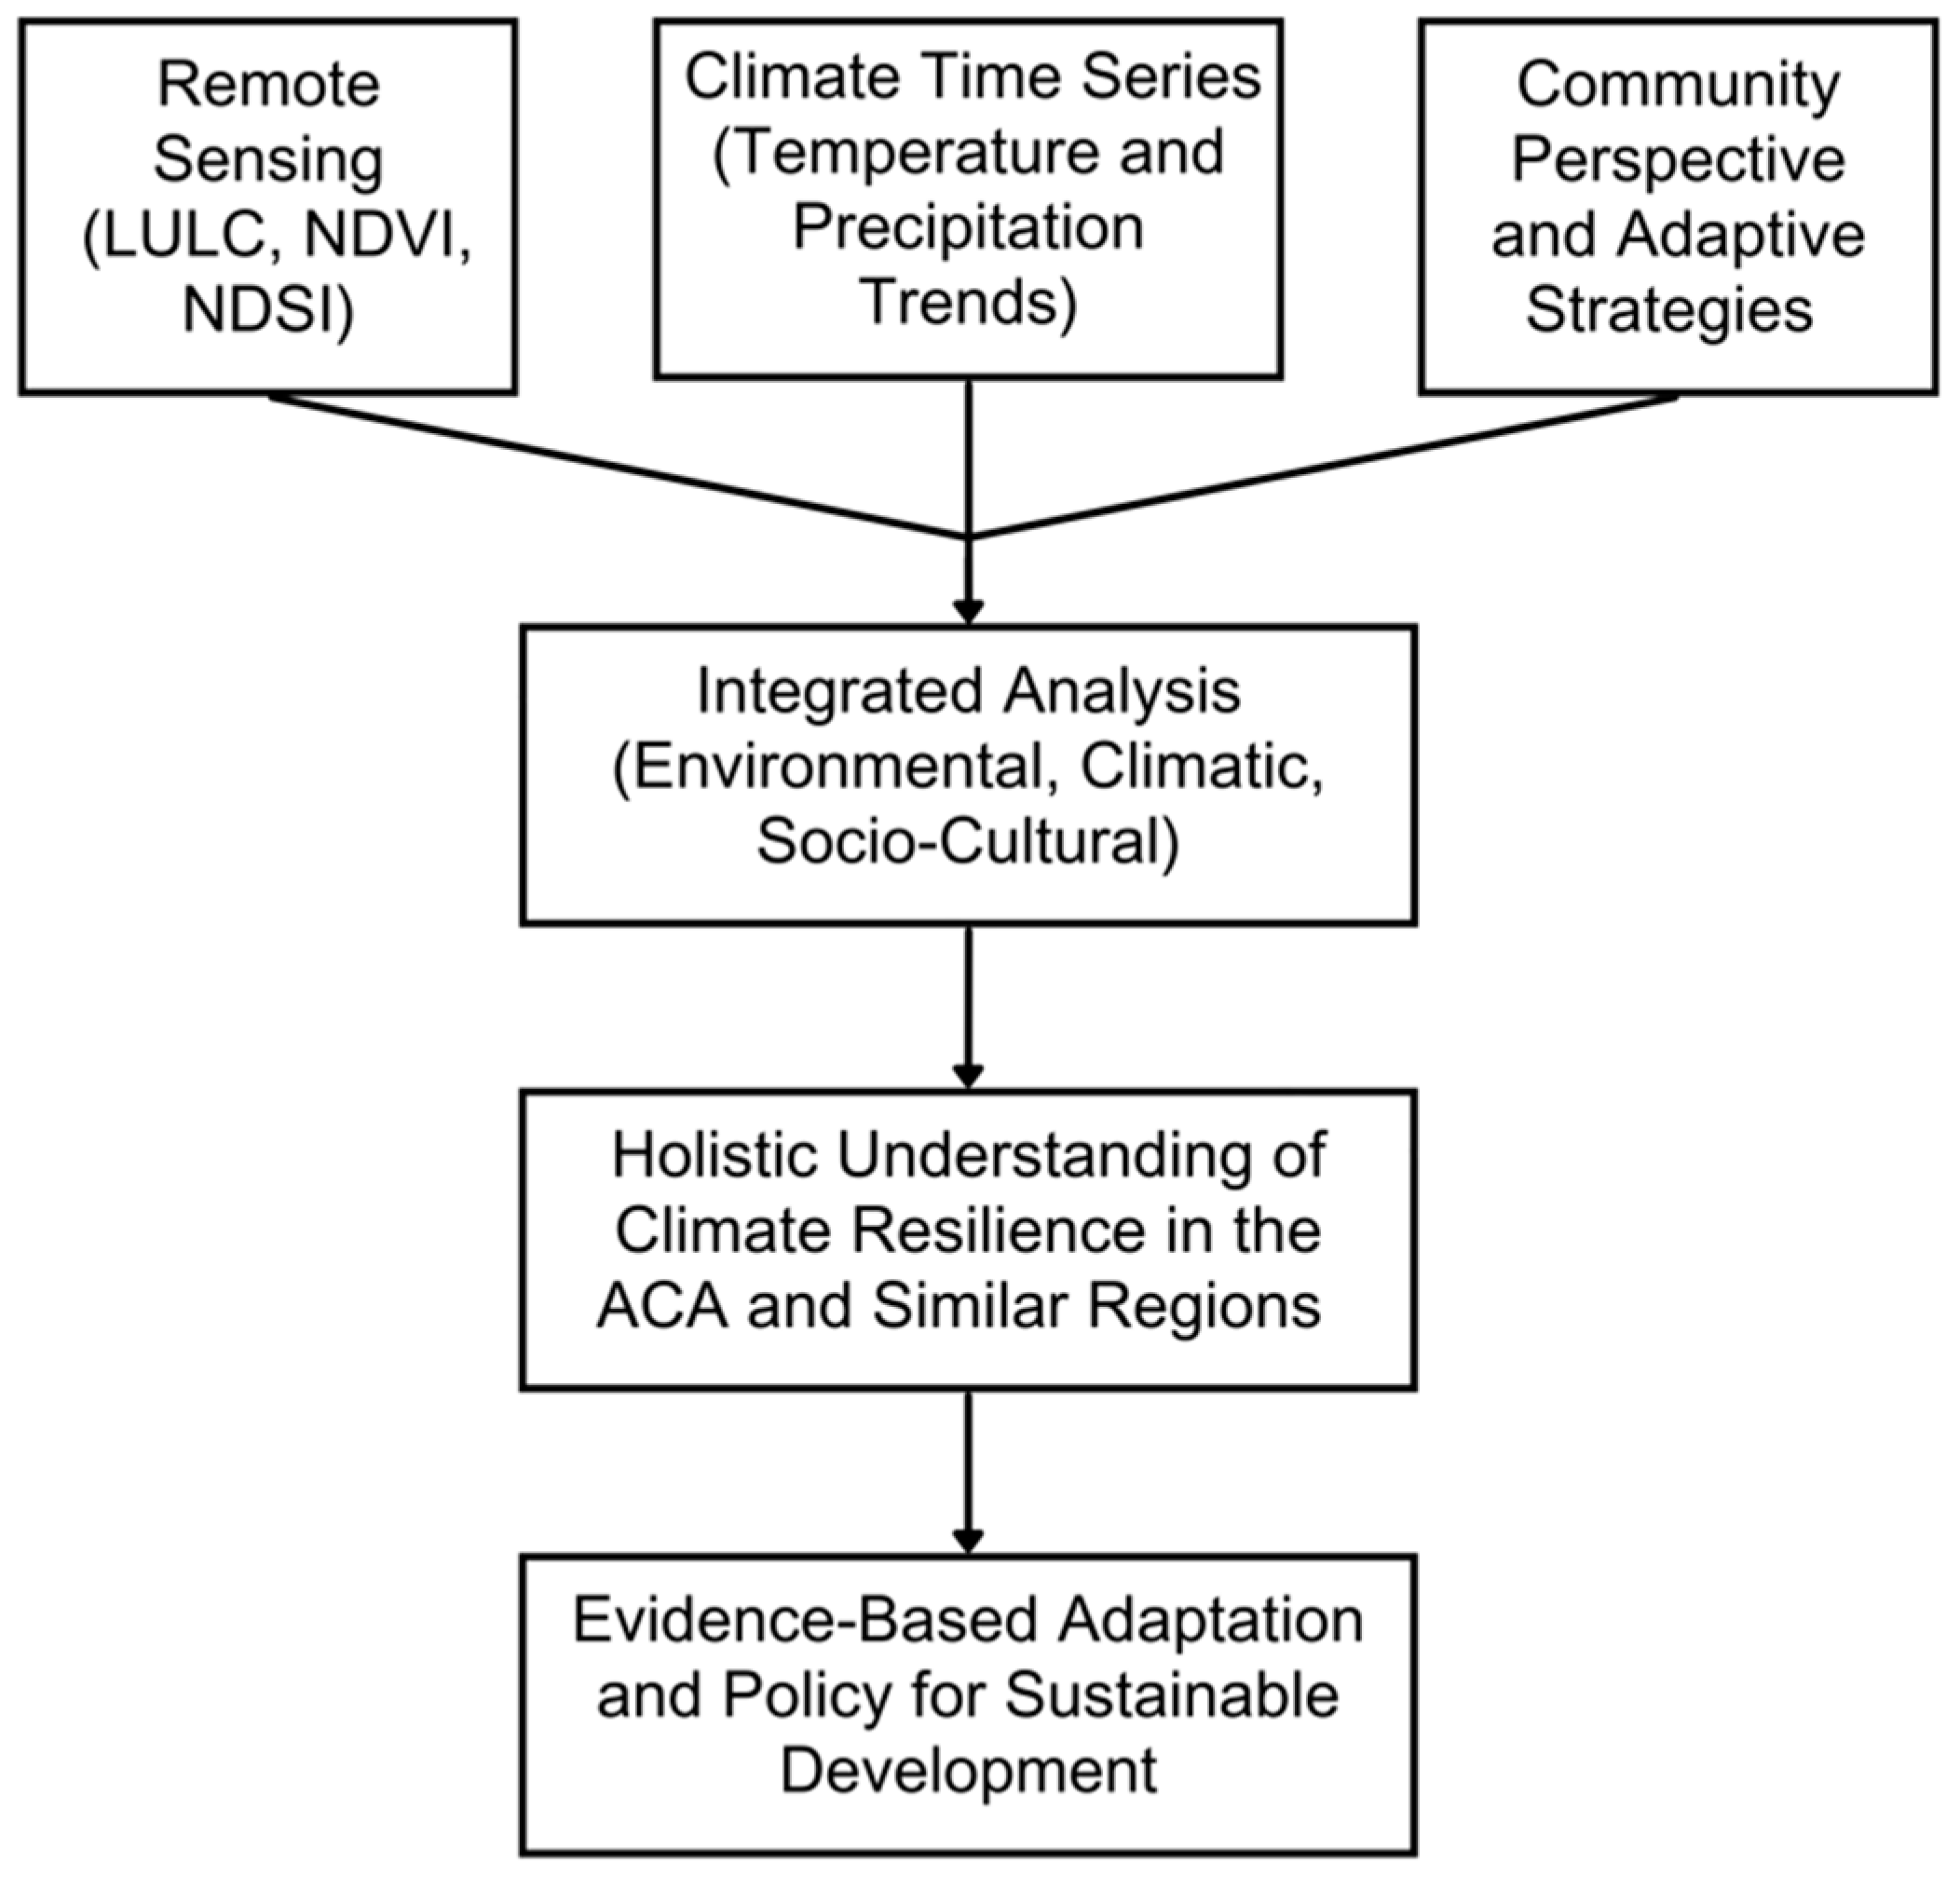
This study provides critical insights into climate resilience in the Annapurna region through an integrated approach involving remote sensing, meteorological analyses, and community surveys. However, several limitations must be acknowledged to contextualize the findings and guide future research. The use of Landsat imagery, while providing a long-term perspective on land use and land cover changes, is constrained by its moderate spatial resolution, which may overlook fine-scale variations in the heterogeneous terrain of the study area. Although topographical corrections enhanced the accuracy of classifications, residual errors in steep slopes and shadowed regions remain a challenge. Vegetation health and snow cover trends, analyzed using NDVI and NDSI, offered valuable insights but oversimplified ecological processes in areas where vegetation and snow overlap. Additional indices or ground-based validation could improve the precision of such analyses.
The sparse meteorological station network, particularly in remote high-altitude areas, limited the resolution of climate variability assessments. Gaps in temperature and precipitation data may have introduced uncertainties, necessitating the expansion of monitoring networks and the use of satellite-based climate datasets to address spatial and temporal gaps. Community surveys, while capturing diverse perceptions from multiple villages, were limited by their sample size and the inherent subjectivity of self-reported data, which may have emphasized recent climatic events. Larger, more representative samples, combined with participatory research methods, could provide a deeper understanding of community-level responses.
Future research should prioritize higher-resolution satellite imagery and advanced machine learning techniques to capture fine-scale land cover dynamics more accurately. Investigating the interactions between vegetation expansion and snow cover loss using additional ecological indices and process-based models will deepen understandings of ecosystem responses to climate change. Expanding meteorological station coverage and integrating high-resolution climate models will provide more granular data to support localized adaptation strategies. Socio-economic studies tracking the long-term impacts of climate variability on livelihoods and adaptation strategies could inform more actionable policies, while research on extreme weather events like floods and landslides would enhance disaster preparedness.
Addressing these limitations through interdisciplinary approaches and integrating local knowledge with scientific data will not only refine future analyses but also strengthen the development of adaptive strategies for climate resilience. By building on these findings, future research can contribute to more effective policies and sustainable resource management, supporting both ecological integrity and community well-being in vulnerable mountain ecosystems. This comprehensive understanding will also enhance alignment with global sustainability goals, ensuring a balanced approach to conservation and adaptation.
5. Conclusions
This study provides a comprehensive assessment of climate change impacts in Nepal’s ACA over the past 35 years (1988–2023) by integrating remote sensing, climate data analysis, and community perspectives. The findings reveal significant environmental transformations, including a 34% increase in vegetation cover from 57,858.84 ha in 1988 to 77,634.27 ha in 2023, driven by effective afforestation and conservation initiatives. Concurrently, barren land decreased by approximately 14.9%, from 389,018.9 ha to 331,252.8 ha, highlighting successful land restoration efforts. However, snow cover has declined by 16.7%, decreasing from a peak of 95,991.75 ha in 1996 to 80,323.38 ha in 2023, underscoring the adverse effects of rising temperatures and reduced snowfall. These environmental changes are further evidenced by the significant improvement in vegetation health, with NDVI increasing from an average of 0.069 in 1988 to 0.340 in 2023, while NDSI declined from 0.157 to −0.109 over the same period.
Climate variability analysis reveals a complex pattern of warming and precipitation changes across the ACA. Tmax has shown a consistent warming trend, particularly in Thakmarpha and Khudi Bazar, with statistically significant increases of +0.040 °C per year (p < 0.001). Tmin exhibited mixed trends, including a significant decrease of −0.033 °C per year in Thakmarpha (p = 0.001). Precipitation patterns have become increasingly variable, with Jomsom experiencing a significant annual increase of +0.012 mm/year (p < 0.001) and Manang Bhot facing a significant decrease of −0.015 mm/year (p = 0.001). The frequency of extreme rainfall events has surged, with days exceeding 30 mm of rainfall rising from 6 to 12% in the 1983–1992 decade to 33 to 43% in 2003–2012, and days exceeding 50 mm increasing from 2 to 5% to 8 to 14%. These changes heighten the risks of flooding and landslides, posing substantial threats to both ecosystems and local communities.
Community surveys conducted across 11 villages within the ACA reveal a high level of climate change awareness, with 85% of respondents observing significant climatic shifts such as decreased snowfall and altered precipitation patterns. Approximately 70% reported changes in water availability, directly linking these to climate variability. These perceptions are reflected in tangible adaptations, including crop diversification and altered growing seasons to accommodate new climatic conditions. Notably, all surveyed households now have access to piped water, a significant improvement that aligns with the 2023 Joint Monitoring Program (JMP) report [
35], advancing progress toward SDG 6. Additionally, community engagement in water management groups is moderate to high, indicating a proactive stance towards enhancing resilience, although further efforts to increase participation could bolster collective adaptive capacity.
The integrated approach of this study—combining remote sensing, climate data, and community insights—provides a holistic understanding of the interplay between environmental changes and socio-economic impacts in the ACA. Quantitative data, such as the increase in NDVI and the significant rise in extreme rainfall events, align with global climate trends, reinforcing the study’s broader relevance. The inclusion of community perceptions underscores the direct impact of environmental changes on local livelihoods and highlights effective adaptive strategies. These insights inform actionable recommendations, including the expansion of rainwater harvesting systems, promotion of climate-resilient agricultural practices, and implementation of robust disaster risk reduction measures. By merging scientific monitoring with community-based adaptation strategies, the study advocates for policies that are both scientifically robust and culturally relevant, ensuring sustainable and effective climate resilience. The study stresses the importance of strengthening community-based adaptation efforts, improving disaster risk reduction strategies, and fostering inclusive, technology-driven governance models. Additionally, it highlights the need for policies that protect water-related ecosystems, support local communities, and integrate local climate adaptation actions into national strategies.
In summary, this research advances understandings of climate change impacts in the ACA by offering a scalable framework applicable to other mountain regions. The significant environmental changes, coupled with high community awareness and adaptive responses, underscore both the challenges and the resilience of mountain ecosystems and their inhabitants. By leveraging an integrated methodological approach, the study delivers valuable insights and practical solutions essential for achieving sustainable development and enhancing climate resilience, directly supporting SDGs 6 and 13. The incorporation of detailed empirical data and community perspectives ensures that the recommendations are grounded in local realities, facilitating effective and sustainable policy and practice implementations.


