1. Introduction
In most contemporary international regional policies, competitiveness is of pivotal importance. The objective of such policies is to reduce disparities between regions and ensure sustainability. The concept of competitiveness was initially developed in the context of firms but has subsequently been applied to regional units on an increasingly broad basis since the 1990s. As is the case in the current European policy landscape, this new notion plays an integral role in designing and implementing policy initiatives. These initiatives are designed to achieve two key objectives: to foster the development of highly competitive regional economies on the global stage and to guide those that are less competitive toward more productive and competitive pathways [
1]. In defining regional competitiveness, the World Competitiveness Report (1999) identifies three key aspects: (a) a region’s capacity to generate wealth in a manner that maintains equilibrium with its competitors; (b) a country’s (or region’s) capacity to utilize its domestic resources to enhance the quality of life of its inhabitants; and (c) a region’s capacity to accumulate wealth and improve its value by reliance on its domestic economy and international trade.
With regard to the Kingdom of Saudi Arabia (KSA), a noteworthy economic transformation has taken place over the past few decades. This transition has resulted in the emergence of an economy based on knowledge and innovation, with a specific focus on human capital development and quality of life. This strategy contributes to the country’s competitiveness, enabling the KSA to be classified as one of the most competitive nations worldwide by the Swiss-based Institute for Management Development (IMD) World Competitiveness Yearbook. To guarantee sustained success, it is vital to reinforce regional competitiveness through the implementation of strategic measures. Therefore, it is essential to analyze regional competitiveness in Saudi Arabia to foster balanced economic development, drive investment, create jobs, and support the goals set out in Vision 2030. By focusing on the strengths and challenges of individual regions, the KSA can ensure sustainable growth and enhance its global competitiveness. Furthermore, data-driven insights from a regional competitiveness analysis can guide the formulation of effective policies, incentivize regional growth, and ensure a more balanced national development strategy [
2].
It is evident that a multitude of factors contribute to the competitive landscape of different regions. These factors encompass a multitude of variables, including the efficiency of enterprises, the institutional qualities of a region, its social and cultural aspects, the state of its physical infrastructure, the capacity for innovation, externalities, and other factors [
3,
4]. The advent of regional studies can be attributed to the necessity of devising efficacious strategies from a regional policy perspective that foster competitiveness. In this regard, the European Commission’s (EC’s) periodic publication of a report on the assessment of competitiveness among European regions has undoubtedly facilitated the advancement of research in this field. This report can thus be regarded as a foundational resource in the field, as several scholars have suggested (see, for example, [
5,
6]). It is of the utmost importance to have access to a reliable and comprehensive indicator that provides insights into the relative strengths and weaknesses of each region. The RCI, as proposed by the EC [
7], provides an illustrative example of this necessity. When employed in conjunction with other indicators and composite indices, the RCI and its derivatives serve as invaluable tools for assessing the characteristics and developed structure of a region and for comparing them across different regions. The assessment of the RCI can guide regions toward more sustainable development by promoting informed decision-making, innovation, and collaborative strategies that balance economic, social, and environmental objectives. Considering the aforementioned factors, this research aimed to apply the RCI methodology to assess and compare the level of competitiveness of the thirteen provinces of the Kingdom, with a special focus on the competitiveness of the Hail region compared to other Saudi regions in 2021. The initial stage of the research involved the assessment of the robustness of the results obtained from the variable reduction method employed in the construction of the index. To undertake this assessment, the well-known Principal Component Analysis (PCA) technique was employed.
This research paper offers two new insights that contribute to the existing theoretical and empirical literature on this subject. Firstly, most contemporary studies in this field have concentrated on sectorial competitiveness or specific elements of the business environment, with inadequate consideration of the social aspect [
8,
9,
10,
11]. To the best of our knowledge, no studies have examined the regional competitiveness of the KSA from an integrated perspective that encompasses infrastructure, innovation, health, technological readiness, market size, quality of education, and labor market efficiency. This represents a notable gap in the existing literature. Secondly, our empirical analysis represents a novel application of the index system technique and the use of the RCI for a non-European country such as Saudi Arabia. The remainder of this manuscript is organized as follows:
Section 2 presents a review of the literature on the importance and measurement of regional competitiveness.
Section 3 describes the methodology and variables used in this study.
Section 4 reveals and discusses the empirical results of this research.
Section 5 concludes the study and proposes some recommendations.
2. Literature Review
There is a consensus among academics that regional competitiveness plays a crucial role in the sustainable development and growth of a region. Furthermore, it plays a pivotal role in attracting resources and fostering competition, thereby supporting the growth and advancement of the region in question [
12,
13,
14,
15,
16,
17,
18,
19,
20,
21]. Indeed, defining RC is a challenging endeavor, as this concept encompasses a multitude of characteristics at various levels, including economic, managerial, political, social, and, most notably, geographical characteristics [
22]. The concept of regional competitiveness is inherently multidisciplinary, making it challenging to provide a simplistic and generic understanding of it. Prior research has addressed the topic of territorial competitiveness from two distinct theoretical perspectives. The concept was initially developed as a set of factors influencing national productivity. Subsequent studies have broadened this perspective to encompass its role as a factor in the sustained improvement of population well-being. The initial perspective on competitiveness is exemplified by the works of Schwab and Porter [
23] and is, in fact, implicit in the Global Competitiveness Index, as developed by the World Economic Forum. The second view of competitiveness can be observed, for instance, in the study by Meyer-Stamer [
24] within the context of what is known as systemic competitiveness. The latter perspective is based on certain concepts that are similar in rationale to those behind the Human Development Index, which was developed by the United Nations. This index postulates that the development and competitiveness of a country are not contingent solely upon economic growth. A substantial body of literature has emerged since the 2000s, with notable contributions from authors including Porter, Camagni, Cellini and Soci, and Porter and Ketels [
18,
25,
26,
27,
28,
29]. These works have sought to refine the definition of competitiveness and develop quantitative measures for its assessment.
In this context, this paper presents an overview of the most pertinent studies related to the variables under investigation. Indeed, the report prepared by the World Bank Group team led by Rahman et al. [
8] presents the findings of the inaugural Provincial Competitiveness Study conducted in the Kingdom of Saudi Arabia. The study employed the Provincial Competitiveness Index (PCI), a recently developed policy instrument designed to enhance competitiveness at the subnational level. The PCI uses a composite index consisting of 10 sub-indices to assess competitiveness at the provincial level, with each province receiving a score on a 100-point scale. The PCI sample consisted of over 4100 micro-, small-, and medium-sized enterprises. The sample was primarily composed of small and medium-sized enterprises engaged in wholesale and retail trade activities. This report is based on data collected from firms through surveys conducted between January and April 2017 and on administrative data gathered from publicly accessible sources. The results of the PCI for the 13 provinces indicate that Riyadh exhibits the highest level of overall competitiveness, followed by Al-Qassim, Makkah, and Hail. In contrast, the Northern Borders region is identified as the least competitive, with Al-Jouf and Aseer following closely behind. The PCI scores demonstrate considerable discrepancies in competitiveness between provinces.
In a comparative analysis of regional competitiveness in Poland, Chrobocińska [
5] employed the RCI for Polish voivodships between 2010 and 2019, in conjunction with a multi-dimensional comparative analysis and cluster analysis. The findings indicate that the observed disparities in the competitiveness of Polish voivodeships can be attributed to long-term socioeconomic processes, including the patterns of scarce urbanization and industrialization. The RCI was established by Sihombing et al. [
30] as the main indicator for evaluating a region’s capacity for economic, social, and environmental competitiveness in relation to other regions. This study’s objective was to determine the relationship between the RCI and a range of socioeconomic and macroeconomic variables. These include the growth of gross regional domestic product, the human development index, foreign and domestic investments, regional income, and poverty rates in accordance with the data available for Indonesia in 2022. The analytical model employed was the Partial Least Squares Structural Equation Model (PLS-SEM), which utilized Smart PLS software. The findings indicated significant positive relationships between the RCI and several key economic and social indicators. Conversely, the RCI has been demonstrated to exert a negative influence on the proportion of the population residing below the poverty line.
In a separate study, Stratan and Fală [
31] assess the innovation environment, productivity, and international competitiveness of the Republic of Moldova in comparison to other Central European countries. The authors have reached the following conclusions based on the research conducted. Moldova performs considerably worse than the benchmark countries in terms of the innovation input sub-index and the knowledge impact index, as outlined in the Global Innovation Index produced by the Global Forum of Intellectual Property. The knowledge impact, as demonstrated by production and export complexity, labor productivity growth, and high-tech exports as a proportion of total trade, is relatively low, which contributes to Moldova’s limited share of the global export market.
In their study, Scaccabarozzi et al. [
32] present a novel methodology for measuring regional competitiveness at the local level in Italy. The suggested indicator consists of seven dimensions of competitiveness. The dimensions of competitiveness are as follows: education, employment, economic well-being, territory and environment, innovation, infrastructure, entrepreneurship, and mobility. The data for 2014 and 2015 were collected from official sources. The findings indicate a notable variation in municipal competitiveness across Italian regions. It is evident that municipalities exhibiting elevated levels of competitiveness are present in all regions, albeit to varying degrees. In a separate study, Prasetyo et al. [
33] employ a mixed-methods approach, utilizing secondary data sources for both quantitative and qualitative analyses to examine the competitive dynamics between Blitar City and the surrounding regions of Selingkar Wilis and South Rim in East Java Province. In the quantitative analysis, radar charts are utilized, whereas a clustering approach is employed in the qualitative analysis of regional innovation pillars. The findings indicate that Blitar City maintains a consistent ranking, although it exhibits a deficiency in four pillars relative to the Wilis and South Lingkar Areas. The study emphasizes the importance of prioritizing improvements in the business dynamics, innovation capacity, product market efficiency, and access to finance pillars.
In their research, Kahouli et al. [
34] examine the impact of information and communication technology (ICT) on the competitive advantage of small- and medium-sized enterprises (SMEs) in Saudi Arabia during the first quarter of 2022. The authors propose a five-dimensional framework for the detection of ICT (human resources, equipment and devices, databases, software, and networks) and a four-dimensional framework for the determination of competitive advantage (service quality, market control, creativity and development, and operational efficiency). A questionnaire was constructed to gather data from respondents comprising a sample population of 128 individuals. Subsequently, the data were subjected to statistical analysis using the Statistical Package for the Social Sciences (SPSS). The findings suggest that ICT has a considerable impact on the various dimensions that contribute to the competitive advantage of SMEs. Prasetyo et al. [
35] provide an exhaustive examination of regional competitiveness, with a particular focus on the challenges that are widely acknowledged as being closely interrelated with data management. A qualitative methodology was employed for the analysis of the data. To provide a comprehensive overview, the study employs both secondary data, which are corroborated by input from relevant field experts, and primary data, which have been gathered from a range of sources to track the evolving regional competitiveness requirements. The data collection process was conducted over a four-month period, from July to October 2022. The findings of the study indicate that the data management of regional competitiveness is founded upon indices, aspects, and pillars for the five regions situated within the boundaries of the Purwomorong Economic Development Area. It is notable that there are significant variations observed across the regions. These variations can be explained by several factors, which include policy and regulatory issues, concerns about governance, human and behavioral issues, process and quality concerns, technological challenges, and cultural and organizational considerations. In another study, Surya et al. [
36] utilize a variety of indicators, including educational attainment, employment opportunities, health outcomes, and the investment environment, to assess the regional competitiveness index (IDSD) of Banten Province in terms of human resources. A descriptive analysis and Regional Competitiveness Index calculation are the methodologies used. The data utilized in this study were provided by the National Research and Innovation Agency. The study’s findings indicate that the regions exhibit strengths in various pillars, with Banten province serving as a notable example. It is imperative to prioritize efforts to improve the human resource quality in Banten province, given the factors affecting competitiveness, such as education, land availability, employment, health, and the investment environment.
In a study conducted in 2024, Farid [
37] investigated the role of higher education institutions in regional competitiveness, with particular focus on the importance of innovation. The research is specifically focused on the role of innovation centers in terms of their design and operation, with a consideration of sustainable development as a core aspect. The research findings indicate that innovation and the generation of knowledge are significant contributors to regional competitiveness. Furthermore, they elucidate the function of universities and their role as fourth-generation universities, which serve to facilitate this growth. The research then proceeds to present illustrative examples and models for international innovation centers at various universities, with a particular focus on their role in the broader context of the Egyptian higher education strategy.
Maza and Hierro [
4] evaluated the dependability of the RCI findings by adjusting the dimensionality reduction technique. The researchers identified two key factors, namely, geographical proximity to potential rivals and technological specialization. The RCI indicator demonstrated resilience when variable reduction techniques were applied. Moreover, the incorporation of geographical distance led to a significant alteration in the competitive dynamics observed in numerous regions. This is a significant point to consider, as competition is often more intense when regions are in closer proximity. Finally, notable changes in RCI rankings were observed when regions were categorized based on their technology level.
Likewise, Kouskoura et al. [
38] examined the key factors for the assessment of regional competitiveness over the period August 2023 to January 2024. The results illustrate the inextricable interconnection between economic, social, and environmental determinants, collectively influencing the development of successful societies. This research underscores the intrinsic interdependence of economic, social, and environmental factors in fostering thriving societies, thereby offering a pivotal insight into regional competitiveness.
In a more recent study, Yang et al. [
39] evaluated the competitiveness of 31 Chinese provinces based on three fundamental categories: basic, enterprise, and market factors. This analysis assesses the regional competitiveness of cross-border e-commerce in China for the period of 2018–2021. The results of the Groundings–Enterprises–Markets (GEM) model show that China’s cross-border e-commerce competitiveness has improved annually. Notwithstanding, considerable regional disparities persist, with the eastern region exhibiting superior performance relative to the western region. The principal determinants of competitiveness are the index of the development of the digital economy, the number of cross-border e-commerce pilot zones, research and development expenditure, the competitiveness of cross-border enterprises, and the size of core enterprises.
The findings of our literature review have identified several areas within the field of a regional competitiveness assessment in Saudi Arabia that require further investigation. These may include social aspects, such as human capital and education, quality of life, and social infrastructure, as well as environmental aspects, such as natural resource availability and renewable energy. Therefore, this research aims to develop a novel evaluation framework, which is the RCI, for examining the regional competitiveness of the thirteen provinces in the KSA during 2021. The RCI assesses the competitiveness of regions, not just from the perspective of business or economic activity but in a broader sense, including social, environmental, and institutional dimensions. The RCI typically provides a comprehensive view of how thriving regions perform in fostering a competitive environment for sustainable development and overall quality of life. A comprehensive RCI helps Saudi Arabia avoid the over-concentration of economic activity in a few regions, such as Riyadh or Jeddah. More evenly distributed economic growth fosters sustainability by preventing overdevelopment in one region and underdevelopment in others.
3. Research Design and Methodology
The methodology and procedures employed in a research project represent a crucial element of the research process. They provide a framework for the presentation of the requisite information and data for conducting a statistical analysis. In this section, the research methodology is presented and clarified, along with a description of the sample and an explanation of the selection process. In conclusion, the statistical methodology employed in the data analysis is presented.
A competitiveness analysis of Saudi Arabia is a valuable tool for identifying lagging regions and tailoring interventions to improve their economic performance, thereby reducing disparities and fostering more balanced regional development. However, the lack of a theoretical framework that is capable of both constructing and assessing regional competitiveness performance has prompted us to evaluate the country’s performance in its pursuit of regional competitiveness by reference to the European Union’s Regional Competitiveness Index (RCI) 2019 edition. Nevertheless, the conceptual framework proposed by the RCI could be extended to define regional competitiveness for non-EU territories (see González Catalán [
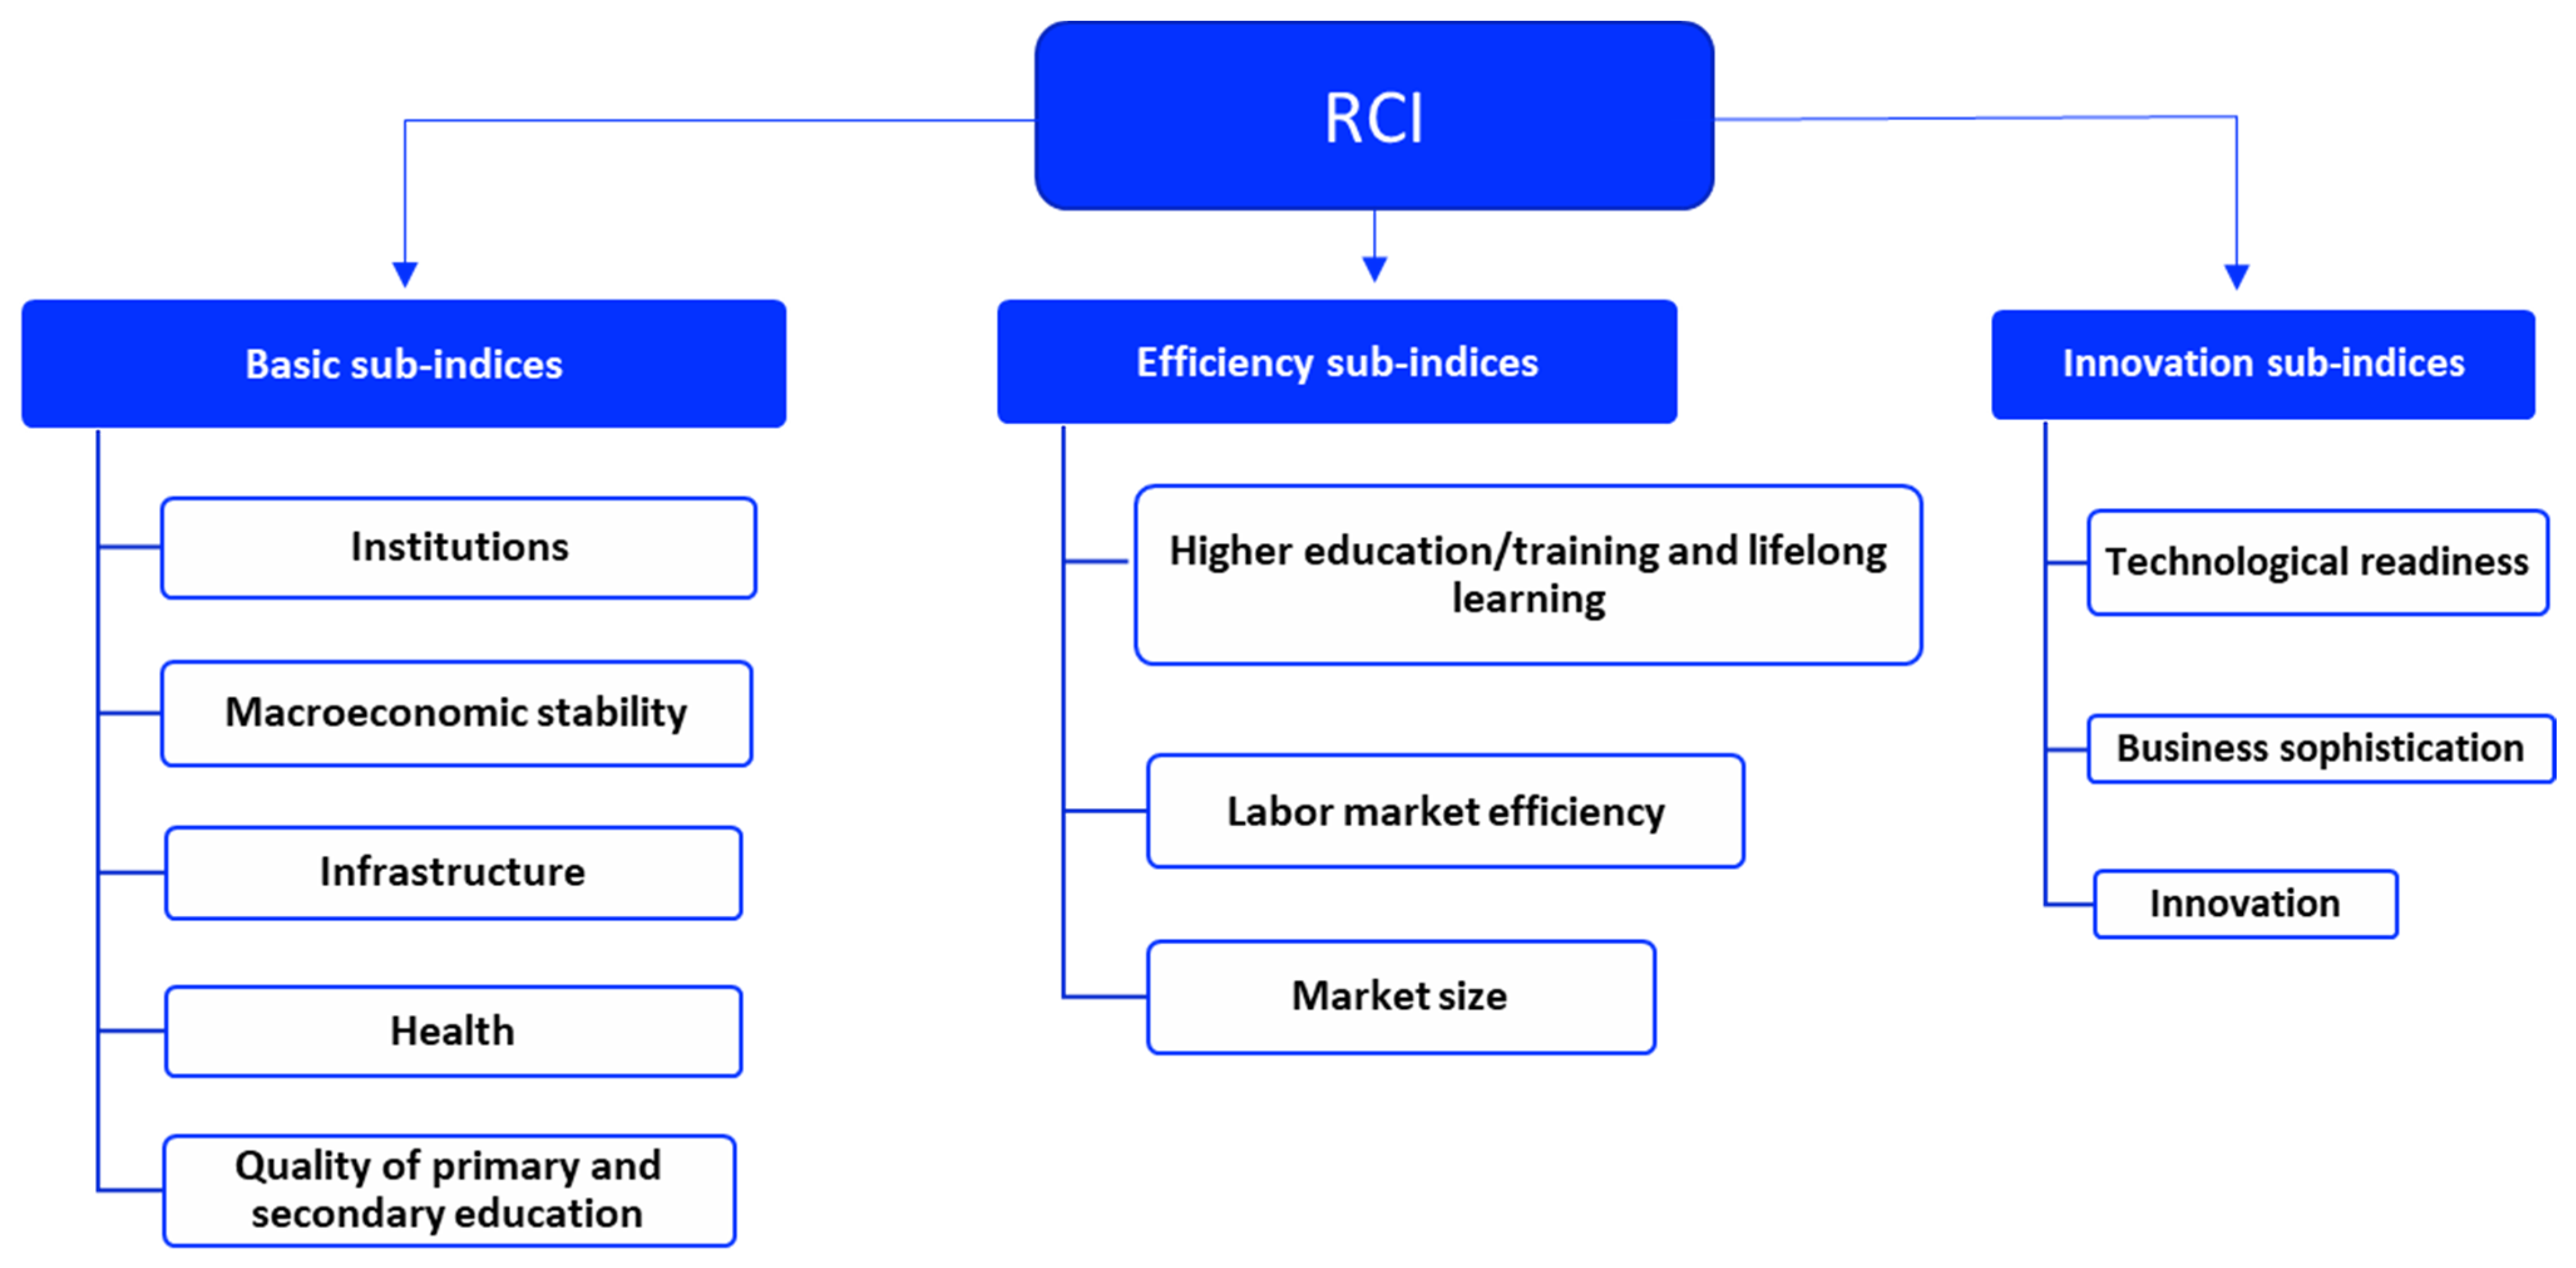
40]). The RCI represents a composite measure of multiple dimensions (or pillars) that cannot be directly observed. Instead, each dimension is quantified indirectly through indicators, which are then subjected to statistical assessment and aggregated. For example, innovation is crucial for competitiveness. However, it cannot be directly observed, and so it is quantified using indirect indicators, including total patent applications, scientific publications, and total intramural research and development expenditure. Indeed, the RCI is comprised of 11 pillars, which are grouped into three sub-indexes, as illustrated in the following
Scheme 1.
The 11 pillars are derived from the sequential aggregation of 74 indicators observed for the Kingdom of Saudi Arabia at the regional level (
Appendix A). The indicators can be classified into 11 pillars (dimensions), which are aggregated into three sub-indexes: basic, efficiency, and innovation.
Additionally, an overall composite index is generated [
41]. The three RCI sub-indexes are conceptually nested within a hierarchical structure. The performance of the innovation sub-index exerts a direct influence on the results of the basic and efficiency indices, which are regarded as being instrumental in facilitating a marginal increase in the level of competitiveness. To illustrate, a region exhibiting inadequate performance in the basic group is inherently unable to attain a commendable standing in the other two groups.
The RCI may be able to provide an answer to the central question: What are the principal factors that shape regional competitiveness in Saudi Arabia? Three fundamental hypotheses are then put forth for consideration.
H1. Regions in Saudi Arabia with higher scores in the basic sub-index components of the RCI demonstrate a significant positive impact on their overall regional competitiveness.
This hypothesis could include the following sub-hypotheses:
H1.1. Regions with better strong local institutions will score higher on the RCI, contributing significantly to their regional competitiveness;
H1.2. Regions with higher macroeconomic Stability will score higher on the RCI, contributing significantly to their regional competitiveness;
H1.3. Regions with better infrastructure will score higher on the RCI, contributing significantly to their regional competitiveness;
H1.4. Regions with higher levels of public health and well-being will score higher on the RCI.
H1.5. Basic education positively correlates with regional competitiveness in Saudi Arabia.
The second principal hypothesis concerns the second dimension of the RCI.
H2. Regions in Saudi Arabia with higher scores in the efficiency sub-index components of the RCI demonstrate a significant positive impact on their overall regional competitiveness.
This hypothesis is composed of the following sub-hypotheses:
H2.1. Regions with higher levels of educational attainment and a skilled labor force will score higher on the RCI.
H2.2. Regions with more efficient labor markets, characterized by low unemployment rates and high levels of workforce participation, will exhibit greater regional competitiveness.
H2.3. Regions with higher competitiveness scores will experience larger market sizes.
The last principal hypothesis is as follows:
H3. Regions in Saudi Arabia with higher scores in the innovation sub-index components of the RCI demonstrate a significant positive impact on their overall regional competitiveness.
This hypothesis is composed of the following sub-hypotheses:
H3.1. Regions in Saudi Arabia that have higher levels of technological innovation and digital infrastructure are more competitive according to the RCI.
H3.2. Regions with a more favorable business environment will rank higher in the RCI.
H3.3. Regions with higher levels of innovation and research and development investment will demonstrate a stronger position in the RCI.
The RCI considers the level of regional development, with a particular emphasis on the basic issues prevalent in less developed regions and the innovation capacity observed in more developed regions [
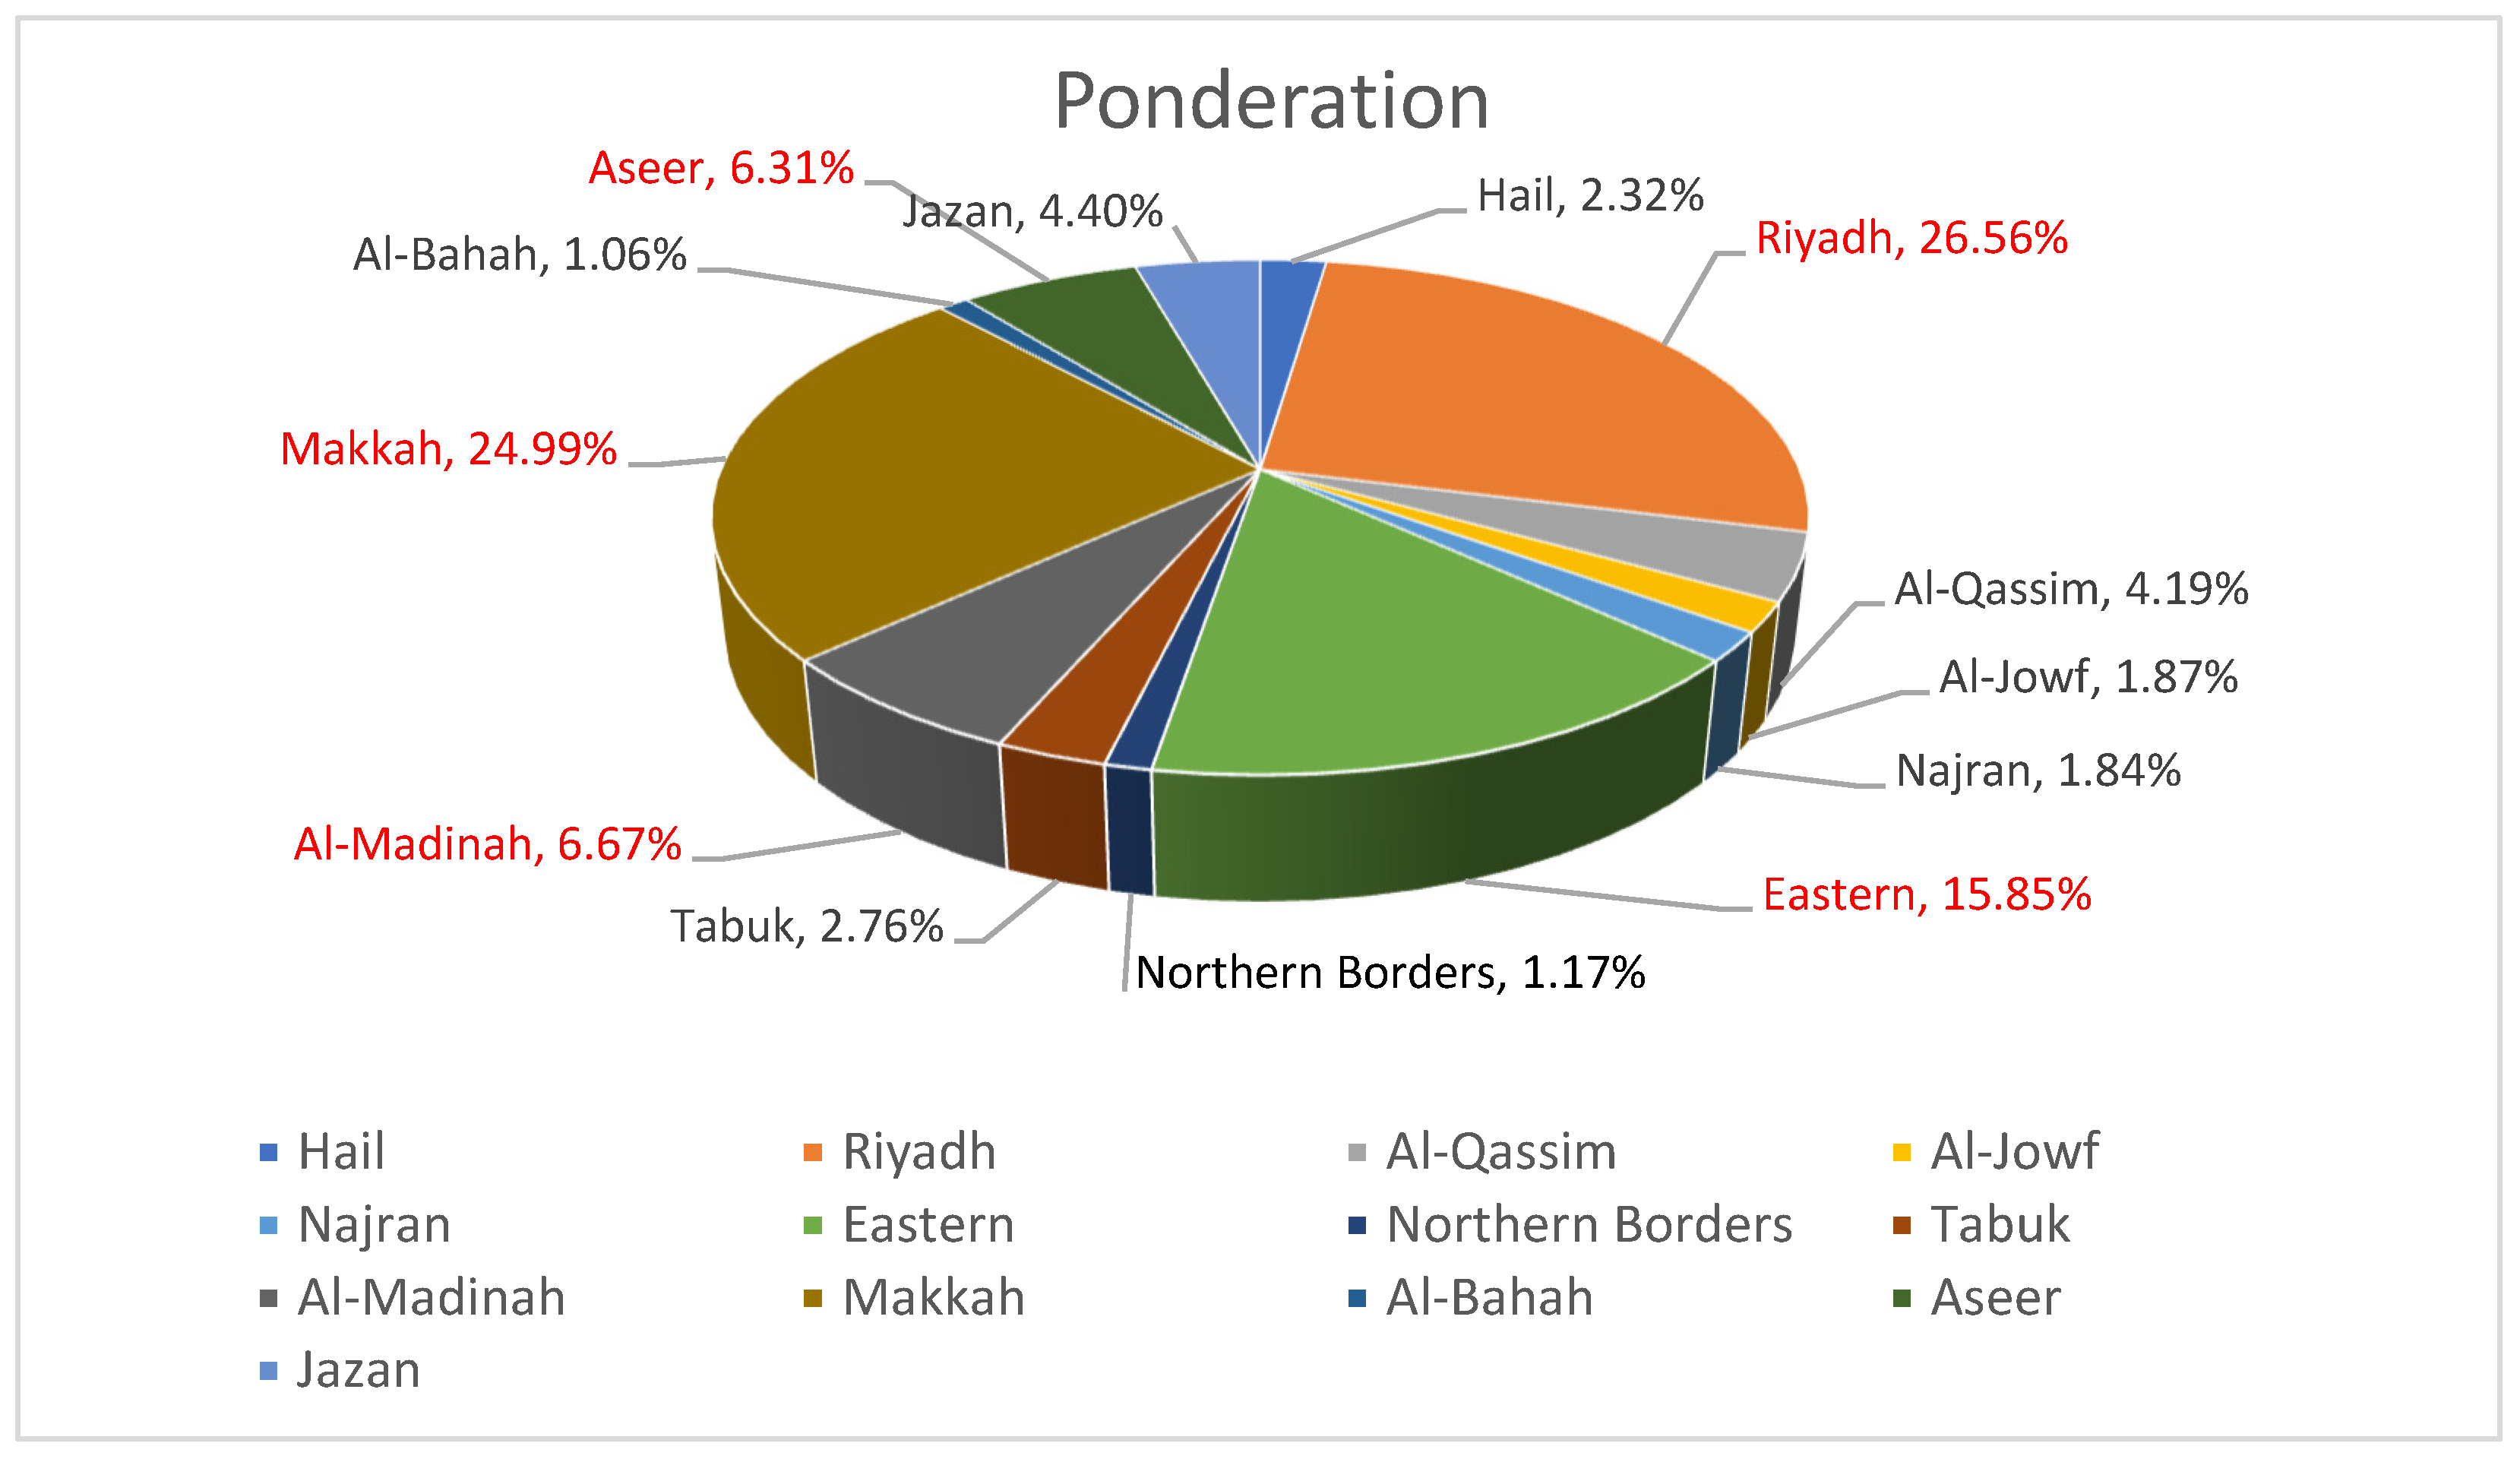
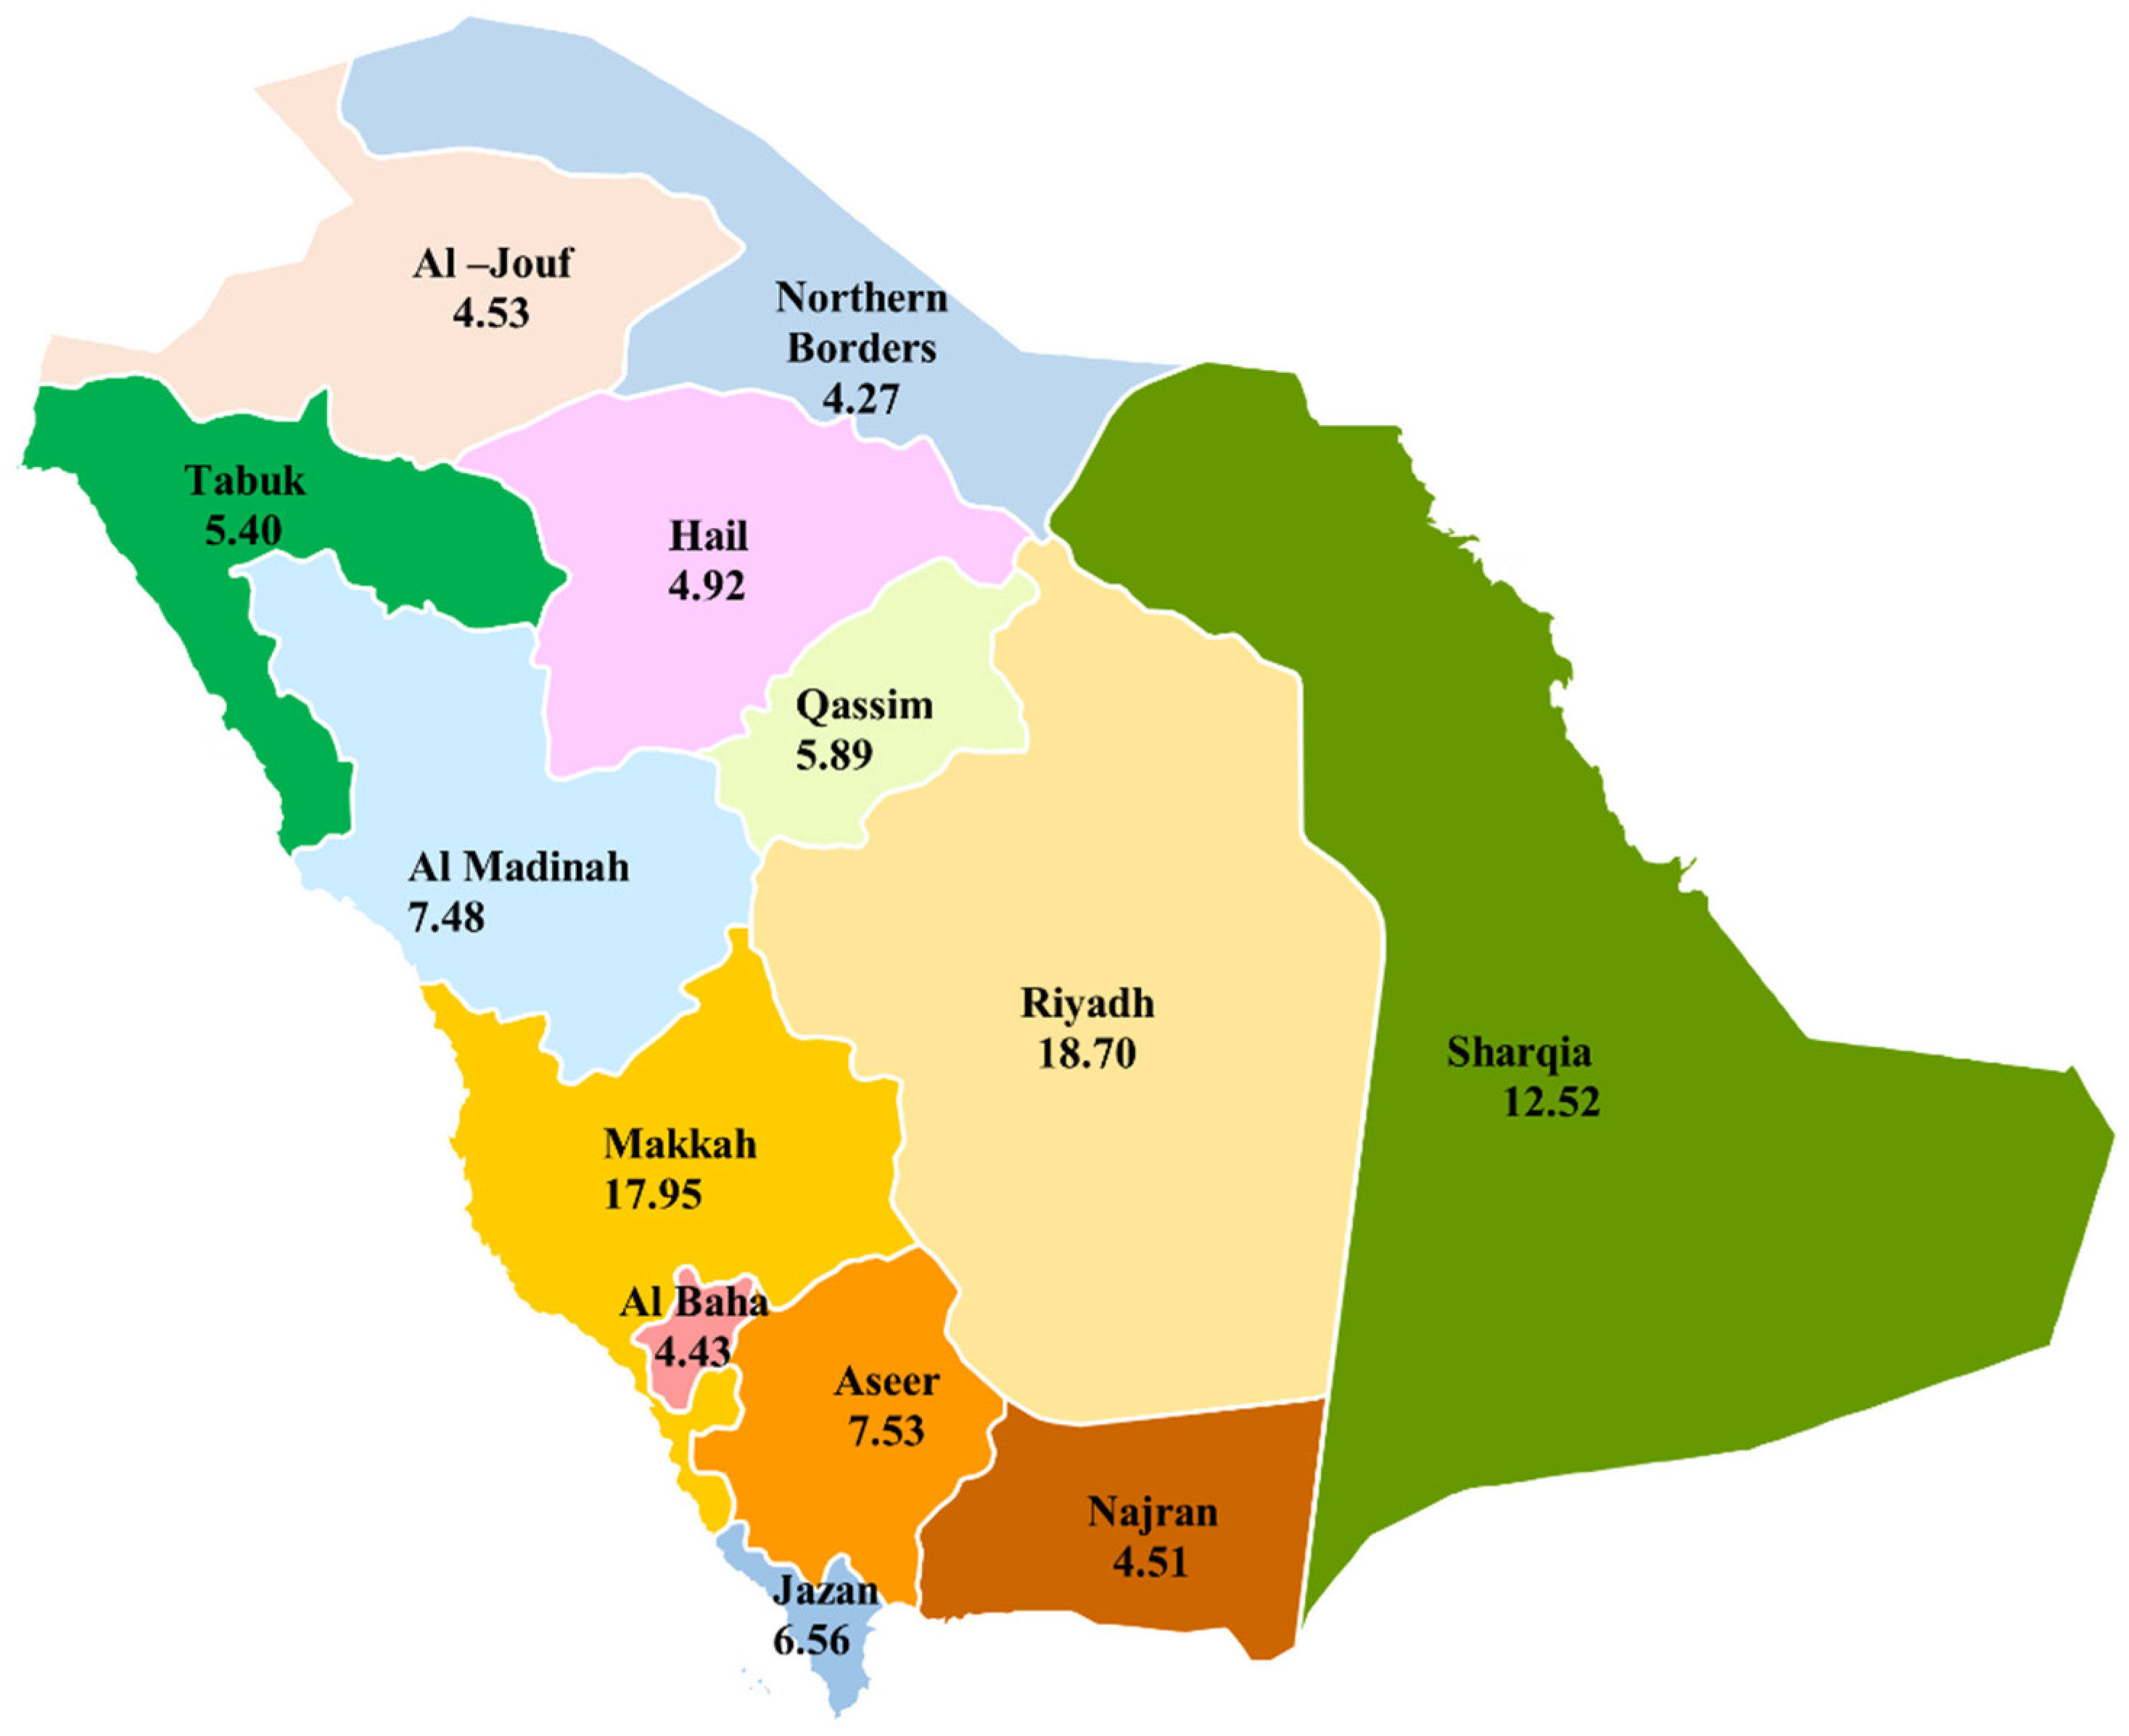
16]. The RCI offers a comprehensive and nuanced representation of the competitive landscape across all Saudi regions. The sub-national level of analysis provided by the RCI permits the evaluation of disparities in competitiveness across regions and the monitoring of performance over time at a disaggregated spatial level. In most cases, the regional level of analysis is more appropriate than examining data at the national level. The collection of data for Saudi Arabia was a challenging and complex process due to the unavailability of certain information, coupled with the fact that some indicators were present in certain regions but absent in others for all 13 provinces (Hail, Riyadh, Al-Qassim, Al-Jouf, Najran, Sharqia, Northern Borders, Tabuk, Al-Madinah, Makkah, Al-Bahah, Aseer, and Jazan). Most of the available data were global in scope, encompassing the entire country. As a result, the creation of a comprehensive competitiveness index is a challenging undertaking. Furthermore, it is challenging to identify meaningful distinctions between the various provinces of Saudi Arabia. Considering the aforementioned considerations, we have elected to implement a methodology that would allow us to differentiate between the various provinces in a meaningful and effective manner. This approach entails weighting all the indicators in question relative to the size of the province’s population, with a weighting sum of 1. It is assumed that the contribution of an indicator from one province to the total is proportional to the size of its population. This is illustrated by a comparison between Hail and Al-Madinah or Makkah. Hail has a population of only 2.3%, while Makkah has 25% (
Figure 1). Consequently, Makkah’s contribution to the competitiveness index is more proportional than that of Hail. The data presented were primarily obtained from Saudi open data sources, while additional data were drawn from the World Bank, the World Economic Forum, and other publicly accessible sources for the year 2021.
After the gathering of data, it was determined that a system of weighting should be used to index computing processes, with consideration given to the stage of development. The European Union (EU) regions are classified into five development stages based on their average gross domestic product (GDP) per capita in purchasing power standard (PPS) for the period between 2015 and 2017. The EU-28 average is set to 100, and the RCI sub-indices are weighted differently for the different development stages. In the context of this analysis, Saudi Arabia is classified as being in the fifth stage of development, according to the World Bank. This is based on a GDP adjusted by purchasing power, which is equivalent to 279 percent, representing a figure that is more than 110 percent higher than the average for the other countries included in this study.
Thus, the computing of RCI for Saudi Arabia was as follows:
Initially, the robustness of the results is tested in relation to the variable reduction method that has been utilized in the construction of the index, including the PCA technique. Indeed, the validity of the internal data consistency within each pillar is confirmed using the PCA, a multivariate exploratory technique [
42]. PCA is a particularly suitable multivariate method for the statistical summarization of data in a parsimonious way, since it is a dimensionality reduction technique designed to capture all relevant information into a small number of transformed dimensions [
43]. The utility of PCA in composite development is readily discernible. Each dimension in a composite is intended to delineate a specific aspect of the latent phenomenon to be measured (in this case, the competitiveness level). As these aspects are not directly observable, they are measured by a series of observable indicators. These indicators are, by definition, associated with the aspect they are designed to describe and, accordingly, with each other. In an ideal scenario, each dimension would exhibit a distinct PCA component that would be highly significant and account for a considerable proportion of the variability associated with the complete set of indicators.
Additionally, all indicators should contribute approximately equally and in the same direction to the most relevant component. The application of PCA serves to ascertain the internal consistency of each RCI dimension, thereby facilitating the identification of indicators that are not influential or those that describe something else or more than their intended purpose. This aligns with the findings of Hagerty and Land [
44] and Michalos [
45]. The latter asserted that “agreements and disagreements about weights assigned to objective indicators will be largely overwhelmed by the correlations among indicators and are far less frequent than expected, except in some relatively extraordinary circumstances” [
45] (p. 127). The consistency assessment within each dimension is pivotal, as greater consistency corresponds to a diminished effect of disparate weighting schemes on the ultimate index. The indicators that are ultimately incorporated are standardized by utilizing regional population-weighted with a weighting sum of 1 [
16].
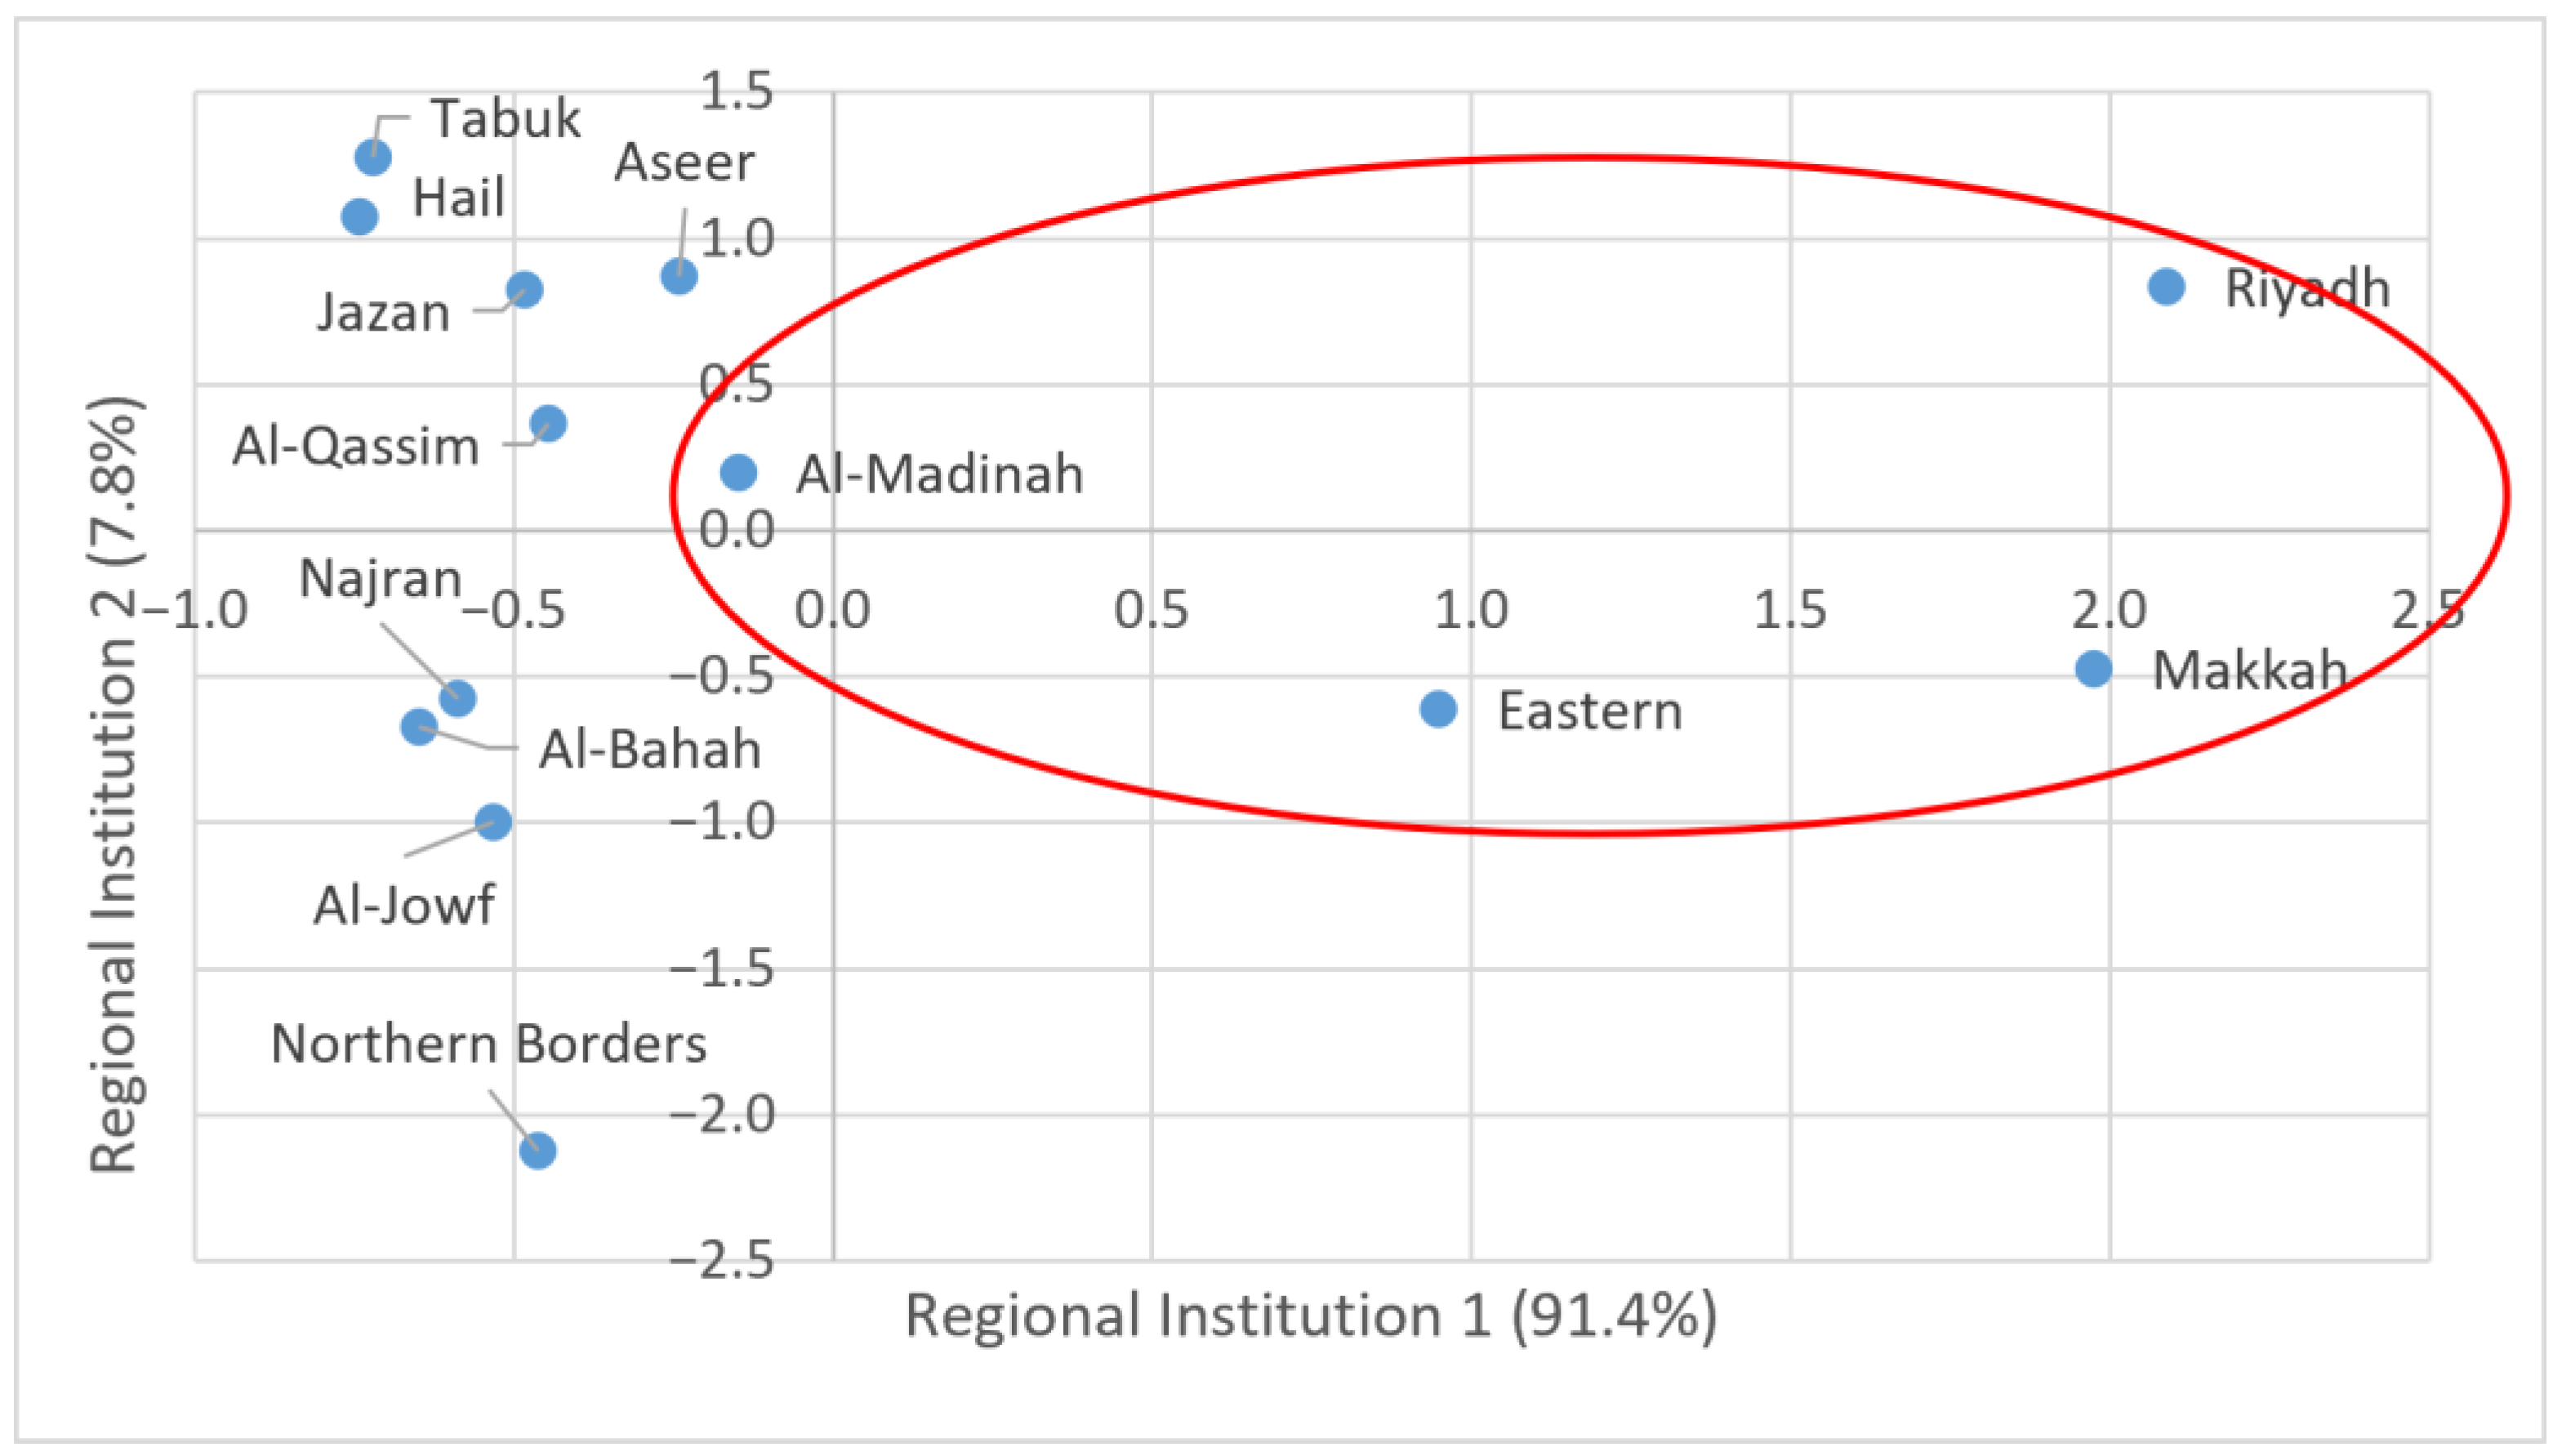
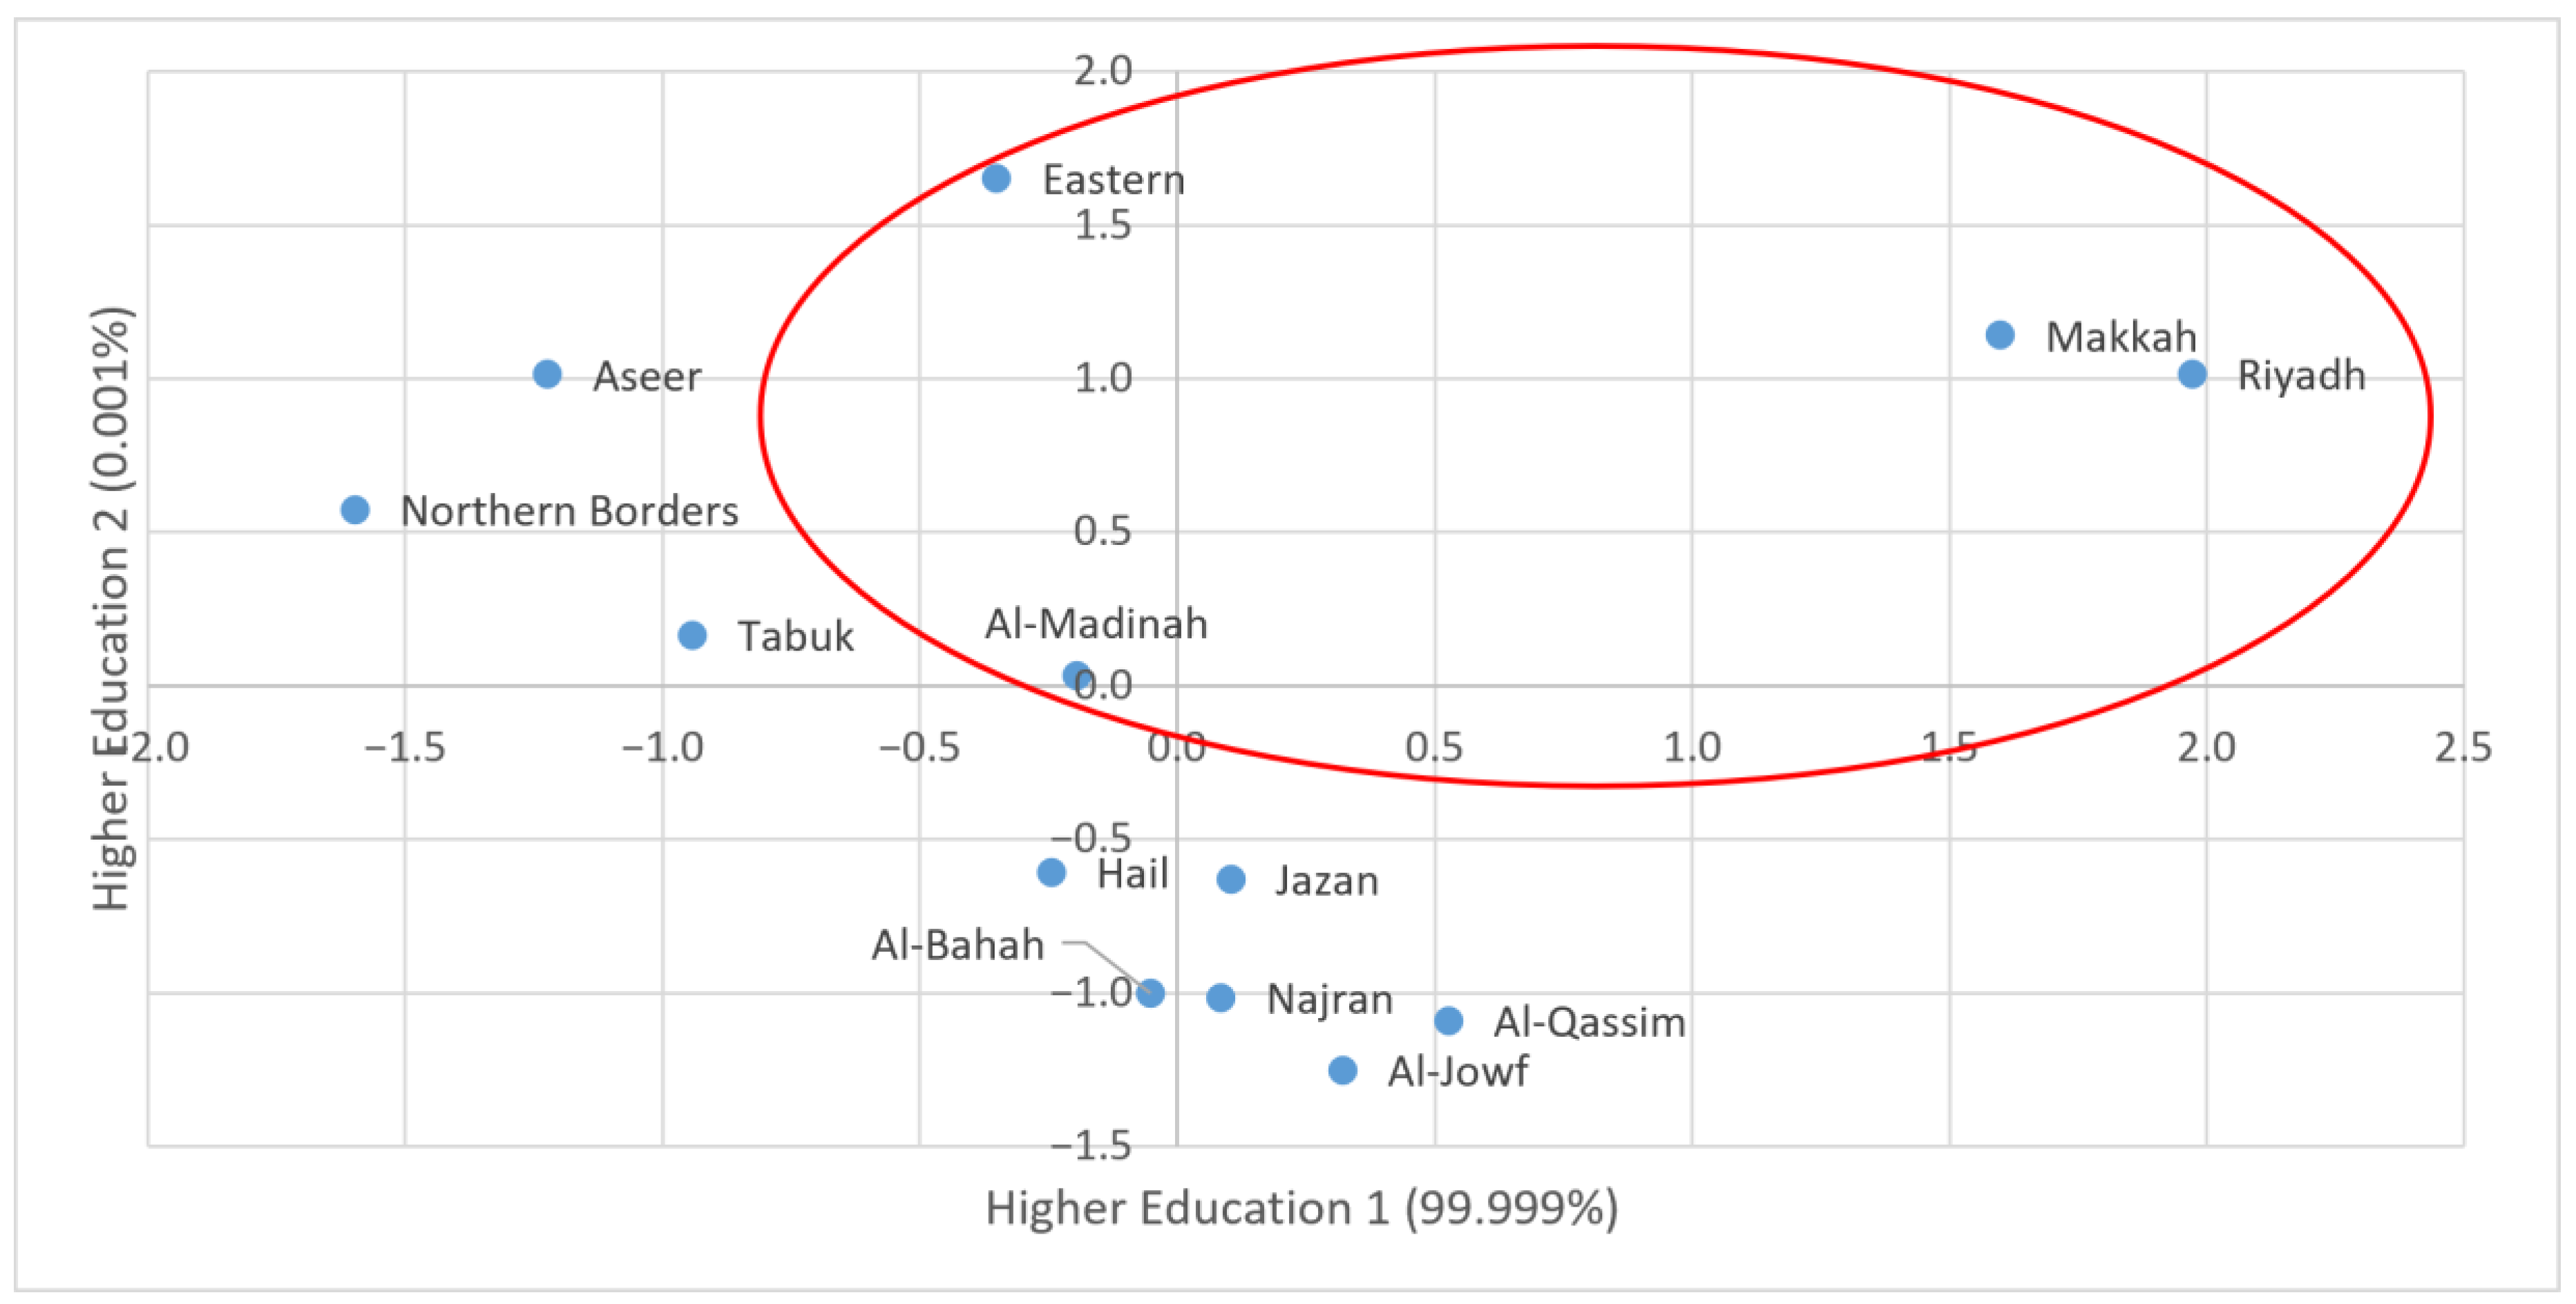
We opted to factor a set of items from the three groups, basic, efficiency, and innovation, using the PCA. This method will make it possible to project the regions onto a factorial plane called the principal plane, which recovers the maximum possible amount of information. We chose the indicators of regional institutes (12 items) as a pillar of the basic group dimension, higher education and lifelong learning (4 items) as a pillar of the efficiency group dimension, and innovation (10 items) as a pillar of the innovation group dimension.
Table 1 below shows the results of the reliability test using Cronbach’s Alpha test. The three factors were chosen to justify the choice of factor analysis. More specifically, the three variables selected generate Alpha coefficients > 0.7, which allows us to factorize the three variables using PCA.
The second step illustrates the factorial analysis.
Table 2 shows the analysis of variance explained by the first two main factors. For the three variables, the first two factors generate all the available information. For regional institutions, the first recovers 91.436%, and the second is 7.839%. For higher education and lifelong learning, the first factor represents 99.999%, and the second is 0.001%. The first innovation factor recovers 99.863%, and the second represents 0.135%.
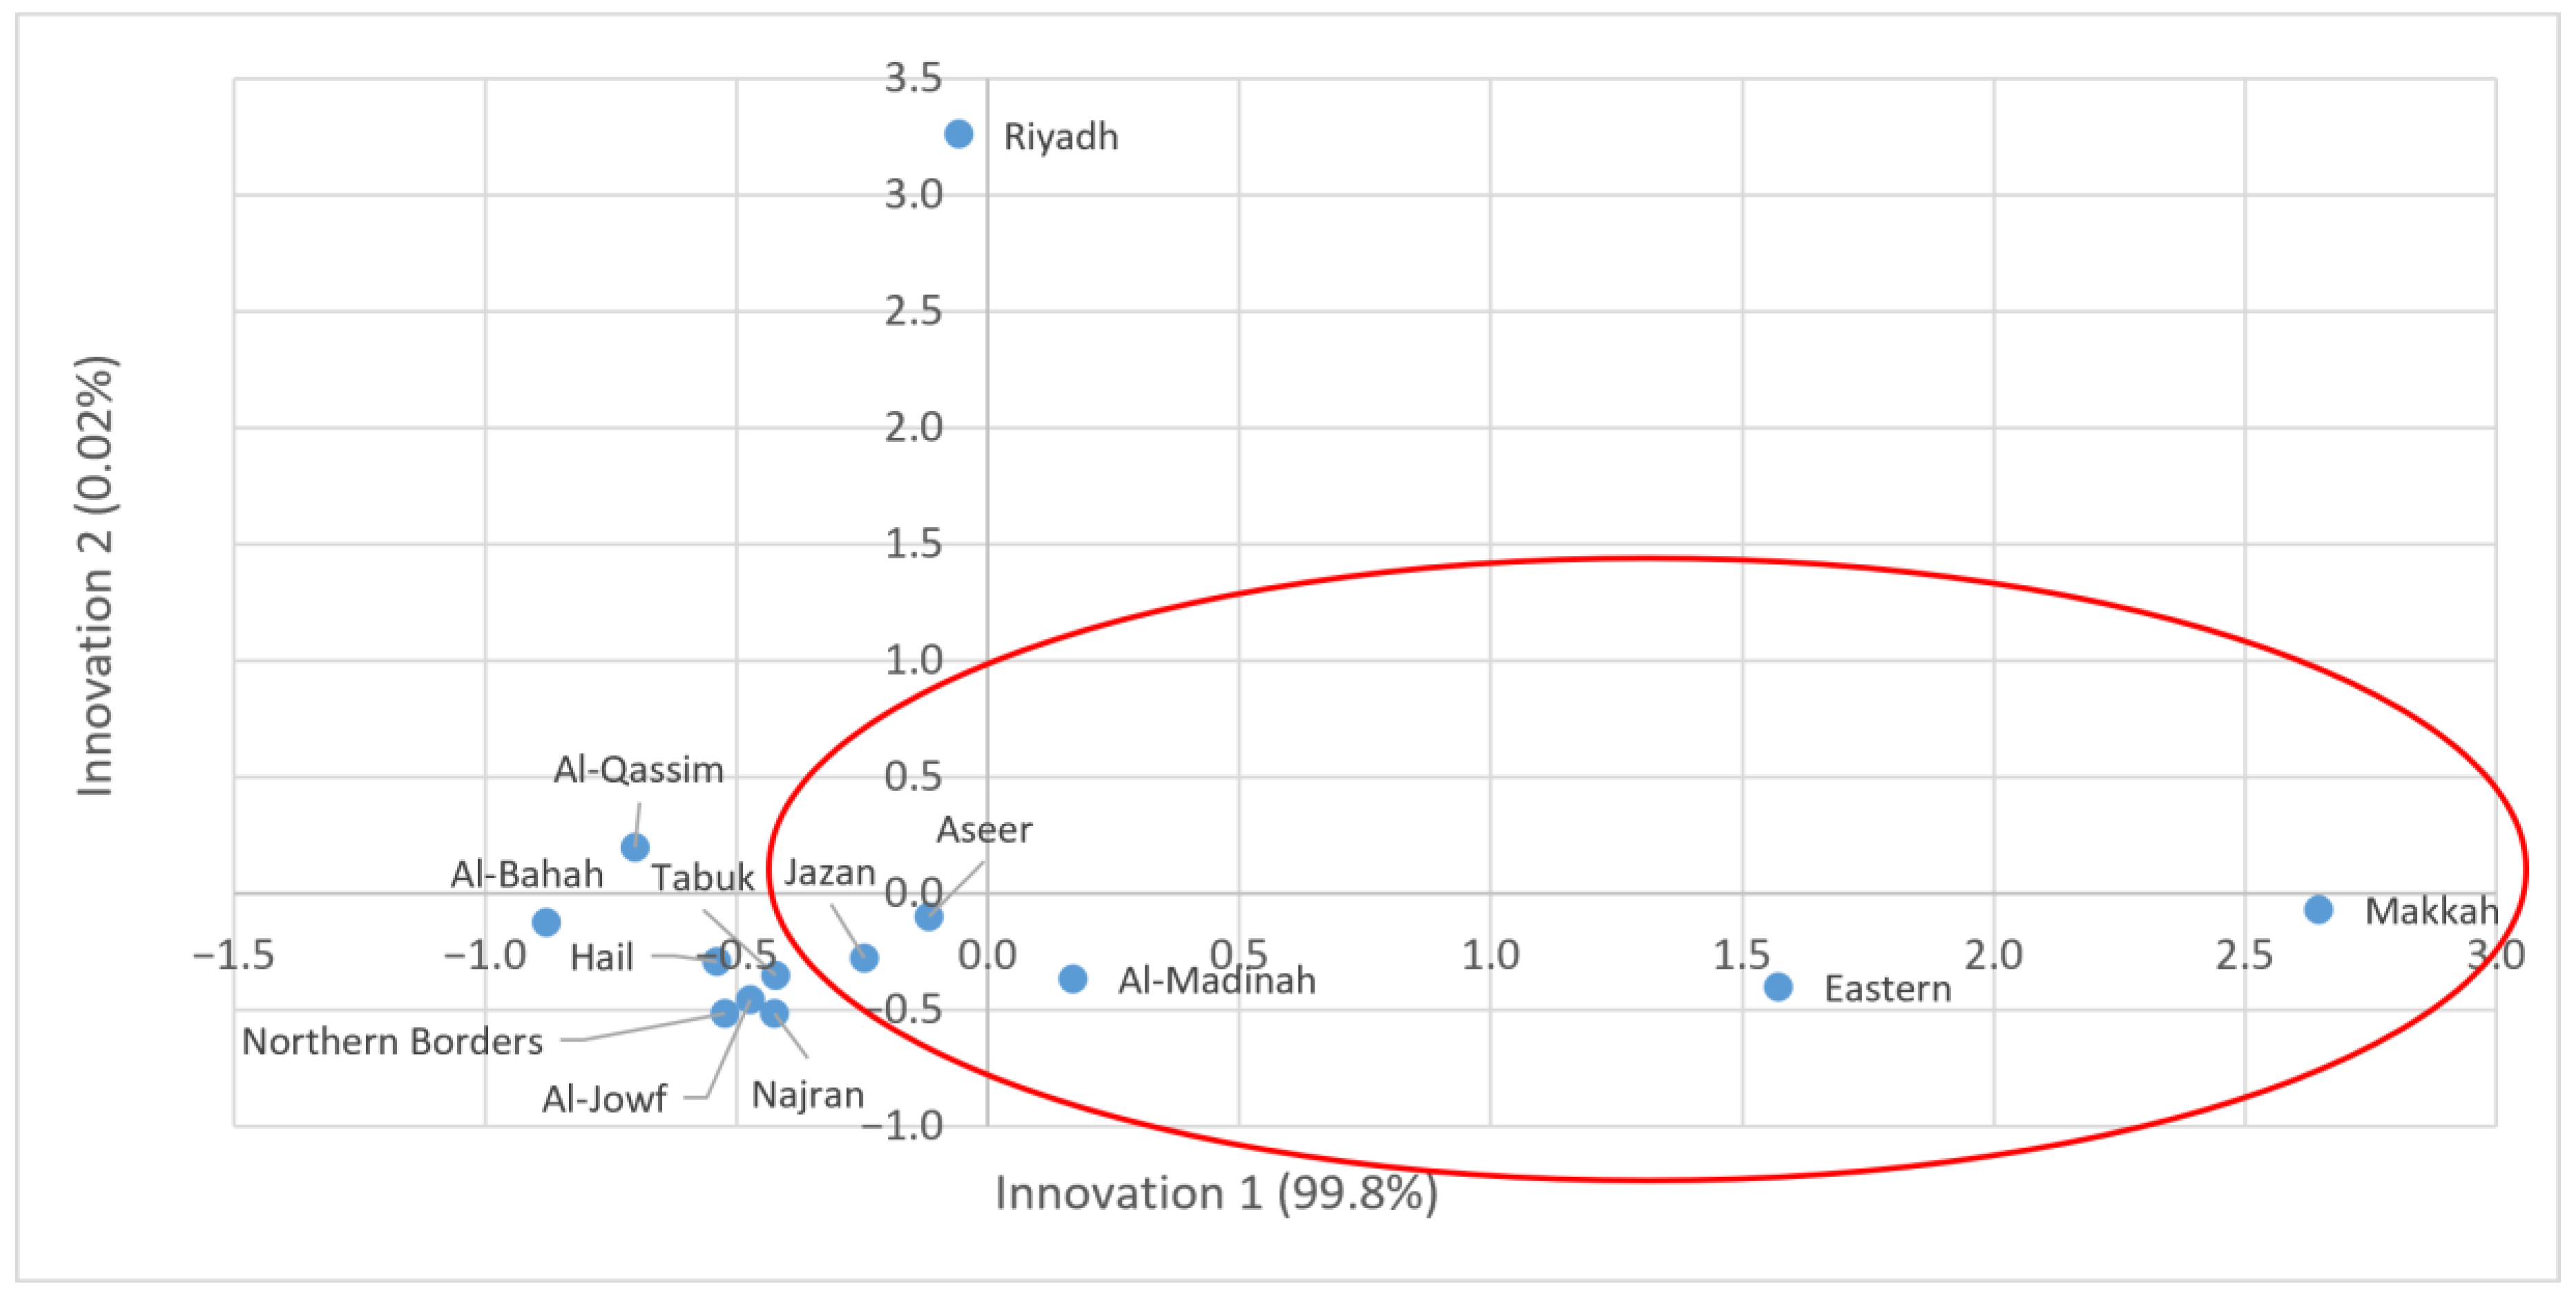
This approach aims to determine the projection of all the regions onto the first factorial plane. The following three figures (
Figure 2,
Figure 3, and
Figure 4) show that the same regions (Medina, Sharqia, Riyadh, and Makka) always occupy the same leading positions. The choice of weightings confirms the results.
4. Results and Discussion of the Hypotheses
The RCI is a conceptual framework designed to facilitate an enhanced understanding of regional competitiveness. It is evident that regions exhibit distinct strengths and weaknesses. The RCI’s clarification of regional discrepancies in competitiveness may assist in the comprehension of the social and economic conditions that underlie these discrepancies. Moreover, it offers policymakers a more comprehensive and nuanced understanding of the actual impacts of specific policy measures within a given region.
It is crucial to contemplate the following scenario: the economic and social disparities between neighboring regions have reached a point where there are substantial population movements from one region to another. Such a scenario could result in a reduction in the standard of service, both in terms of the burden on the heavily populated area and the inefficiency in the depopulated region. By acquiring an understanding of the distinctive competitive development profiles of each region, policymakers can devise policy decisions that are tailored to the specific requirements of each region.
The findings of this study demonstrate a pronounced regional dimension to territorial competitiveness across a range of regions within the KSA, a phenomenon that is not discernible when examining the data at the national level. The disparities are most evident when contrasting regions with capital cities with other regions. It can be argued that the observed disparities in regional competitiveness may have a detrimental impact on the overall national competitiveness. These disparities may provide a basis for the implementation of targeted measures by policymakers to mitigate the observed variations. Such actions have the potential to enhance national competitiveness. The following analysis presents an examination of the sub-indices, which illustrates three distinct stages of competitiveness.
4.1. Analysis of the Sub-Indices
A comprehensive examination of the RCI sub-indices derived from a combination of basic, efficiency, and innovation indicators can facilitate a more nuanced understanding of regional competitiveness. Such an analysis can elucidate the underlying causes of a region’s relative competitiveness and identify the specific dimensions that contribute to its strengths.
4.1.1. The Basic Sub-Index
This section of the study is primarily concerned with the variable designated as the “basic sub-index”. This fundamental sub-index is constituted by an aggregated score derived from the evaluation of several variables, including regional institutional quality, macroeconomic stability, infrastructure, health, and basic education. These elements are regarded as indispensable prerequisites for the establishment of fundamental economic functions. These encompass a range of factors, including the presence of a low-skilled labor force, the quality of infrastructure, the efficacy of governance, and the state of public health. Collectively, these factors exert significant influences on economic and social outcomes.
To describe the relationships between the variables, we will present the data in a statistical format. Firstly, the primary descriptive statistics of the various variables presented in
Table 3 are interpreted.
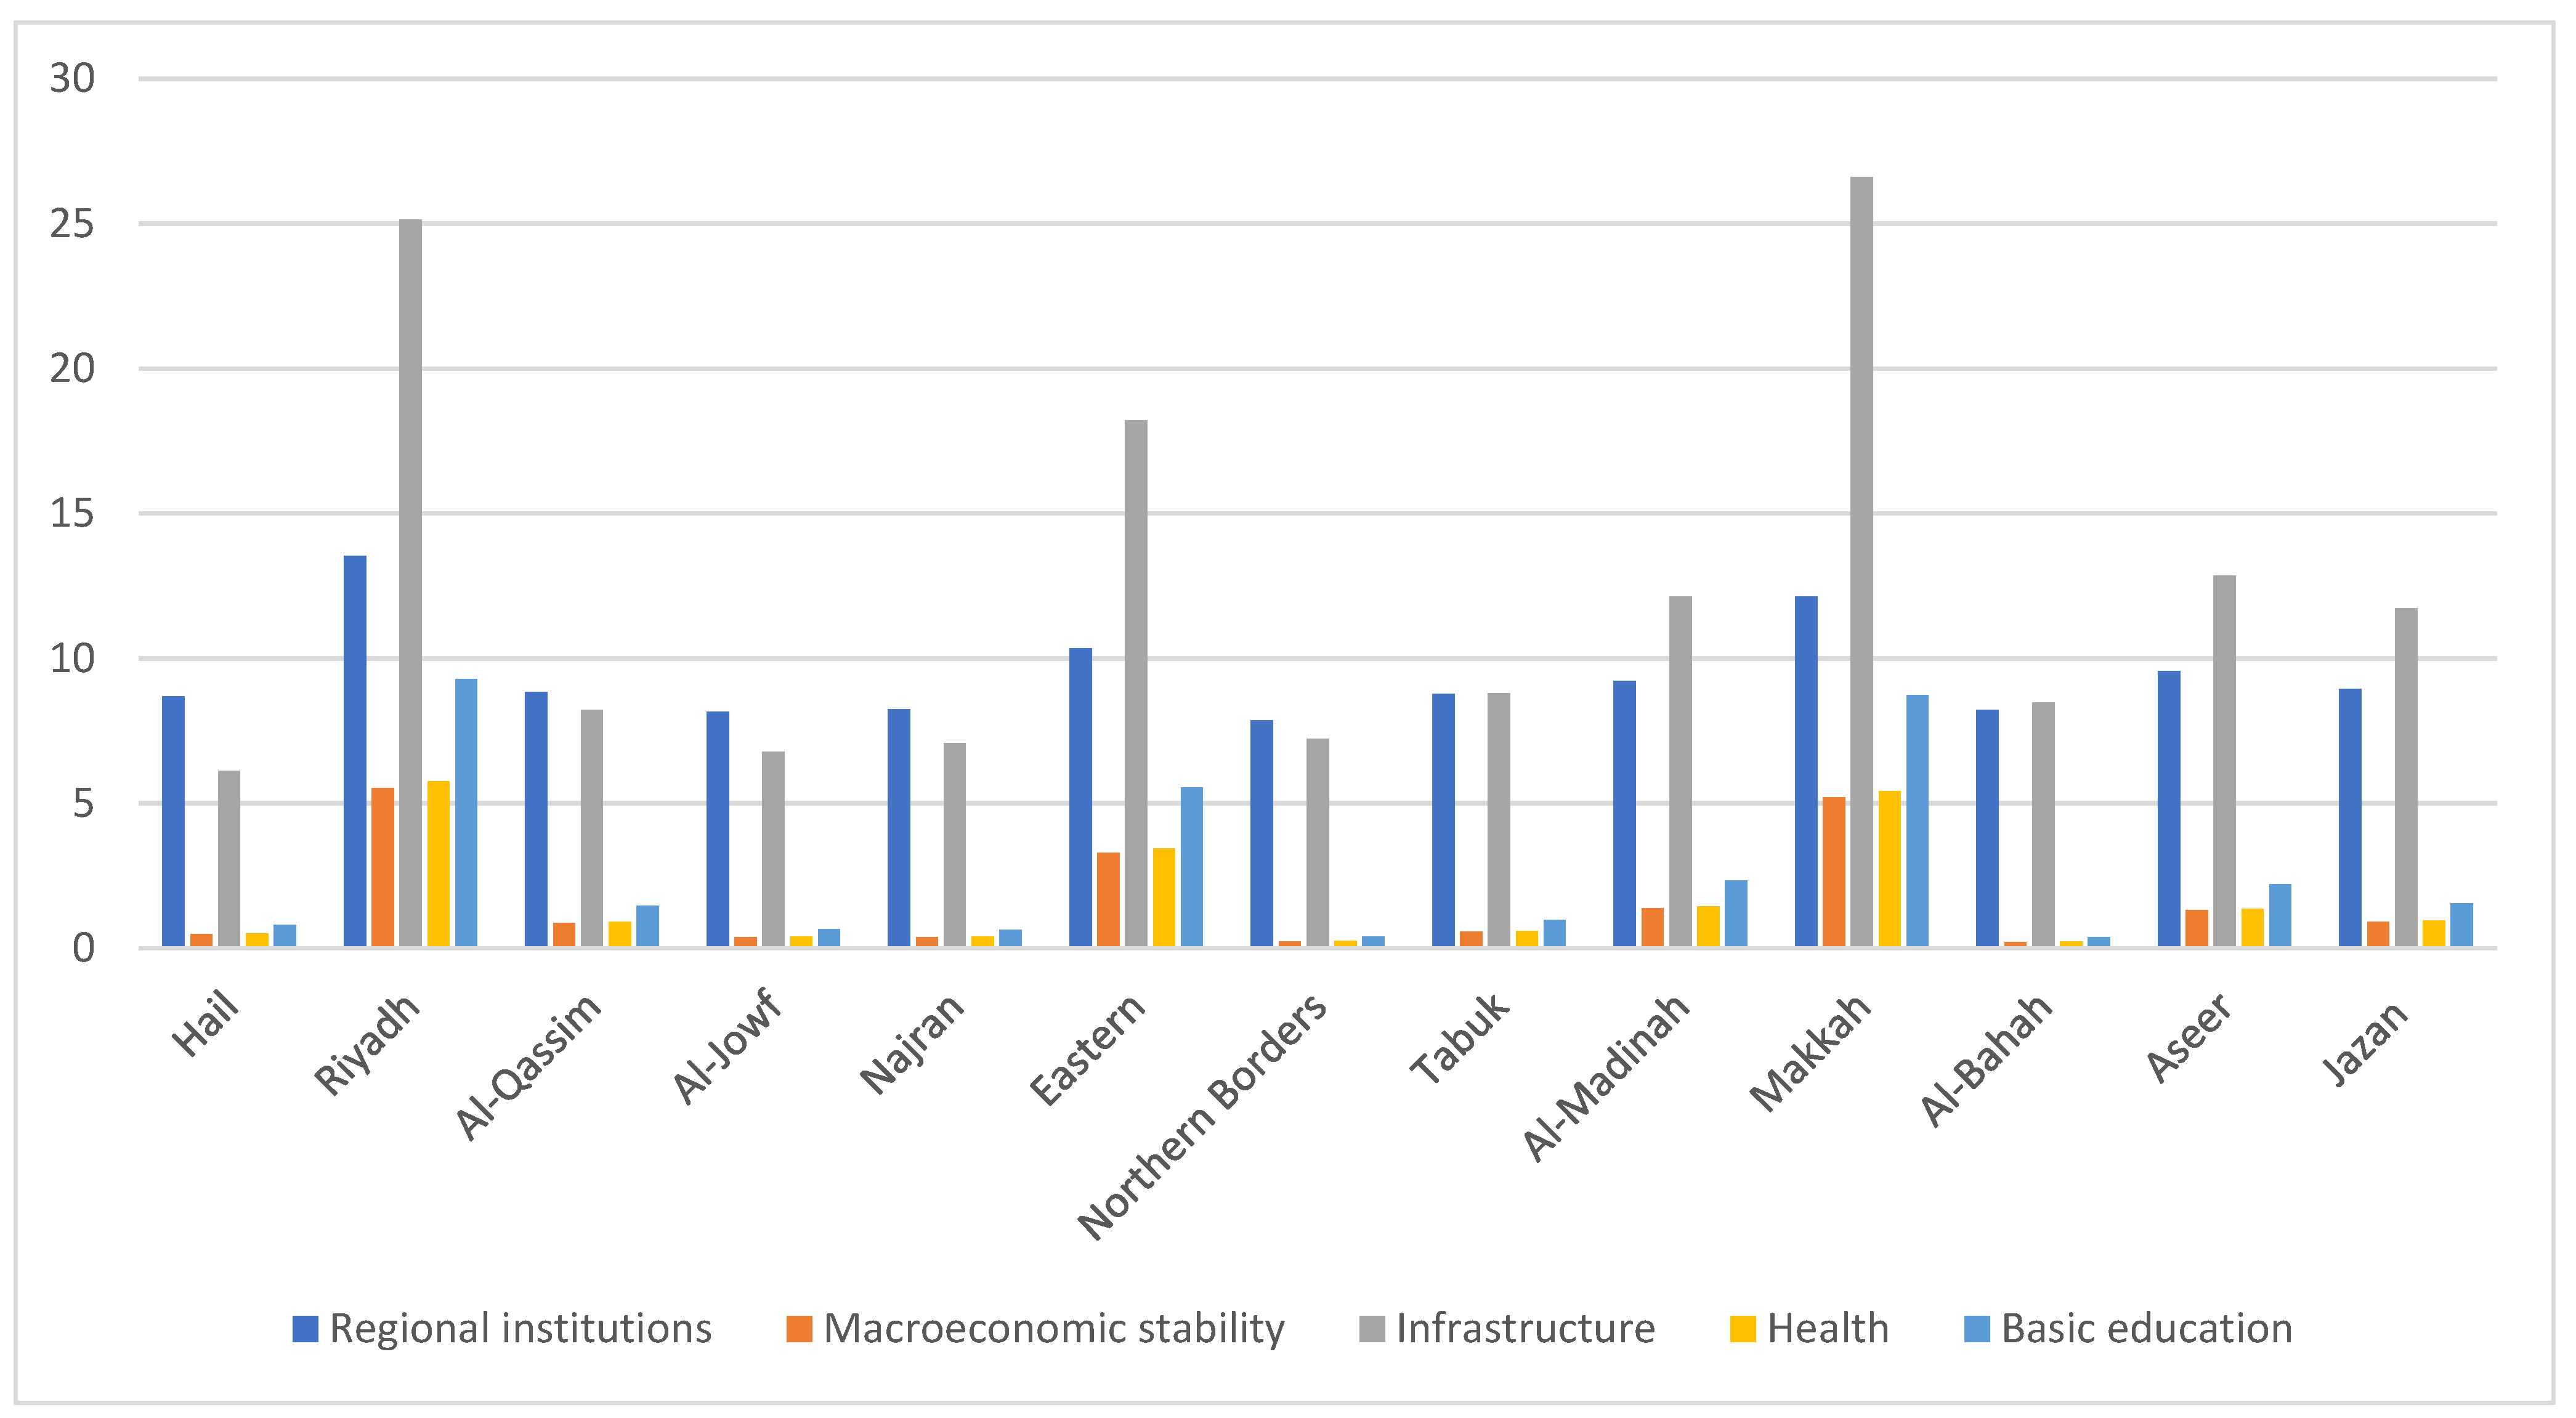
Regarding the initial variable of the basic sub-index, namely, regional institutions, the series exhibits a mean of 9.429, with a standard deviation of 1.674. The variable is constrained between a minimum value of 7.867 observed in Northern Borders and a maximum value of 13.542 observed in Riyadh. In comparison to the other regions, the Hail region exhibits a comparatively low value of 8.699, which is lower than the average but closely aligned with the values observed in Al-Quassim (8.835), Jazan (8.948), and Al-Madinah (9.224). Riyadh has the highest value, accounting for approximately 40% of the Kingdom’s manufacturing sector. This region plays host to over 3500 factories and eight industrial cities, representing the largest concentration of such facilities in the Kingdom. Regarding the first sub-hypothesis H1.1, the results demonstrate that regions with better strong local institutions will score higher on the RCI, contributing significantly to their regional competitiveness. This finding is consistent with the results of previous studies, including those conducted by [
4,
38,
46,
47], which confirmed that the development of a region is significantly influenced by the efficiency of public institutions.
The second variable under examination is macroeconomic stability, which displays an overall mean of 1.602 and a low standard deviation of 1.858. The variable is constrained between a minimum of 0.222 (Al-Bahah) and a maximum of 5.530 (Riyadh). In consideration of the Hail region, the value is 0.484, which is comparatively modest in comparison to other regions, particularly Makkah (5.203) and Riyadh (5.530). This finding serves to corroborate the sub-hypothesis H1.2. This finding lends support to the studies of [
48,
49], which confirmed that regions with higher macroeconomic stability contribute significantly to their regional competitiveness.
The third variable pertains to the infrastructure. The overall mean for this variable is 12.264, with a standard deviation of 6.892. The variable is constrained between the values of 6.125 (Hail) and 26.598 (Makkah). This outcome may be attributed to the robust network of passengers in these regions, in addition to the international airports that offer flights and the extensive maritime network, with the largest hubs situated in Makkah and Sharqia. This outcome is consistent with the sub-hypothesis H1.3, which posits that regions with better infrastructure will exhibit higher RCI scores, thereby enhancing their regional competitiveness. This finding aligns with the results of previous studies, including those by [
38,
47,
50], which have confirmed the positive impact of a strong infrastructure on regional development and competitiveness.
With regard to the variable representing health, the mean value for this series is 1.669, with a standard deviation of 1.936. The variable is constrained between a minimum of 0.231 (Al-Bahah) and a maximum of 5.761 (Riyadh). In consideration of the Hail region, the value is 0.504, which is comparatively less than that observed in the Aseer (1.370), Jazan (0.955), and Tabuk (0.600) regions. The results substantiate sub-hypothesis H1.4, which posits that regions with higher levels of public health and well-being will exhibit higher scores on the RCI. This finding is consistent with the results of the studies [
36,
38,
51], which demonstrated a positive correlation between public health factors and a country’s level of competitiveness.
The final variable encompasses the domain of basic education, which exhibits an overall mean of 2.692 and a relatively low standard deviation of 3.123. The variable is constrained between a minimum of 0.373 (Al-Bahah) and a maximum of 9.295 (Riyadh). The value for the region of Hail is 0.813, which is marginal when compared to the values observed in Al-Qassim (1.466), Aseer (2.210), and Al-Madinah (2.334). Nevertheless, it is higher than the values observed in Al-Jouf (0.654), Najran (0.645), and Northern Borders (0.409), as well as Al-Bahah (0.373), thereby confirming sub-hypothesis H1.5 (Basic education positively correlates with regional competitiveness in Saudi Arabia). This finding is consistent with the conclusions of previous studies, such as those conducted by the authors of [
5,
52], which confirm that primary education is a key factor influencing economic competitiveness, particularly in terms of human capital development.
Figure 5 demonstrates that the five sub-variables under examination exhibit a striking lack of stability throughout the study period. This is accompanied by a series of notable shifts in the trends, particularly in the two regions of Riyadh and Makkah, as well as notable divergences from the trends observed in other regions. The infrastructure variable demonstrates the most substantial values in comparison to the other variables.
4.1.2. The Efficiency Sub-Index
The objective of this section is to investigate the variable designated the “efficiency sub-index”. Regional economic competitiveness may be contingent on several factors, including the development of a more highly skilled workforce and a more efficient labor market. The latter is a subject of interest and thus falls under the efficiency measures category. This category comprises a set of indicators pertaining to the following dimensions: higher education and lifelong learning, labor market efficiency, and market size. The primary descriptive statistics of the various variables presented in
Table 4 are interpreted.
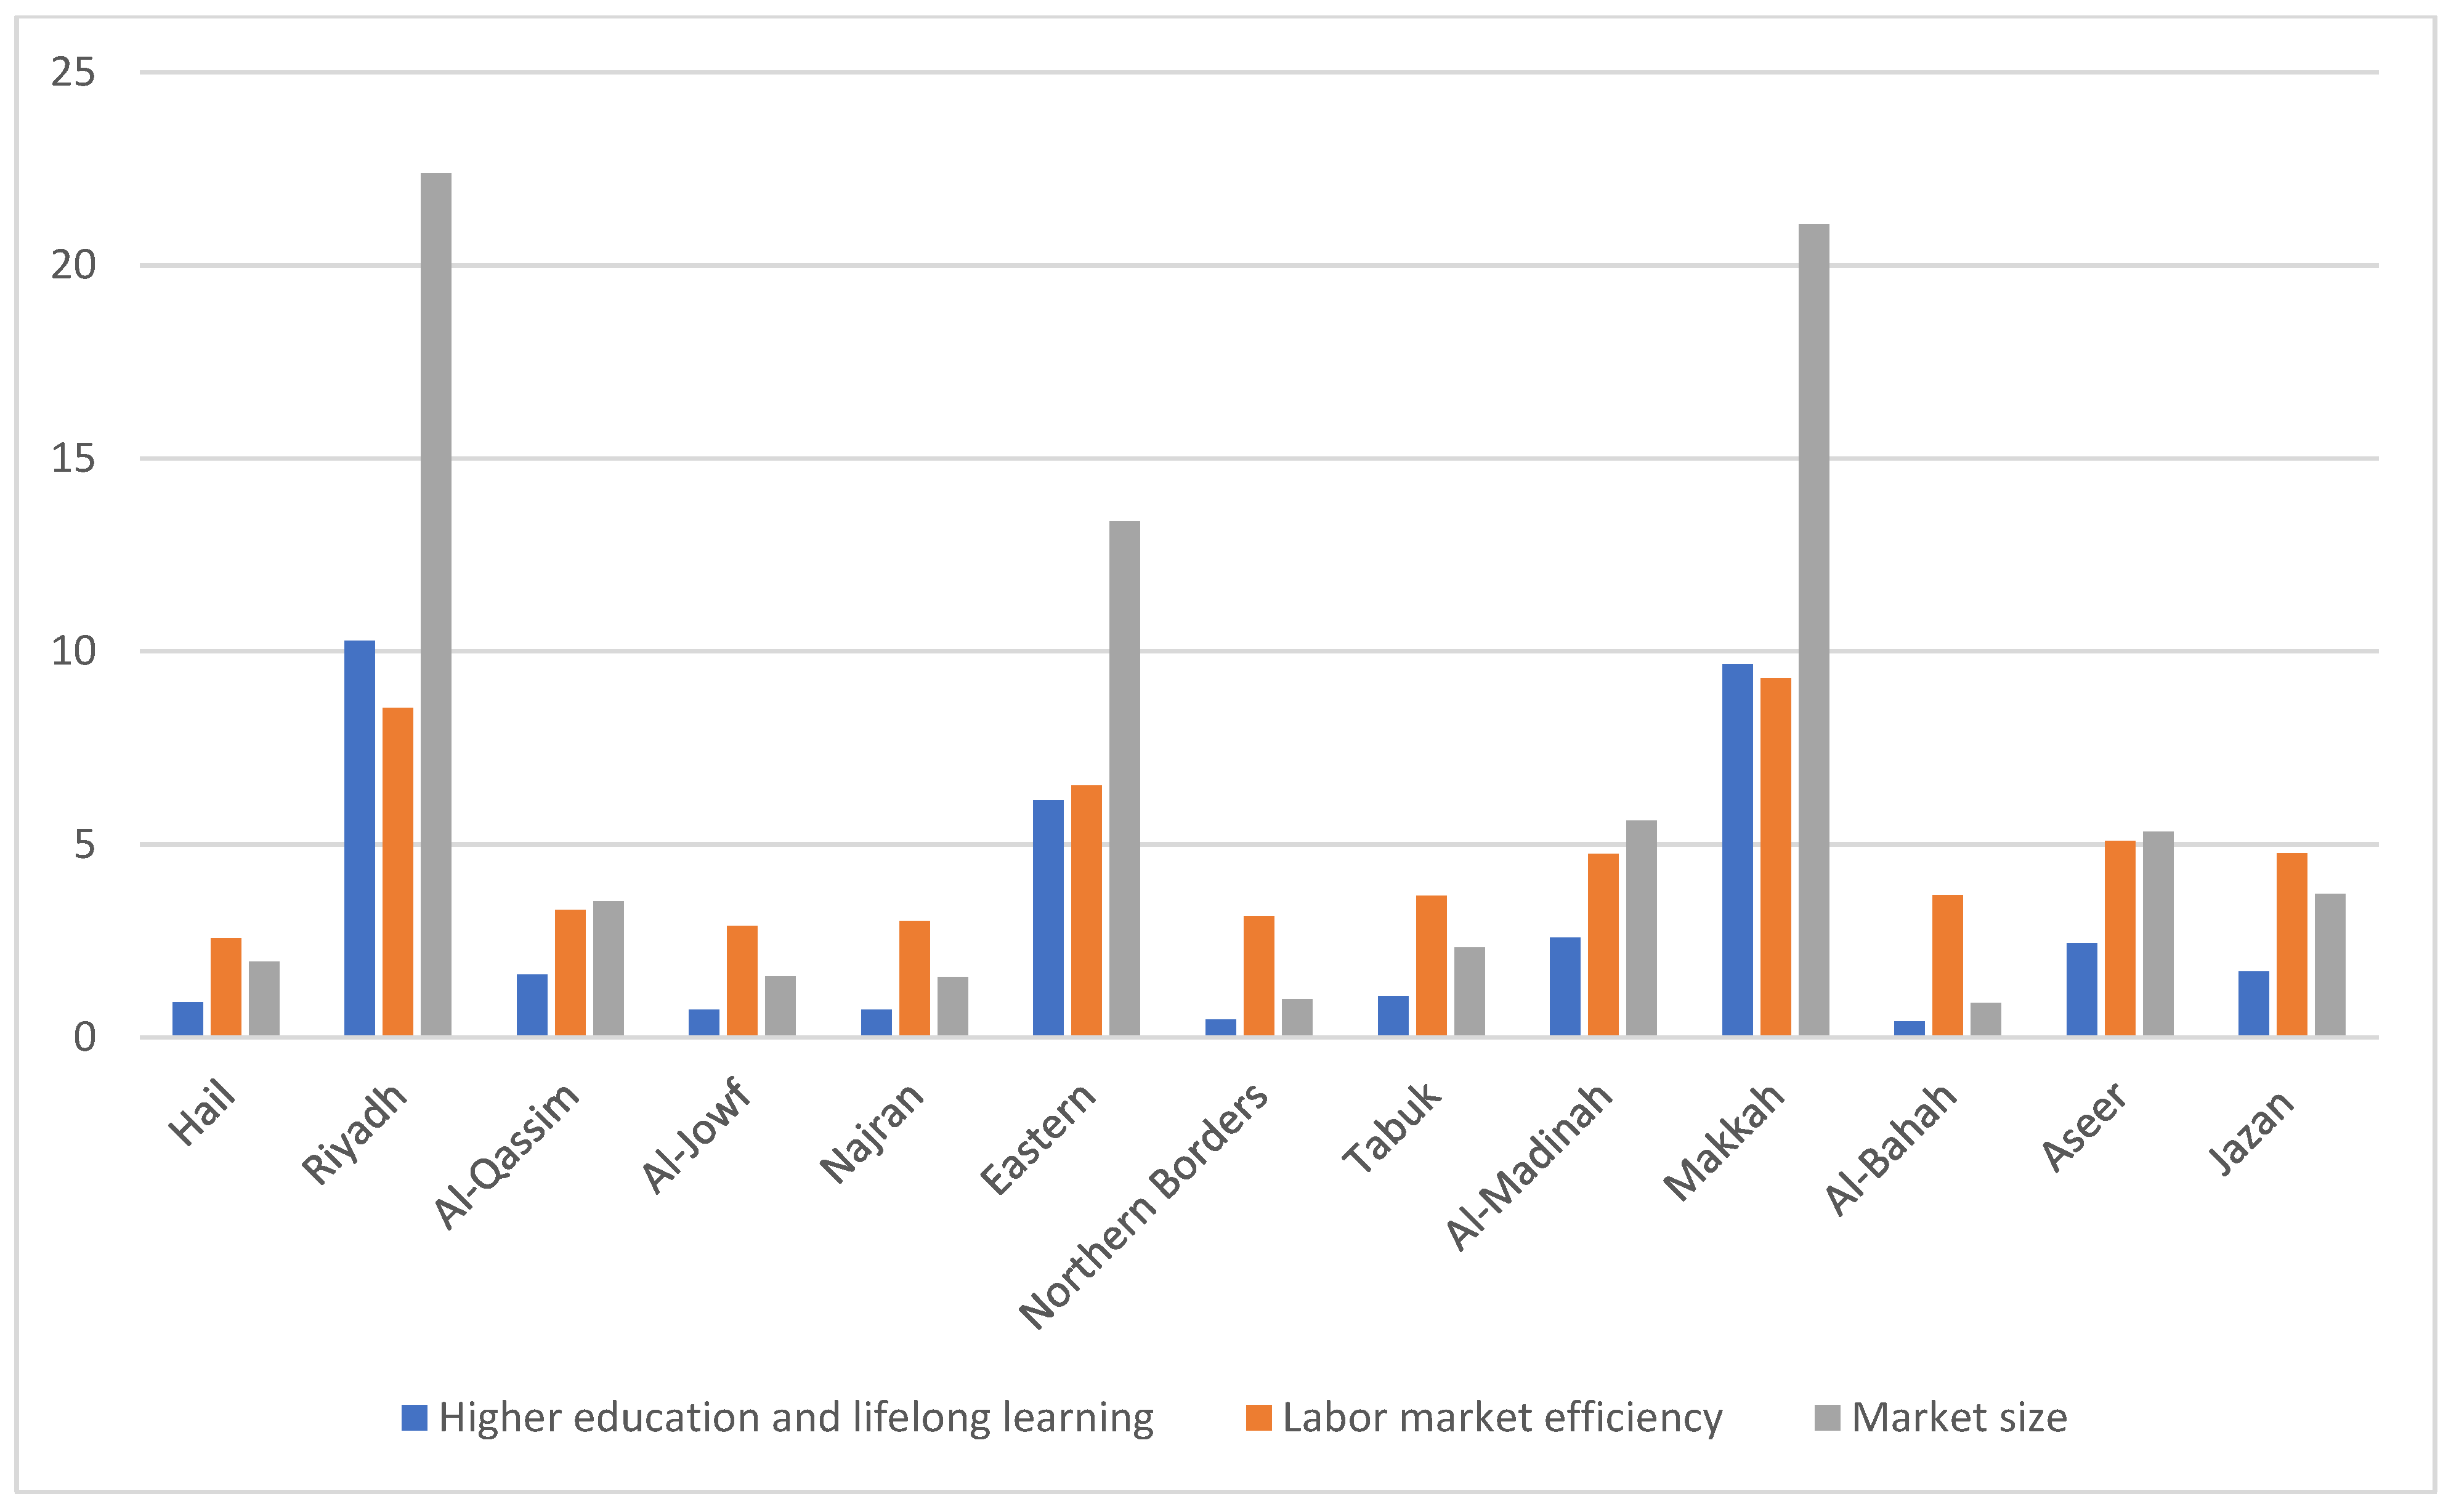
With regard to the initial variable, namely, higher education and lifelong learning, the series exhibits an overall mean of 2.978, with a standard deviation of 3.455. The variable is constrained between a minimum of 0.412 (Al-Bahah) and a maximum of 10.283 (Riyadh). The competitiveness gaps between the capital regions of Riyadh and Makkah, with respective values of 10.283 and 9.675, and the second most competitive region, Al-Madinah (2.583), are frequently considerable. The Hail region exhibits a value of 0.900, which signifies a mean performance in comparison to other regions. The results substantiate sub-hypothesis H2.1. It can be reasonably deduced that regions that exhibit higher levels of educational attainment and a skilled labor force will score higher on the RCI. This finding is consistent with the studies [
32,
37,
38,
53], which underscore the role of higher education as a catalyst for regional competitiveness.
The second index, elaborated on in the efficiency sub-index, is labor market efficiency. The series demonstrates an overall mean of 4.710 and a standard deviation of 2.174. The variable is constrained between a minimum of 2.560 (Hail region) and a maximum of 9.304 (Makkah region), which aligns with sub-hypothesis H2.2 (Regions with more efficient labor markets, characterized by low unemployment rates and high levels of workforce participation, will exhibit greater regional competitiveness). This finding is consistent with the findings of previous studies, namely, [
36,
54], which confirmed the significant impact of human capital on regional competitiveness.
The final variable under consideration is market size, which exhibits an overall mean of 6.484 and a low standard deviation of 7.521. The variable is constrained to a range between 0.898 (Al-Bahah) and 22.384 (Riyadh). Regarding the Hail region, the value in question is 1.959, which is low compared to the other regions. The findings lend empirical support to sub-hypothesis H2.3, indicating that regions exhibiting elevated levels of competitiveness are associated with larger market sizes. This observation is corroborated by the findings of prior studies referenced in [
33,
39,
54].
As illustrated in
Figure 6, the three sub-variables under examination demonstrate a notable absence of stability throughout the study period. These shifts in trends are particularly noteworthy in the two regions of Riyadh and Makkah. Furthermore, a clear divergence from the observed trends in other regions is evident. The variable “market size” is of particular significance when considered in comparison to the other variables. In comparison to the remaining regions, the value observed in Hail is relatively low.
4.1.3. Global Descriptive Analyses of the “Innovation Sub-Index”
The final sub-index of RCI dimensions comprises indicators pertaining to the degree of technological innovation exhibited by both enterprises and households, as well as the level of business sophistication and innovation. To elucidate the interrelationships between these variables, the following subsections present them statistically accurately. This section presents a comprehensive interpretation of the primary descriptive statistics associated with the variables presented in
Table 5.
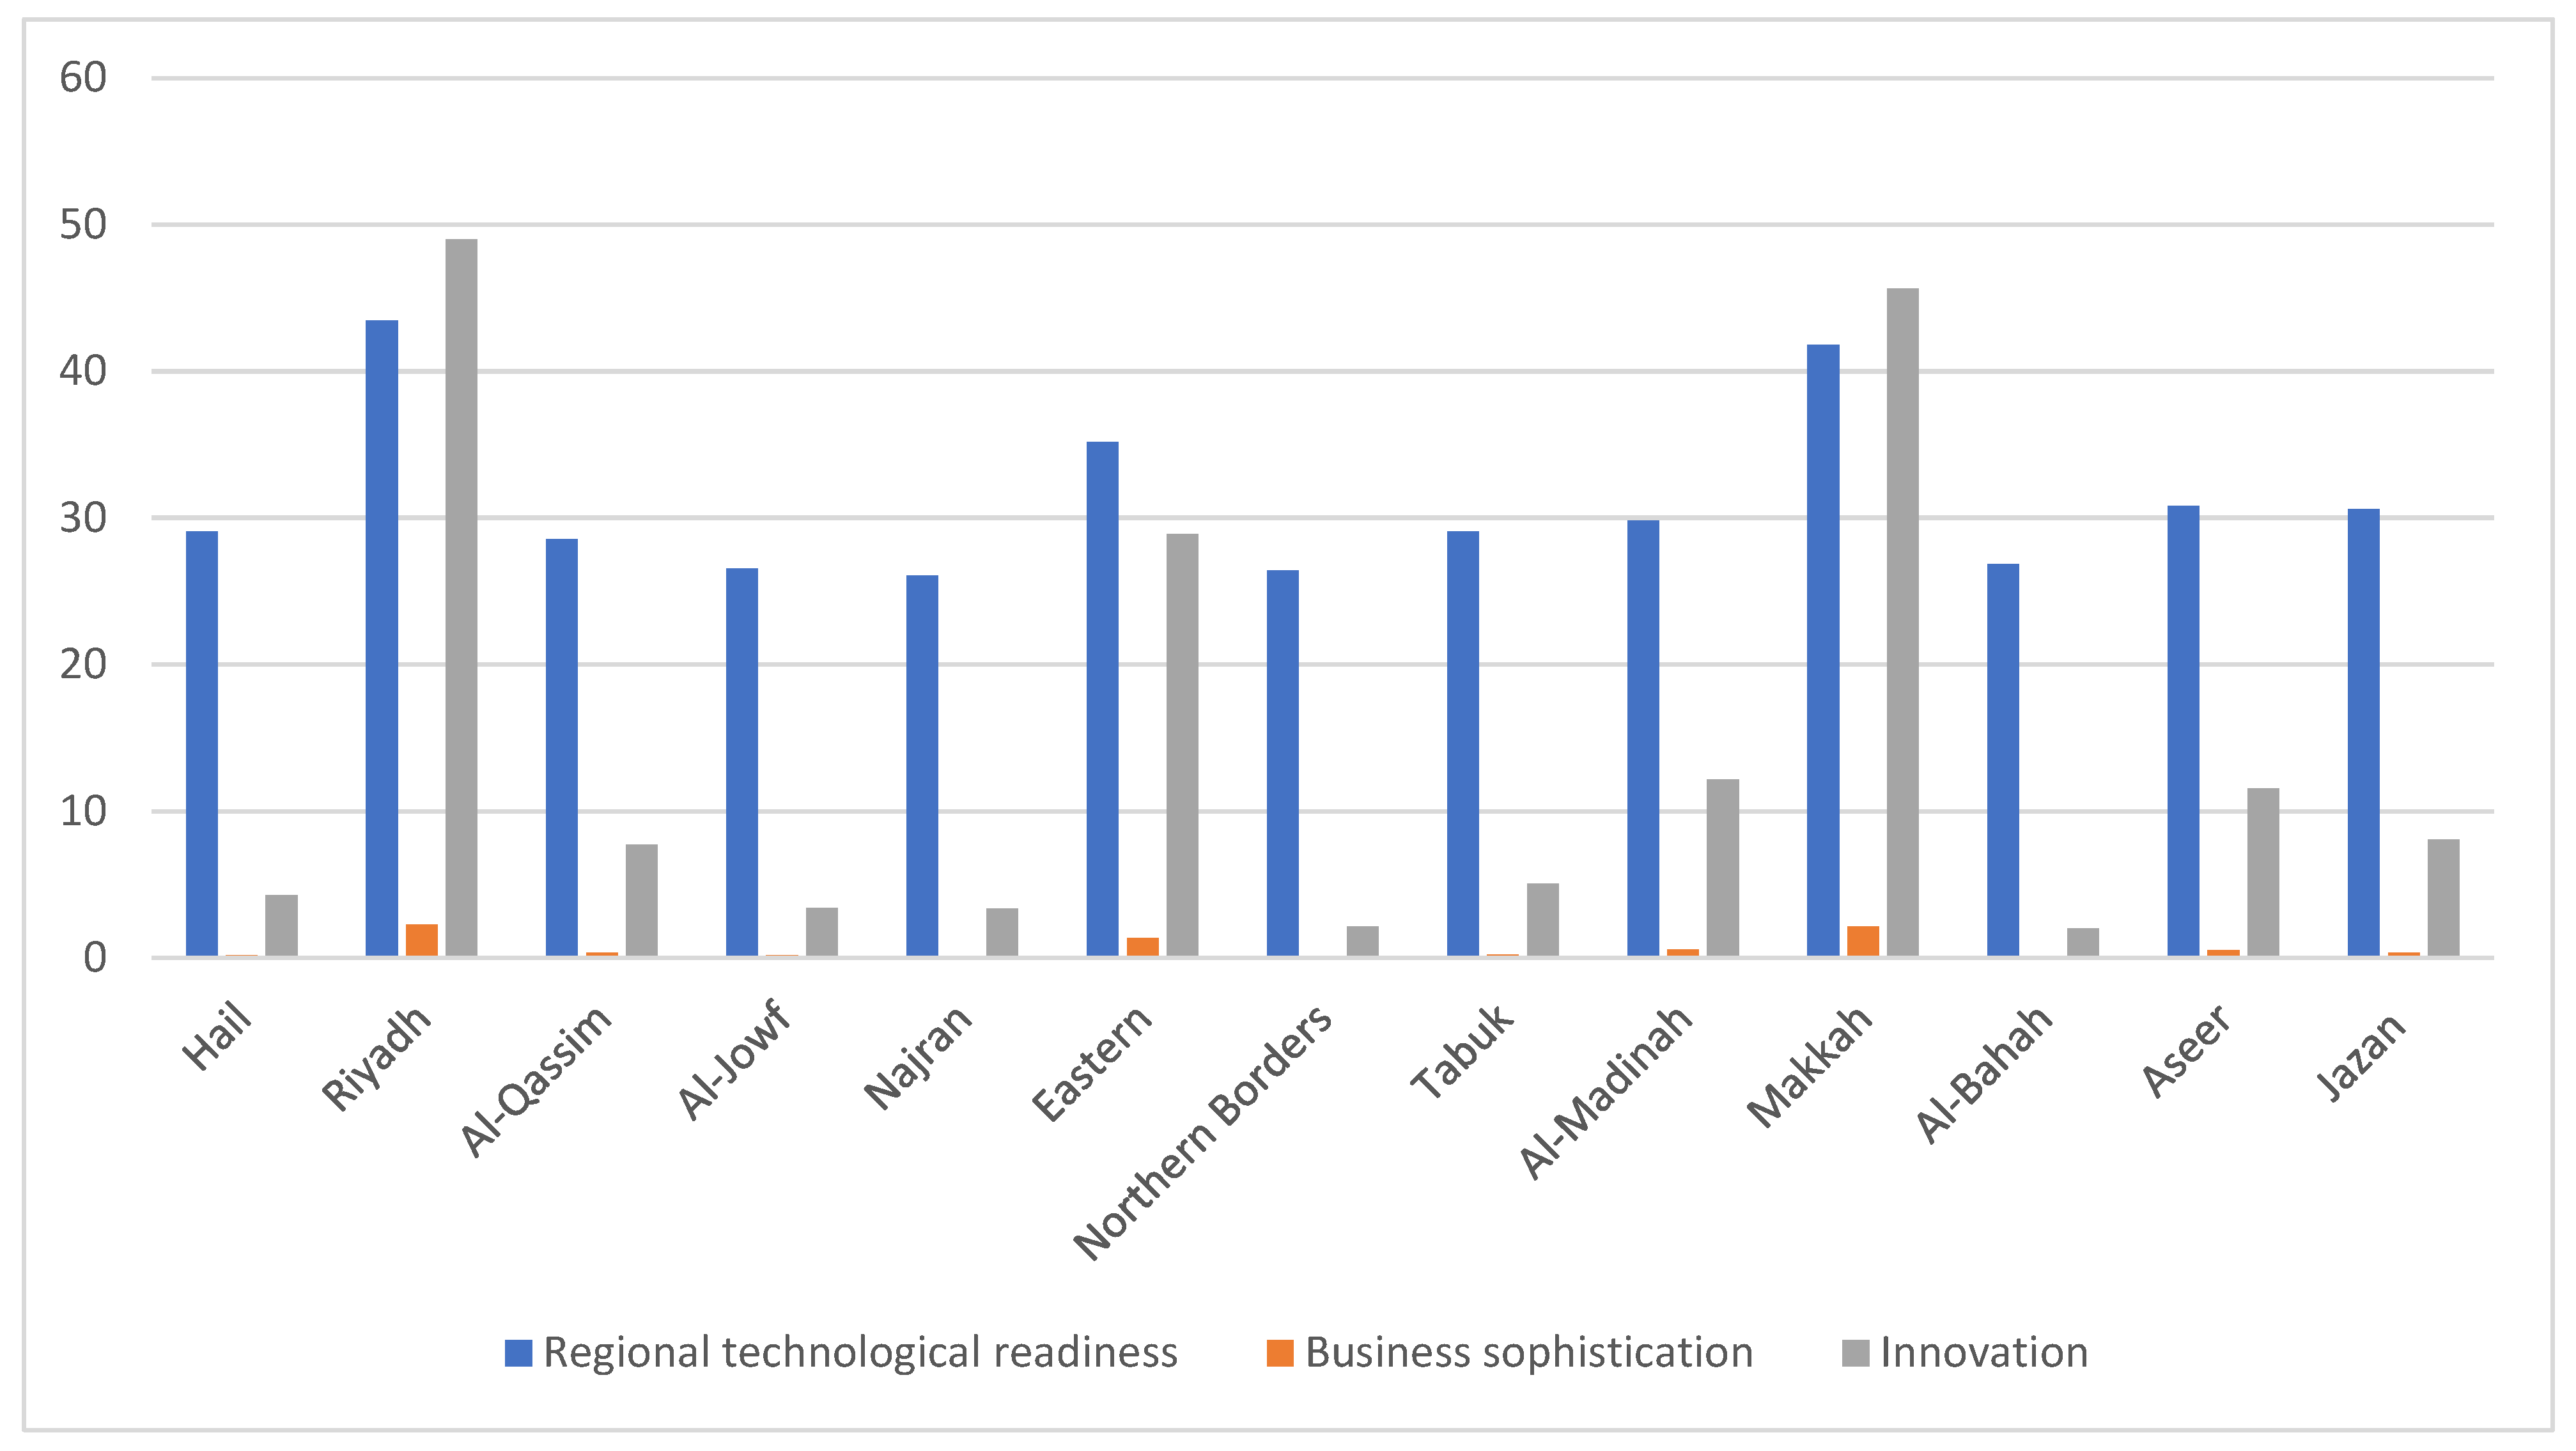
The initial variable in the innovation sub-index is the regional level of technological readiness. This is gauged by the extent to which technology is employed by both households and enterprises. The indicators employed to assess this phenomenon include the prevalence of broadband access among households and the rate of technological advancement absorption at the enterprise level. The series demonstrates an overall mean of 31.097, with a standard deviation of 5.664. The variable is constrained between the values of 26.065 (Al-Bahah) and 43.431 (Riyadh). With respect to the Hail region, a value of 29.071 was observed, which represents a notable degree of strength when compared to the values observed in other regions. The regions within Saudi Arabia that exhibit the greatest propensity for leveraging sophisticated technological instruments are situated within Makkah and Riyadh. The results thus corroborate sub-hypothesis H3.1, indicating that regions in Saudi Arabia that have higher levels of technological innovation and digital infrastructure are more competitive according to the RCI. These findings lend support to the conclusions of the studies conducted by the authors of [
32,
34].
With regard to the business sophistication variable, the series exhibits an overall mean of 0.654 and a standard deviation of 0.758. The variable is constrained between 0.091 (Al-Bahah) and 2.257 (Riyadh). In consideration of the Hail region, the value of 0.198 may be regarded as average in comparison with the other regions. A more comprehensive examination of the data reveals that capital cities consistently demonstrate a noteworthy level of business sophistication. This finding may indicate a tendency for service activities to be concentrated in these locations, thereby supporting sub-hypothesis H3.2, which posits that regions with a more favorable business environment will rank higher in the RCI. The findings are consistent with those of recent studies [
4,
9,
55].
The final variable under consideration is innovation, which exhibits an overall mean of 14.095 and a low standard deviation of 16.367. The variable is constrained between the values of 1.995 (Al-Bahah) and 48.976 (Riyadh). In consideration of the Hail region, the value is determined to be 4.226, which can be regarded as average when evaluated against the other regions. These findings support sub-hypothesis H3.3, which posits that regions with elevated levels of innovation and research and development investment will exhibit a more robust performance on the RCI. The results are highly significant, as evidenced by the findings of [
31,
32,
33,
34,
47].
Figure 7 shows the significant values observed across most regions for the two variables of technological readiness and innovation. It is noteworthy that the values of the business sophistication variables are comparatively lower for the innovation sub-index.
4.2. Overall Analysis
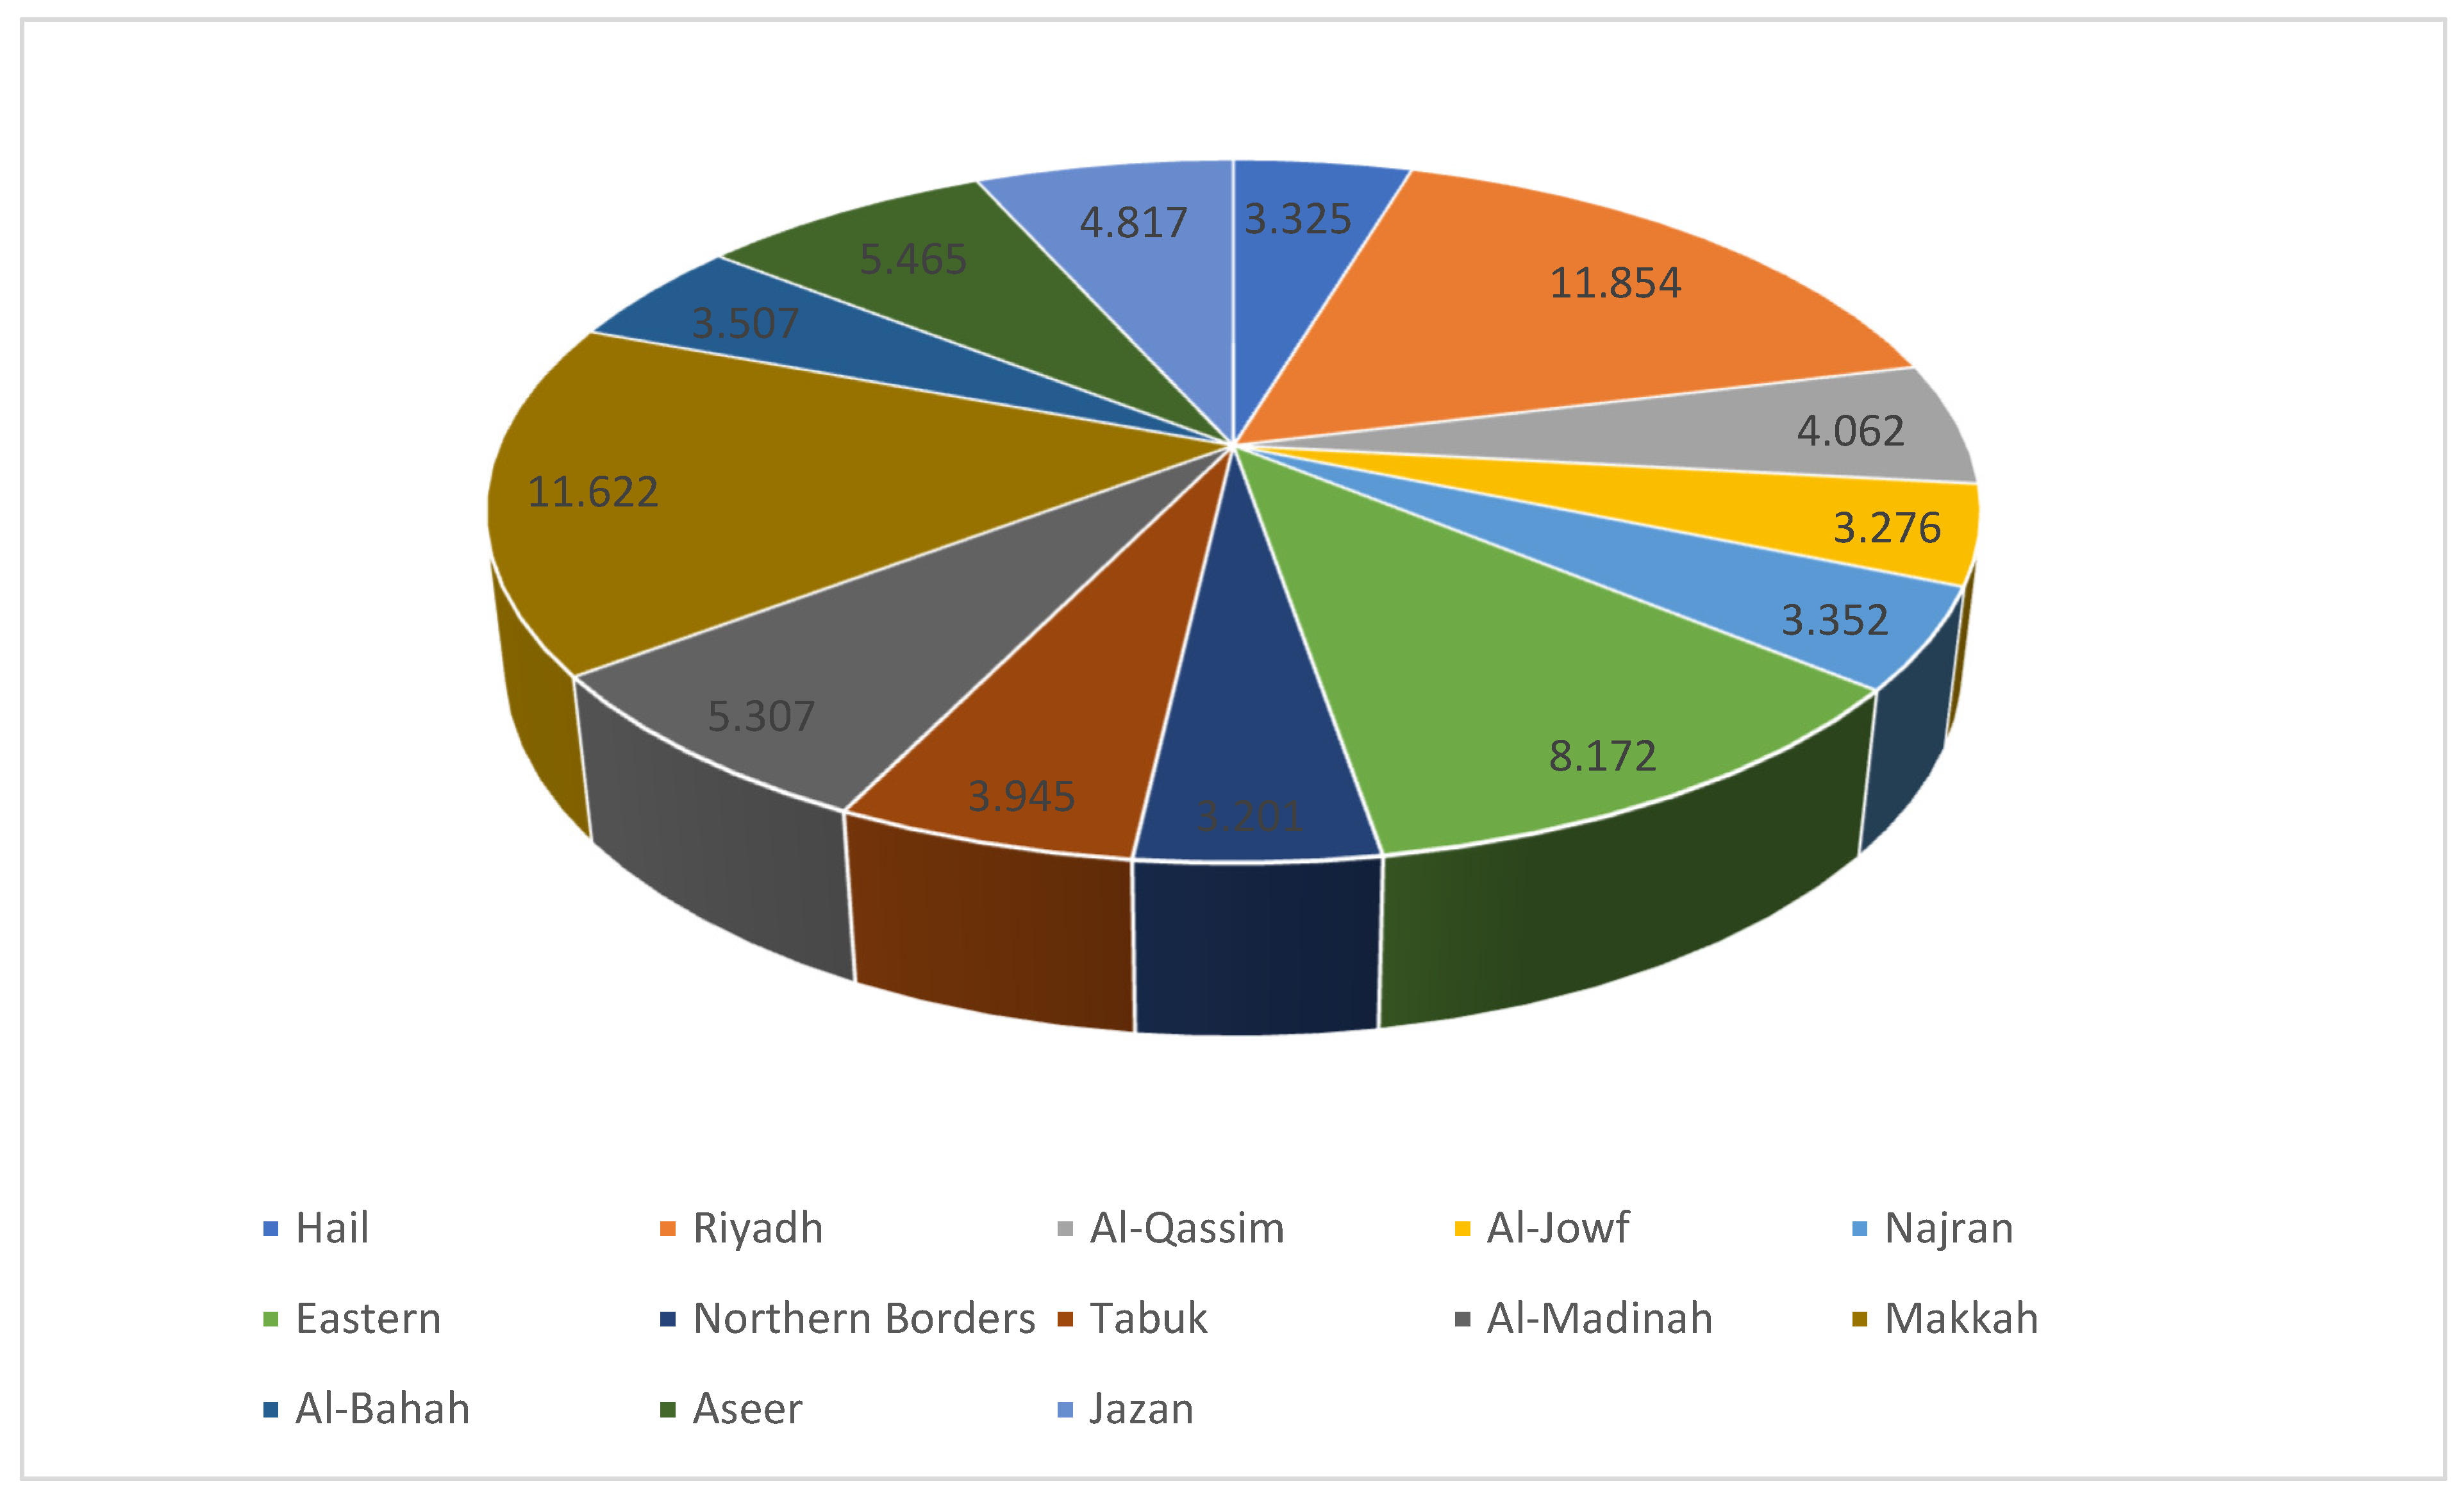
This section integrates the findings from the three sub-indices of the study (innovation, efficiency, and basic) into a coherent whole. The analysis results can be used in many ways, including providing insights for decision-making processes, developing programs and services, and improving the understanding of specific problems or phenomena. For the initial variable, called the “basic sub-index”, the calculated mean is 5.531, with a standard deviation of 3.076. The variable is constrained between a minimum of 3.201 (Northern Borders) and a maximum of 11.854 (Riyadh). Compared to the other regions, the Hail region has a value of 3.325, which can be considered average (see
Table 6). These outcomes lend support to the initial fundamental hypothesis (H1), namely, that regions in Saudi Arabia with higher scores for the basic sub-index components of the RCI demonstrate a significant positive impact on their overall regional competitiveness.
As shown in
Figure 8, the two most significant regions are Riyadh (11.854) and Makkah (11.622). It is notable that the remaining surveyed regions have comparatively lower values, with the Northern Borders and Hail having the lowest observed values.
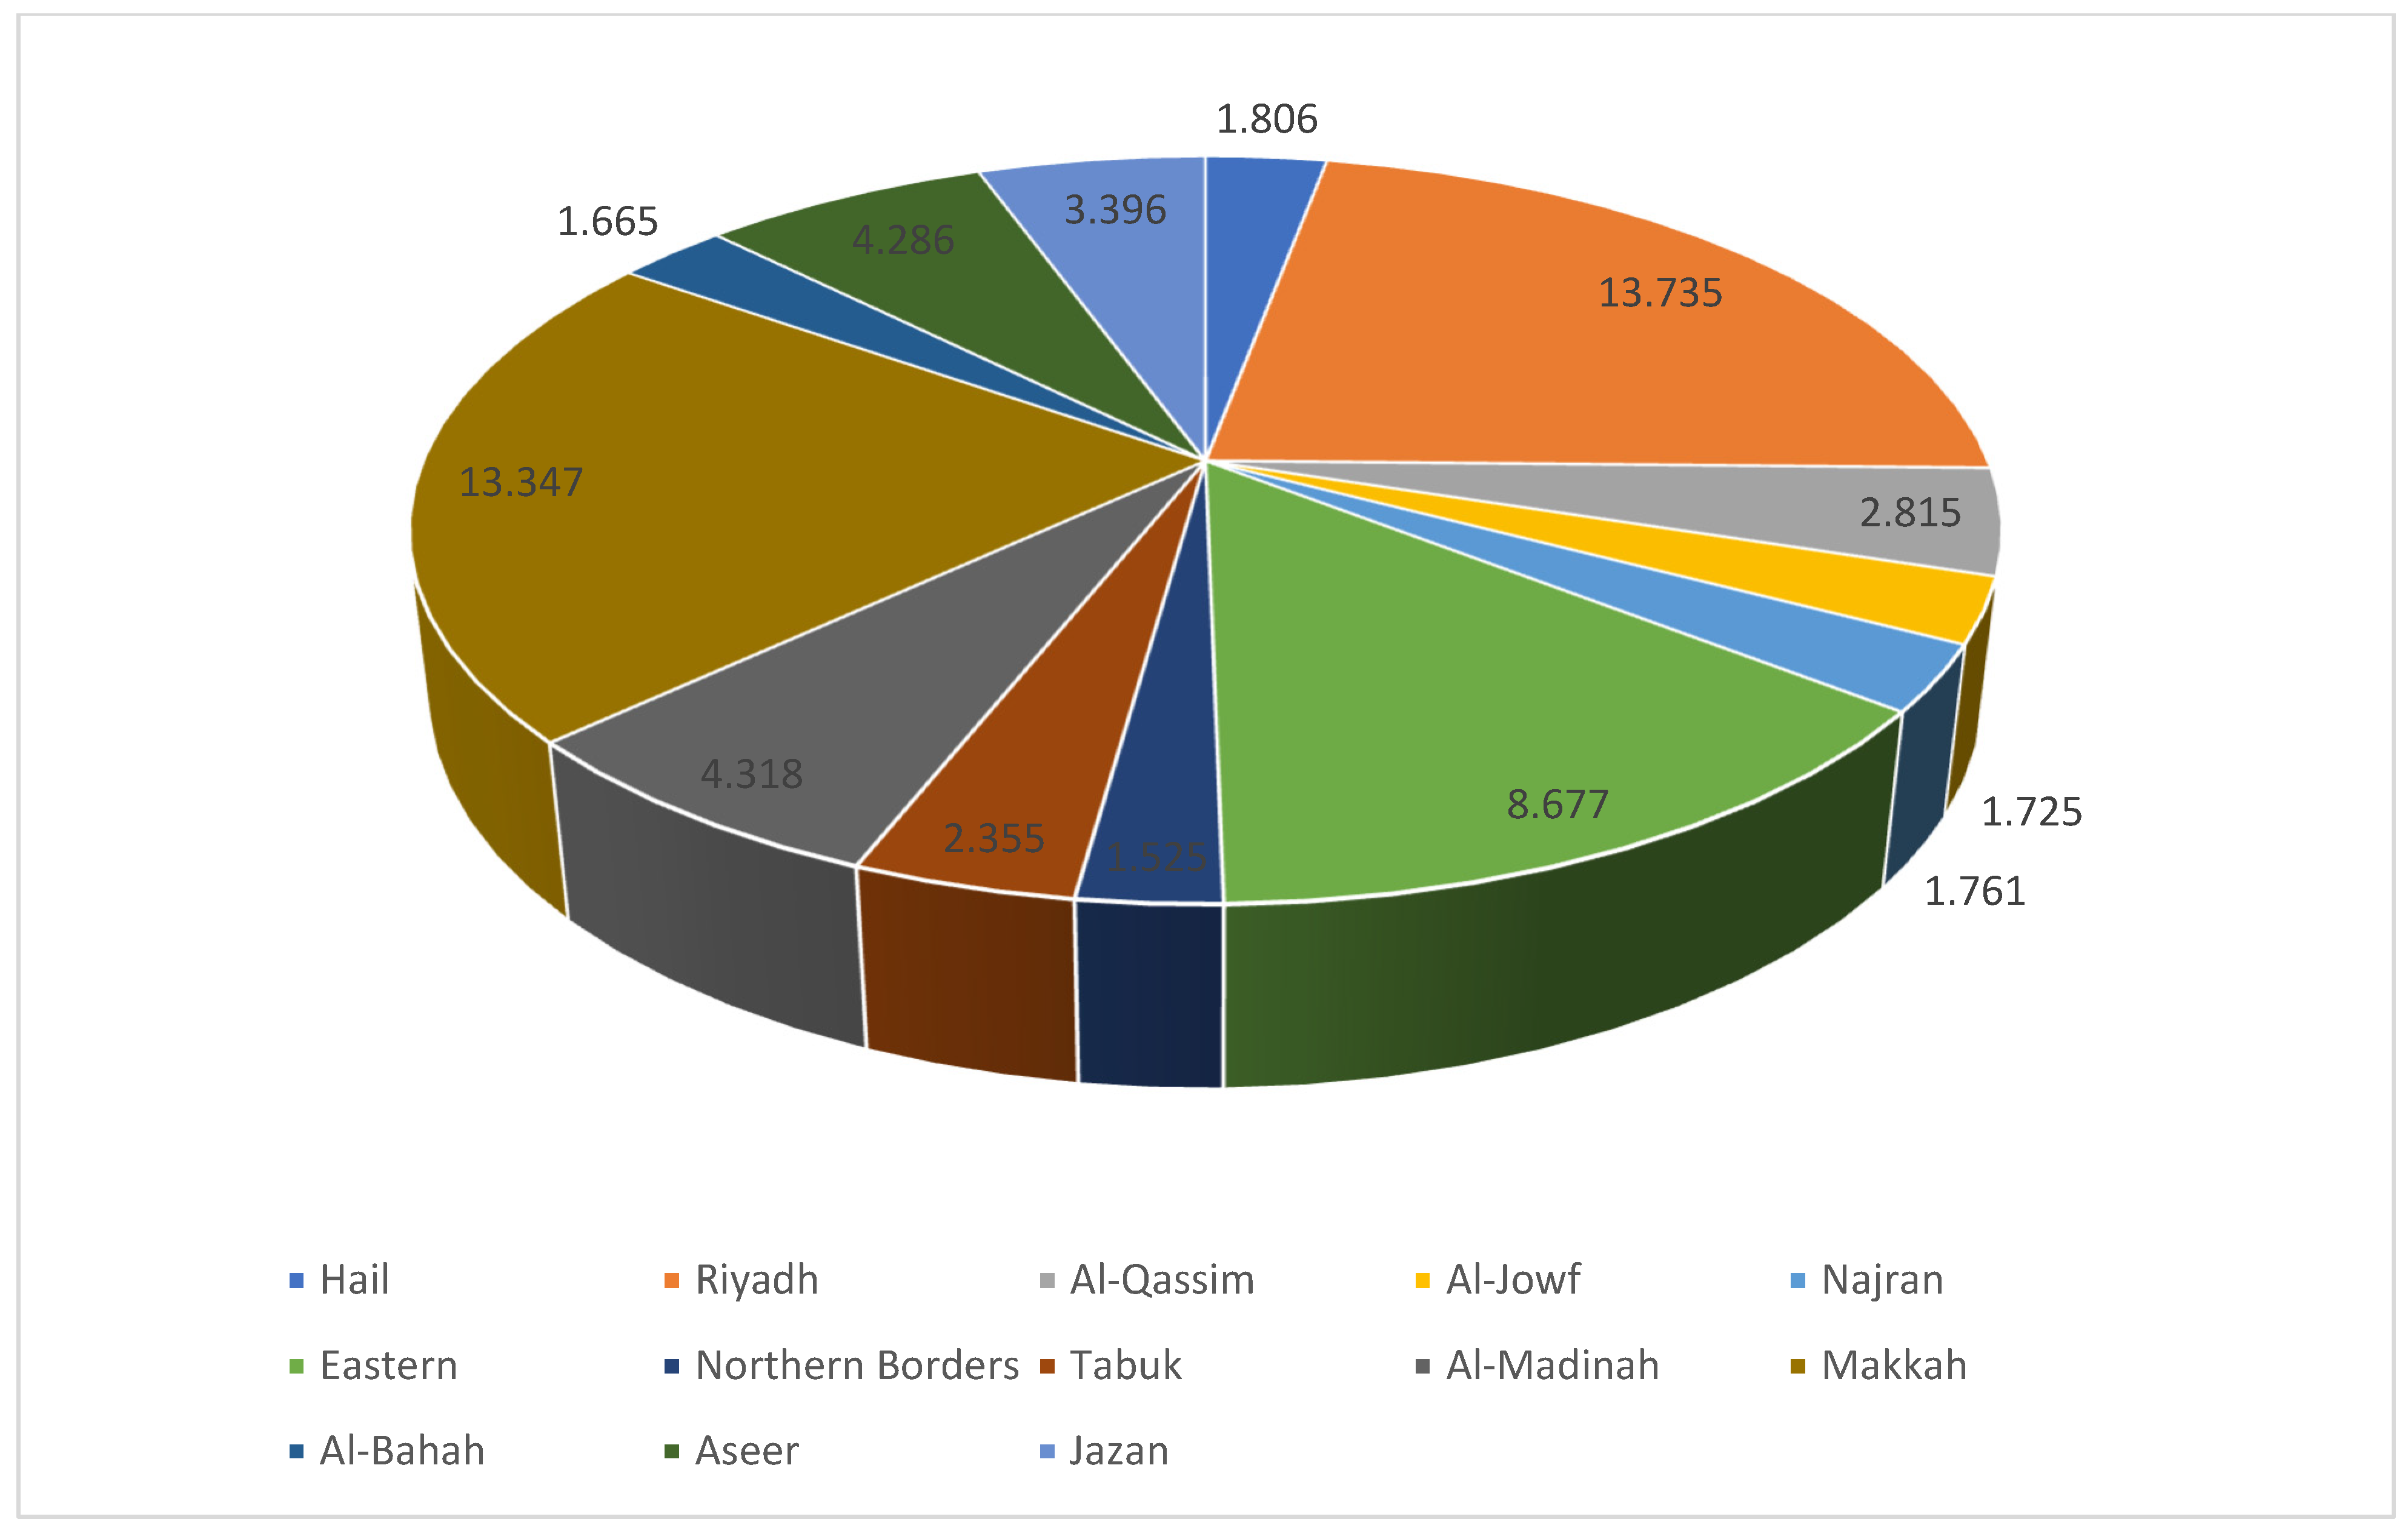
The second sub-index, called the “efficiency sub-index”, has an overall mean of 4.724 with a standard deviation of 4.363. The variable is constrained to a range between 1.525 (Northern Borders) and 13.735 (Riyadh). The Hail region also has a relatively low value (1.806).
Figure 9 illustrates that Riyadh (13.735), and Makkah (13.347) are the two most important regions. However, the rest of the regions included in our study have lower scores, with the Northern Borders having the lowest score. The results substantiate the second fundamental hypothesis (H2). The results demonstrate that regions in Saudi Arabia with higher scores for the efficiency sub-index components of the RCI exhibit a significant positive impact on their overall regional competitiveness.
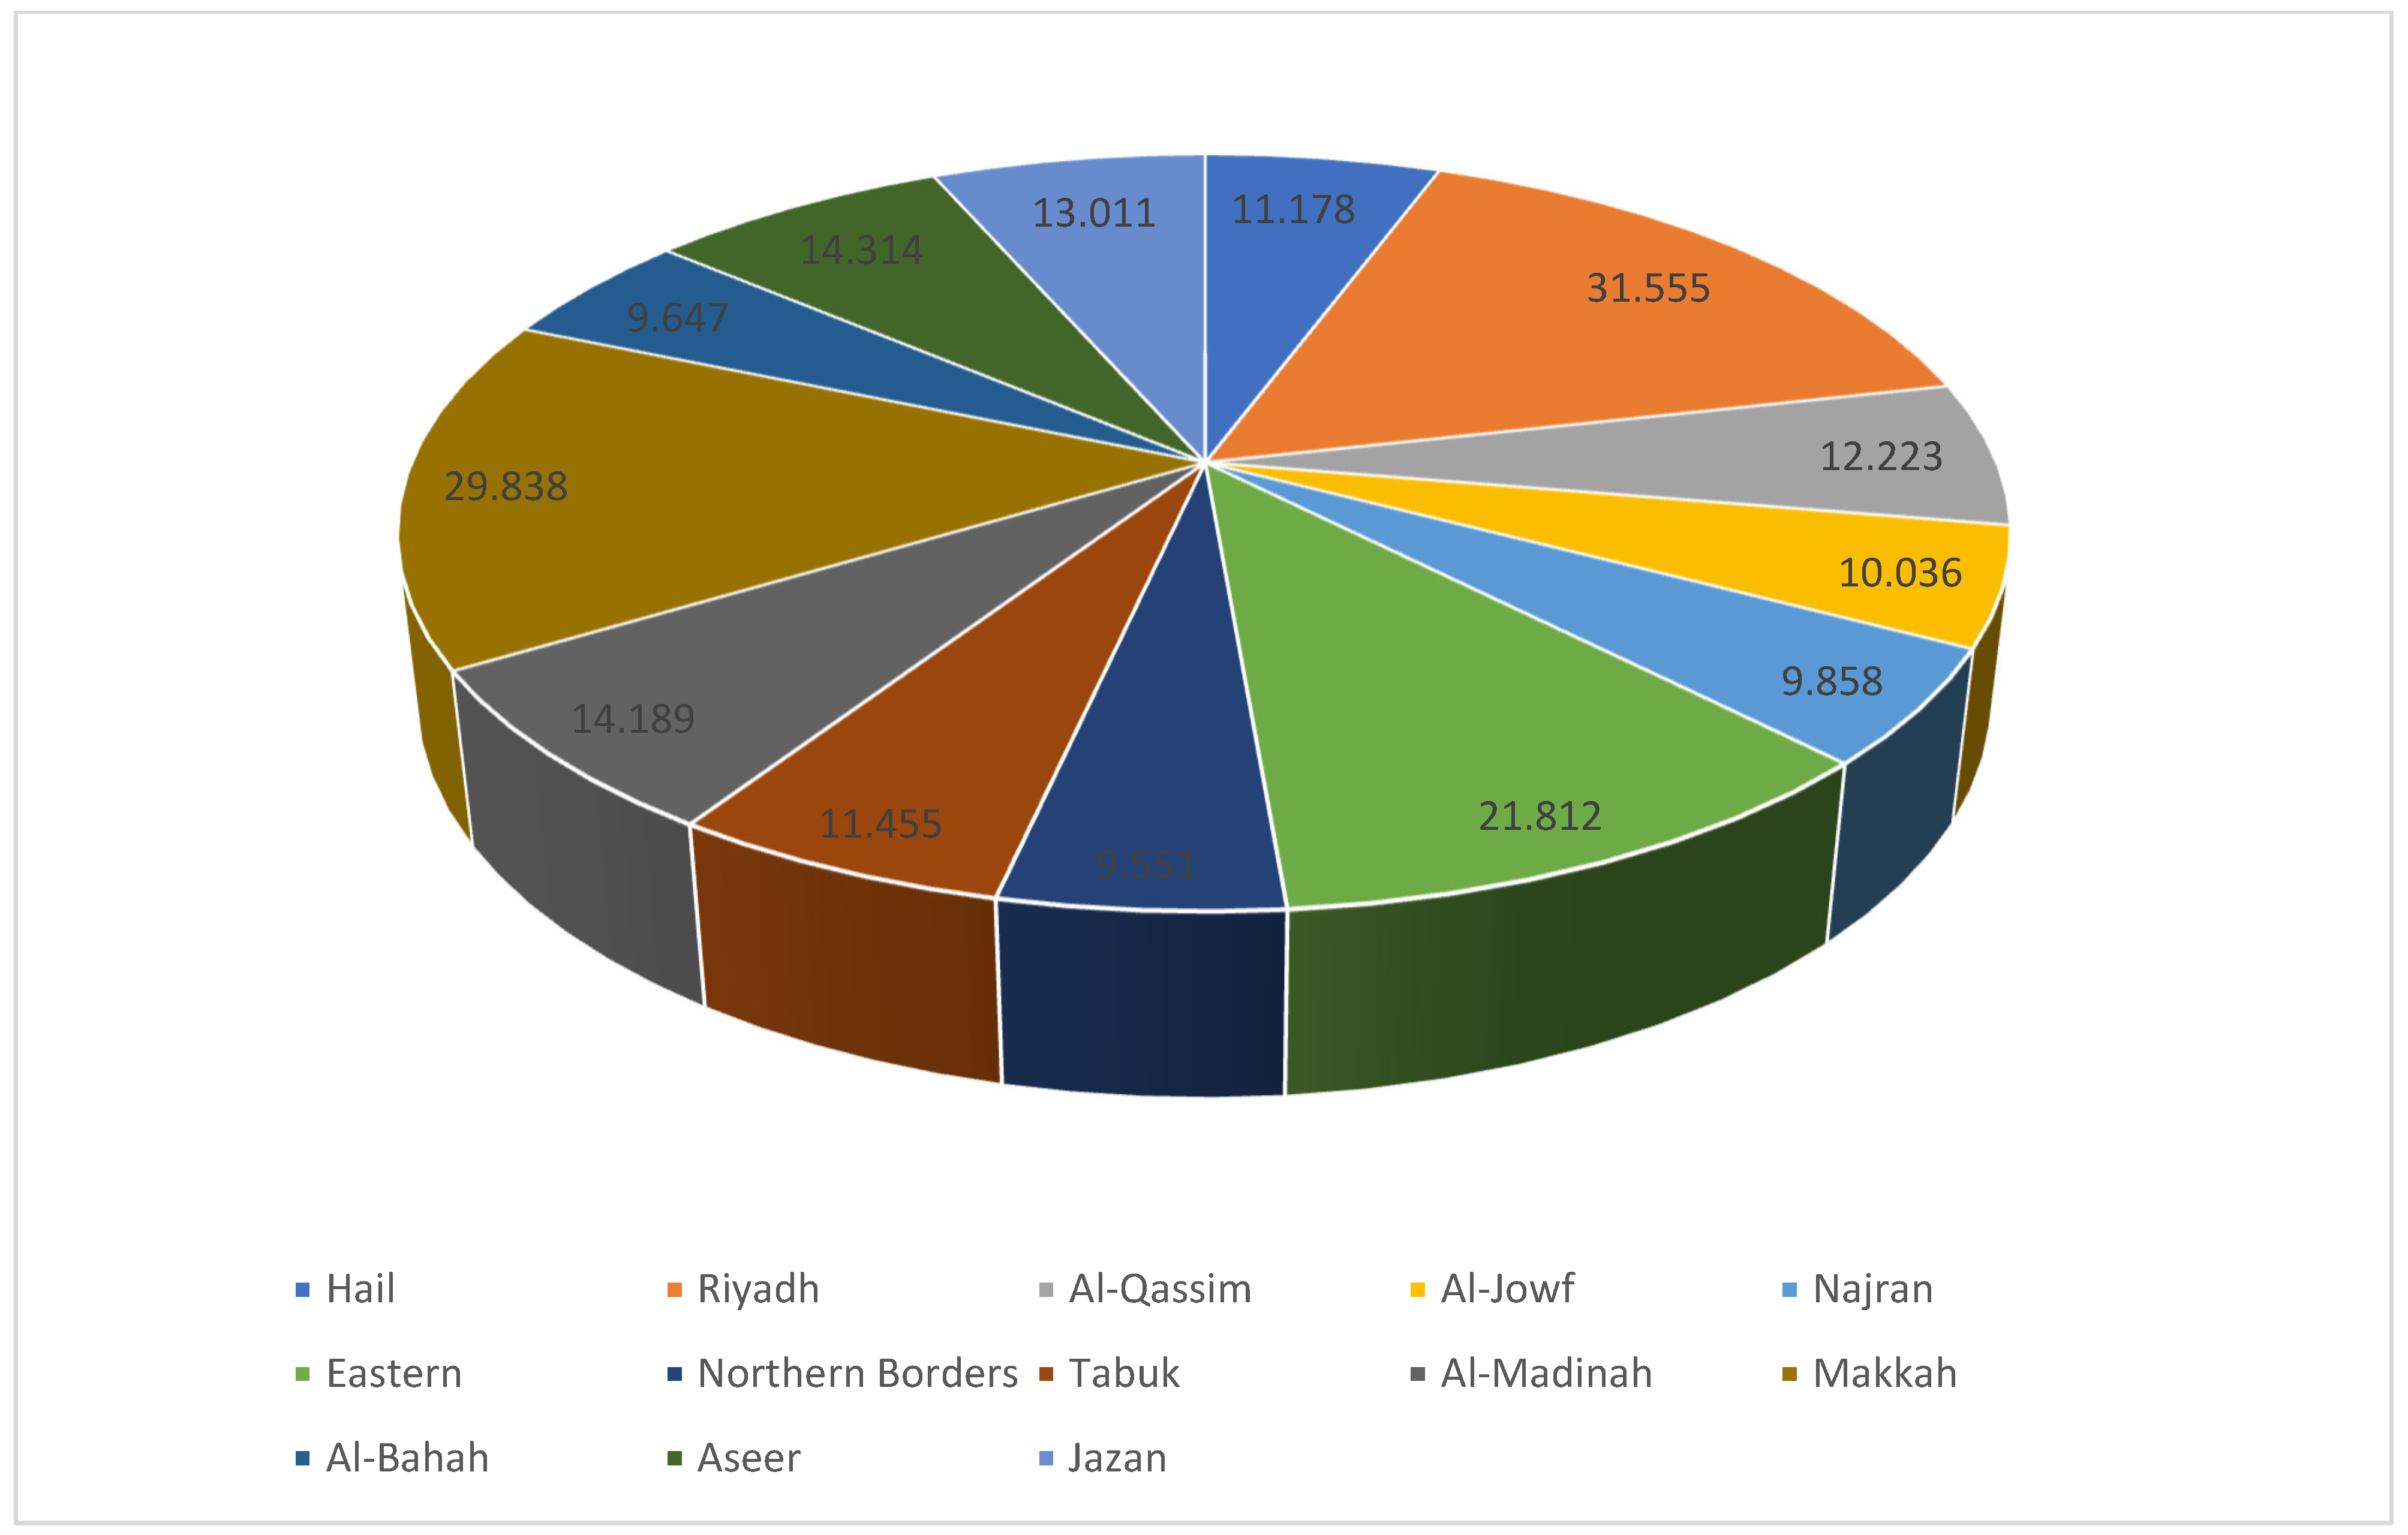
The third group is the innovation sub-index, which has an overall mean of 15.282 and a standard deviation of 7.577. The variable is constrained to a range between 9.551 (Northern Borders) and 31.555 (Riyadh). For the Hail region, the value of 11.178 represents an average value compared to the other regions.
Furthermore,
Figure 10 also shows that Riyadh (31.555) and Makkah (29.838) are the two most relevant regions. However, the remaining regions in our study have comparatively lower values, with the Northern Borders recording the lowest value. These findings lend support to the third fundamental hypothesis (H3). It can be observed that regions in Saudi Arabia that achieve higher scores for the innovation sub-index components of the RCI demonstrate a significant positive impact on their overall regional competitiveness.
The study’s final global analysis of the study, which was carried out after grouping the data into three categories, gives an overall mean of 8.053 with a standard deviation of 5.067. The global variable representing the RCI is constrained between a minimum of 4.268 (Northern Borders) and a maximum of 18.705 (Riyadh), The Hail region also has a comparatively low global value compared to the other regions.
After aggregating the three study groups,
Figure 11 shows that Riyadh (18.705), Makkah (17.949) and Sharqia (12.52) are the most important regions. However, the remaining regions in our study have comparatively lower values, with the region with the lowest value being Northern Borders. Regarding the Hail region, the value of 4.922 represents an average value compared to the other regions. This figure presents a comprehensive overview of the results, from which several pertinent conclusions can be drawn. Firstly, there is a clear spatial correlation in the distribution of competitiveness levels, with regions with relatively high (low) levels of competitiveness concentrated in certain geographical areas.
Several factors may explain these results, the most significant of which is the population distribution in different regions. Indeed, regions with a high RCI score tend to attract more people due to better job opportunities, higher standards of living, and better access to services. For example, Riyadh, Jeddah, and Sharqia (Dammam and Al Khobar) are regions with high RCIs and significant population densities. The major urban centers are the most competitive regions in terms of economic opportunities and have the most infrastructure, healthcare, education, and social amenities, further drawing people from rural and less-developed areas. This is evident in the steady migration from rural areas to cities like Riyadh and Jeddah, which offer more competitive economic conditions. Due to a better economic and business climate, regions with higher competitiveness tend to attract investments, leading to job creation and, in turn, population growth. For example, the rise of the NEOM project (in the northwest) and the Red Sea Project are expected to make less-developed regions more competitive and potentially change the population distribution in the future.
Second, the least competitive regions are in the northern part of the country, including AL-Jouf, Northern Borders, Hail, Tabuk, and the southern regions of Najran and Al-Bahah, which are particularly noteworthy. Despite these findings, it is noteworthy that a few regions have a significant level of competitiveness that differs from the surrounding areas. The Saudi Vision 2030 is aiming to enhance regional competitiveness across the country. The government’s efforts to decentralize development and promote industrial zones and tourism projects in less-developed regions (such as in the south or northwest) may impact the future population distribution. The RCI is directly linked to how effectively these regions can develop and thus attract more residents over time (Saudi Arabia’s Vision 2030).
5. Conclusions and Recommendations
The RCI provides Saudi Arabia with a powerful tool for promoting competitiveness and identifying key constraints to sector development and expansion at the subnational level. It also serves as a practical instrument for identifying the relative strengths and weaknesses of the provinces, as well as a conduit for facilitating dialogue between governments and the private sector, and for informing the development of actionable policy agendas aimed at fostering a more sustainable business environment.
The findings of the RCI indicate several key areas for consideration by policymakers at the local and national levels as they pursue the implementation of sustainable practices designed to enhance resilience, reduce the depletion of resources, and foster long-term economic health. In the initial stages of analysis, it is recommended that policymakers use the RCI scores to establish a comparative ranking of their respective provinces in relation to other regions. In this context, it is critical that policymakers consider both the final numerical RCI score and the tier position of their respective provinces. Together, these two rankings indicate the overall level of economic and social health of a province. By gaining an understanding of each province’s particular strengths and weaknesses, policymakers can identify local priorities; set quantifiable, precise targets for improving underperforming governance systems; and develop tailored action plans to achieve these targets and facilitate regional development.
A particularly effective approach for a province is to set specific targets aimed at improving its performance on the sub-index with the lowest scores. The aim is to reach the same level as the best performing sub-index. The specific component indicators shown in
Figure 5,
Figure 6 and
Figure 7 can then be used to determine which measurable indicators warrant prioritization. To illustrate, the province of Hail had the lowest infrastructure performance of all the provinces. Policymakers in this province can set a target to improve the infrastructure sub-index score from 6.125 to a level that is in the upper range of the sub-index score, which is between 25 and 26, as demonstrated by the top-performing provinces of Makkah and Riyadh.
Once specific targets have been set, action plans can be developed and implemented in coordination with the relevant government agencies and private sector stakeholders. Regular monitoring of progress towards these goals is essential in ensuring that infrastructure projects can significantly affect ecosystems. Indeed, improving the infrastructure for Hail would require effective sustainability strategies integrating infrastructure planning with land use, transportation, and community development to create cohesive and functional urban environments. This includes building robust structures, enhancing drainage systems, and creating green spaces to absorb rainwater while prioritizing equitable access, ensuring that all populations benefit from transportation, energy, and water systems. The designation of Hail as a UNESCO World Heritage Site will undoubtedly lead to an increase in tourist traffic and boost the local tourism industry. Furthermore, in line with the objectives outlined in Vision 2030, it is crucial to prioritize the development of the essential local infrastructure and initiatives that promote diversified economic growth, as these will prove instrumental in advancing the city’s future. This insight, in turn, provides an opportunity for peer-to-peer exchange between provinces, allowing Hail to gain insights into the most effective practices of high-performing provinces in terms of infrastructure development. As outlined in the country’s Vision 2030 realization program, several strategic action plans have been implemented to enhance the country’s transportation infrastructure. These include developing and expanding roads, highways, and railway networks to improve connectivity between cities, ports, and airports. In addition, upgrades and modernizations have been made to ports and airports, including expanding the capacity of key ports, such as King Abdulaziz Port in Jeddah and King Fahd Port in Dammam. Developing an advanced logistics infrastructure, including container terminals and digital tracking systems, will facilitate the creation of innovative and sustainable urban transport systems. Implementing electric public transport networks in major cities, such as Riyadh and Jeddah, will reduce congestion and enhance air quality. The key focus areas are the construction of smart cities and technological infrastructure, the fostering of economic zones and industrial parks, and the promotion of tourism infrastructure. Investment in significant tourism developments, such as the Red Sea Project and Neom City, is crucial in creating world-class resorts, hotels, and attractions. These action plan examples may help bridge the gap between regional disparities.
Similarly, the province of Hail, which demonstrated a weak performance on the skilled labor dimension, may aspire to attain a higher score in the labor market efficiency sub-indicator. This could be achieved by a notable increase from the current score of 2.560 to a level comparable to that of Makkah, the top-performing province in this sub-indicator. Such an improvement would markedly enhance the performance of the province of Hail. To enhance this dimension, it is imperative to foster partnerships between businesses and educational institutions to create curricula that address the skills needed for practice. This ensures that the future workforce is well-prepared for the challenges of a sustainable economy. It is notable that regions that prioritize sustainability often attract businesses and workers who value environmental responsibility. This can facilitate innovation and growth. By identifying the policies and practices used by high-performing provinces to achieve their respective rankings, low-performing provinces can identify the most effective strategies to implement to improve their own rankings. Indeed, the National Transformation Program (NTP) constitutes a pivotal element of Vision 2030. A significant focus is placed on the development of human capital and the enhancement of the skills of the Saudi workforce. Additionally, the KSA has established the Saudi Human Resources Development Fund (HRDF), which is responsible for providing support for the training and development of the Saudi workforce.
Regarding the innovation sub-index, the Hail region’s performance represents the average of the other regions, particularly the capital regions. In this context, and in view of the accelerated pace of technological development, investment in green technologies can enhance competitiveness while addressing environmental concerns. The KSA has launched the National Innovation Strategy, which aims to create an innovation-driven economy by fostering creativity and research in various sectors, such as technology, healthcare, and education; strengthening collaborations between government, industry, and academia to commercialize research outcomes; and encouraging private sector investment in innovation, particularly in fields like artificial intelligence, biotechnology, and renewable energy. Furthermore, efforts are being made to promote environmental sustainability. The KSA has launched two initiatives, the Green Saudi Initiative and the Green Middle East Initiative, with the objective of advancing renewable energy projects, reducing carbon emissions, and encouraging sustainable innovation. Investments in solar and wind energy, along with hydrogen production, are intended to establish the country as a frontrunner in clean energy technologies.
The evaluation of regional competitiveness enables the implementation of sustainable regional development in Saudi Arabia, which in turn improves living standards and makes regions more attractive for residents and businesses. The RCI exercise should be conducted at regular intervals (e.g., every three years) to enable provinces to assess whether they have made progress, both in absolute terms and in comparison with other provinces. At the national level, the government can offer rewards and recognition to top performers in the RCI to motivate other provinces. In this way, the RCI can act as an accelerator, stimulating a reform impetus at the local level through province-to-province learning, which can then facilitate the adoption of best practices and improvements in underperforming regions.
Given the aims of our current research and the findings to date, it seems appropriate to suggest future research initiatives that would build on these findings. One such area of investigation would be to determine the extent to which digital regional competitiveness facilitates smart growth. Although the dataset is comprehensive, it is important to acknowledge the limitations of the findings. First, while a rigid weighting system for the Regional Competitiveness Index brings simplicity and consistency, it also presents limitations, particularly in reflecting the diverse, dynamic, and evolving nature of regional economies. Adopting a more flexible, adaptive weighting methodology could offer a more nuanced and insightful view of regional competitiveness, particularly in a rapidly changing economic environment. Second, one of the most important limitations is the lack of a dynamic perspective. It is crucial to consider this, as implementing new practices and adopting new policies to enhance a region’s competitiveness may require adjustment. Moreover, these policies may take a long time to manifest the expected performance gains.


