Article

Sustaining Carbon Storage: An Analysis of Land Use and Conservation Strategies in China’s Huang-Huai-Hai Plain

by
Xiaofang Wang
1,
Weiwei Zhang
2,
Xinghui Zhao
1,
Dongfeng Wang
2 and
Yongsheng Li
1,*
1
College of Forestry, Henan Agricultural University, Zhengzhou 450046, China
2
Henan Provincial Forestry and Ecological Construction and Development Center, Zhengzhou 450046, China
*
Author to whom correspondence should be addressed.
Sustainability 2025, 17(1), 139; https://doi.org/10.3390/su17010139
Submission received: 21 November 2024 / Revised: 18 December 2024 / Accepted: 25 December 2024 / Published: 27 December 2024

Abstract

:
The Huang-Huai-Hai Plain, a vital agricultural area in China with a significant amount of arable land, plays a pivotal role in influencing grain production, ecological carbon cycles, and global climate change through its shifts in land use. Within this research, we have employed the ArcGIS tool and the In-VEST-Geodetector-PLUS methodology to scrutinize the shifts in carbon storage from the year 2000 to 2020, determine the pivotal influences behind these shifts, and anticipate the projected carbon storage for 2030. Although there has been a slight increase in forested areas as a result of environmental policies, the conversion of cropland to impervious surfaces due to urbanization has led to a persistent decrease in carbon storage, with a cumulative loss of 272.79 million metric tons over the two decades. The Normalized Difference Vegetation Index (NDVI), Night-Time Lights (NTL), Gross Domestic Product (GDP), and Population (POP) are critical factors impacting carbon storage, reflecting the intricate connection between socio-economic development and natural ecosystems. The multi-scenario simulations for 2030 suggest that the least reduction in carbon storage would occur under the scenario of protecting arable land, while the most significant decrease would be under the urban expansion scenario, highlighting the impact of urbanization. The study’s results emphasize the critical need to harmonize agricultural land conservation with economic progress for the enduring growth of the Huang-Huai-Hai region.

1. Introduction

In the last few decades, the rapid advancement of industrialization and urbanization has been one of the significant contributors to the surge in carbon emissions from human activities, which in turn has substantially fueled global warming [1]. This warming not only disrupts climate patterns but also amplifies extreme weather events, rising sea levels, glacier melting, and loss of biodiversity, posing severe ecological challenges [2,3]. Currently, global carbon emissions are still on the rise. The Global Carbon Budget 2024 report indicates that anthropogenic carbon dioxide emissions will reach a record high of 41.6 billion tons, a 2% increase from 2023. Nearly 90% of these emissions are from fossil fuels [4]. As the world’s largest emitter of carbon, China’s industrialization and urbanization have been the main driving force behind China’s economic expansion and upgrading of energy consumption, with the industrial sector accounting for about 70.3% of energy consumption [5]. The continued increase in carbon emissions threatens the natural environment and has implications for the economy, public health, and safety, thereby endangering sustainable development. In response to these issues, global governments have implemented legislative measures such as the UK’s Climate Change Act and Germany’s Climate Protection Act and have strengthened international cooperation. The Paris Agreement represents a pivotal step in the global response to climate change. China has aimed high in setting its targets to peak carbon emissions and to become carbon neutral [6]. Concurrently, organizations and scholars committed to sustainable development are actively engaged in research on carbon cycle issues, providing scientific backing for environmental policies and fostering a harmonious relationship between human advancement and nature [7,8].
Cultivated land is an integral part of the global carbon cycle, engaging in the exchange and circulation of carbon across various spheres [9]. The Huang-Huai-Hai Plain, China’s second-largest plain with historical significance, has about 60% of its land used for cultivation. This region sees extensive land development and utilization, with human activities greatly influencing land use and cover changes [10]. Carbon sequestration by cultivated vegetation contributes to regional carbon cycles, which is relevant for addressing climate change, preserving biodiversity, and sustaining ecosystem services. In this research area, China has deployed a multitude of projects, large and small, with the aim of reaching its carbon peaking and carbon neutrality objectives. As of 2024, according to reports, there have been over 4000 such projects. [11]. As a key grain-producing base for China, the Huang-Huai-Hai Plain’s substantial arable land is vital for national food security and contributes to the Earth’s carbon cycle. It offers significant ecosystem services, contributes to reducing the impacts of climate change, helps maintain the global carbon balance, conserves biodiversity, and fosters sustainable development. The agricultural land use system in the Huang-Huai-Hai Plain contributes to carbon sequestration, demonstrating high efficiency and regional prevalence, as shown by research [12]. Since 2000, with the ongoing acceleration of China’s industrialization and urbanization, the dynamics and intensity of land use have been in constant flux [13]. Given the finite land resources, urban expansion is bound to encroach upon other land types, impacting carbon storage to varying degrees. Therefore, balancing economic development with ecological protection has become increasingly critical. Studying the spatiotemporal variations in carbon storage in the Huang-Huai-Hai Plain is essential for addressing China’s dual carbon goals and global climate change. In China, different regions may exhibit varying trends and influencing factors in carbon storage dynamics due to their distinct environmental conditions. For example, a study observed an upward trend in the spatiotemporal dynamics of carbon storage within the Sanjiangyuan area over the course of the research period, primarily due to ecological protection and restoration measures [14]. Research on the Sichuan Plateau’s carbon storage dynamics revealed that land use and climate changes affected the region’s carbon storage, with forests and grasslands being the primary carbon sinks [15].
Scholars typically employ three methodologies to investigate soil and vegetation carbon storage: field surveys, remote sensing inversion, and model simulations. Field surveys can provide relatively precise carbon storage estimates but are limited in scope and may potentially disrupt the research environment [16]. Remote sensing inversion is suitable for large-scale studies but often focuses on specific ecosystems or partial carbon pool data [17]. Model simulations using HASM and InVEST effectively estimate and predict regional carbon storage across different scales. HASM focuses on simulating the spatial distribution of forest carbon storage using forest resource statistics as sample points [18], while InVEST is known for its efficiency, speed, and accuracy in assessing the impact of land-use changes on carbon storage and can visually represent the spatial distribution and dynamics of carbon storage, as well as the interplay between land use changes and carbon storage [19]. The InVEST model has been applied in studies ranging from Morocco’s Beht Basin to assess carbon storage through simulations [20] to Sri Lanka’s Uva Province, where carbon storage was found to be 96.635 million tons, with the most significant amounts in natural forests [21]. Studies combining the LUSD-urban model with InVEST have evaluated the effect of urban growth on the storage of carbon at the regional level, indicating a significant reduction due to urban growth and underscoring the importance of urban planning in carbon management [22]. Since its introduction, the InVEST model has been widely applied globally, often in conjunction with other models for scientific research. For instance, Zhao et al. combined InVEST with the CA-Markov model to evaluate the influence of ecological projects on carbon sequestration in the dry upper regions of China’s Heihe River Basin [23]. Wang et al. integrated the INVEST model with the Multi-Layer Perceptron (MLP) model to investigate the effects of urban growth on land-based carbon sequestration within the Three Gorges Reservoir region in China [24]. In our selection of models, we opted for the coupling of InVEST with GeoDetector and PLUS models. Since the 1960s, spatial statistics has advanced with tools like Moran’s I, Kriging, and SAR models, improving the analysis of spatial data. With technological progress, addressing spatial stratified heterogeneity is more critical, leading to the development of methods such as MSN for stratified samples and B-SHADE for biased ones. Despite many classification algorithms, statistical methods for spatial heterogeneity are still limited. The GeoDetector model stands out for identifying drivers of spatial patterns and quantifying their impact on heterogeneity, essential for complex studies on land use and carbon storage dynamics. It offers a robust framework for stratification, factor identification, and interaction analysis [25], helping to identify key factors affecting carbon storage in regions like the Huang-Huai-Hai Plain. Previous land use prediction studies have relied on models such as Markov [26], Cellular Automata [27], and CLUE-S [28], which have limitations in capturing the nuances of land use change and carbon storage dynamics. These models often fail to effectively reveal the characteristics of land use changes, the spatial patterns of carbon storage variations, and the complex relationships between land use transformations and carbon storage changes. The PLUS model, with its high precision and adaptability, addresses these shortcomings by simulating land use/cover changes at the patch level, providing a more detailed analysis of the spatial patterns of carbon storage and their relationship with land use transformations. Existing research comparing the PLUS, FLUS, and CLUE-S models in simulating land use effects in the Heihe River Basin has found that the PLUS model has the best-fitting effect [29]. This model is particularly suitable for our study in the Huang-Huai-Hai Plain, where understanding the intricate links between land use and carbon sequestration is crucial.
Current research on the carbon storage of the Huang-Huai-Hai Plain is somewhat limited. Despite these challenges, this study plays an important role in the regional carbon cycle and contributes to mitigating climate change, aiding in the preservation of biodiversity, and supporting the maintenance of ecosystem services. Our study employs model simulation methods, focusing on the Huang-Huai-Hai Plain in China, to analyze spatiotemporal changes in carbon storage using the InVEST model. It comprehensively evaluates the dynamic trends and characteristics of the region’s declining carbon storage, couples the GeoDetector model and the PLUS model to identify key factors influencing these changes, and conducts multi-scenario predictions for future trends. The study also discusses the reasons for the changes in carbon storage in the region from various perspectives, including analysis, society, economy, and policy, and explores the latest development directions based on the dual carbon goals of achieving a carbon peak and carbon neutrality. Based on these findings, the study proposes recommendations for optimizing land management strategies. These aim to inform policy-making, explore avenues to enhance carbon storage, raise public environmental awareness, and promote sustainable development at both regional levels, thereby promoting the achievement of China’s dual carbon goals and contributing to global climate action.

2. Date and Methods

2.1. Study Area

The Huang-Huai-Hai Plain, located in the eastern region of China (Figure 1), spans across the lower sections of the Yellow River, Huai River, and Hai River watersheds. It stretches from the Yan Mountains in the northern part, with geographical coordinates extending from 110° to 123° E and 31° to 43° N, down to the Dabie Mountains in the south, bordered by the Taihang Mountains to the west, and fronts the Yellow Sea and the Bohai Sea to the east. The total area of this expansive region is roughly 544,200 square kilometers. With a significant north-south stretch, the region is characterized by a temperate monsoon climate, with average annual temperatures ranging from 8 to 14 °C and average annual precipitation levels between 434 and 862 mm. Predominantly flat with fertile lands and suitable for agriculture, the central part of the region, except for the higher terrain in the northwest, is a vast plain. It serves as a vital base for the production of commercial grains, cotton, oil, meat, and fruits in China. The region enjoys clear seasonal changes, with a warm and moist climate, ample sunlight, and plentiful heat resources, which are conducive to the growth of a variety of crops, especially cereals such as wheat and corn, which are leading in national production. By 2020, in terms of various land use types, arable land accounted for about 57%, construction land about 17%, forests about 17%, grasslands 7%, and water bodies and unused land approximately 2%.

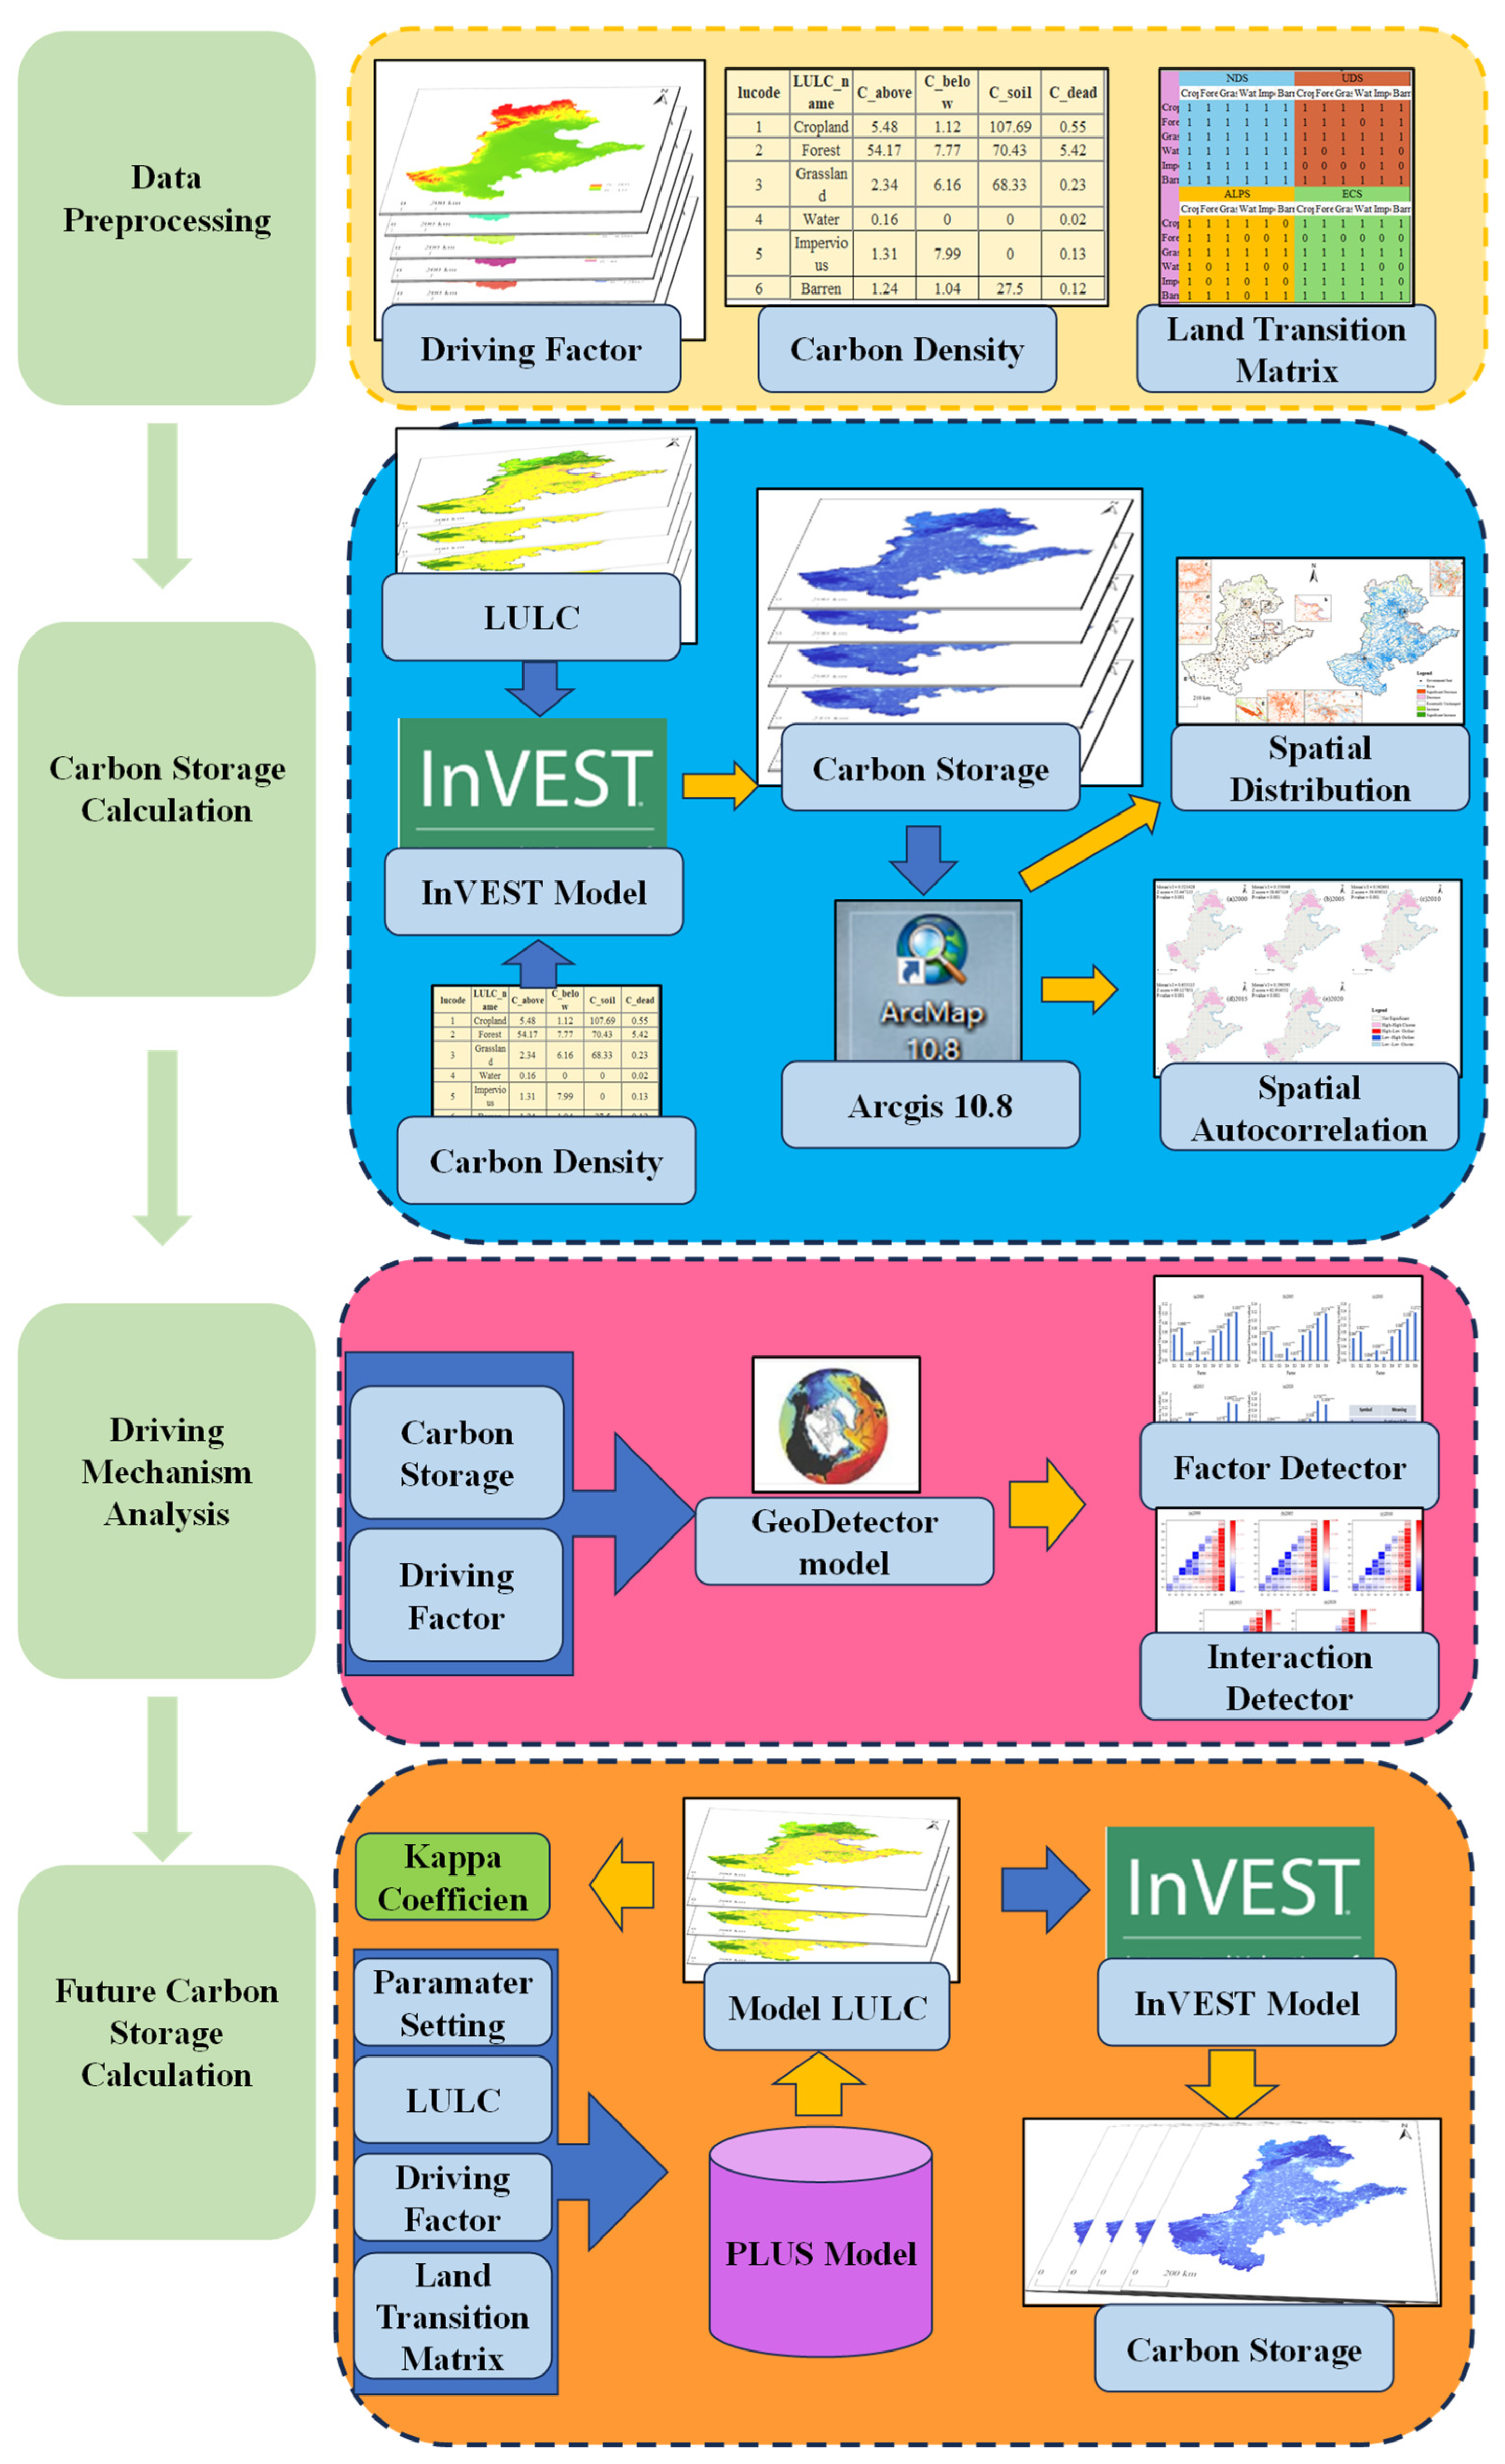
2.2. Experimental Design

Based on ArcGIS (version 10.8), this study couples the InVEST-GeoDetector-PLUS model to analyze the spatiotemporal changes in carbon storage within the research area, discusses the driving forces behind these changes, and conducts multi-scenario simulations for the year 2030 carbon storage (Figure 2).

2.2.1. Dynamic Analysis Methods for Carbon Stock Changes

The InVEST Carbon Storage and Sequestration model employs land use maps and carbon pool data, which include aboveground biomass, belowground biomass, soil, and dead organic matter, to assess the current carbon storage levels within a landscape or to determine the rate of carbon sequestration over time [30].
Carbon Storage Calculation Formula:
C t o t a l = C a b o v e + C b l o w + C d e a d + C s o i l
C t o t a l represents the total carbon density. C a b o v e is the sum of the aboveground biomass carbon density, C b l o w is the belowground biomass carbon density, C d e a d is the soil carbon density, and C s o i l is the dead organic matter carbon density, all with the unit of tons per hectare (t/ha).
The InVEST Carbon Storage and Sequestration Model fundamentally relies on raster data of land use and carbon density values. We utilized ArcGIS 10.8 to process the land use data, while the carbon density data were obtained through literature review methods, referring to existing studies. Subsequently, these density values were adjusted based on the region’s average annual precipitation and temperature, a method widely accepted by researchers [31,32]. Specifically, the C a b o v e , C b l o w , and C s o i l data for forest, cropland, and grassland were referenced from the survey data by Tang et al. [33], and the C a b o v e , C b l o w , and C s o i l data for impervious, water, and barren were referenced from the data used by Yang in studies with similar latitudes and longitude [34]. The adjustment method employed is used by local scholars in regions with similar latitudes and longitude [35]. Finally, the C d e a d value was derived from Delaney’s research findings, estimating C d e a d to be one-tenth of the C a b o v e value [36].
Land transition matrices are analytical tools that describe and quantify changes over time between different land use types, widely used in ecology, urban planning, and resource management. In our study, we opted to employ chord diagrams and Sankey diagrams to visually present the changes and dynamics in land use, leveraging their distinct advantages over traditional bar charts or flow maps. These diagrams offer a richer and more intuitive visual tool for understanding the complexity and dynamics of land use changes. Sankey diagrams, with arrows of varying widths representing transfer quantities between different land use types, make the primary paths of change and key transition points clear at a glance. This visual emphasis aids in the rapid identification of the most significantly changing land types, which is crucial for policy-making and scientific research. Chord diagrams, using sectors and chords where the width indicates the volume of transfer, provide an intuitive display of flow relationships between land types, particularly useful for showing changes over multiple time points. We utilized Origin (version 2024b) to create these diagrams, analyzing land use shifts from 2000 to 2020 at 5-year intervals and projecting land use changes under four scenarios for 2030. By systematically organizing and inputting land use data at various times, these visualization methods effectively reveal patterns and trends in land use changes, offering a clear perspective on land use dynamics. The selection of these two types of diagrams provides an intuitive display of quantitative data and qualitative analysis, enabling us to comprehensively analyze the patterns and trends in land use changes, which traditional bar charts or flow maps might not capture as effectively.
Spatial autocorrelation analysis is a statistical technique used to evaluate the spatial distribution patterns within data sets, encompassing both global and local assessments. The Moran’s I index, which measures global autocorrelation, yields values between −1 and +1. A value that is positive signifies a clustering pattern of similar values, while a negative value indicates a dispersion pattern of similar values. A value near zero implies that the spatial distribution is random and there is no significant autocorrelation. Local autocorrelation identifies associations between specific units and their neighbors through local Moran’s I, detecting local clustering phenomena. The Z-score and p-value provide statistical significance for Moran’s I, with the Z-score indicating the number of standard deviations from the expected value and the p-value testing the probability of the null hypothesis (no spatial autocorrelation). We performed spatial autocorrelation assessments on carbon storage and land use datasets spanning from 2000 to 2020 at intervals of five years, utilizing ArcGIS 10.8. This analysis enabled us to discern the spatial distribution patterns of both carbon storage and land use data, identify areas of aggregation, and assess the statistical significance of these aggregations.

2.2.2. Methods for Analyzing Driving Factors of Carbon Storage

The Geodetector is a spatial analysis statistical model that operates on the principle of spatial stratified heterogeneity, which posits that geographical phenomena tend to be similar within the same stratum but vary among different strata. This model has been extensively adopted across various research fields by scholars, such as climate change, forest carbon monitoring, and environmental metrology [37]. In our study, we employed the Geodetector model, along with nine pivotal factors, including DEM, Slope, Aspect, Temperature, Precipitation, GDP, POP, NTL, NDVI, to perform stratification, factor identification, and interaction analysis of carbon storage within our research region over the last two decades at 5-year intervals. The power of this method is its capacity to measure the impact of various factors regarding spatial variability in carbon storage, quantified by the q statistic. This enables us to identify the key factors shaping the pattern of carbon storage. By conducting a detailed analysis of both the individual and combined effects of these factors, we can achieve a more holistic understanding of the intricate dynamics behind changes in carbon storage.

2.2.3. Methods for Predicting Future Carbon Storage

The PLUS model, an acronym for Patch-generating Land Use Simulation, originated in 2020 as a result of a joint endeavor between the High-Performance Spatial Computational Intelligence Laboratory (HPSCIL), located at the School of Geography and Information Engineering, China University of Geosciences in Wuhan, and the National GIS Engineering Technology Research Center. This model, which leverages cellular automata (CA), is engineered to replicate land use/land cover (LULC) transformations at the individual patch scale. It combines the Land Expansion Analysis Strategy (LEAS) with the Cellular Automata based on Random Seed Patches (CARS) to model land use transformations. The LEAS module leverages machine learning techniques, such as random forests, to decipher the patterns and drivers behind land expansion, while the CARS module simulates the dynamic emergence and evolution of patches based on these probabilities. Furthermore, the PLUS model incorporates a Markov chain methodology for projecting land use volumes and is adept at modeling land use dynamics across diverse conditions [38].
By applying this model, the data we utilized includes LULC data from the years 2000, 2010, and 2020, as well as factor data corresponding to each year. We incorporated 12 key driving factors into our simulations, including Temperature, Precipitation, NDVI, DEM, Slope, POP, GDP, NTL, Distance to railways, Proximity to major roads, government seats, and rivers. Initially, we used land use change data from the first decade of the twenty-first century to predict the land use status for the second decade. We then compared these predictions with the actual land use statistics for the second decade to calculate the Kappa coefficient, thereby assessing the accuracy of our model. Subsequently, we conducted future land use simulations under several scenarios that reflect the current developmental trajectory of the study area: (a) NDS for Natural Development, (b) UDS for Urban Development, (c) ALPS for Arable Land Preservation, and (d) ECS for Ecological Conservation. This process enabled us to generate simulated land use raster data for the four scenarios. Finally, we utilized the InVEST model to estimate carbon storage under these scenarios and to analyze their spatiotemporal dynamics.

2.3. Data Collection and Preprocessing

  • Data collection.
The data used in this study are all publicly available and primarily sourced from various authoritative platforms (Table 1).
  • Carbon density preset.
The carbon density parameters used in the InVEST model are organized into a table (Table 2).
  • 2030 Land Use Scenarios Preset.
Land use projections for the future are established under four distinct scenarios, informed by the land transition matrix (as shown in Table 3), and are aligned with the research of Yang et al. [34], customized to fit local circumstances as detailed below:
(a) NDS (Natural Development Scenario): This scenario relies on historical land use patterns for its projections without imposing any new assumptions.
(b) UDS (Urban Development Scenario): Designed to accommodate accelerated urban expansion, this setting increases the probability of forests, grasslands, and cultivated lands being transformed into impervious surfaces by 50%. Conversion to impervious is considered a unidirectional process.
(c) ALPS (Arable Land Protection Scenario): Designed to limit the shift of arable land into different types, this setting decreases the likelihood of arable land changing to forests, grasslands, and water bodies by 30% relative to the NDS. The likelihood of arable land becoming impervious is also reduced by 30%, and the chance of it becoming unused land is completely eliminated.
(d) ECS (Ecological Conservation Scenario): Focused on maintaining ecological balance, this setting substantially reduces the likelihood of forests, grasslands, and water areas transitioning into other land categories. Notably, the probability of these areas becoming impervious surfaces is decreased by 90%, the chance of them being converted to cultivable land is lowered by 20%, and the odds of them becoming vacant land are diminished by 50%. This scenario places a strong emphasis on safeguarding forest areas, with forest land allowed to transition only into itself.
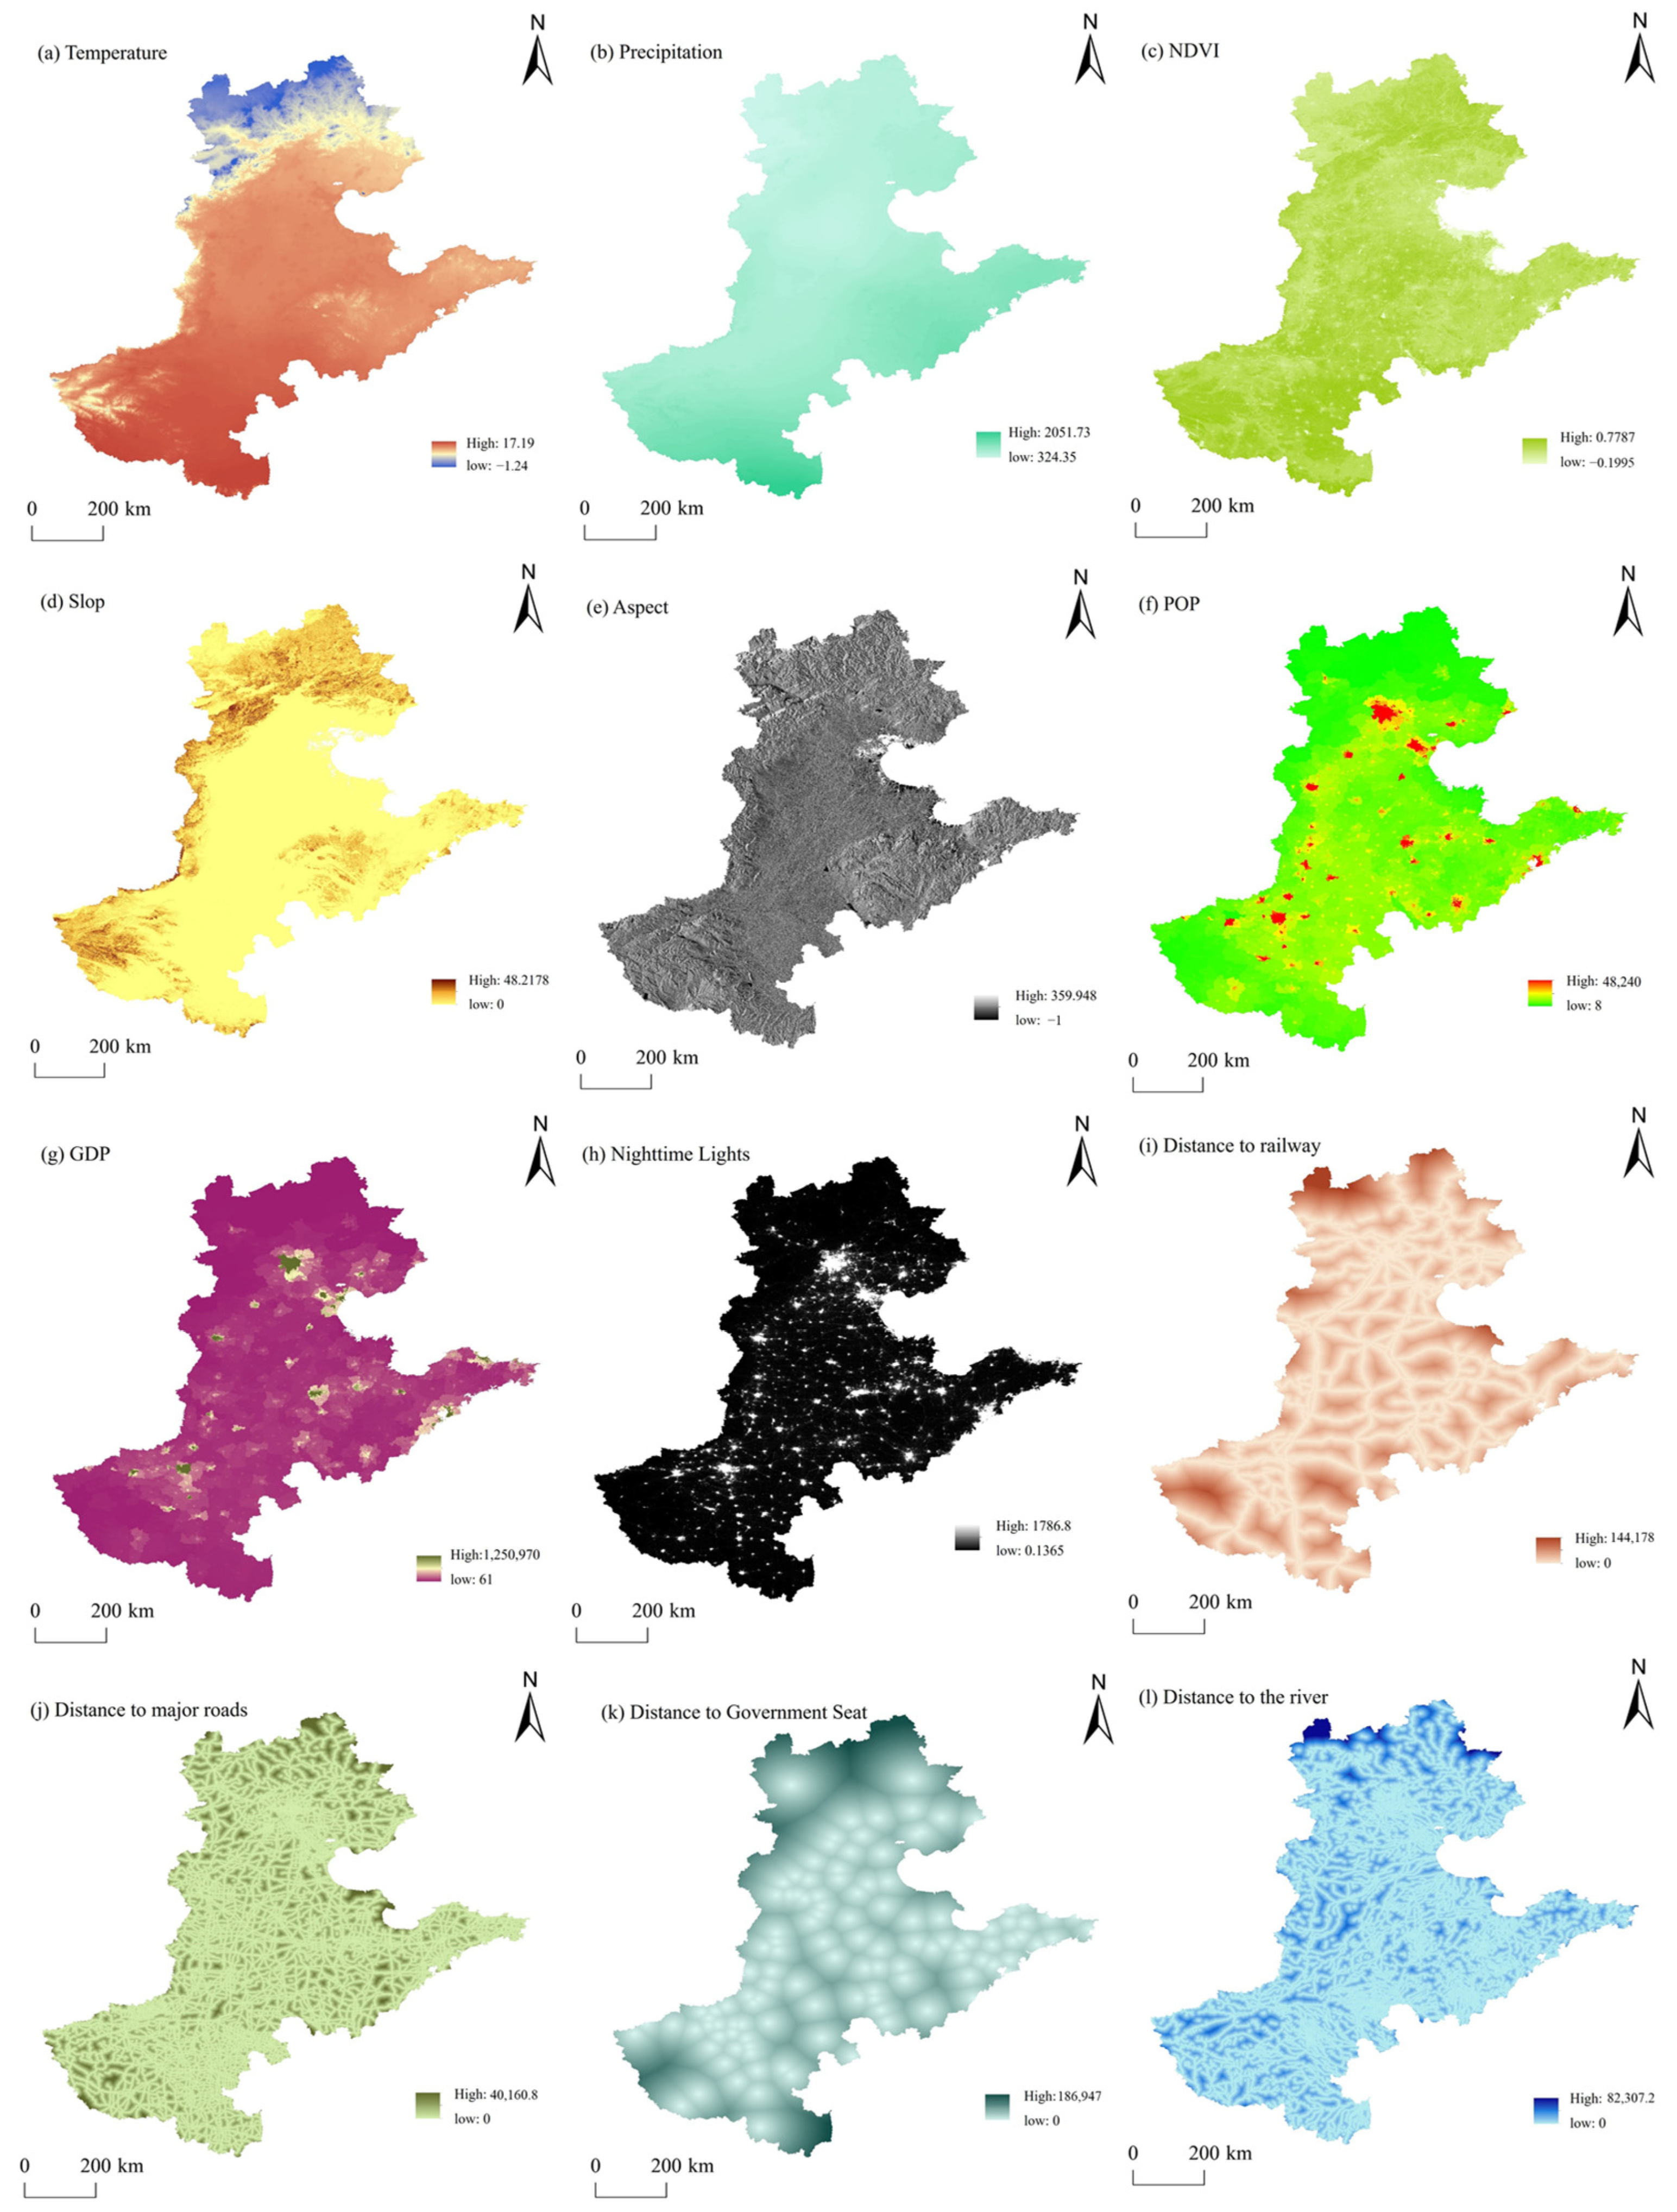
  • Preprocessing of driving factors.
We used ArcGIS 10.8 for preprocessing of driving factors; the projection coordinates are uniformly converted to “WGS_1984_UTM_Zone_51N”. The Euclidean distance tool is used to process the accessibility factors, and the driving factors are extracted using the mask extraction tool with a pixel size set to 300 × 300 m, resulting in uniformly parameterized raster data (Figure 3).

3. Results

3.1. Progression of Carbon Storage: A 20-Year Dynamic Review

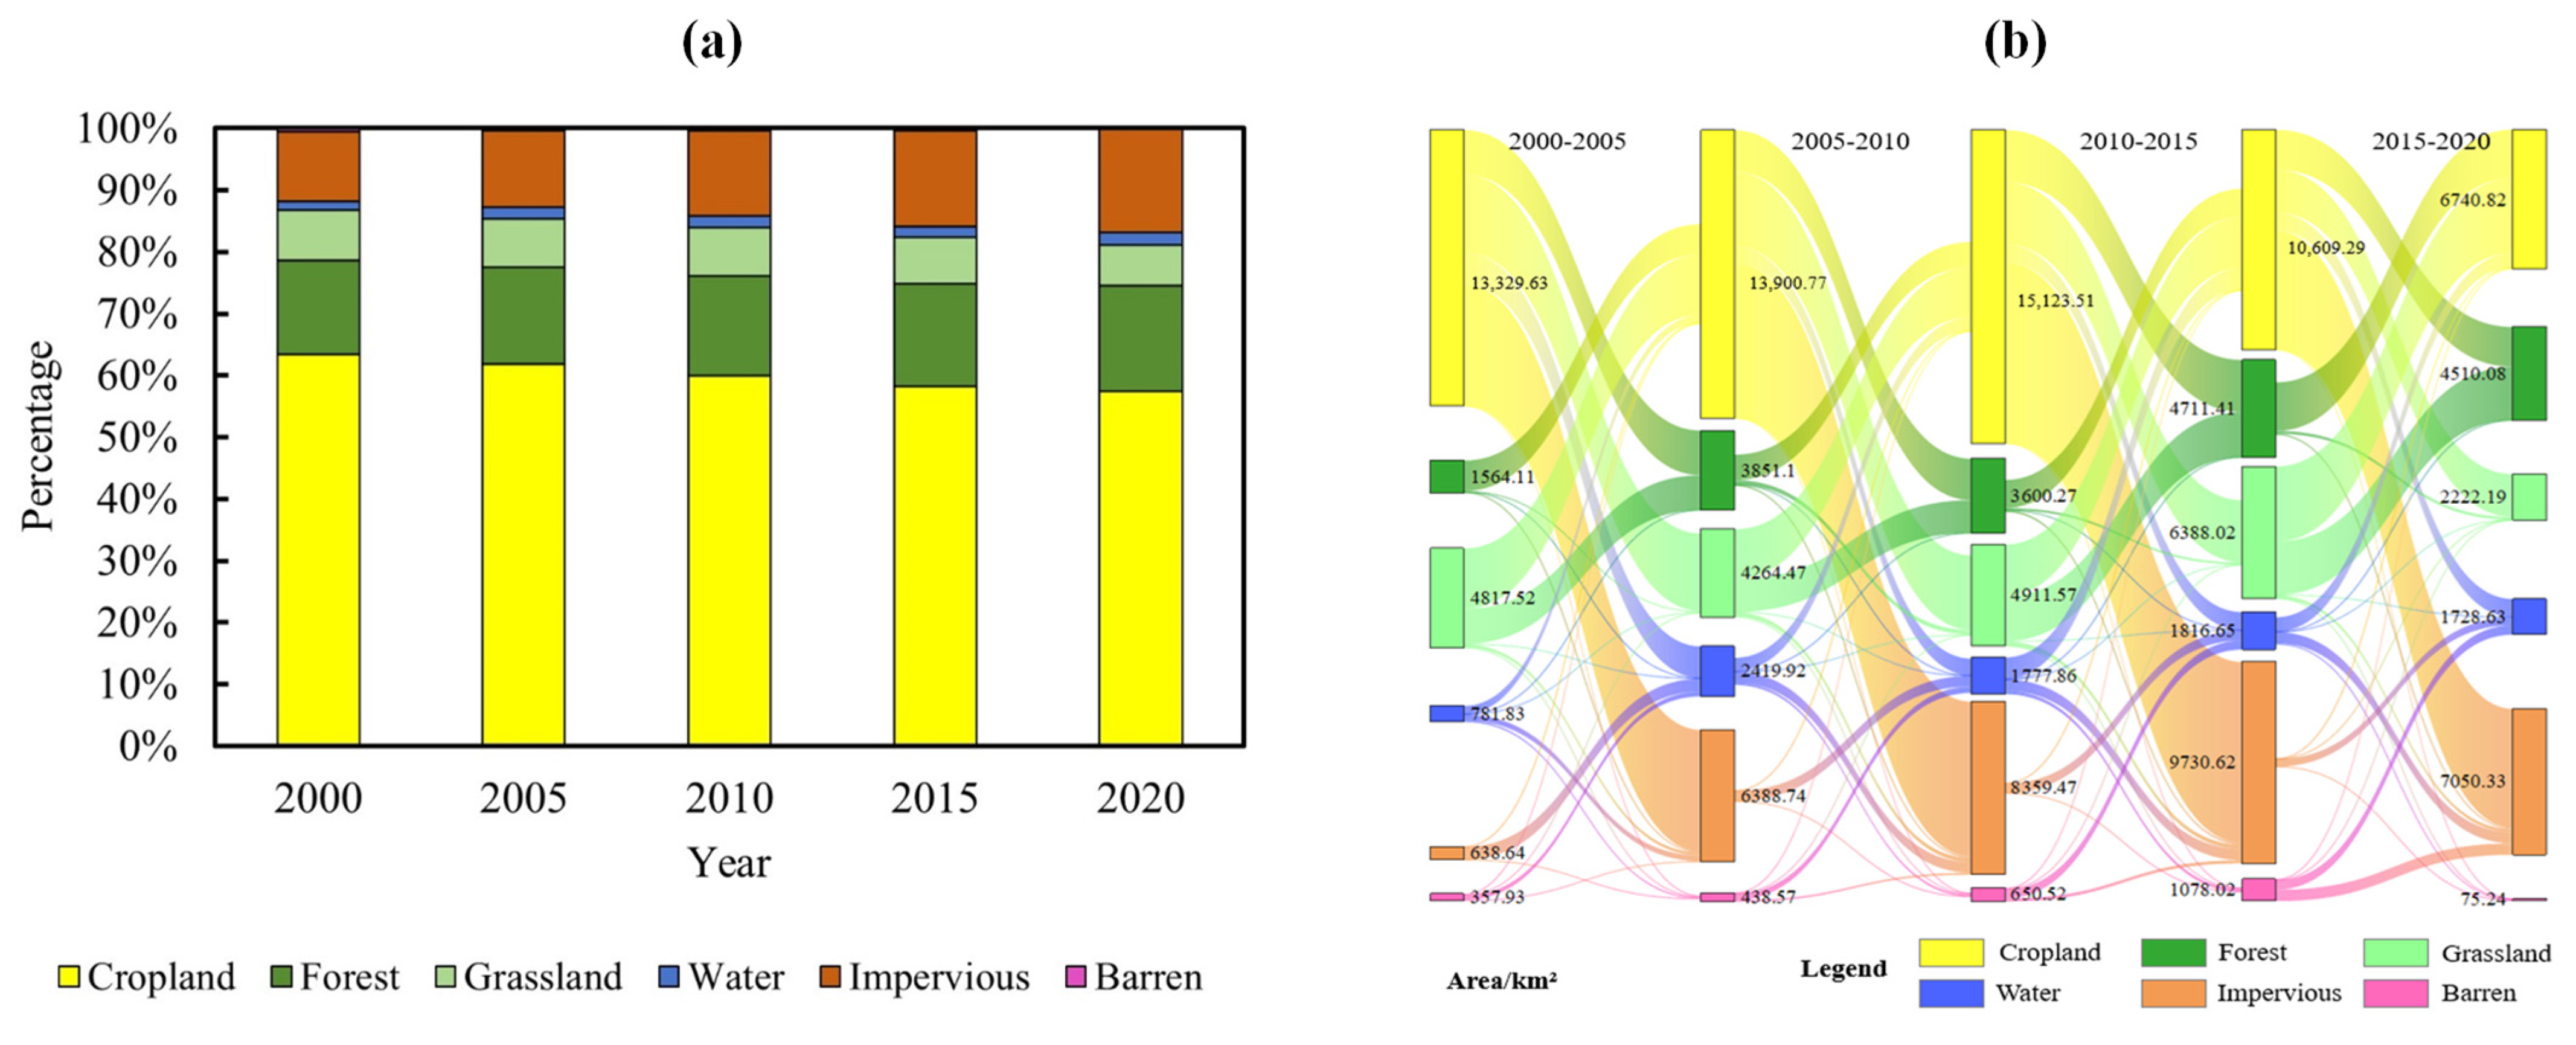
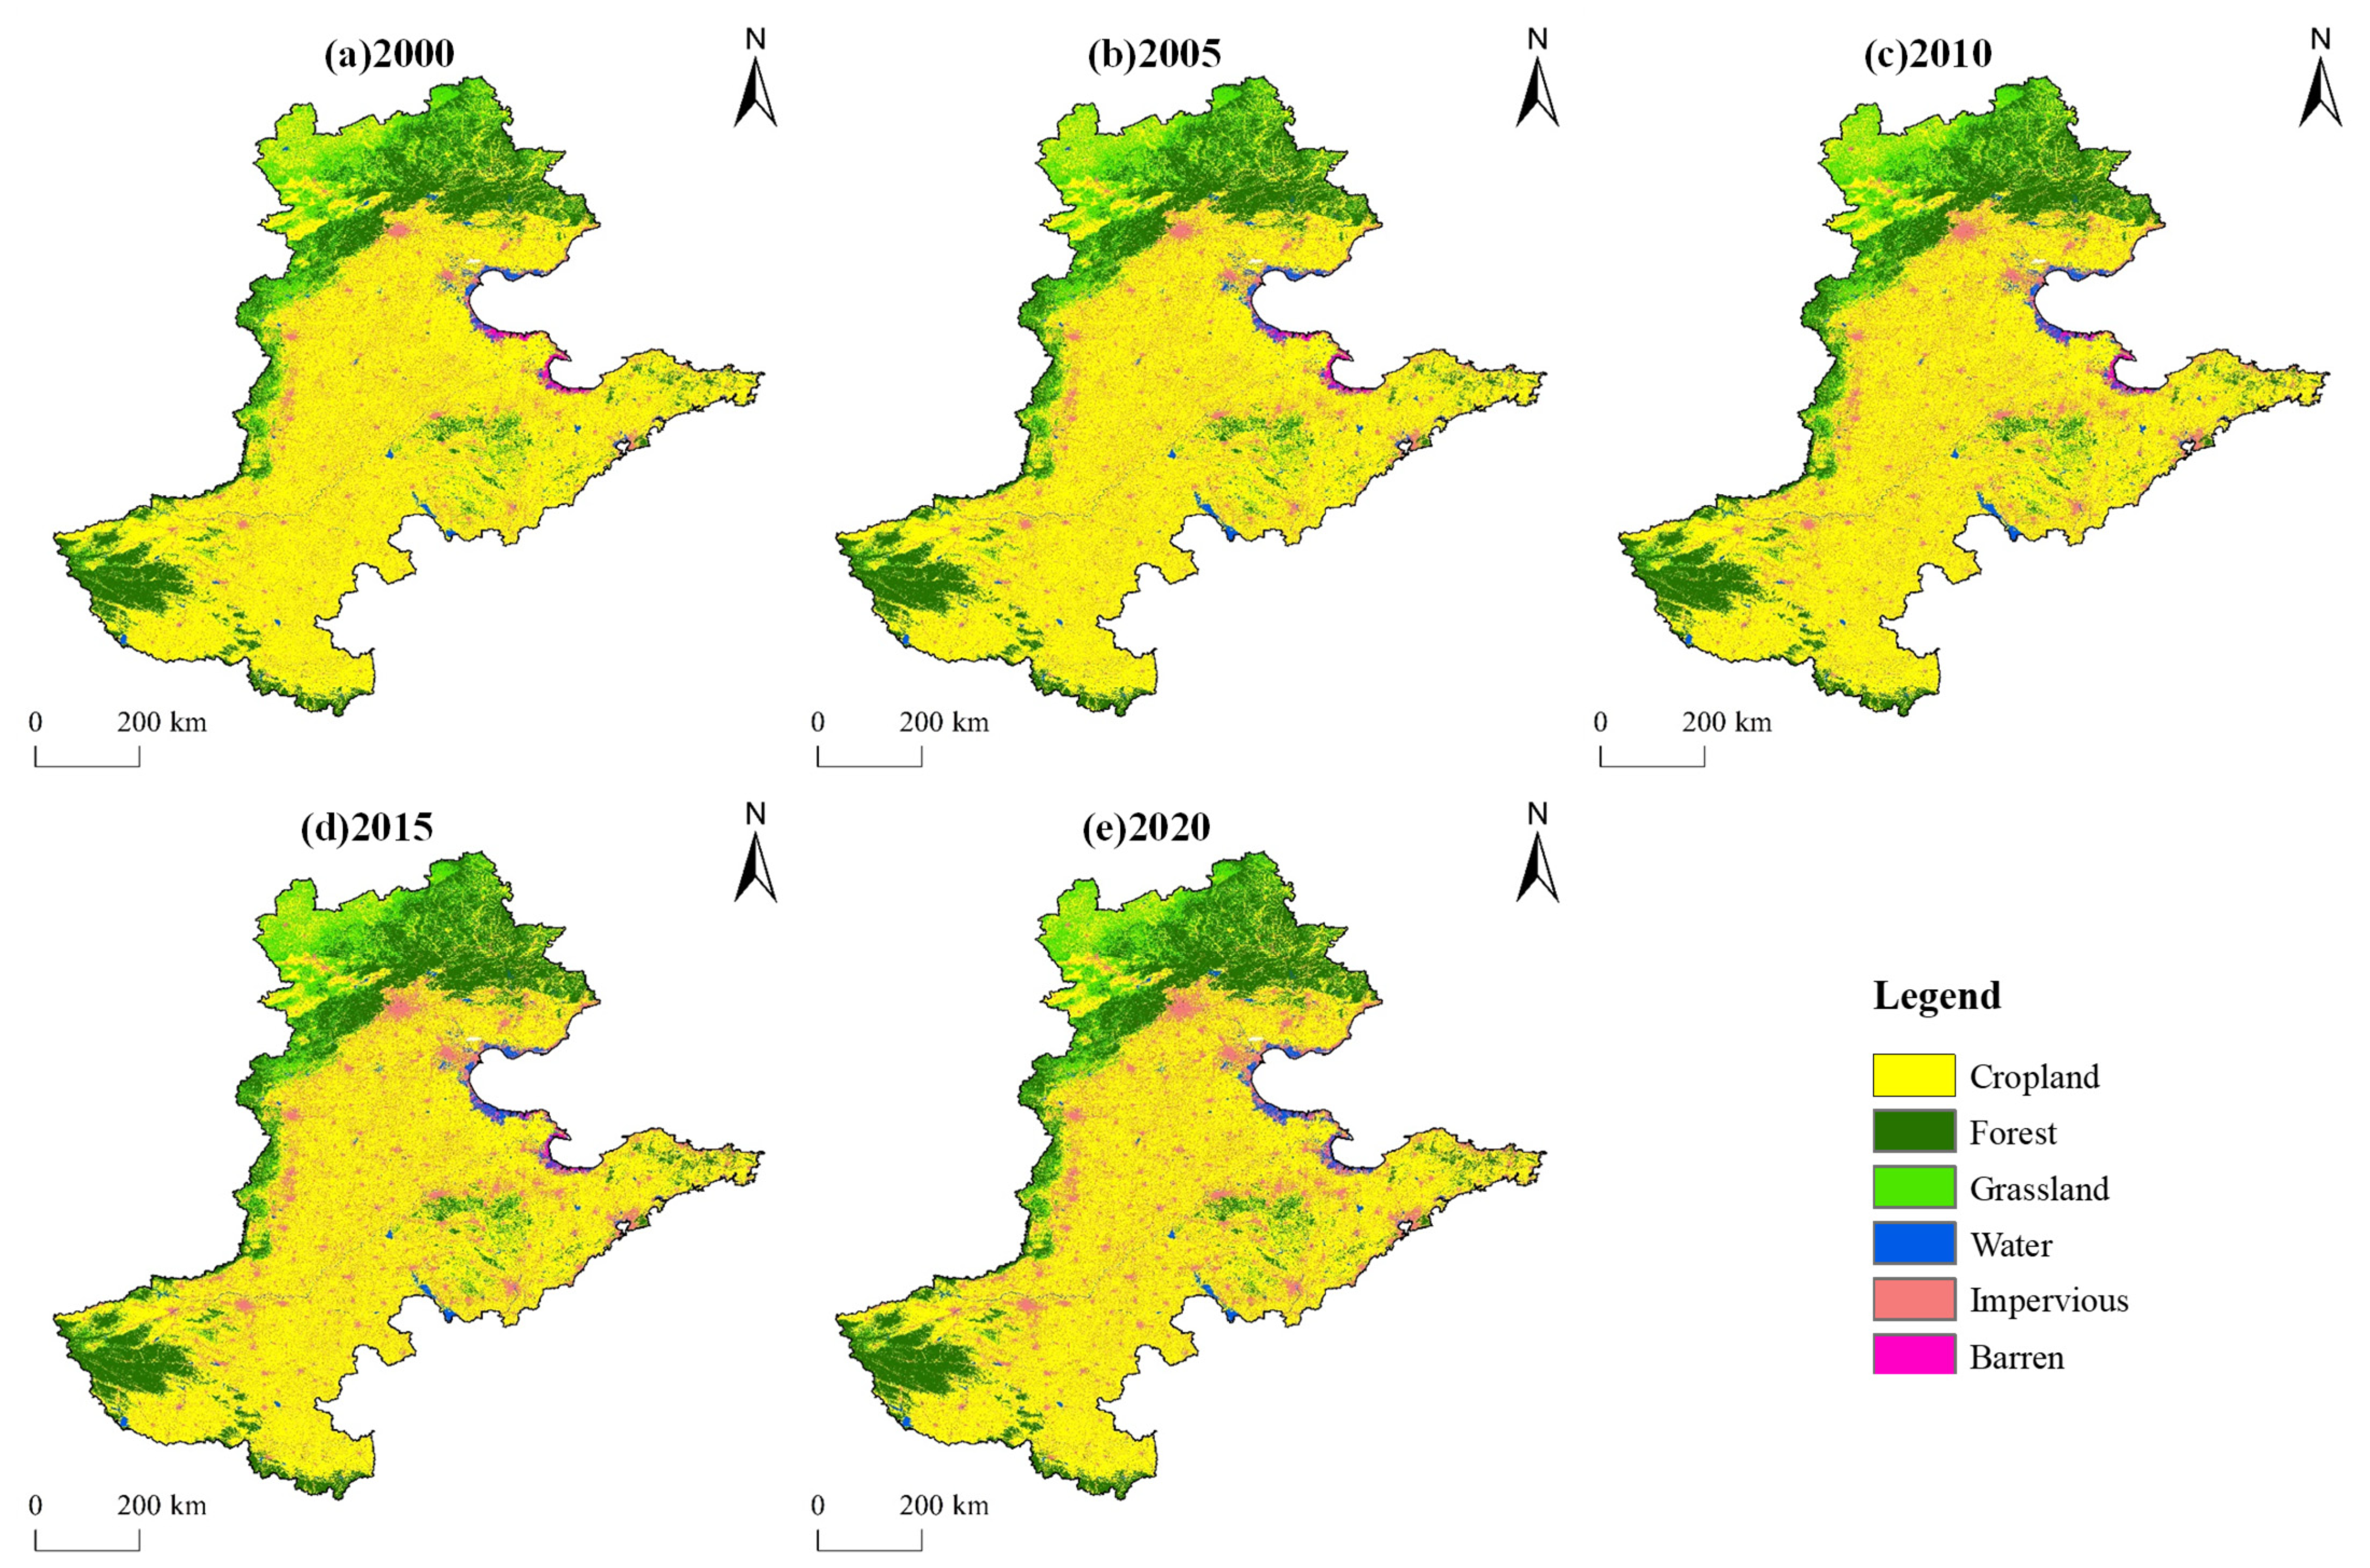
3.1.1. Spatial and Temporal Evolution of Land Use (2000–2020)

Between 2000 and 2020, the Huang-Huai-Hai Plain saw localized alterations in land use, yet the overall structure of land composition remained relatively stable (as shown in Figure 4). Cropland dominated the landscape, comprising over half of the total area, with forest and impervious surfaces being the next significant categories. Barren land was the least prevalent, with its proportion fluctuating between 0.09% and 0.45%. A characteristic shift in land use types indicates a continuous decline in cropland area from 2000 to 2020, amounting to a reduction of 32,141.88 km2, which represents 5.9% of the total land area. The most significant decreases were observed during the periods from 2000 to 2015, followed by a subsequent deceleration from 2015 to 2020. Over each 5-year period, the arable land decreased by 8495.55 km2, 9578.97 km2, 10,198.89 km2, 3868.47 km2, and 32,141.88 km2, accounting for 26.43%, 29.80%, 31.73%, and 12.04% of the total reduced area, respectively. The primary conversion was to impervious surfaces, followed by forest and grassland. The expanse of impervious areas kept growing, predominantly encroaching upon arable land, with a total increase of 29,502.27 km2 by 2020, a 47.88% rise compared to 2000. Forest and water body areas showed a consistent increase, while grassland areas continued to decrease, albeit minimally. Barren land exhibited a significant decrease, but considering the high degree of land exploitation in the region and the limited extent of infertile land, its impact on the overall land use dynamics is considered minimal.
Spatially (Figure 5), the composition of land use types is relatively stable, with cropland mainly concentrated in the extensive central plains. Forests are primarily located in the north, west, and southwest, while grasslands are predominantly in the northwest. Impervious is found in the central plains and coastal regions, water bodies are sporadically distributed, and barren land is scattered along the coast, making up a very small proportion of the total area.

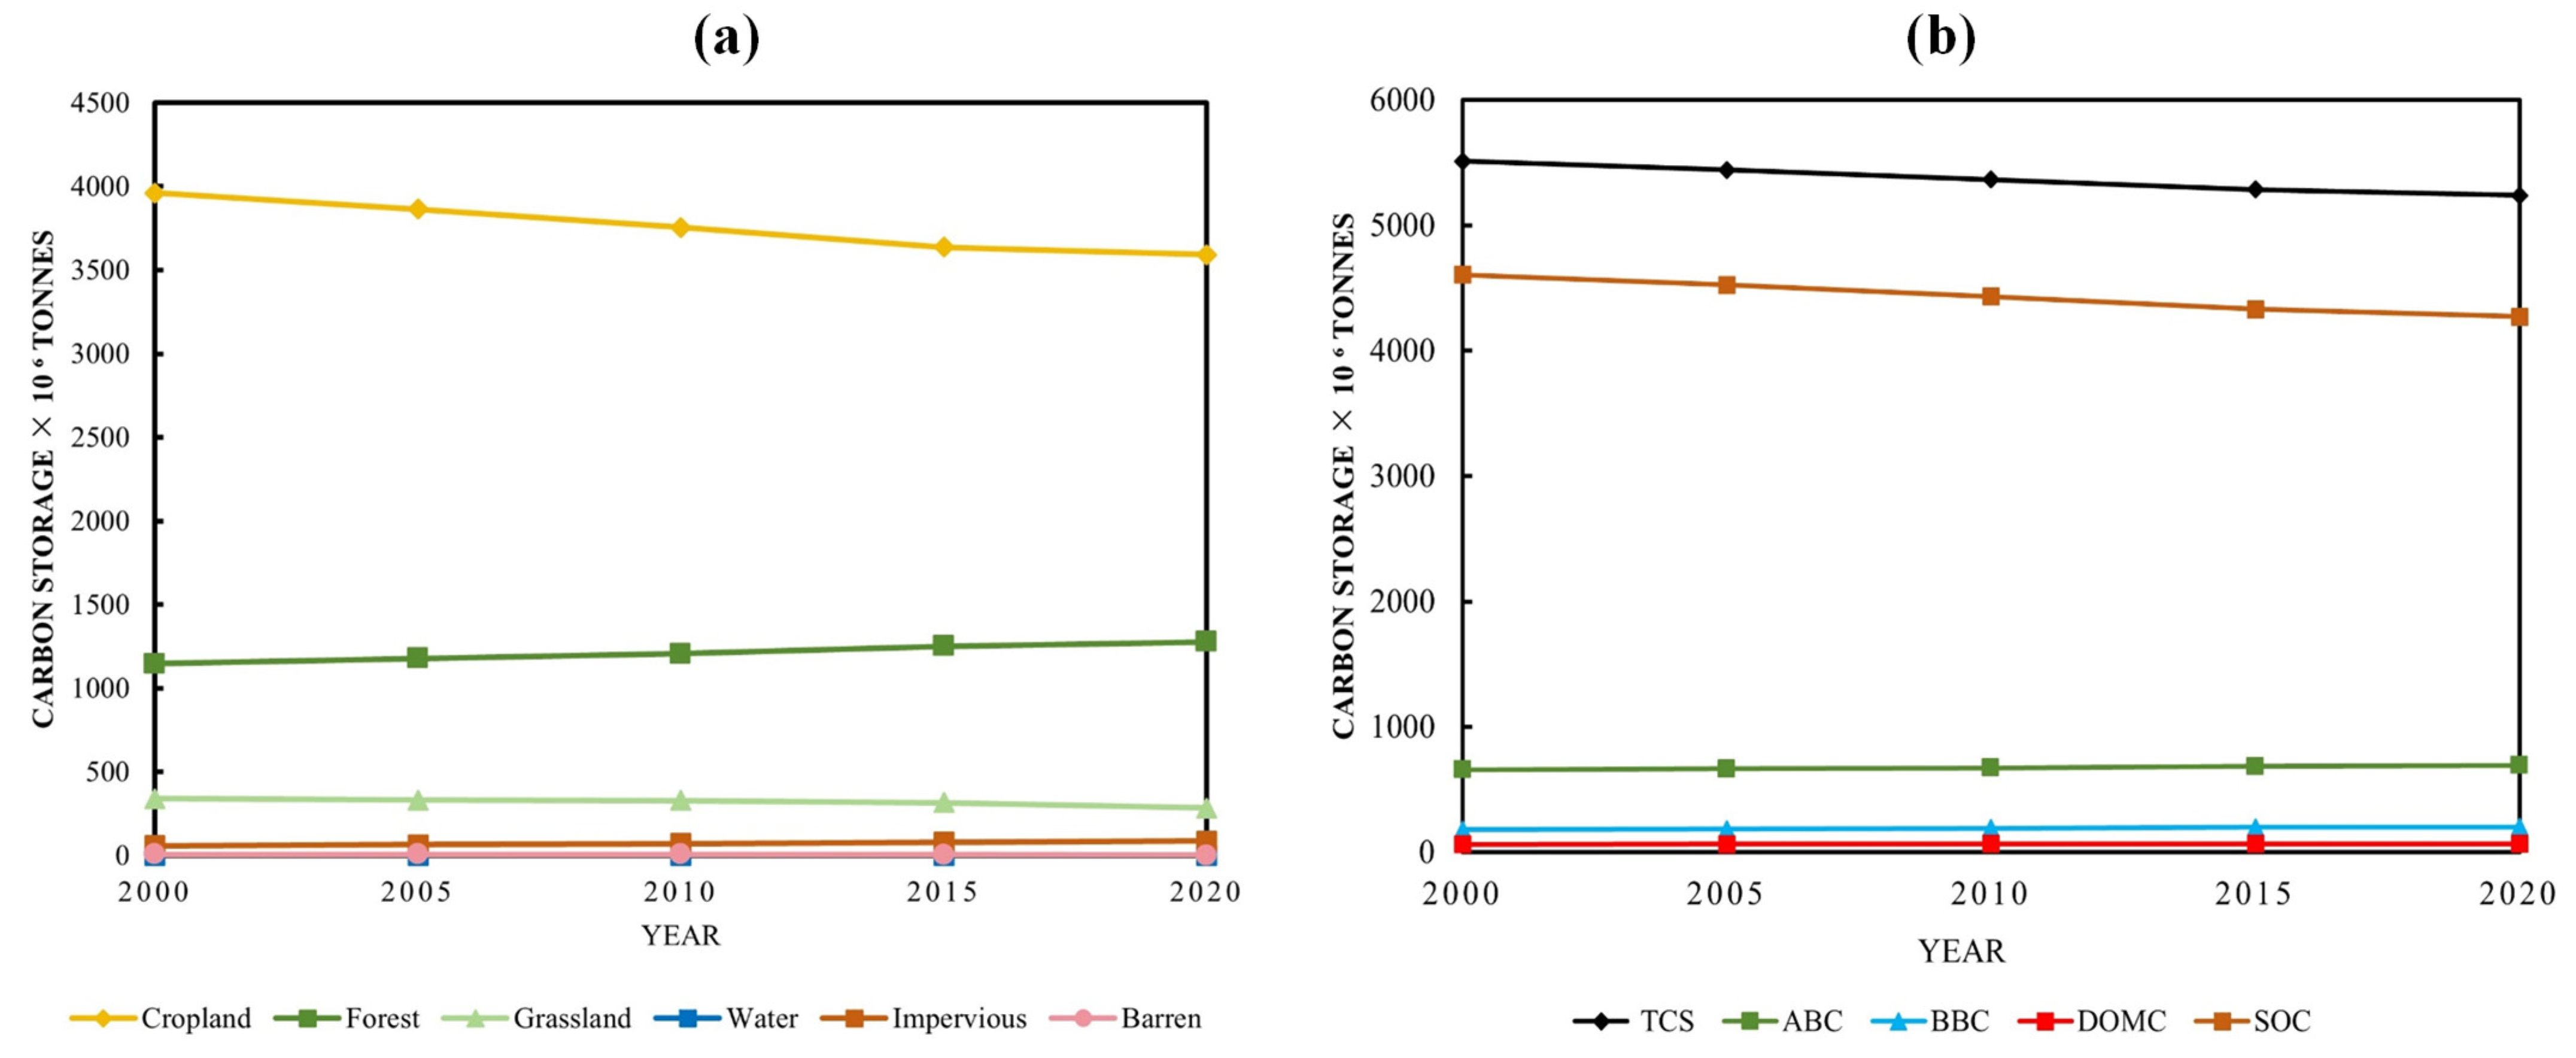
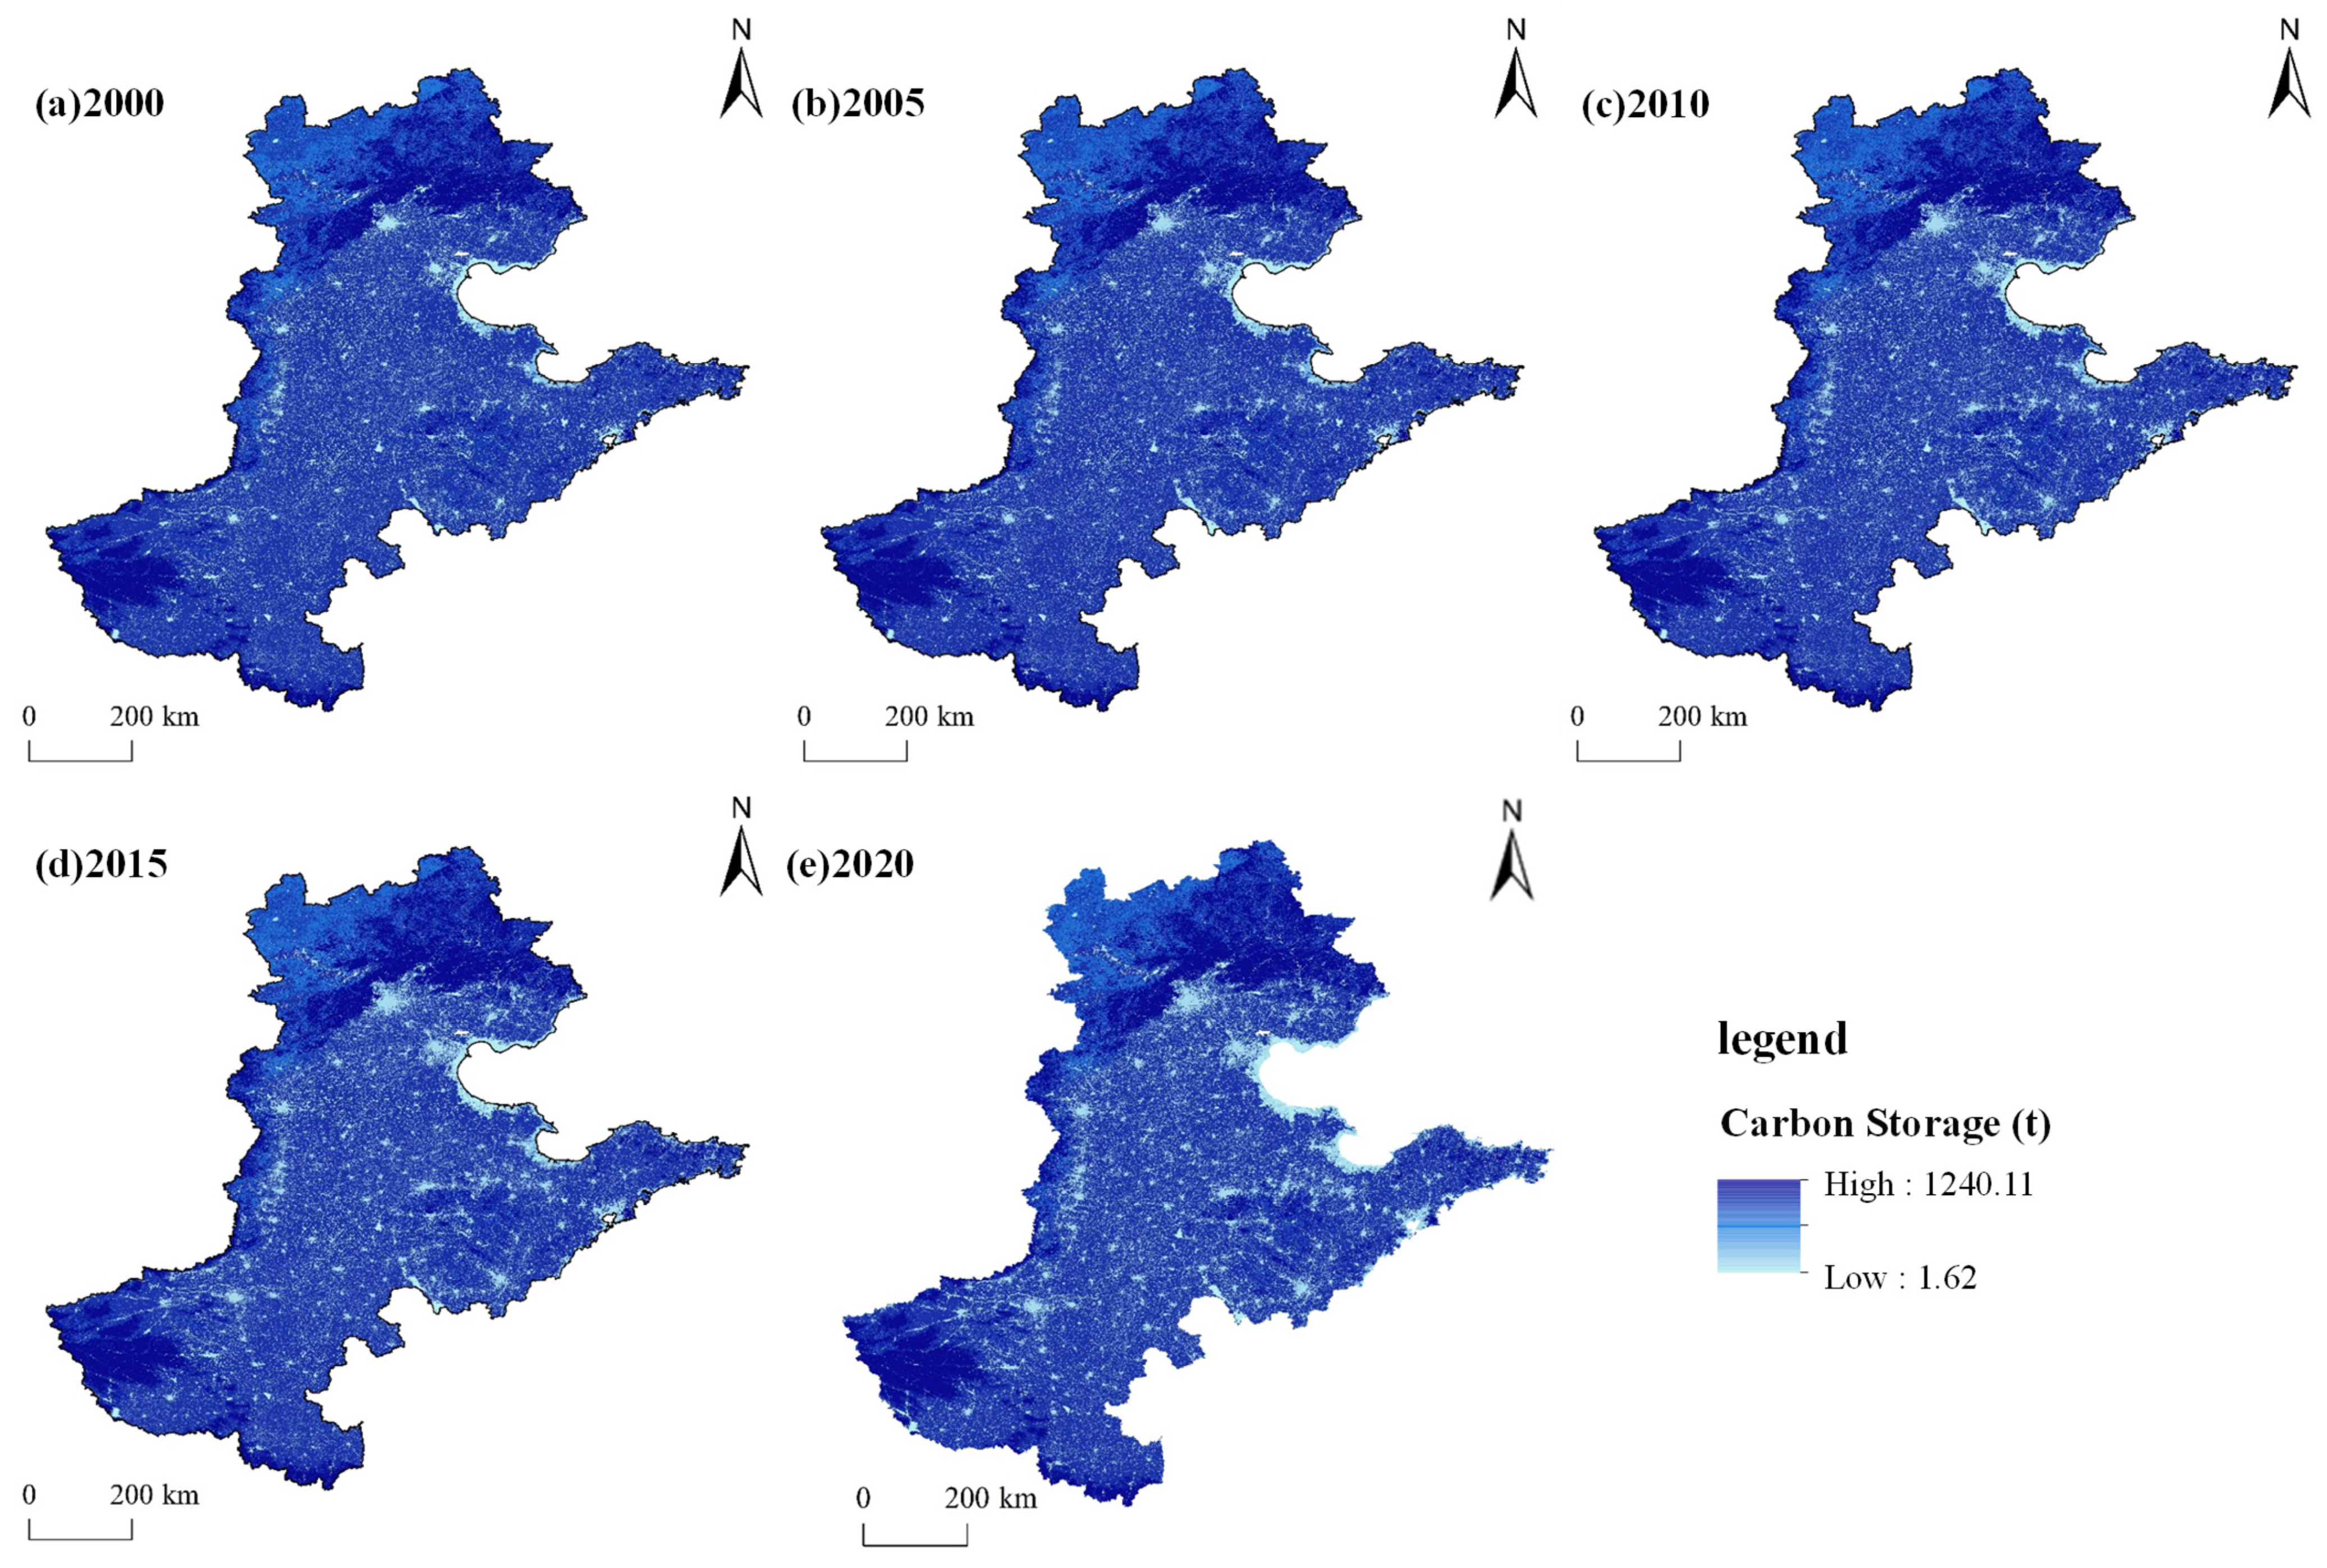
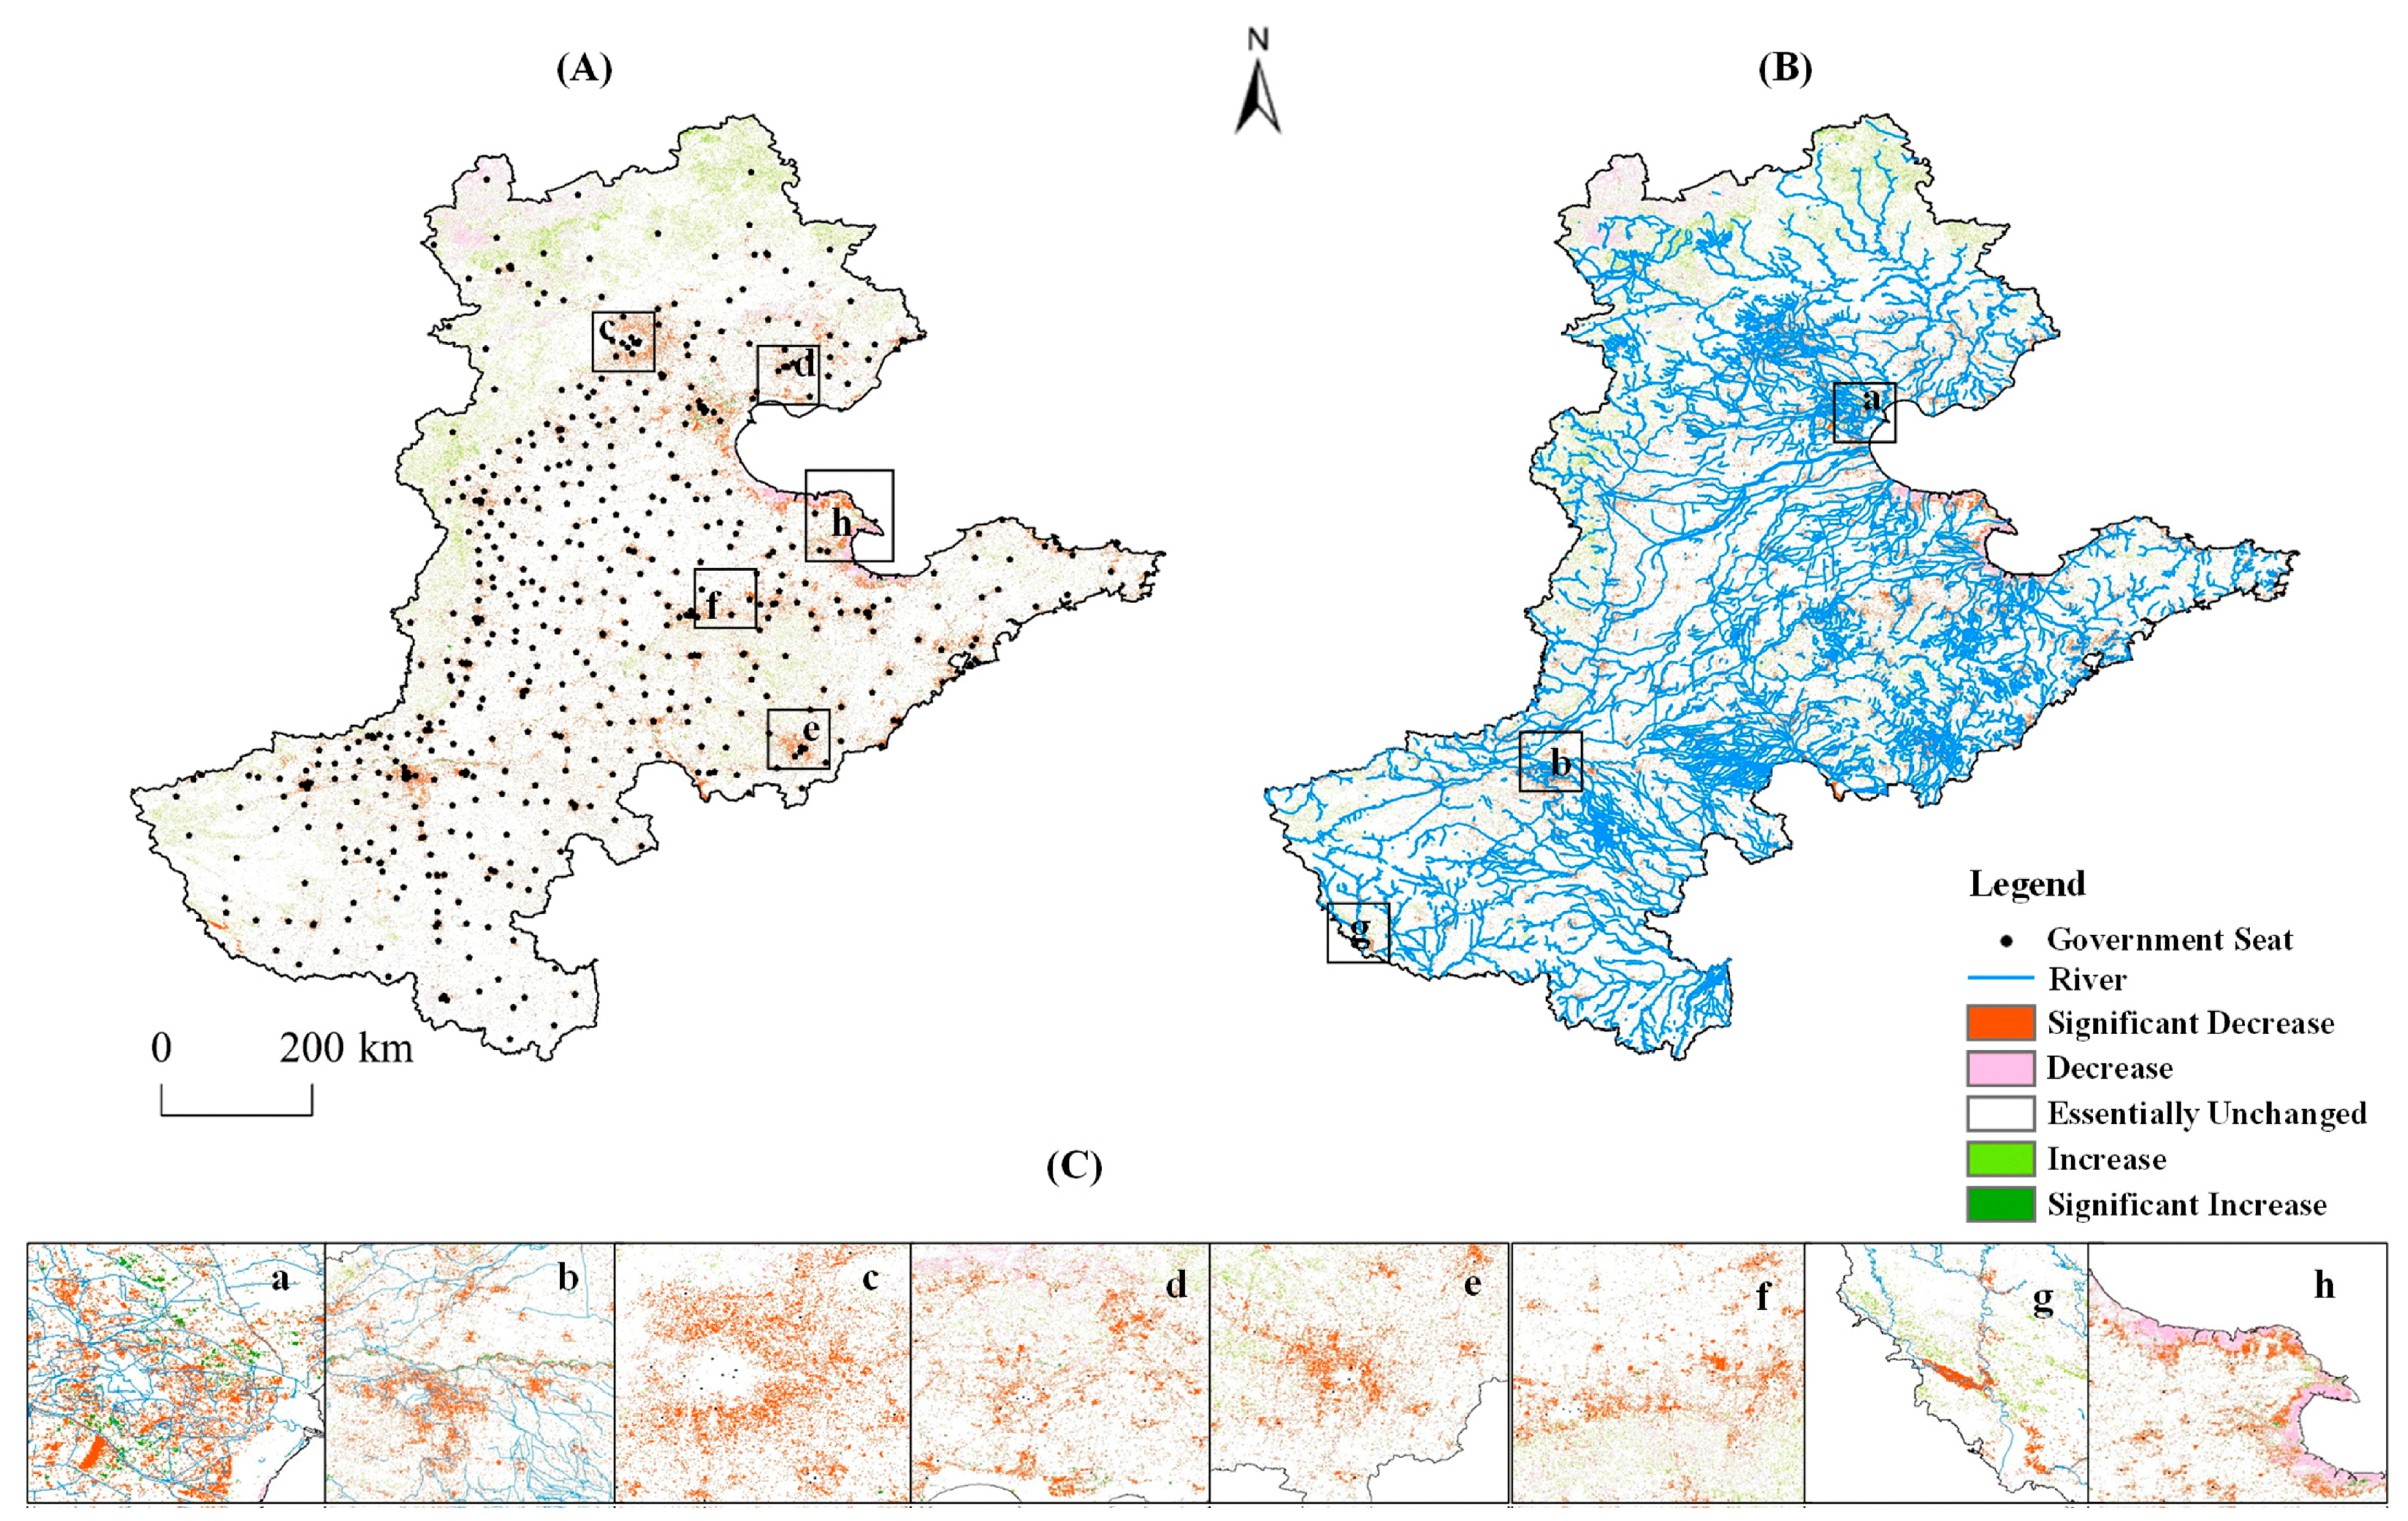
3.1.2. Spatiotemporal Variations in Carbon Storage During the First Two Decades of the 21st Century

From the turn of the millennium to the close of the 2020s, the Huang-Huai-Hai Plain experienced a downward trajectory in its carbon storage capacity, with an overall decline of 272.79 million metric tons, representing a reduction of nearly 4.9% relative to the initial year of 2000. This decline is mainly due to changes in land use configurations.
Upon examining the carbon storage of different land types, it is evident that cropland experienced the most significant decrease (refer to Figure 6a), reducing by 369.12 million metric tons, a decline of 9.32%. Grassland decreased by 56.38 million metric tons, a drop of 16.63%. In contrast, forest area increased by 130.7 million metric tons, a gain of 11.4%. Impervious surfaces increased by 27.82 million metric tons, an increase of 47.88%. There was little change in water bodies, while barren land decreased by 5.86 million metric tons.
With respect to the various carbon reservoirs (as depicted in Figure 6b), Soil Organic Carbon (SOC) predominates, comprising between 81.56% and 83.59% of the Total Carbon Storage (TCS). Aboveground Biomass Carbon (ABC) accounts for roughly 11.95% to 13.25%. The contributions of Belowground Biomass Carbon (BBC) and Dead Organic Matter Carbon (DOMC) are comparatively minor, at approximately 3.26% to 3.87% and 1.2% to 1.3%, respectively. The growth in ABC and DOMC is largely attributed to the forest area expansion, which enhances carbon sequestration in the ABC stratum. Conversely, the decline in carbon storage in other strata is mainly due to the shrinking cropland and the concurrent rise in impervious surfaces. Given that cropland is the predominant land type and the principal carbon reservoir in the region, these changes result in a decrease in TCS.
Regarding the pace of transformation, the TCS decreased by approximately 1.25% from 2000 to 2005, 1.43% from 2005 to 2010, 1.49% from 2010 to 2015, and 0.87% from 2015 to 2020. The decline was more rapid in the first three periods, showing a slow trend in the last period.
Examining the spatial distribution (refer to Figure 7), the carbon storage across the Huang-Huai-Hai Plain during the first two decades of the twenty-first century exhibits a consistent pattern. Regions with higher carbon storage, represented by high-value pixels, are predominantly located in the northern, western, and southwestern areas. Conversely, areas with lower carbon storage, indicated by low-value pixels, are chiefly found in the central plains, which are also the urban zones depicted on the map and have been progressively expanding over the years.
Analyzing the changes in the spatial arrangement of carbon storage from 2000 to 2020, the Natural Breaks classification technique (also known as the Jenks method in ArcGIS 10.8) was applied to segment the variations in carbon storage into five distinct categories: Significant Decrease, Decrease, Stable, Increase, and Significant Increase (as shown in Figure 8). The most prominent changes are observed in the categories of Significant Decrease, Decrease, Stable, and Increase. Regions exhibiting Significant Increase are primarily situated in areas labeled a and b in Figure 8, adjacent to river systems. These areas are attributed to extensive reforestation initiatives in the Beijing-Tianjin region [51] and ecological rehabilitation efforts in the Yellow River basin [52], which have significantly contributed to the increase in carbon sequestration. Areas showing an increase are mainly in the northern, western, and northwestern sectors where carbon storage levels are higher, with occasional clusters along central rivers. Stable areas are extensively present across the agricultural zones of the central plains, indicating regions where carbon storage has remained relatively constant. The decrease is largely focused in region h of the figure, while regions of Significant Decrease are associated with urban centers and administrative hubs, with key locations being a, b, c, d, e, and f. These areas have experienced a notable reduction in carbon storage, likely due to urban expansion and land use changes. Region g has undergone land-type transformations due to the expansion of river channels as part of the China South-to-North Water Diversion Project [53], which has also influenced the local carbon storage dynamics.

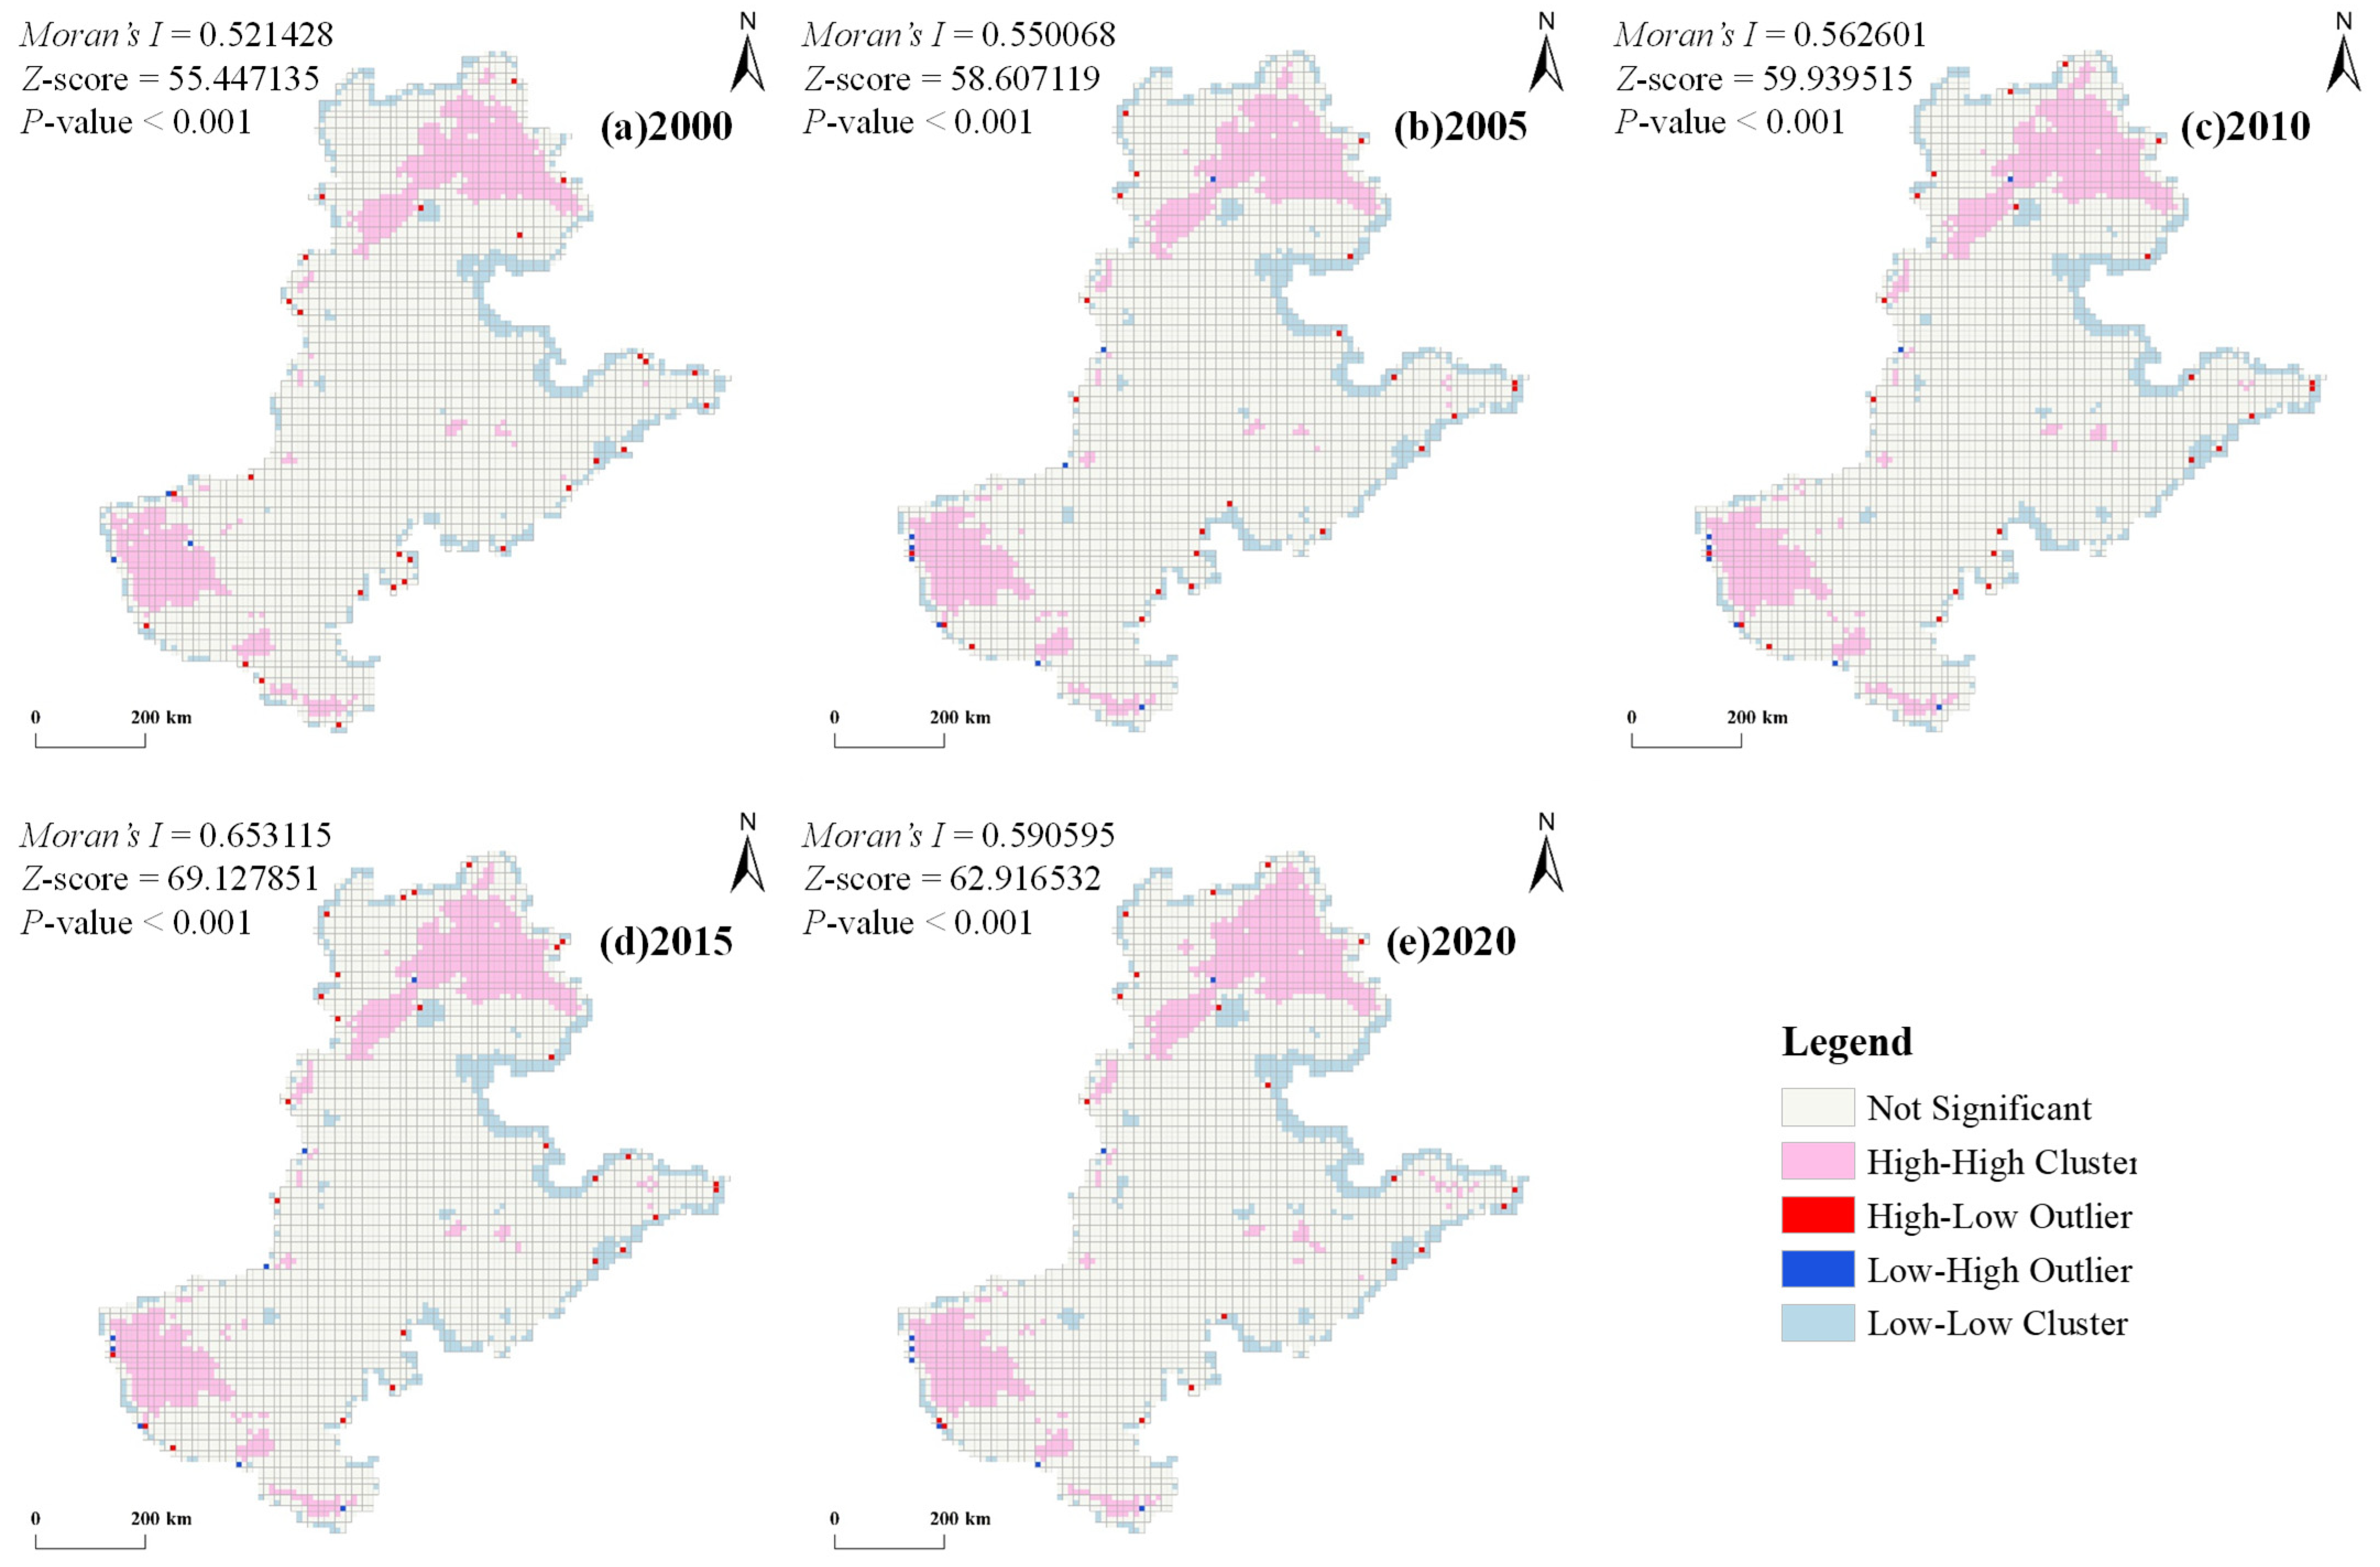
3.1.3. Spatial Autocorrelation Analysis of Carbon Storage

In the spatial autocorrelation analysis of carbon storage from 2000 to 2020 (as shown in Figure 9), the Moran’s I values for the Huang-Huai-Hai Plain across the five periods were all positive, specifically recording 0.521428, 0.550068, 0.562601, 0.653115, and 0.590595. This positive trend indicates a distinct spatial clustering effect in carbon storage across the periods in question. Notably, Moran’s I index rose from 0.521428 in 2000 to a peak of 0.653115 in 2015, followed by a minor retreat to 0.590595 in 2020. This overall ascending trend, with a slight dip in the final interval, suggests that the spatial clustering of carbon storage intensified over the two decades, with some variability noted in the last five years. The Z-scores for each year significantly exceeded the critical values of the standard normal distribution, and the p-values were nearly zero, which further substantiates the statistical significance of the observed autocorrelation.
Local autocorrelation analysis offers a more nuanced view of spatial patterns compared to global autocorrelation, facilitating the identification of distribution patterns and trends of carbon storage in specific locales. During the first two decades of the 21st century, the geographic concentration of carbon storage across the Huang-Huai-Hai Plain showed a marked clustering pattern. High carbon storage zones were consistently dense in the northern, northeastern, and southwestern sectors of the plain, whereas low carbon storage areas were sparser and more dispersed, mainly along the eastern coastal regions. The concentration of high carbon storage areas was most pronounced in 2015, with a slight reduction noted by 2020. These fluctuations may be attributed to changes in land use, agricultural practices, ecological restoration initiatives, or other environmental management interventions within the region. The gray areas on the map represent regions where there is no significant autocorrelation, indicating a random distribution of carbon storage without a discernible clustering pattern.

3.2. Drivers of Carbon Storage Analysis

3.2.1. Single-Factor Exploration Results

The outcomes of the GeoDetector single-factor analysis—depicted in Figure 10—demonstrate that the nine driving factors identified in this study exert diverse influences on the spatial arrangement of carbon storage across the Huang-Huai-Hai Plain. However, the most significant explanatory factors remain consistent across different periods. The top four influencing factors on carbon storage in the Huang-Huai-Hai Plain are NDVI (mean value 0.1306), Nighttime Lights (NTL, mean value 0.1252), POP (mean value 0.0827), and GDP (mean value 0.0863). NDVI, an indicator of vegetation cover, is directly related to the carbon sequestration capacity of vegetation. The NDVI value decreased in 2015 but rebounded in 2020. NTL, which is associated with the degree of urbanization and mirrors the probable consequences of human actions on carbon storage, showed a continuous increase from 2000 to 2020, indicating an acceleration in urbanization and an increase in human activities that affect carbon storage through changes in land use. The influence values of GDP and POP have continuously increased over these periods, indicating that economic growth may affect carbon storage through changes in land use. The last three influencing factors are Temperature (mean value 0.0357), Aspect (mean value 0.0212), and Precipitation (mean value 0.0102). Temperature and Precipitation showed increases in 2015 and 2020, possibly indicating a trend of climate warming. This could influence plant growth and the breakdown of organic soil compounds, consequently impacting carbon sequestration. However, the overall impact of these three factors is relatively small.

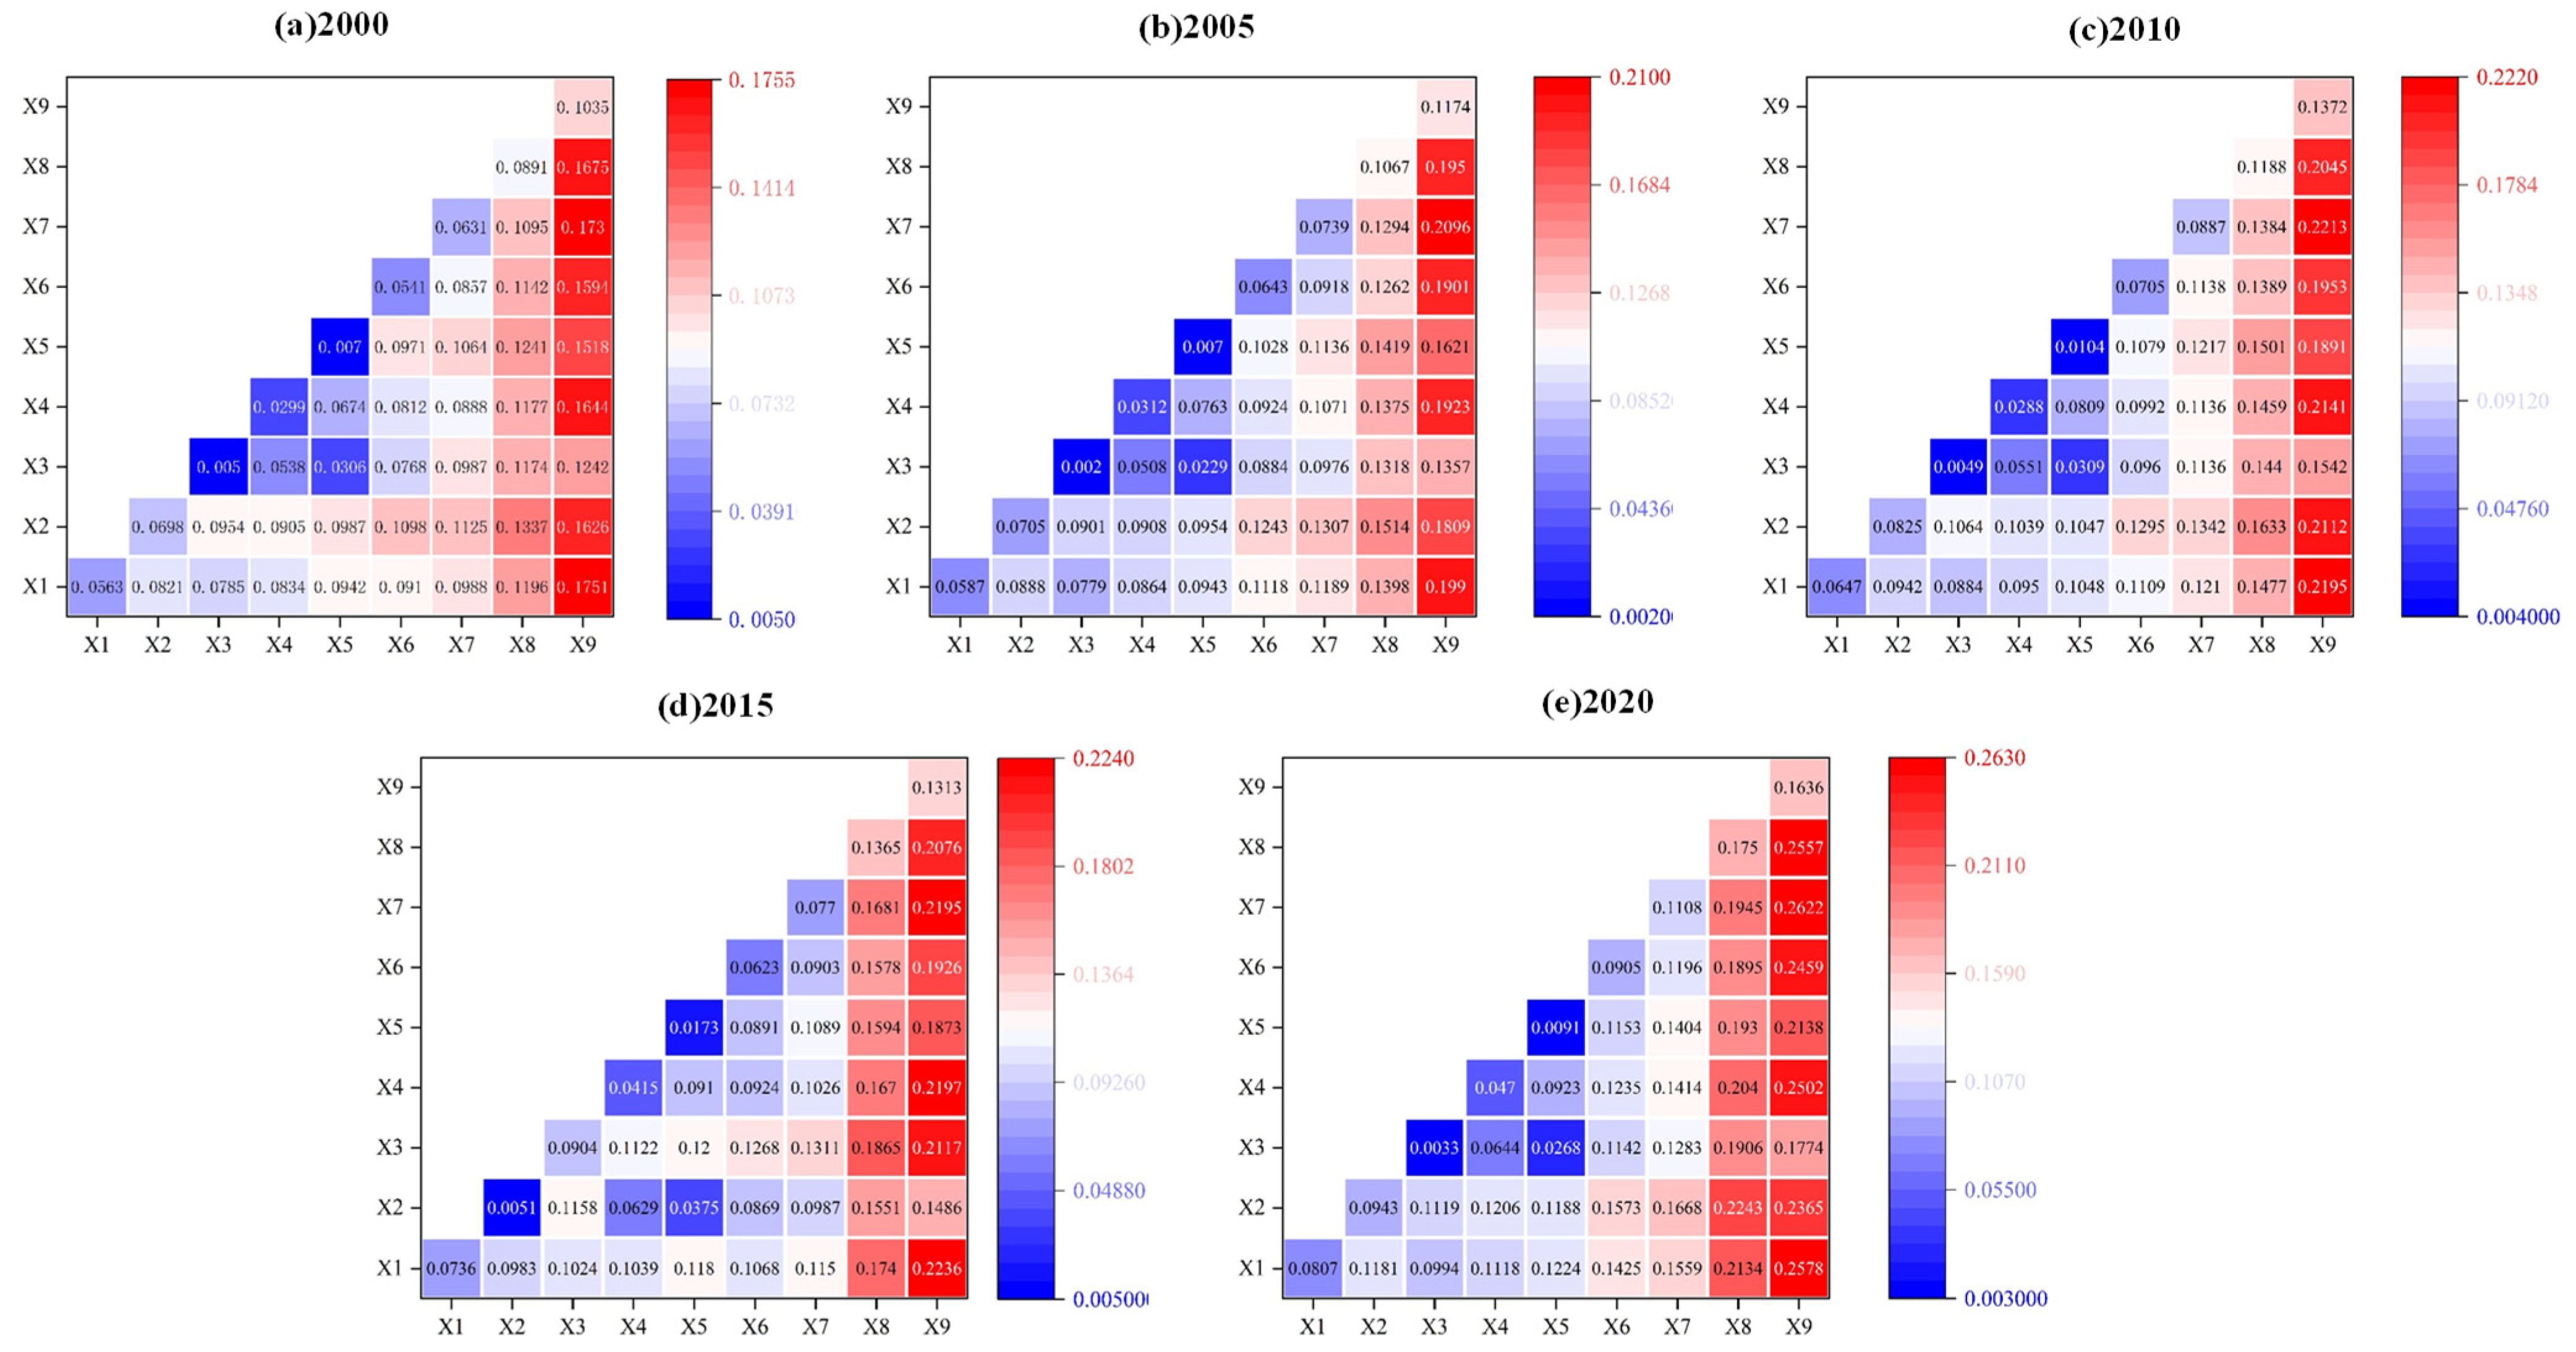
3.2.2. Results of the Dual-Factor Interaction Exploration

The dual-factor exploration results from the Geodetector identify five types of interactive effects: non-linear weakening, single-factor non-linear weakening, dual-factor enhancement, independence, and non-linear enhancement. The interactive factor exploration of the Huang-Huai-Hai Plain during the first two decades of the 21st century, as illustrated in Figure 11, reveals that the cumulative influence of any pair of driving factors holds greater explanatory strength regarding the spatial variation in carbon storage compared to the impact of a solitary driving factor. All observed results are either dual-factor enhancements or non-linear enhancements, with no instances of non-linear weakening, single-factor weakening, or independent effects. The most influential interactive type in the region from 2000 to 2020 is the interaction between NDVI and slope aspect, suggesting its dominance. Following closely is the interplay among NTL and other factors, which is also a significant factor affecting the spatial differentiation of carbon storage.
Throughout the first two decades of the 21st century, the effect of economic development (GDP), population growth (POP), and Nighttime Lights (NTL) on carbon storage has progressively increased. Concurrently, the interactive effects of vegetation cover (NDVI) with topography (DEM) and climate factors (Temperature and Precipitation) have also demonstrated their significance in the variation of carbon storage. Particularly in 2010 and 2020, the interactive effect of GDP with NDVI is very strong, indicating that economic development significantly influences vegetation cover and carbon storage. The interaction between POP and Nighttime Lights is also robust, reflecting the relationship between population growth, urbanization, and their impact on carbon storage.

3.3. Carbon Storage Forecast for the Third Decade of the 21st Century

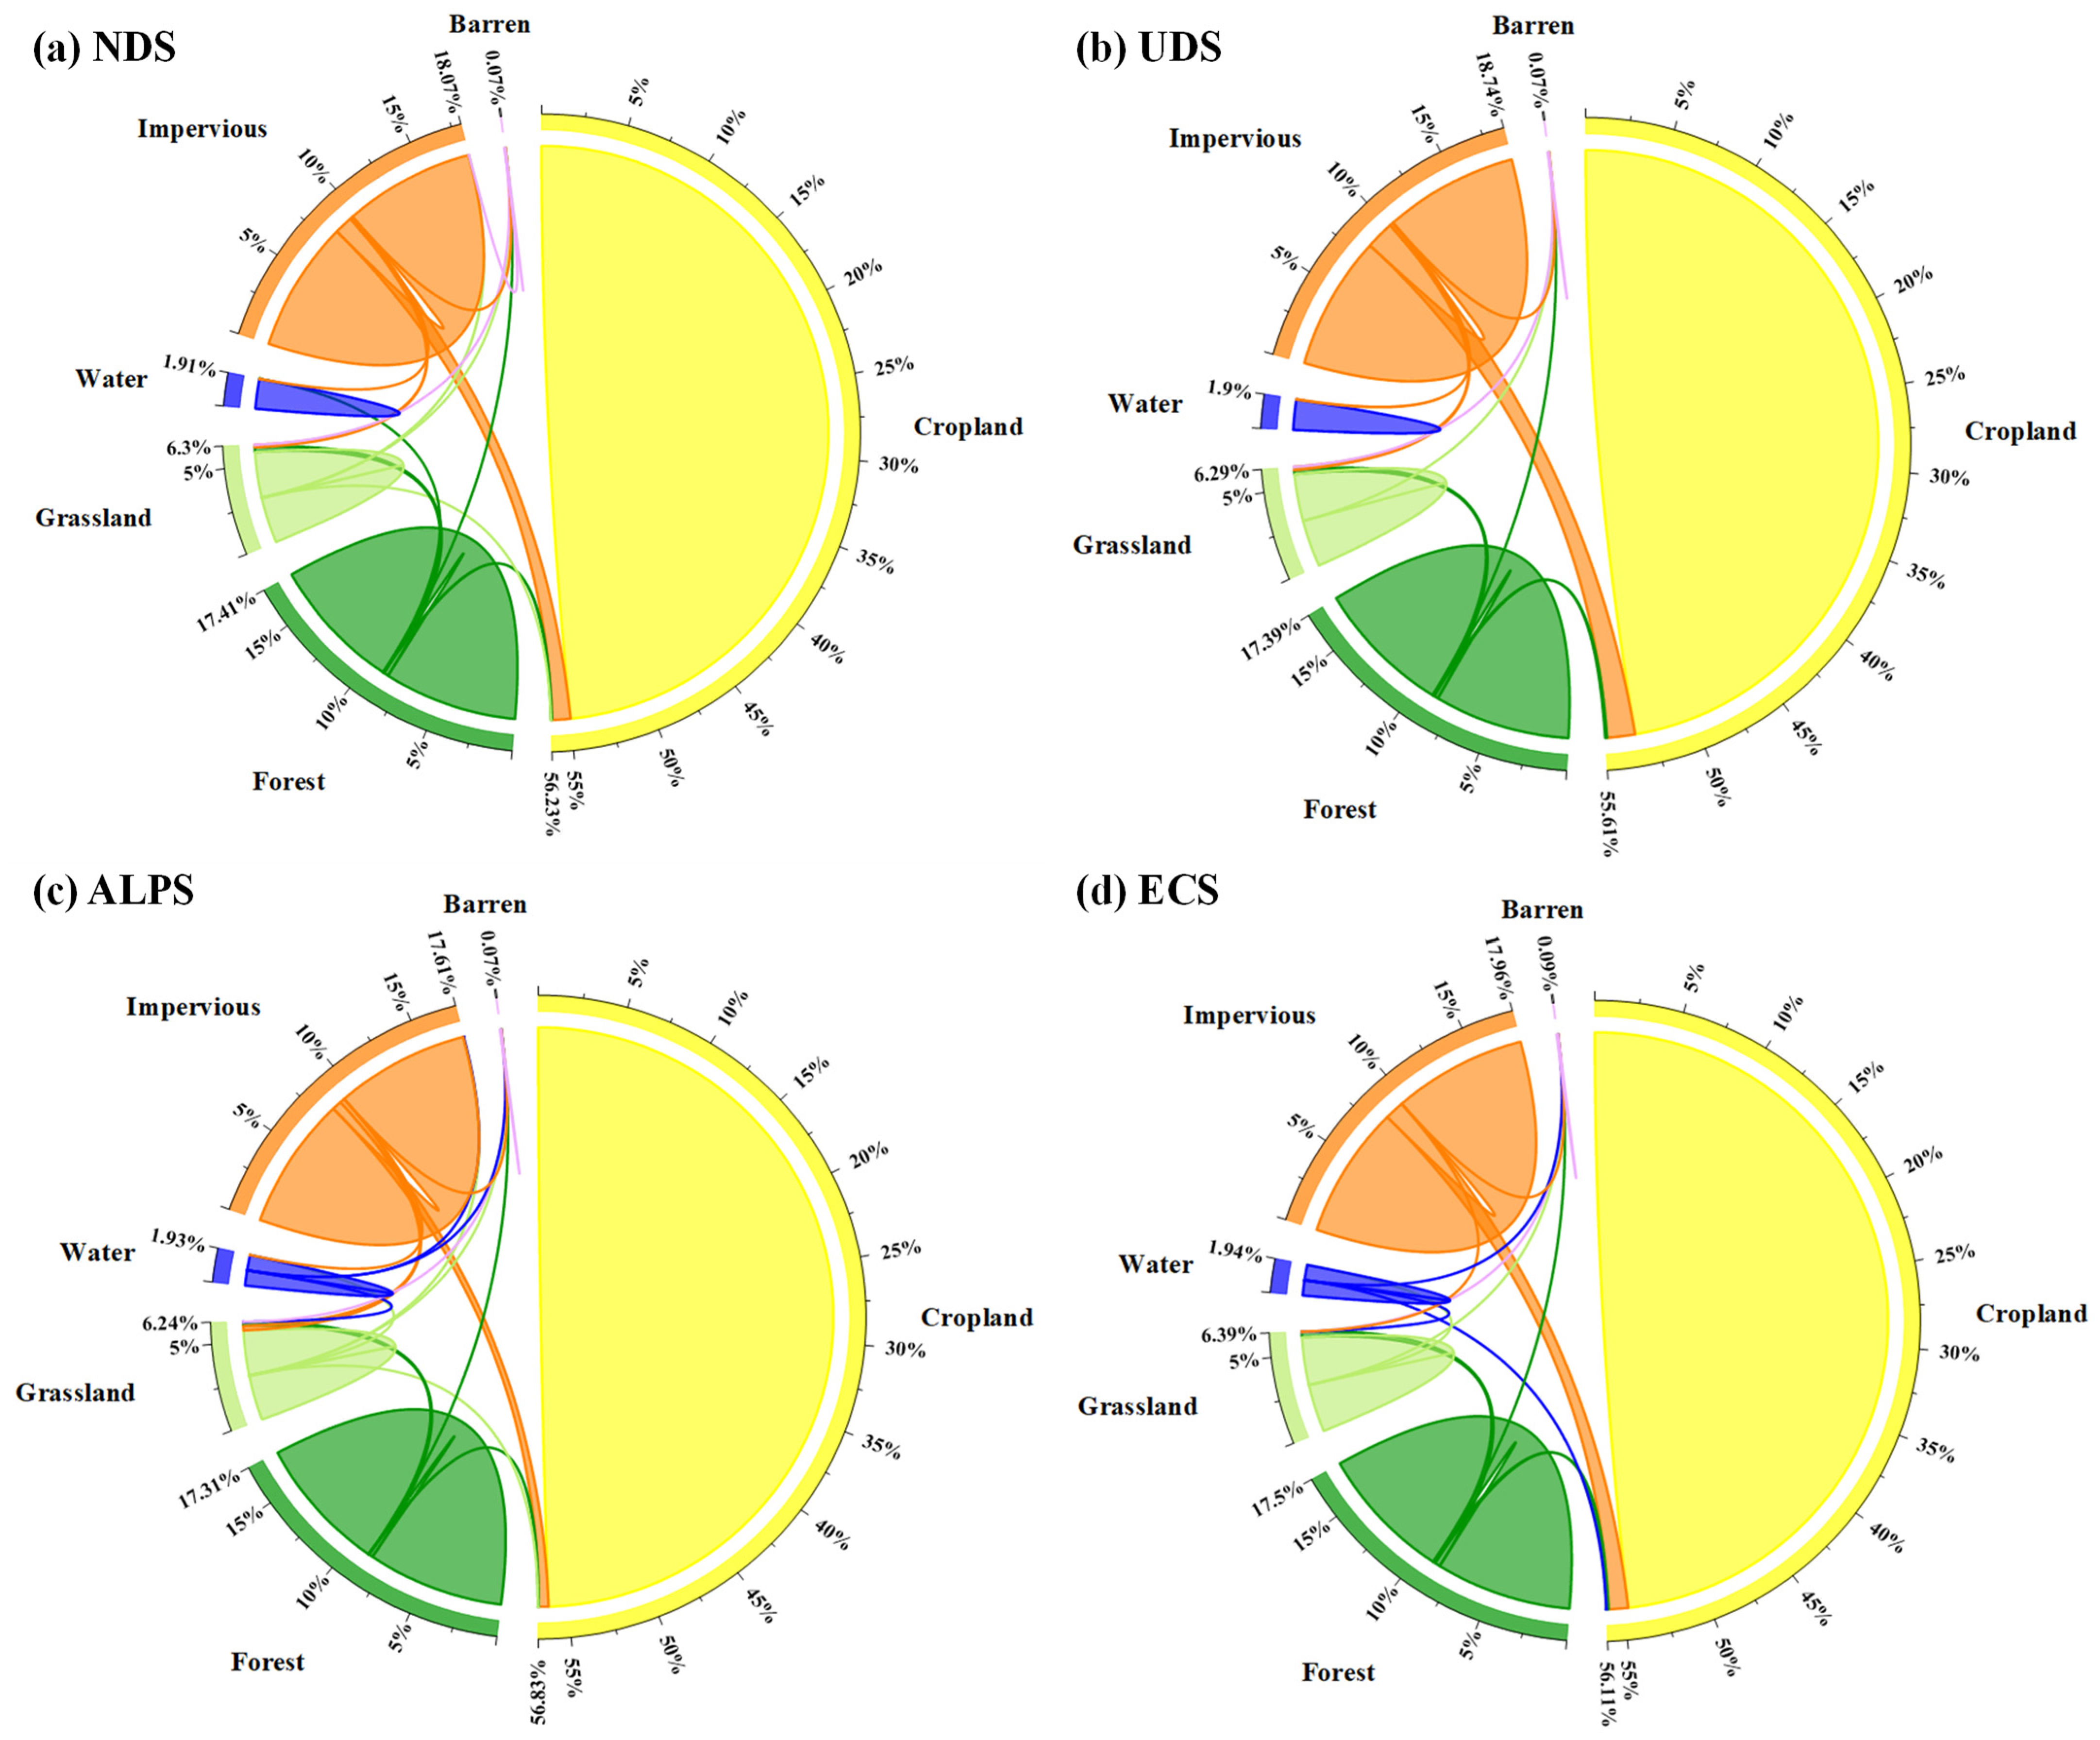
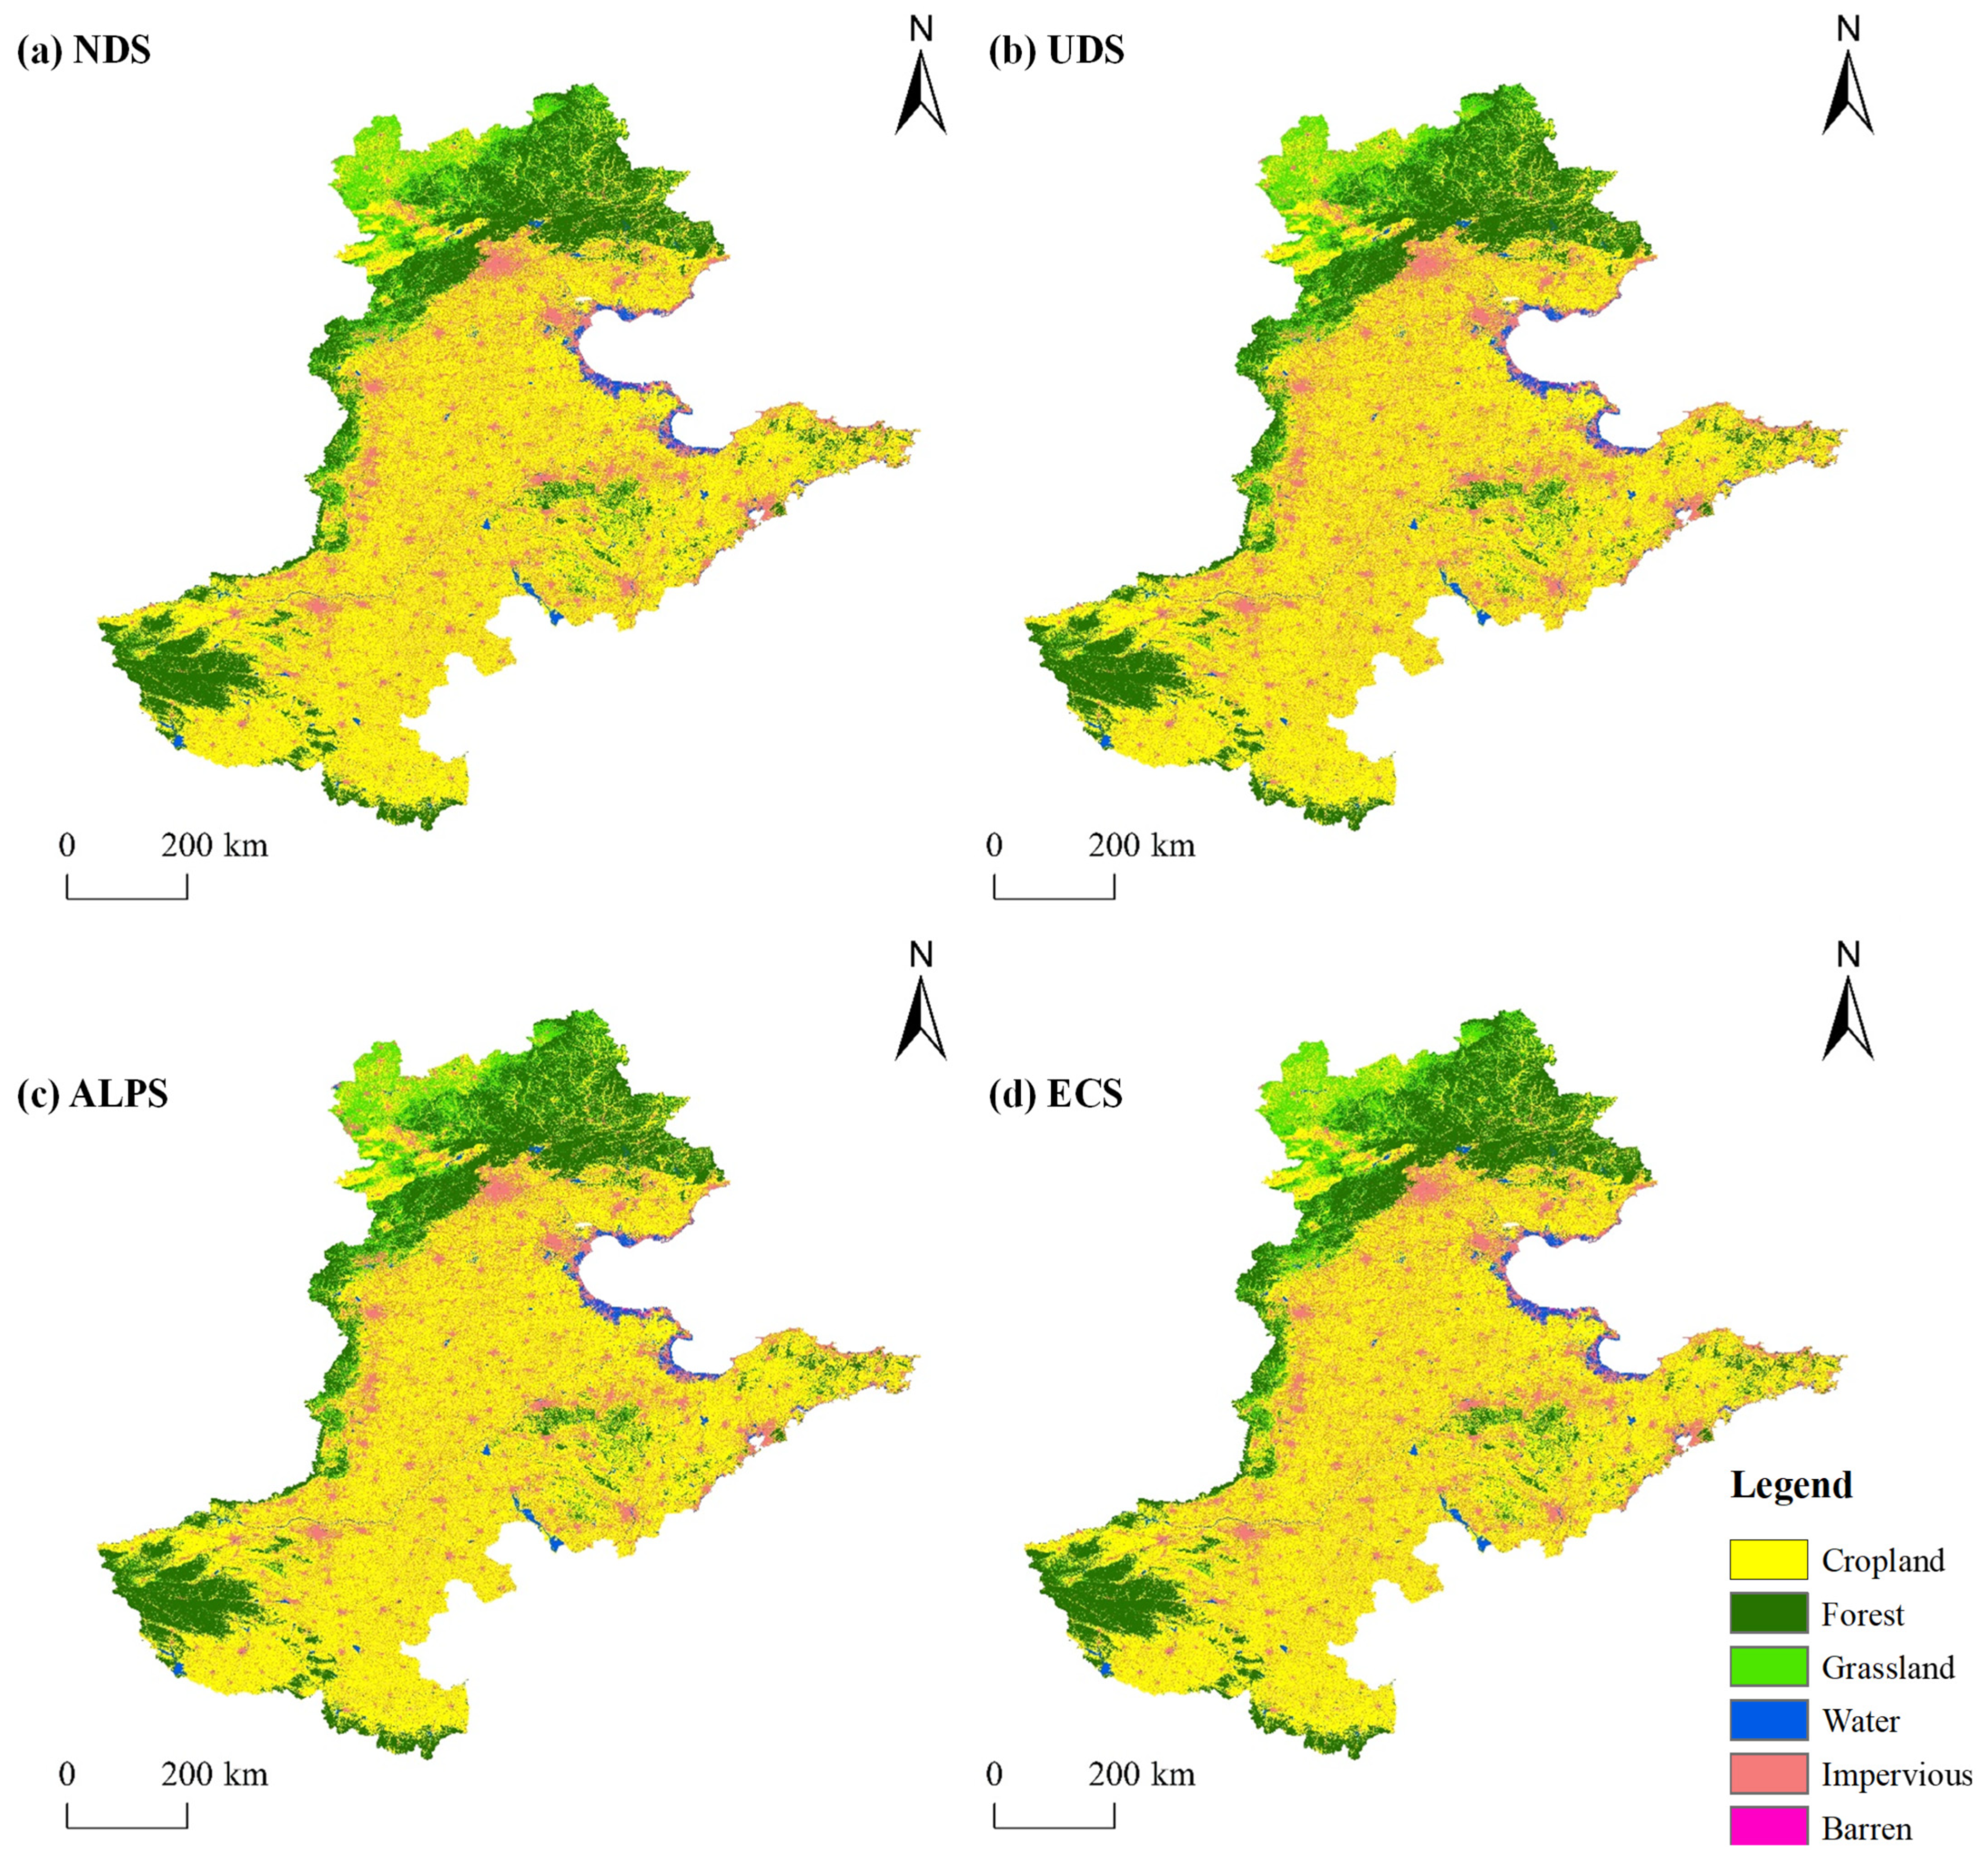
3.3.1. Land Use Changes Under Multiple Scenarios Simulation for 2030

The Kappa Coefficient is a vital metric for assessing the simulation accuracy of the PLUS model, with values closer to 1 signifying higher precision. A Kappa value above 0.75 is generally considered to represent high simulation accuracy. In this study, land use data from 2000 to 2010 was initially used to simulate the land use for 2020. The comparison of the simulated 2020 data with the actual data resulted in a Kappa Coefficient of 0.837097 and an Overall Accuracy of 0.90039, indicating a high degree of agreement between the actual and simulated outcomes. This validates the model’s application for projecting land use changes under various scenarios for the year 2030.
In the 2030 simulation results for the Huang-Huai-Hai Plain (refer to Figure 12 and Table 4), under the NDS, the Impervious area is projected to expand by 14,508.87 km2, following historical trends, with a minor expansion of the Forest area by 4139.24 km2 and reductions in Cropland and Grassland by 13,562.70 km2 and 4729.39 km2, respectively. The UDS anticipates the most significant expansion of the Impervious area, amounting to 9447.76 km2, primarily due to the conversion from Cropland and Grassland. The ALPS features the largest area of Cropland and the smallest area of Impervious among the four scenarios, yet it still follows the historical trend with a decrease in Cropland by 6923.39 km2 and an increase in Impervious by 9447.75 km2. The ECS shows the largest areas of Forest, Grassland, and Water bodies compared to the other three scenarios, with increases in Forest by 5118.82 km2 and Water by 176.67 km2, and a decrease in Grassland by 3749.82 km2. Spatially, the distribution of land use types across the four scenarios for 2030 (as shown in Figure 13) shows minimal changes compared to 2020.

3.3.2. Multi-Scenario Simulation Results of Carbon Storage for 2030

Under the four simulated scenarios, compared to 2020, the ALPS exhibited a minimal reduction in carbon storage, amounting to 70.91 million metric tons, followed by the ECS with a reduction of 115.81 million metric tons. The NDS experienced a decrease of 122.04 million metric tons, while the UDS experienced the most substantial decrease, with a reduction of 196.67 million metric tons.
In the various simulated scenarios (as shown in Table 5), the carbon stored in Cropland is the highest, accounting for approximately 66.61% to 67.96% of the total carbon storage; this is followed by Forests, which constitute about 25.53% to 26.4% of the total carbon storage. Grassland ranks third, making up about 4.66% to 4.95%, and Water have the lowest proportion.
Among different carbon pools (as shown in Table 6), the soil carbon pool is the largest, comprising about 80.28% to 80.92% of the total carbon storage. Aboveground Biomass Carbon (ABC) comes next, representing about 13.68% to 14% of the total carbon storage, followed by Belowground Biomass Carbon (BBC), which accounts for approximately 4.03% to 4.31%, and Dead Organic Matter Carbon (DOMC), which constitutes only 1.37% to 1.4% of the total carbon pool.
Spatially, the pattern of carbon storage across the four 2030 projected scenarios for the Huang-Huai-Hai Plain (as depicted in Figure 14) closely aligns with the distribution noted over the first two decades of the 21st century. High-value areas are located in the forested regions of the north, northeast, west, and southwest, while low-value areas are distributed across the central plains where urban development occurs, as well as in the unused lands and water bodies of the eastern part.
Utilizing the Natural Breaks classification method, alternatively known as the Jenks method in ArcGIS 10.8, the variations in carbon storage for the year 2030 under four distinct simulation scenarios are stratified into five categories: Significant Decrease, Decrease, Essentially Unchanged, Increase, and Significant Increase (refer to Table 7). Observations indicate that, in general, changes across the scenarios are not markedly different. The Urban Development Scenario (UDS) exhibits the most extensive area of significant decrease, totaling 19,112.22 km2, which constitutes 3.51% of the total area. The Arable Land Protection Scenario (ALPS) shows the smallest area of decrease, specifically 6544.26 km2, equating to 1.2% of the total area. Conversely, the Ecological Conservation Scenario (ECS) demonstrates the most considerable areas of increase and significant increase, at 0.27% and 0.68%, respectively.

4. Discussion

4.1. Spatiotemporal Characteristics and Causes of Carbon Storage Changes During the First Two Decades of the 21st Century

The research indicated that over the first two decades of the 21st century, carbon sequestration across the Huang-Huai-Hai Plain showed a steady decrease, with a total reduction of 272.79 million metric tons, accounting for a decrease of approximately 4.9% compared to the year 2000. This decline is primarily attributed to the reduction in cropland extent and the escalation in impervious surfaces, driven by rapid economic development and urbanization in China since the beginning of the 21st century. The significant expansion of impervious surfaces, largely at the expense of cropland, is a key factor. The strong correlation between impervious surfaces and carbon loss is primarily due to their reduction of soil infiltration capacity, impact on soil carbon sequestration, alteration of soil structure, and biogeochemical processes [54]. These impervious surfaces, such as concrete and asphalt, prevent precipitation from infiltrating into the soil, reducing the storage of soil organic carbon and causing significant carbon emissions in the global carbon cycle [55], which are often overlooked in previous assessments. Moreover, the expansion of impervious surfaces leads to changes in the dynamics of soil organic carbon, especially under intensive land management, further reducing the amount of carbon stored in the soil.
Cropland soil carbon pools are among the largest carbon reservoirs in terrestrial ecosystems, capable of absorbing and storing substantial amounts of carbon, thereby reducing atmospheric carbon dioxide concentrations and mitigating global warming. In this region, cropland, which accounts for 57.47–63.38% of the total area, contributes 68.6–71.86% of the total carbon storage, indicating that the compression of cropland area due to urbanization is the primary cause of the decline.
Forests, with higher carbon density than cropland, primarily due to higher Aboveground Biomass Carbon values, are mainly distributed in the northern, northeastern, western, and southwestern parts of the study area. They have shown a continuous increasing trend from 2000 to 2020, benefiting from China’s protective forest policies. According to the data, China has implemented a series of significant forest protection policies and afforestation activities post-2000, including the program that reverts agricultural land to forested and grassy areas, the Natural Forest Conservation Program, the Yellow River Ecological Restoration Project, and the Beijing-Tianjin Sand Source Control Project. The ’Grassland and Forest Restoration’ policy is dedicated to converting agricultural land back into forests and grasslands to improve the ecological environment and increase vegetation cover. The Natural Forest Conservation Program focuses on protecting natural forests by prohibiting logging and grazing, thereby restoring and preserving forest ecosystems. The Beijing-Tianjin Sand Source Control Project increases forest area through afforestation and grass planting, reducing the hazards of sandstorms, and improving the ecological environment in the Beijing-Tianjin area and its surroundings. These policies share the common goal of restoring and protecting forest ecosystems, enhancing biodiversity, mitigating natural disasters, and improving regional ecological security and environmental quality, thus contributing to the continuous growth of China’s forest area and forest stock [56]. However, forests only account for 15.29–17.03% of the total area, and although there has been an 11.4% increase in area from 2000 to 2020, the increase in carbon storage is not sufficient to reverse the overall downward trend in carbon storage.
Alternative land categories, including water bodies, grasslands, and barren land, contribute little to the overall carbon storage because of their small share.
Geographically, elevated levels of carbon sequestration are predominantly located in the northern, western, and southwestern forest zones, whereas reduced levels are observed in the urban centers of the central region. Spatial autocorrelation analysis of carbon storage shows significant spatial clustering. Regions exhibiting growth in carbon sequestration during the first two decades of the 21st century are predominantly situated adjacent to riverbanks, as these waterways supply essential moisture and nutrient-rich soil that foster plant growth. Additionally, riverine greening aids in ecological protection, flood control, and enhances landscape aesthetics. Government policies and urban planning also tend to prioritize greening projects in these areas. The areas with decreased carbon storage highly coincide with the locations of government seats, which are central to urban political, economic, and cultural activities, significantly influencing urban development and regional integration, and typically representing urban built-up areas on maps. In terms of magnitude, total carbon storage (TCS) saw a sharp decline during the early 2000s to mid-2010s, with a subsequent easing in the rate of decrease from 2015 to 2020. This phenomenon is attributed to the varying expansion speeds of urbanization during different periods, with the encroachment on agricultural land intensifying in the early stages and decelerating towards the later stages. The main factors influencing the pace of urbanization include the growth rate of GDP and the speed of industrialization, among others. In the early period, following China’s accession to the World Trade Organization (WTO) in 2001, the market expanded from national to global, leading to rapid economic development and acceleration in industrialization and urbanization. Data shows that the growth of China’s main business income in the industry was 195.13%, 180.76%, and 59.08%; GDP growth rates soared to 86.78%, 169.91%, and 81.31% during the periods 2000–2005, 2005–2010, and 2010–2015 [57,58], respectively. The impervious surface area growth rates of the study area were 9.33%, 11.63%, and 12.3%, with cropland-to-impervious surface transfer areas of 5878.44 km2, 7471.71 km2, and 8731.8 km2. From 2015 to 2020, the decline in carbon storage began to slow down due to the deceleration of urban expansion, reducing the encroachment on cropland. During 2015–2020, the growth of China’s main business income in the industry was −2.36%, China’s GDP grew by 33.09%, and the study area’s impervious surface area growth was 7.9%, with cropland-to-impervious surface transfer areas of 5738.13 km2, showing a significant difference compared to the previous periods. In addition to these, other important reasons include the decrease in China’s working-age population, the decline in the natural population growth rate, the slowdown in population increase, the gradual decoupling of urban economic development from carbon emissions, the shift of economic development models from high-speed growth to high-quality development [59], increased resource and environmental constraints [60], policy adjustments focusing more on the quality of urbanization rather than just the speed of development [61], and the highlighting of regional development imbalances [62]. However, there is a mutually reinforcing dynamic mechanism between urbanization, industrialization, and economic growth [63]. A combination of these factors has collectively contributed to this spatiotemporal trend.

4.2. Summary and Significance of Carbon Storage Driving Factors

The GeoDetector single-factor exploration results revealed that the nine driving factors selected in this study exert varying degrees of influence on the spatial distribution of carbon storage in the Huang-Huai-Hai Plain. However, the primary explanatory factors remain consistent across different periods, indicating a stable association between these factors and carbon storage. The Normalized Difference Vegetation Index (NDVI), an indicator of vegetation cover, is directly related to the carbon sequestration capacity of vegetation and is the most influential factor in this region, a finding consistent with research by Cai et al. [64]. The increase in Nighttime Lights (NTL) is associated with the level of urbanization, reflecting the potential impact of human activities on carbon storage. The acceleration of urbanization and the increase in human activities can affect carbon storage by altering land use types, highlighting the importance of urban planning and management in mitigating the negative impacts of carbon sequestration. The influence of GDP and population (POP) has consistently increased over the five periods, indicating the impact of economic growth and population increase in carbon storage. Economic development and population growth lead to urban expansion, which directly affects carbon sequestration, underscoring the need for sustainable economic and population management to balance development with environmental protection. The impact of temperature and precipitation increased in 2015 and 2020, reflecting the trend of climate warming. Climate change may affect vegetation growth and the decomposition of soil organic matter, thereby influencing carbon storage [65]. The slope aspect influences the water and heat conditions, vegetation distribution, and the accumulation and migration of soil organic carbon, thereby significantly affecting the ecosystem’s carbon storage [66]. Although these three factors play a non-negligible role in the carbon cycle, their impact on carbon storage in this region is relatively small due to the temperate monsoon climate, characterized by hot and rainy summers and cold, dry winters, with distinct seasons and relatively stable precipitation and temperature. Under such climatic conditions, the regular seasonal changes in temperature and precipitation provide a stable environment for vegetation growth and soil organic matter decomposition, reducing the interference of extreme climate events on the carbon cycle. Additionally, the main contribution to carbon storage in this region comes from cropland, which covers a large area of plains with low elevation and flat terrain, minimizing the impact of slope aspects on vegetation distribution and carbon sequestration. Therefore, the influence of these three factors is relatively minor.
The two-factor exploration results also indicated that interactions involving the Normalized Difference Vegetation Index (NDVI) with other factors were the most significant across all periods, highlighting the pivotal role of vegetation cover in the spatial differentiation of carbon storage. The interactions between Nighttime Lights (NTL) and other factors were also prominent, further underscoring the substantial impact of urban expansion on carbon storage distribution. From 2000 to 2020, the influence of economic development (GDP), population growth (POP), and Nighttime Lights (NTL) on carbon storage has been progressively intensifying. These trends indicate that the escalation of economic endeavors, demographic growth, and urban development are reshaping land use configurations and intensifying human engagement, consequently affecting carbon sequestration. The significant interaction between POP and Nighttime Lights also mirrors the complex interplay between population growth and urbanization, exerting impacts on carbon storage. The intensification of these dynamics over time signifies an increasingly complex interconnection between socio-economic and natural ecological elements, which collectively influence the geospatial arrangement of carbon storage in the Huang-Huai-Hai Plain.

4.3. Discussion of Multi-Scenario Simulation Results and the Optimal Scenario

This study utilized the PLUS model to simulate land use changes in the Huang-Huai-Hai Plain region for the year 2030 under four distinct scenarios. Although carbon storage continued to decline in all scenarios except the Urban Development Scenario, where the decrease was the most pronounced, the rate of decrease slowed in the other scenarios. Among the scenarios, the Arable Land Protection Scenario (ALPS) demonstrated the least decrease in carbon storage, followed by the Ecological Conservation Scenario (ECS). The reason is that while the ECS emphasizes the maximization of forests and the protection of grasslands and water bodies, aligning with China’s environmental protection policies [67], these cover a relatively small proportion of the land. Moreover, grasslands and water bodies do not contribute as much to carbon storage per unit area as croplands, which is why the ECS does not perform as well as the ALPS in terms of carbon storage data. The Urban Development Scenario, which primarily simulates the acceleration of urban expansion, showed an exacerbation of the decline in carbon storage. These scenario simulations disclose the varying influence of diverse land use alterations on carbon sequestration, furnishing policymakers with empirical data on the conceivable repercussions of assorted developmental tactics on the region’s carbon dynamics. Geographically, the pattern of carbon sequestration across the projected scenarios for the third decade of the 21st century closely aligns with the distribution noted throughout the first two decades of the 21st century, with elevated concentrations predominantly in forested zones and diminished concentrations scattered across developed urban areas in the central plains, as well as in fallow lands and aquatic regions in the eastern sector. Among various carbon reservoirs, the soil carbon reservoir is the most extensive, constituting roughly 80.28–80.92% of the overall carbon sequestration, surpassed only by the vegetation carbon reservoirs and the organic matter carbon reservoirs. The soil carbon sequestration in arable land outpaces all other carbon reservoirs, underscoring the pivotal role of arable land in the regional carbon cycle of the research locale.
Considering various factors, the Arable Land Protection Scenario (ALPS) is the most likely and realistic. Firstly, the Huang-Huai-Hai Plain, a key grain-producing area in China, emphasizes the cultivation of agricultural crops. Secondly, cropland occupies the largest proportion in this area and has a strong carbon storage capacity, particularly with the highest soil carbon density, making it the main carbon pool in the region. Thirdly, the external social and economic environment has witnessed considerable changes due to the prevalence of the disease in recent years, along with global geopolitical conflicts and wars, which have affected global economic development. China’s economic growth and urbanization have slowed compared to the period from 2000 to 2015, and population growth has decelerated, limiting the expansion of urban areas. Fourthly, from a policy perspective, China has been strengthening its protection of arable land with various regulations. These include strict controls on converting arable land to forest land, grassland, orchards, and other agricultural uses, as well as the establishment of compensation for arable land protection [68]. Efforts have been undertaken to boost the conservation of cultivable land, elevate the fertility of agricultural soil, and refine the equilibrium of utilization and restitution [69]. Any unit or individual is prohibited from leaving arable land idle or fallow [70]. Additionally, the official launch of the China Permanen Basic Farmland Inquiry Platform has provided a more diverse range of channels for the broad public to participate in, jointly supervise, and protect permanent basic farmland [71]. Fifthly, as research into conservation agriculture deepens, the global adoption of conservation agriculture has been expanding at a rate of 10 million hectares per year. It has increased from 110 million hectares in 2008–2009 to 210 million hectares in 2018–2019, accounting for 14.7% of the global arable land [72]. Conservation agriculture systems not only reduce field erosion and water loss but also increase soil organic matter, thereby enhancing and improving healthy soil. They can also effectively enhance soil carbon sequestration capacity, reduce greenhouse gas emissions, and play a significant role in achieving carbon neutrality in agricultural production. For instance, studies have shown that the combined use of crop residue return and inorganic fertilizer can significantly increase soil organic carbon, nitrogen, and phosphorus stocks at all levels, especially in the topsoil, alleviate soil acidification, and increase grain yield in dryland farming systems, positively impacting crop growth and climate change mitigation [73,74]. Therefore, among the four simulated scenarios for the future, the Arable Land Protection Scenario is the most practically significant.
To encapsulate the findings, the multi-scenario simulation outcomes expose the effects of assorted growth tactics on land utilization and carbon sequestration across the Huang-Huai-Hai Plain. Moreover, they furnish a factual foundation for territorial land stewardship and environmental safeguarding, thereby facilitating the realization of sustainable growth objectives in the area.

5. Conclusions

Carbon sequestration ranks among the key performance metrics for ecosystem services and serves as an immediate measure of terrestrial ecosystem vigor, exerting a substantial influence on curbing swift global climate alterations. Alterations in land use, a primary driver of fluctuations in terrestrial ecosystem carbon sequestration, stem from the interaction of natural, environmental, and socio-economic elements. Our research indicated that during the first two decades of the 21st century, carbon sequestration across the Huang-Huai-Hai Plain exhibited a steady decrease, with a total reduction of 272.79 million metric tons, primarily due to changes in land types. The main driver behind this decline is the rapid economic development, industrialization, and urbanization in China post-2000, which led to an increase in built-up land area by 29,502.27 km2, a 47.88% increase from the year 2000, encroaching on cropland areas. Although existing environmental and agricultural policies have led to a slight annual increase in forest area, this has not been sufficient to offset the carbon storage loss due to the reduction in cropland. Analysis using the GeoDetector indicated that NDVI is the dominant factor affecting the spatiotemporal differentiation of carbon storage, while factors related to human activities, such as Nighttime Lights, GDP, and POP, also have a significant impact. The increasing interconnection between socioeconomic and natural ecological factors collectively shapes the spatial distribution of carbon storage in the Huang-Huai-Hai Plain. Simulations for four scenarios in 2030 revealed that, compared to 2020, the Arable Land Protection Scenario (ALPS) showed the least decrease in carbon storage (70.91 million metric tons), followed by the Ecological Conservation Scenario (ECS) with a decrease of 115.81 million metric tons, and the Urban Development Scenario (UDS) experienced the starkest reduction of 196.67 million metric tons. The speed of urbanization in the region is closely related to the rate of carbon storage decline. Therefore, balancing economic development with ecological protection is particularly important, which has a profound impact on achieving China’s dual-carbon goals and addressing global warming. Considering the region’s positioning and the current internal and external environment, we believe the ALPS scenario is the most realistic and provides a scientific reference for the region’s future development and management. The results of this study underscore the critical importance of balancing urban development with the conservation of agricultural land to ensure long-term carbon sequestration in the region.
We identify two critical directions for future research in this area:
  • Urban-Arable Land Coordination: Balancing urban growth with arable land conservation is vital for food security and sustainable development. Protecting arable land from urban encroachment is essential to meet current and future needs. For example, by utilizing high-precision remote sensing monitoring technologies, such as satellite imagery and drone surveillance, we can monitor changes in arable land in real time. This ensures the transparency and effectiveness of policy implementation, allowing for timely adjustments and optimizations of land management measures. Additionally, promoting compact urban development strategies and optimizing urban planning can reduce encroachment on surrounding arable land. For instance, constructing high-rise residential and commercial complexes can improve urban land use efficiency and alleviate the expansion pressure on agricultural land.
  • Carbon Sequestration in Arable Land: Enhancing the capacity of arable land to sequester carbon is key to achieving carbon neutrality, mitigating climate change, and sustaining agriculture. For example, we can promote conservation tillage techniques, such as no-till or reduced-till farming, as well as the practice of returning straw to the field. These practices increase soil organic carbon and reduce greenhouse gas emissions, thereby enhancing the soil’s carbon sink function. Implementing organic farming projects can reduce the use of chemical fertilizers, increase soil microbial activity, and improve soil organic matter content. This enhances the soil’s self-repair and carbon storage capabilities. Adopting precision agriculture technologies can optimize nitrogen fertilizer application, reducing nitrogen loss while increasing crop yields and soil carbon reserves, thus achieving a win-win for agricultural production and environmental protection. Conducting soil carbon storage monitoring projects, which involve the use of soil core samples and soil carbon accounting techniques, can regularly assess the carbon sequestration capacity of arable land. This provides a scientific basis for formulating and adjusting agricultural carbon management policies.
Based on the research findings, we propose the following recommendations: First, we should enhance land monitoring and management using remote sensing satellites and information technology to provide real-time and accurate data on land cover and utilization changes, assisting decision-makers in adjusting land management strategies promptly. Second, it is crucial to coordinate territorial spatial planning with environmental protection, considering environmental protection needs in the planning process, and rationally planning urban expansion boundaries to protect important agricultural land and ecologically sensitive areas. Third, strengthening the protection of arable land is key to ensuring food security and carbon storage in the Huang-Huai-Hai Plain region; thus, implementing the strictest arable land protection systems and integrating the protection of arable land and other agricultural land is essential. Fourth, increasing the carbon sequestration capacity of arable land can be achieved by returning straw to fields, employing crop rotation and intercropping to enhance soil biodiversity, practicing organic agriculture to reduce chemical fertilizer use, and using cover crops to decrease soil erosion. Finally, strengthening technological innovation is vital for enhancing land management and ecological protection capabilities in the region, promoting interdisciplinary technological innovation, and integrating knowledge from various fields to develop new technologies for carbon sequestration and emission reduction in arable land. The implementation of these measures will contribute significantly to the sustainable development of the Huang-Huai-Hai Plain region.

Author Contributions

Conceptualization, X.W. and X.Z.; methodology, X.W. and W.Z.; software, X.W.; validation, X.W., W.Z. and Y.L.; formal analysis, X.W. and X.Z.; investigation, X.W.; resources, D.W.; data curation, X.W.; writing—original draft preparation, X.W., X.Z.; writing—review and editing, X.W. and W.Z.; visualization, X.W.; supervision, Y.L. and D.W.; project administration, D.W.; funding acquisition, Y.L. and X.W. All authors have read and agreed to the published version of the manuscript.

Funding

This research received no external funding.

Institutional Review Board Statement

Not applicable.

Informed Consent Statement

Not applicable.

Data Availability Statement

The data used in this study are all derived from publicly available data published on authoritative online platforms. For details, please refer to Section 2.3, “Data Collection and Preprocessing”.

Conflicts of Interest

The authors declare no conflicts of interest.

References

  1. Filonchyk, M.; Peterson, M.P.; Zhang, L.; Hurynovich, V.; He, Y. Greenhouse gases emissions and global climate change: Examining the influence of CO2, CH4, and N2O. Sci. Total. Environ. 2024, 935, 173359. [Google Scholar] [CrossRef]
  2. Kumar, S.; Chatterjee, U.; David Raj, A.; Sooryamol, K.R. Global Warming and Climate Crisis/Extreme Events. In Climate Crisis: Adaptive Approaches and Sustainability; Chatterjee, U., Shaw, R., Kumar, S., Raj, A.D., Das, S., Eds.; Sustainable Development Goals Series; Springer: Cham, Switzerland, 2023; pp. 3–18. [Google Scholar] [CrossRef]
  3. Abbass, K.; Qasim, M.Z.; Song, H.; Murshed, M.; Mahmood, H.; Younis, I. A review of the global climate change impacts, adaptation, and sustainable mitigation measures. Environ. Sci. Pollut. Res. 2022, 29, 42539–42559. [Google Scholar] [CrossRef] [PubMed]
  4. Global Carbon Budget Report Indicates Record High CO2 Emissions. Available online: https://news.sciencenet.cn/htmlnews/2024/11/533941.shtm (accessed on 15 November 2024).
  5. Qiao, R.; Liu, X.; Gao, S.; Liang, D.; Yangji, G.; Xia, L.; Zhou, S.; Ao, X.; Jiang, Q.; Wu, Z. Industrialization, urbanization, and innovation: Nonlinear drivers of carbon emissions in Chinese cities. Appl. Energy 2024, 358, 122598. [Google Scholar] [CrossRef]
  6. China’s Policies and Actions on Climate Change—White Paper. Available online: https://www.gov.cn/zhengce/2021-10/27/content_5646697.htm (accessed on 15 November 2024).
  7. UNDP and Climate Change. Available online: https://www.undp.org/publications/undp-and-climate-change (accessed on 15 November 2024).
  8. Nolan, C.J.; Field, C.B.; Mach, K.J. Constraints and enablers for increasing carbon storage in the terrestrial biosphere. Nat. Rev. Earth Environ. 2021, 2, 436–446. [Google Scholar] [CrossRef]
  9. Wang, M.; Lin, N.; Huang, X.; Tang, Y. Mitigating farmland use carbon emissions: The dynamic role of farmland use transition. J. Clean. Prod. 2024, 450, 141866. [Google Scholar] [CrossRef]
  10. Shi, W.; Tao, F.; Liu, J. Changes in quantity and quality of cropland and the implications for grain production in the Huang-Huai-Hai plain of China. Food Secur. 2013, 5, 69–82. [Google Scholar] [CrossRef]
  11. Over 2248 Dual Carbon Projects! A Summary of Key/Major Projects in Various Provinces and Cities in 2024, with a Total Investment Exceeding 36 Trillion Yuan. Available online: https://www.sohu.com/a/777638526_121811818 (accessed on 10 December 2024).
  12. Chen, L.; Hao, J.; Wang, F.; Yin, Y.; Gao, Y.; Duan, W.; Yang, J. Carbon sequestration function of cultivated land use system based on the carbon cycle for the Huang-Huai-Hai Plain. Resour. Sci. 2016, 38, 1039–1053. [Google Scholar] [CrossRef]
  13. Liu, Y.; Wu, K.; Cao, H. Land-use change and its driving factors in Henan province from 1995 to 2015. Arab. J. Geosci. 2022, 15, 247. [Google Scholar] [CrossRef]
  14. Wu, X.; Shen, C.; Shi, L.; Wan, Y.; Ding, J.; Wen, Q. Spatio-temporal evolution characteristics and simulation prediction of carbon storage: A case study in Sanjiangyuan Area, China. Ecol. Inform. 2024, 80, 102485. [Google Scholar] [CrossRef]
  15. Xiang, M.; Wang, C.; Tan, Y.; Yang, J.; Duan, L.; Fang, Y.; Li, W.; Shu, Y.; Liu, M. Spatio-temporal evolution and driving factors of carbon storage in the Western Sichuan Plateau. Sci. Rep. 2022, 12, 8114. [Google Scholar] [CrossRef]
  16. Xu, L.; Yu, G.; He, N.; Wang, Q.; Gao, Y.; Wen, D.; Li, S.; Niu, S.; Ge, J. Carbon storage in China’s terrestrial ecosystems: A synthesis. Sci. Rep. 2018, 8, 2806. [Google Scholar] [CrossRef] [PubMed]
  17. Fasihi, M.; Portelli, B.; Cadez, L.; Tomao, A.; Falcon, A.; Alberti, G.; Serra, G. Assessing ensemble models for carbon sequestration and storage estimation in forests using remote sensing data. Ecol. Inform. 2024, 83, 102828. [Google Scholar] [CrossRef]
  18. Zhao, M.; Yue, T.; Zhao, N.; Sun, X.; Zhang, X. Combining LPJ-GUESS and HASM to simulate the spatial distribution of forest vegetation carbon stock in China. J. Geogr. Sci. 2014, 24, 249–268. [Google Scholar] [CrossRef]
  19. Mukhopadhyay, A.; Hati, J.P.; Acharyya, R.; Pal, I.; Tuladhar, N.; Habel, M. Global trends in using the InVEST model suite and related research: A systematic review. Ecohydrol. Hydrobiol. 2024; in press. [Google Scholar] [CrossRef]
  20. Ismaili Alaoui, H.; Chemchaoui, A.; El Asri, B.; Ghazi, S.; Brhadda, N.; Ziri, R. Modeling predictive changes of carbon storage using InVEST model in the Beht watershed (Morocco). Model. Earth Syst. Environ. 2023, 9, 4313–4322. [Google Scholar] [CrossRef]
  21. Piyathilake, I.D.U.H.; Udayakumara, E.P.N.; Ranaweera, L.V.; Gunatilake, S.K. Modeling predictive assessment of carbon storage using InVEST model in Uva province, Sri Lanka. Model. Earth Syst. Environ. 2022, 8, 2213–2223. [Google Scholar] [CrossRef]
  22. He, C.; Zhang, D.; Huang, Q.; Zhao, Y. Assessing the potential impacts of urban expansion on regional carbon storage by linking the LUSD-Urban and InVEST models. Environ. Model. Softw. 2016, 75, 44–58. [Google Scholar] [CrossRef]
  23. Zhao, M.; He, Z.; Du, J.; Chen, L.; Lin, P.; Fang, S. Assessing the effects of ecological engineering on carbon storage by linking the CA-Markov and InVEST models. Ecol. Indic. 2019, 98, 29–38. [Google Scholar] [CrossRef]
  24. Wang, J.; Zhang, Q.; Gou, T.; Mo, J.; Wang, Z.; Gao, M. Spatial-temporal changes of urban areas and terrestrial carbon storage in the Three Gorges Reservoir in China. Ecol. Indic. 2018, 95 Pt 1, 343–352. [Google Scholar] [CrossRef]
  25. Wang, J.; Xu, C. Geodetector: Principle and prospective. Acta Geogr. Sin. 2017, 72, 116–134. [Google Scholar] [CrossRef]
  26. Biswas, M.; Banerji, S.; Mitra, D. Land-use–land-cover change detection and application of Markov model: A case study of Eastern part of Kolkata. Environ. Dev. Sustain. 2020, 22, 4341–4360. [Google Scholar] [CrossRef]
  27. Yao, Y.; Jiang, Y.; Sun, Z.; Li, L.; Chen, D.; Xiong, K.; Dong, A.; Cheng, T.; Zhang, H.; Liang, X.; et al. Applicability and sensitivity analysis of vector cellular automata model for land cover change. Comput. Environ. Urban Syst. 2024, 109, 102090. [Google Scholar] [CrossRef]
  28. Brown, D.G.; Page, S.; Riolo, R.; Zellner, M.; Rand, W. Path dependence and the validation of agent-based spatial models of land use. Int. J. Geogr. Inf. Sci. 2005, 19, 153–174. [Google Scholar] [CrossRef]
  29. Jiang, X.F.; Duan, H.C.; Liao, J.; Song, X.; Xue, X. A study on land use in the middle reaches of the Heihe River Basin, Gansu-Inner Mongolia-Ningxia region based on the Plus-SD coupling model. Res. Arid. Zones 2022, 39, 1246–1258. [Google Scholar]
  30. Carbon Storage—InVEST User Guide. Available online: https://storage.googleapis.com/releases.naturalcapitalproject.org/invest-userguide/latest/en/carbonstorage.html (accessed on 15 November 2024).
  31. Li, K.; Wang, X.; Zhao, F.; An, B.; Li, P. Land use modeling and carbon storage projections of the Bosten Lake Basin in China from 1990 to 2050 across multiple scenarios. Sci. Rep. 2024, 14, 27136. [Google Scholar] [CrossRef] [PubMed]
  32. An, X.; Zhang, M.; Zhang, H.; Liu, Y. Spatiotemporal changes and driving mechanisms of carbon stocks in the Yangtze River Basin of China over the past 20 years. Adv. Space Res. 2024, 75, 53–73. [Google Scholar] [CrossRef]
  33. Tang, X.; Zhao, X.; Bai, Y.; Tang, Z.; Wang, W.; Zhao, Y.; Wan, H.; Xie, Z.; Shi, X.; Wu, B.; et al. Carbon pools in China’s terrestrial ecosystems: New estimates based on an intensive field survey. Proc. Natl. Acad. Sci. USA 2018, 115, 4021–4026. [Google Scholar] [CrossRef] [PubMed]
  34. Yang, J. Research on Simulation of Land Use Change and Estimation of Carbon Storage in the Yellow River Basin Based on FLUS-InVEST Model. Master’s Thesis, Henan University, Kaifeng, China, 2023. [Google Scholar]
  35. Bian, R.; Zhao, A.Z.; Liu, X.F.; Xu, R.H.; Li, Z.Y. The impact of land use change in the Guanzhong Plain urban agglomeration on carbon storage. Environ. Sci. 2024, 45, 3260–3269. [Google Scholar]
  36. Delaney, M.; Brown, S.; Lugo, A.E.; Quintero, T.L.B. The quantity and turnover of dead wood in permanent forest plots in six life zones of Venezuela. Biotropica 1998, 30, 2–11. [Google Scholar] [CrossRef]
  37. Liang, Y.; Xu, C. Knowledge diffusion of Geodetector: A perspective of the literature review and Geotree. Heliyon 2023, 9, e19651. [Google Scholar] [CrossRef]
  38. Liang, X.; Guan, Q.; Clarke, K.C.; Liu, S.; Yao, Y. Understanding the drivers of sustainable land expansion using a patch-generating land use simulation (PLUS) model: A case study in Wuhan, China. Comput. Environ. Urban Syst. 2021, 85, 101569. [Google Scholar] [CrossRef]
  39. Resource and Environment Science Data Platform: China’s Nine Major Agricultural Regions. Available online: https://www.resdc.cn/data.aspx?DATAID=275 (accessed on 15 November 2024).
  40. The 30 m Annual Land Cover Datasets and Its Dynamics in China from 1985 to 2023. 2023. Available online: https://zenodo.org/record/12779975 (accessed on 15 November 2024).
  41. China Meteorological Data Network—National Meteorological Information Center. Available online: https://data.cma.cn/ (accessed on 15 November 2024).
  42. Peng, S. 1-km Monthly Mean Temperature Dataset for China (1901–2023). National Tibetan Plateau/Third Pole Environment Data Center. Available online: https://data.tpdc.ac.cn/en/data/71ab4677-b66c-4fd1-a004-b2a541c4d5bf/ (accessed on 15 November 2024).
  43. Pinzon, J.E.; Pak, E.W.; Tucker, C.J.; Bhatt, U.S.; Frost, G.V.; Macander, M.J. Global Vegetation Greenness (NDVI) from AVHRR GIMMS-3G+, 1981–2022. ORNL DAAC, Oak Ridge, Tennessee, USA. Available online: https://daac.ornl.gov/cgi-bin/dsviewer.pl?ds_id=2187 (accessed on 15 November 2024).
  44. Geographic Spatial Data Cloud. Available online: https://www.gscloud.cn/home (accessed on 15 November 2024).
  45. Xu, X. Chinese Population Spatial Distribution Grid Dataset in Kilometers (1995–2020). Resource and Environment Science Data Platform. Available online: https://www.resdc.cn/DOI/doi.aspx?DOIid=32 (accessed on 15 November 2024).
  46. Xu, X. China’s GDP Spatial Distribution Kilometer Grid Dataset (1995–2020). Resource and Environment Science Data Platform. Available online: https://www.resdc.cn/DOI/doi.aspx?DOIid=33 (accessed on 15 November 2024).
  47. Xu, X. China’s Annual Nighttime Light Dataset (1992–2021). Resource and Environment Science Data Platform. Available online: https://www.resdc.cn/DOI/doi.aspx?DOIid=105 (accessed on 15 November 2024).
  48. China’s Multi-Temporal Road Spatial Distribution Data from 1995, 2012, 2016, 2018, and 2020. Available online: https://www.resdc.cn/data.aspx?DATAID=237 (accessed on 15 November 2024).
  49. Xu, X. China’s River Basin and River Network Dataset Derived from DEM. Resource and Environment Science Data Platform. Available online: https://www.resdc.cn/DOI/doi.aspx?DOIid=44 (accessed on 15 November 2024).
  50. Amap. Available online: https://ditu.amap.com/ (accessed on 15 November 2024).
  51. Creating the Jing-Jin-Bao Forest and Wetland Cluster: Beijing to Build 30 Circular City Forest Parks. Available online: https://www.sohu.com/a/23741801_114988 (accessed on 15 November 2024).
  52. Restoring Nearly 1.58 Million Mu of Basin Ecological Area: Henan Showcases the Yellow River’s Ecological ’Transformation’_Media Focus_People’s Government of Henan Province Portal. Available online: https://www.henan.gov.cn/2024/10-17/3074837.html (accessed on 15 November 2024).
  53. Xinhua All-Media Plus | Sky Eye Over the Motherland—Flying Over the South-to-North Water Diversion Middle Route Project: Henan Chapter. Available online: https://baijiahao.baidu.com/s?id=1815076721503438533&wfr=spider&for=pc (accessed on 15 November 2024).
  54. Yan, Y.; Kuang, W.; Zhang, C.; Chen, C. Impacts of impervious surface expansion on soil organic carbon—A spatially explicit study. Sci. Rep. 2015, 5, 17905. [Google Scholar] [CrossRef]
  55. Qiu, L.; He, J.; Yue, C.; Ciais, P.; Zheng, C. Substantial terrestrial carbon emissions from global expansion of impervious surface area. Nat. Commun. 2024, 15, 6456. [Google Scholar] [CrossRef]
  56. China’s Green Development in the New Era_White Paper_China Government Network. Available online: https://www.gov.cn/zhengce/2023-01/19/content_5737923.htm (accessed on 15 November 2024).
  57. Historical GDP Data of China. Available online: https://data.worldbank.org/indicator/NY.GDP.MKTP.CD?locations=CN (accessed on 15 November 2024).
  58. China Statistical Yearbook—National Bureau of Statistics. Available online: https://www.stats.gov.cn/sj/ndsj/ (accessed on 10 December 2024).
  59. Zhao, J.; Chen, W.; Liu, Z.; Liu, W.; Li, K.; Zhang, B.; Zhang, Y.; Yu, L.; Sakai, T. Urban Expansion, Economic Development, and Carbon Emissions: Trends, Patterns, and Decoupling in Mainland China’s Provincial Capitals (1985–2020). Ecol. Indic. 2024, 169, 112777. [Google Scholar] [CrossRef]
  60. Wei, Z.; Tu, J.; Xiao, L.; Sun, W. Urbanization and carbon emissions in China: Analysis of dynamic relationships from 1978 to 2020. J. Geogr. Sci. 2024, 34, 1925–1952. [Google Scholar] [CrossRef]
  61. Chen, M.; Liu, W.; Lu, D. Challenges and the Way Forward in China’s New-Type Urbanization. Land Use Policy 2016, 55, 334–339. [Google Scholar] [CrossRef]
  62. Cao, G.Y.; Chen, G.; Pang, L.H.; Zheng, X.-Y.; Nilsson, S. Urban growth in China: Past, prospect, and its impacts. Popul. Environ. 2012, 33, 137–160. [Google Scholar] [CrossRef]
  63. Yang, D.; Gao, X.; Xu, L.; Guo, Q. Constraint-Adaptation Challenges and Resilience Transitions of the Industry–Environmental System in a Resource-Dependent City. Resour. Conserv. Recycl. 2018, 134, 196–205. [Google Scholar] [CrossRef]
  64. Cai, J.; Chi, H.; Lu, N.; Bian, J.; Chen, H.; Yu, J.; Yang, S. Analysis of Spatiotemporal Predictions and Drivers of Carbon Storage in the Pearl River Delta Urban Agglomeration via the PLUS-InVEST-GeoDetector Model. Energies 2024, 17, 5093. [Google Scholar] [CrossRef]
  65. Tripathi, A.; Pandey, V.; Ranjan, M.R. Climate Change and Its Impact on Soil Properties. In Climate Change and the Microbiome; Choudhary, D.K., Mishra, A., Varma, A., Eds.; Springer: Cham, Switzerland, 2021; Volume 63, pp. 139–153. [Google Scholar] [CrossRef]
  66. Patton, N.R.; Lohse, K.A.; Seyfried, M.S.; Godsey, S.E.; Parsons, S.B. Topographic controls of soil organic carbon on soil-mantled landscapes. Sci. Rep. 2019, 9, 6390. [Google Scholar] [CrossRef] [PubMed]
  67. The “14th Five-Year Plan Outline for the Development of Forestry and Grassland Conservation”. People’s Republic of China Central People’s Government. Available online: https://www.gov.cn/xinwen/2021-08/19/content_5632036.htm (accessed on 15 November 2024).
  68. Opinions of the CPC Central Committee and the State Council on Strengthening the Protection of Cultivated Land and Improving the Balance of Occupied and Compensated Land. Available online: https://www.gov.cn/zhengce/202203/content_3635255.htm (accessed on 15 November 2024).
  69. Opinions on Strengthening the Protection of Cultivated Land, Enhancing the Quality of Cultivated Land, and Improving the Balance of Occupied and Compensated Land by the General Office of the CPC Central Committee and the State Council. Available online: https://www.gov.cn/zhengce/202409/content_6976197.htm (accessed on 15 November 2024).
  70. Prohibition of Any Unit or Individual from Idleness and Desertion of Cultivated Land. Available online: https://www.pds.gov.cn/contents/45635/160274.html (accessed on 15 November 2024).
  71. China’s Permanent Basic Farmland Inquiry Platform Officially Launched. Available online: https://baijiahao.baidu.com/s?id=1810959858597737928&wfr=spider&for=pc (accessed on 15 November 2024).
  72. Development Trends and Policy Suggestions for Conservation Agriculture at Home and Abroad. Available online: https://mp.weixin.qq.com/s?__biz=MzkzMDIzODI2MQ==&mid=2247485206&idx=1&sn=51b66a51019af7cd6d3b4cf1b5b5aa9f (accessed on 10 December 2024).
  73. Liu, J.; Fang, L.; Qiu, T.; Chen, J.; Wang, H.; Liu, M.; Yi, J.; Zhang, H.; Wang, C.; Sardans, J.; et al. Crop residue return achieves environmental mitigation and enhances grain yield: A global meta-analysis. Agron. Sustain. Dev. 2023, 43, 78. [Google Scholar] [CrossRef]
  74. Liu, J.; Chen, J. Developing an ecological stoichiometry-based framework for tracing the sources of soil organic matter. Glob. Change Biol. 2024, 30, e17384. [Google Scholar] [CrossRef] [PubMed]
Figure 1. Location of the study area.
Sustainability 17 00139 g001
Figure 2. Experimental Flowchart. (The deep blue arrows indicate input data, the orange arrows indicate output data, and the light green arrows represent the sequence of operations).
Sustainability 17 00139 g002
Figure 3. Preprocessing of driving factors (taking the driving factors of 2020 as an example and processing those of other years according to this standard).
Sustainability 17 00139 g003
Figure 4. Proportional Distribution of LULC (a). Area Flux of Different Land Categories: A Sankey Overview (2000–2020) (b).
Sustainability 17 00139 g004
Figure 5. Land Type Spatial Distribution from 2000 to 2020.
Sustainability 17 00139 g005
Figure 6. (a) Carbon storage of different land use types (2000–2020). (b) Carbon storage of different types of carbon pools (2000–2020).
Sustainability 17 00139 g006
Figure 7. Geographical Pattern of Carbon Storage in the Study Area: The First Two Decades of the 21st Century.
Sustainability 17 00139 g007
Figure 8. (A) Carbon Storage Pattern Analysis for the First Two Decades of the 21st Century, incorporating government seat elements. (B) Carbon Storage Pattern Analysis for the First Two Decades of the 21st Century, incorporating river elements. (C) Enlarged view of the areas marked in (A,B), with the a–h labels corresponding to the markings on figures (A,B).
Sustainability 17 00139 g008
Figure 9. Autocorrelation Analysis of Carbon Storage in the First Two Decades of the 21st Century.
Sustainability 17 00139 g009
Figure 10. Single-Factor Detection Result. (Note: X1-X9 correspond to DEM, Slope, Aspect, Temperature, Precipitation, GDP, POP, NTL, NDVI).
Sustainability 17 00139 g010
Figure 11. Results of Interactive Factor Detection. (Note: X1-X9 correspond to DEM, Slope, Aspect, Temperature, Precipitation, GDP, POP, NTL, NDVI).
Sustainability 17 00139 g011
Figure 12. Land Transfer under Four Scenarios (NDS, UDS, ALPS, ECS).
Sustainability 17 00139 g012
Figure 13. Spatial Distribution of Land Use in 2030 under Four Simulation Scenarios (NDS, UDS, ALPS, ECS).
Sustainability 17 00139 g013
Figure 14. Geospatial arrangement of carbon sequestration under the projected scenarios for the third decade of the 21st century.
Sustainability 17 00139 g014
Table 1. Main Data Sources and Descriptions.
CategoryData NameYearParameter Data TypeData Source
Basic DataGeospatial Contour
Information
ShapefileResource and Environmental Science Date Platform [39]
Land Use/Land Cover (LULC)2000, 2005, 2010,
2015, 2020
Resolution 30 mZenodo Repository [40]
Natural
Factors
Temperature2000, 2005, 2010,
2015, 2020
Resolution 1 kmChina Meteorological Data Service Centre [41]
Precipitation2000, 2005, 2010,
2015, 2020
Resolution 1 kmNational Tibetan
Plateau Data Environment Center [42]
Normalized Difference
Vegetation Index (NDVI)
2000, 2005, 2010,
2015, 2020
Resolution 1 km ORNL DAAC [43]
Digital Elevation Model (DEM) Resolution 30 mGeospatial Data Cloud [44]
Slope Generated from DEM data.
Aspect Generated from DEM data.
Social
Factors
Population (POP)2000, 2005, 2010,
2015, 2020
Resolution 1 kmResource and Environmental Science Date Platform [45]
Gross Domestic
Product (GDP)
2000, 2005, 2010,
2015, 2020
Resolution 1 kmResource and Environmental Science Date Platform [46]
Nighttime Lights (NTL)2000, 2005, 2010,
2015, 2020
Resolution 1 kmResource and Environmental Science Date Platform [47]
Accessibility FactorsDistance to railway2000, 2005, 2010,
2015, 2020
ShapefileResource and Environmental Science Date Platform [48]
Distance to major roads2000, 2005, 2010,
2015, 2020
ShapefileResource and Environmental Science Date Platform [48]
Distance to the river2020ShapefileResource and Environmental Science Date Platform [49]
Distance to Government Seat2020ShapefileAmap [50]
Table 2. Carbon Density.
No.LULC Name C a b o v e C b l o w C S o i l C d e a d
1Cropland5.481.12107.690.55
2Forest54.177.7770.435.42
3Grassland2.346.1668.330.23
4Water0.16000.02
5Impervious1.317.9900.13
6Barren1.241.0427.50.12
Table 3. Land transition matrix (1 indicates transfer is allowed, 0 indicates transfer is prohibited).
ScenarioLand Use TypeCroplandForestGrasslandWaterImperviousBarren
NDSCropland111111
Forest111111
Grassland111111
Water111111
Impervious111111
Barren111111
UDSCropland111111
Forest111011
Grassland111111
Water101110
Impervious000010
Barren111111
ALPSCropland111110
Forest111001
Grassland111111
Water101100
Impervious101010
Barren111011
ECSCropland111111
Forest010000
Grassland111111
Water111100
Impervious111110
Barren111111
Table 4. Statistical Table of Land Use Area for 2020 and Four Simulation Scenarios for 2030.
Land Type (km2)20202030NDS2030UDS2030ALPS2030ECS
Cropland312,767.10299,218.23292,475.07305,825.67297,967.86
Forest92,674.9896,800.5896,622.8395,743.0897,807.05
Grassland36,674.2831,937.2231,739.8531,238.9132,905.53
Water10,489.7710,315.2610,229.5810,532.7010,664.19
Impervious91,121.49105,606.00112,812.84100,546.20104,400.00
Barren478.26328.59325.71319.32461.25
Table 5. Carbon sequestration across different land categories under the projected scenarios anticipated for the third decade of the 21st century (in million tons).
NDSUDSALPSECS
Cropland3436.222067.1544%3358.784066.6124%3512.102067.9582%3421.863066.7923%
Forest1333.815026.0669%1331.366026.4041%1319.244025.527%1347.684026.3058%
Grassland246.10824.8097%244.58734.8507%240.72704.658%253.57004.9495%
Water0.18570.0036%0.18410.0037%0.18960.0037%0.19200.0037%
Impervious99.58651.9462%106.38252.1098%94.81511.8346%98.44921.9217%
Barren0.98250.0192%0.97390.0193%0.95480.0185%1.37910.0269%
Note: Round to four decimal places.
Table 6. Carbon storage within different carbon pools under the four simulated scenarios for 2030 (in million tons).
NDSUDSALPSECS
ABC709.853813.8727%706.091914.0034%706.922313.6788%714.711313.9507%
BBC212.81324.1590%217.55624.3146%208.25764.0297%213.10194.1596%
DOMC71.05491.3886%70.67671.4017%70.76371.3693%71.54051.3964%
SOC4123.178380.5796%4047.952880.2802%4182.088880.9223%4123.782980.4933%
Note: Round four decimal places.
Table 7. Statistical changes in area (km2).
Change CategoryNDS%UDS%ALPS%ECS%
Significant Decrease12,755.252.3419,112.223.516544.261.2013,312.712.45
Decrease1792.350.332173.050.403185.640.59179.100.03
Essentially Unchanged524,985.8496.47518,966.3795.36530,987.3197.57525,526.5696.57
Increase968.580.181179.810.22397.080.071486.530.27
Significant Increase 3703.860.682774.430.513091.590.573700.980.68
Note: Round to two decimal places.
Disclaimer/Publisher’s Note: The statements, opinions and data contained in all publications are solely those of the individual author(s) and contributor(s) and not of MDPI and/or the editor(s). MDPI and/or the editor(s) disclaim responsibility for any injury to people or property resulting from any ideas, methods, instructions or products referred to in the content.

