Article

Biased Perception of Macroecological Findings Triggered by the IPCC—The Example of Wildfires

by
Carsten Hobohm
1,* and
Volker Müller-Benedict
2
1
Ecology and Environmental Education, University of Flensburg (EUF), 24943 Flensburg, Germany
2
Seminar for Social Sciences, Empirical Studies and Statistics, University of Flensburg (EUF), 24943 Flensburg, Germany
*
Author to whom correspondence should be addressed.
Sustainability 2025, 17(1), 134; https://doi.org/10.3390/su17010134
Submission received: 9 November 2024 / Revised: 4 December 2024 / Accepted: 13 December 2024 / Published: 27 December 2024

Abstract

:
Global change and disturbance ecology, including the risks and benefits of wildfires for humans, sustainability of ecosystems and biodiversity, is a current research topic in applied science. Fires and their impacts are often considered in the context of climate change, carbon dioxide emissions and air pollution. Despite a significant decline in wildfires at the global scale in recent decades (cf. Global Wildfire Information System (GWIS)), it is a widespread conviction that the burned area is increasing due to global warming. In an attempt to identify how this discrepancy has arisen, we analysed IPCC reports from 2018–2023 via text mining including word frequency analyses and compared considerations about wildfires and fire weather with findings from ecology and public information on the internet. Both a negativity bias and repetition bias were identified. Numerous examples of disasters and models indicating a global increase of wildfires are composed of alarming messages. Examples of decreasing wildfires and the global decline are much less frequently communicated. Important facts are ignored, especially in summaries for policymakers. Measured against fire-ecological conditions and benefits for the nature, alarming trends and risks due to climate change are exaggerated. We therefore call for a comprising and differentiated reflection of ecological conditions and processes in the future.

1. Introduction

As early as 1951, the ecologist Heinrich Walter [1] wrote:
"Certain plant species are favoured by fire and can serve as direct indicators of periodically burned areas. The widespread distribution of today’s grasslands and savannas is largely caused by fire. We can therefore see that large areas of the landscape are shaped by fire."
Since then, it has become clear that fires are of ecological importance for the sustainability of certain ecosystems. Many ecosystems and species are well adapted to fire. People use fire in the landscape in different ways—for agriculture, for livestock grazing, for nature conservation, as a firefighting measure to minimise the risk of severe fires, but certainly not with the intention of harming themselves or their livelihoods. Therefore, it is not only the ecosystems that need to be protected, but also the opportunities to burn, e.g., [2,3,4].
Macroecological knowledge is not only important for understanding and managing agriculture, forestry, nature conservation and further land use, but also increasingly for guiding policy decisions and legislation. Scientific findings and public awareness are important for sustainable development. It is therefore necessary to present the ecological conditions and processes in a realistic, sufficiently detailed and balanced way. This means that both the risks and the benefits must be taken into account. Otherwise, information could lead to ineffective measures and investments e.g., in environmental management [5]. Landcover change, land use change, and also wildfires are increasingly being discussed in the context of climate change and are viewed with concern, with the media significantly influencing how societies understand and respond to wildfires [6]. Furthermore, news such as “Wildfires are becoming more intense and more frequent, ravaging communities and ecosystems in their path”, as can be found on the UN webpage [7], are quite suitable for promoting or reinforcing environmental fears [8].
If the negative side of a phenomenon is accenuated and the positive aspects are widely ignored, the message can be characterized as biased—Negativity Bias. In general, the perception of negative events is stronger than that of positive events of the same objective magnitude. The cause of this kind of reflection and communication has been identified, amongst others, in terms of behavioural biology and cultural history. Additionally, frequently repeated narratives are more likely to be accepted as true than new and un-repeated information. The more frequently a message is repeated and the more publications portrait a specific message, the more credible it becomes—Repetition Bias. The Negativity Bias and the Repetition Bias are significant cognitive distortions. Evidence for this has been demonstrated in many areas of communication, including science. Like many other cognitive distortions, both effects are also used strategically to attract attention. Motives include the pursuit of money, power and the idea of protecting life, people or humanity [9,10,11,12].
The reports of the Intergovernmental Panel on Climate Change (IPCC) are meta-analyses for informing both the public and policy makers about climate change, its environmental impacts and associated social risks. The IPCC’s work has been extremely successful in raising public awareness of climate change and its socio-ecological impacts. These reports are often used by other media to multiply key messages and alarming forecasts [13,14].
Our aim was to review and analyse timelines of wildfires and recent findings in fire ecology and compare these with information from IPCC reports. The main question of our analysis was not whether something is true or false. Consequently, the aim of our research was not about refuting IPCC reports that have been produced by hundreds of scientists but to find out how ecological knowledge is represented, how the reports as well as other media portrait wildfires and which findings are inadequately reflected or missing.

2. Materials and Methods

2.1. Hypotheses

In general, the perception of environmental processes and the interaction between humans and the environment is strongly influenced by human fatalities, damage costs, proximity to a potential source of hazard and communication about increasing or decreasing risks [15,16,17].
We assumed that IPCC Reports essentially support the perception of increasing wildfires due to global warming. This hypothesis, the null hypothesis that this is not the case, and the alternative hypothesis that IPCC Reports support the perception of decreasing wildfires despite global warming form the basis of the analyses.

2.2. Material

For ecological considerations we used online databases of the annual burned area at different spatial scales [18,19,20], annual number of fires per region [21], precipitation rates [22] temperatures [23], the Index of Accumulated Cyclone Energy of North Atlantic hurricanes (ACE) [24], and carbon dioxide concentrations in the atmosphere [25].
We used seven IPCC Reports of the last assessment cycle including three Special Reports (2018–2023) to obtain information on the representation of fire ecology by the IPCC [26,27,28,29,30,31,32]. These reports together comprise 10,010 pdf pages.
We also analysed initial websites and links on the Internet using selected keywords to obtain information about the current discussion and online presentation on the topic of wildfires (Google, Startpage). In addition, we analysed time series of mortality and damage costs due to drought, wildfires and—for comparison—earthquakes as important factors influencing the perception [24].

2.3. Methods

The term “wildfire” is defined in various ways, including within the IPCC reports. As is usual in macroecological contexts, we define fires in the landscape as “wildfire” and use the term synonymously with “landscape fire”, which exceptionally can also occur in settlements or cities. “Forest fires” are wildfires limited to tree plantations and forested or more or less natural forests. With respect to the landcover type and vegetation structure, a wildfire can be classified as forest fire, bushfire, burned savanna, grassland, settlement, fire at the wildland-urban interface, and so on cf. e.g., [33].
We focused on macroecological spatial scales and time periods of the last decades. Standardised univariate, bivariate and multivariate methods, e.g., correlation analyses (Pearson) and linear regression analyses (LRA), were used for the statistics [34,35].
Therefore, we calculated (i) national, supranational and global trends of wildfires based on figures published by the Global Wildfire Information System (GWIS), which have been detected by using satellite imagery (NASA MCD64 MODIS), and compared the trends e.g., with climate data [18,19].
(ii) Using text mining and word frequency analysis, we searched for and analysed text passages in the IPCC reports that contain information on fire ecology and the development of wildfires at different spatial scales over the last decades. In a first step, we tried to get an overview, focusing on fire ecology in relation to the structure of the reports. In a second step, we systematically searched for ecologically relevant discussions using a keyword analysis based on digital filtering options (Adobe Acrobat Reader DC). We used keywords such as fire, wildfire, forest fire, fire weather, burned, burnt and many word combinations. During this phase of the analyses, we read all text sections about wildfires and fire ecology. For classification purposes, we categorised many text sections according to empirical data, predictions and mitigation recommendations, global and regional considerations, wildfires and fossil fuel-based fires. In addition, we tried to find out whether the statements were more general or regional and specific to the ecosystem type. Text passages without a clear statement, with doubtful categorisation possibilities or with little or almost no ecologically relevant information were not considered. On the basis of these steps, an attempt was made to test the hypotheses [36,37,38].
We used (iii) the internet to provide us with an overview on how the media currently portrait wildfires. As we are not familiar with the algorithms behind the online presentation and self-reinforcing effects cannot be ruled out, we evaluated the information qualitatively. We also analysed the trends (2002–2022) of global fatalities and damage costs caused by wildfires and drought, which depend on weather conditions, and compared them with the trends of fatalities and damage costs from earthquakes, which are independent of climate or weather.
All scientific articles, reports and data used are freely available online.

3. Results

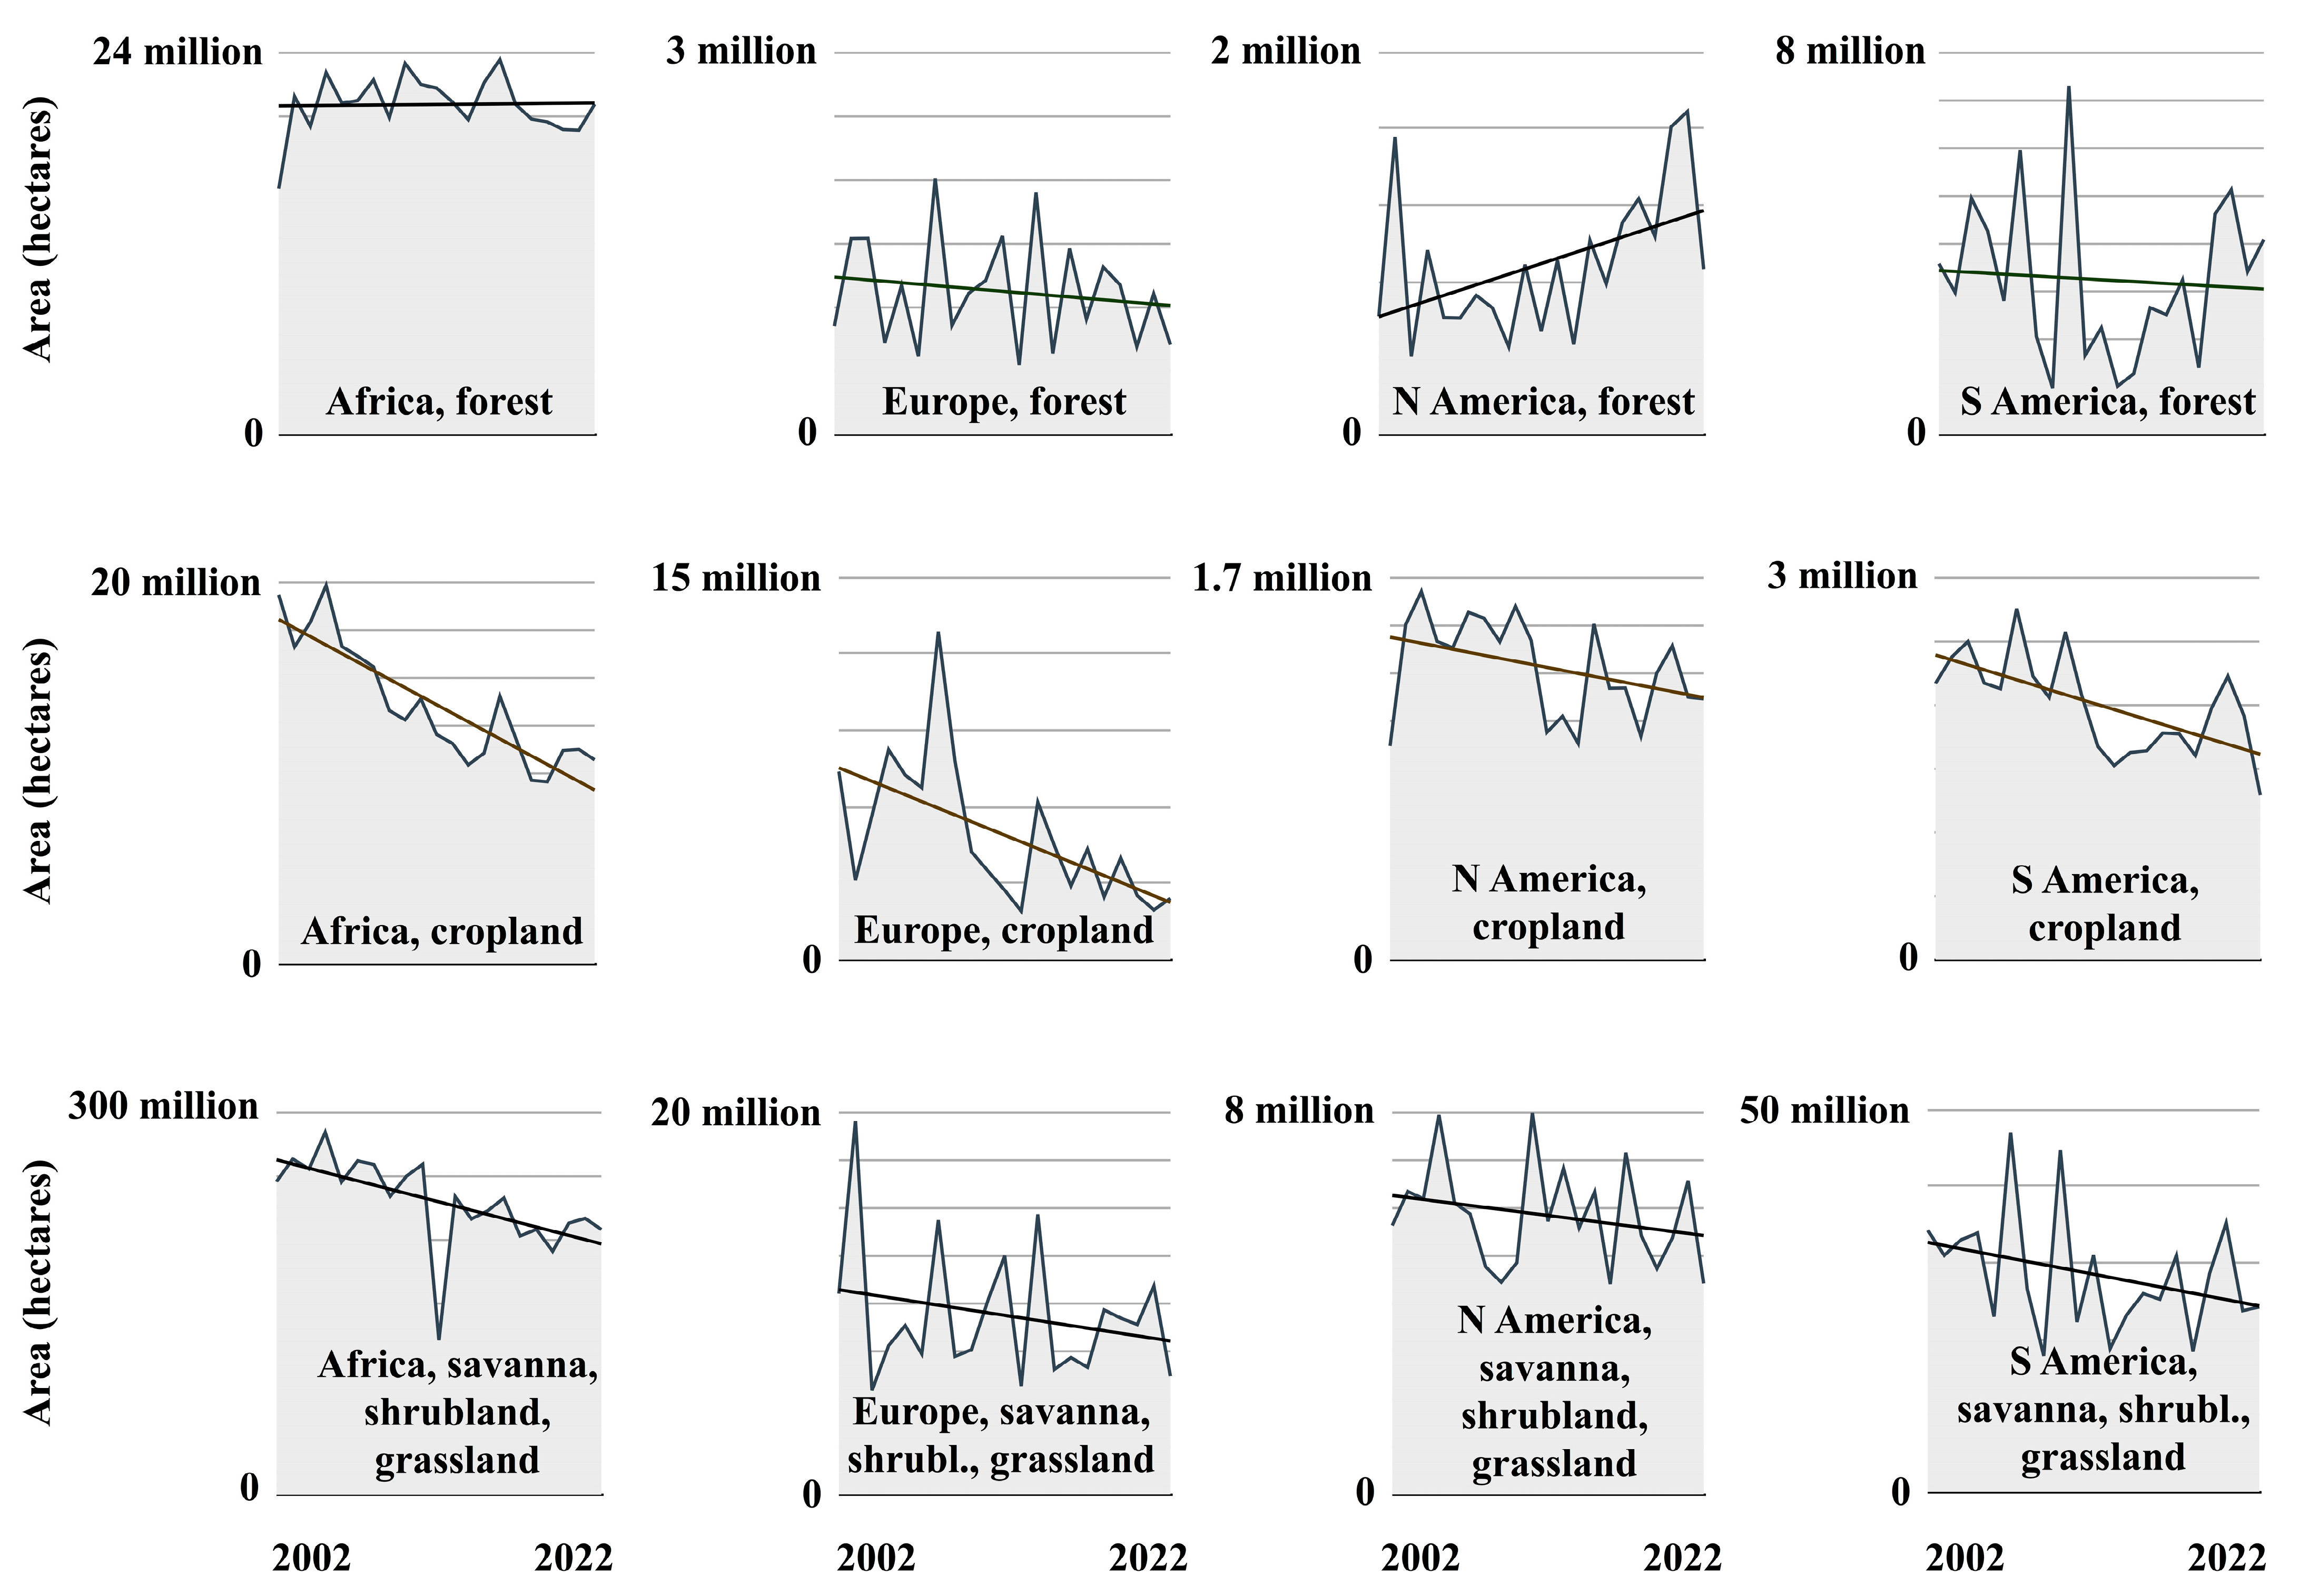
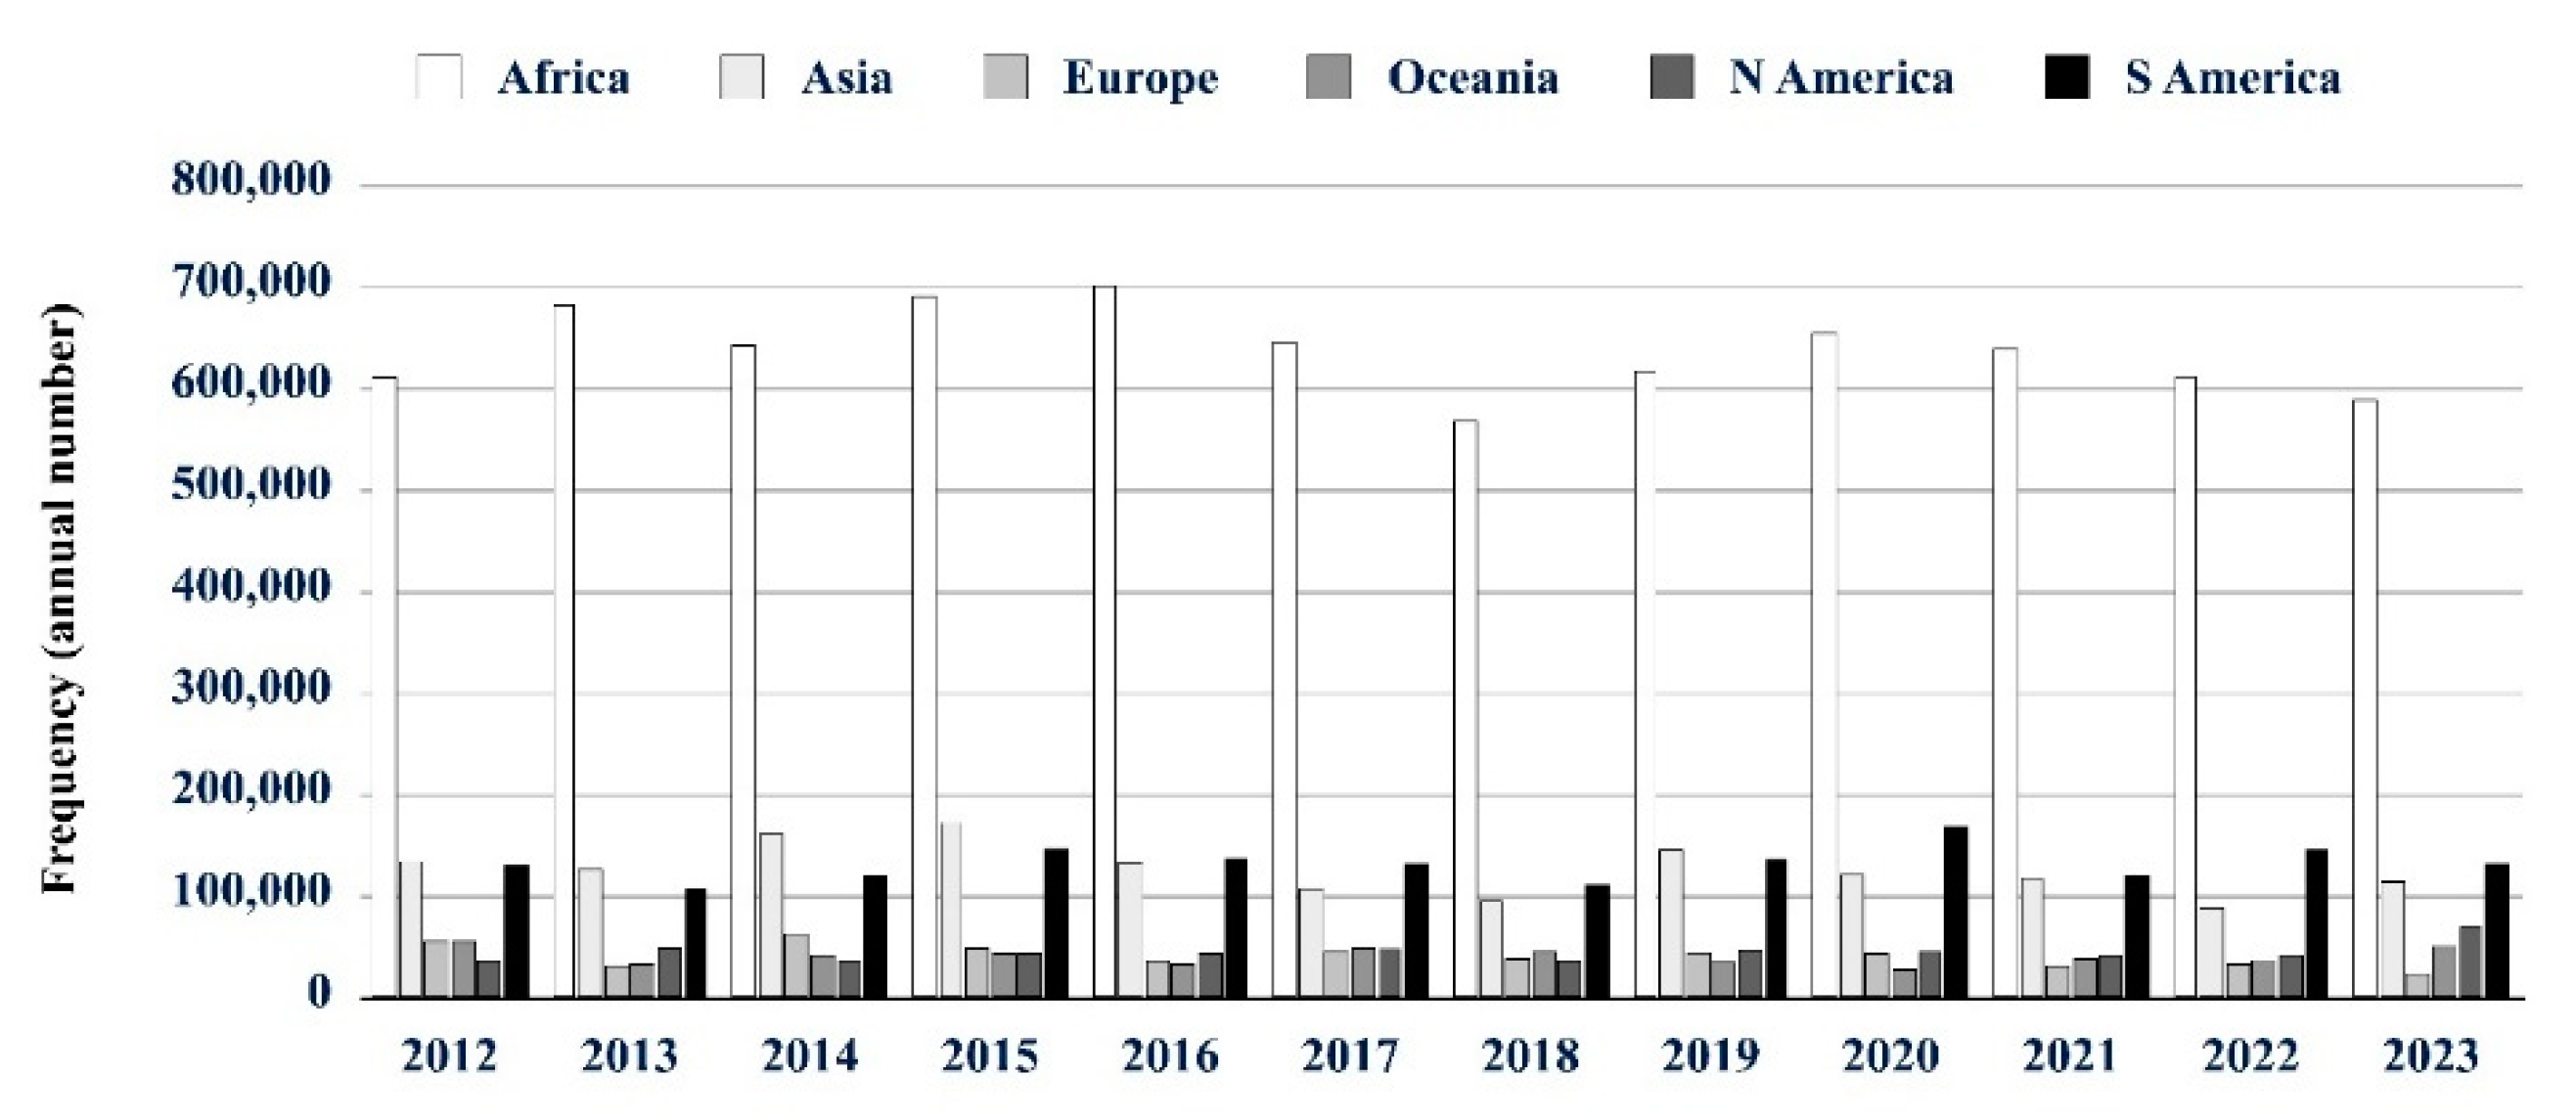
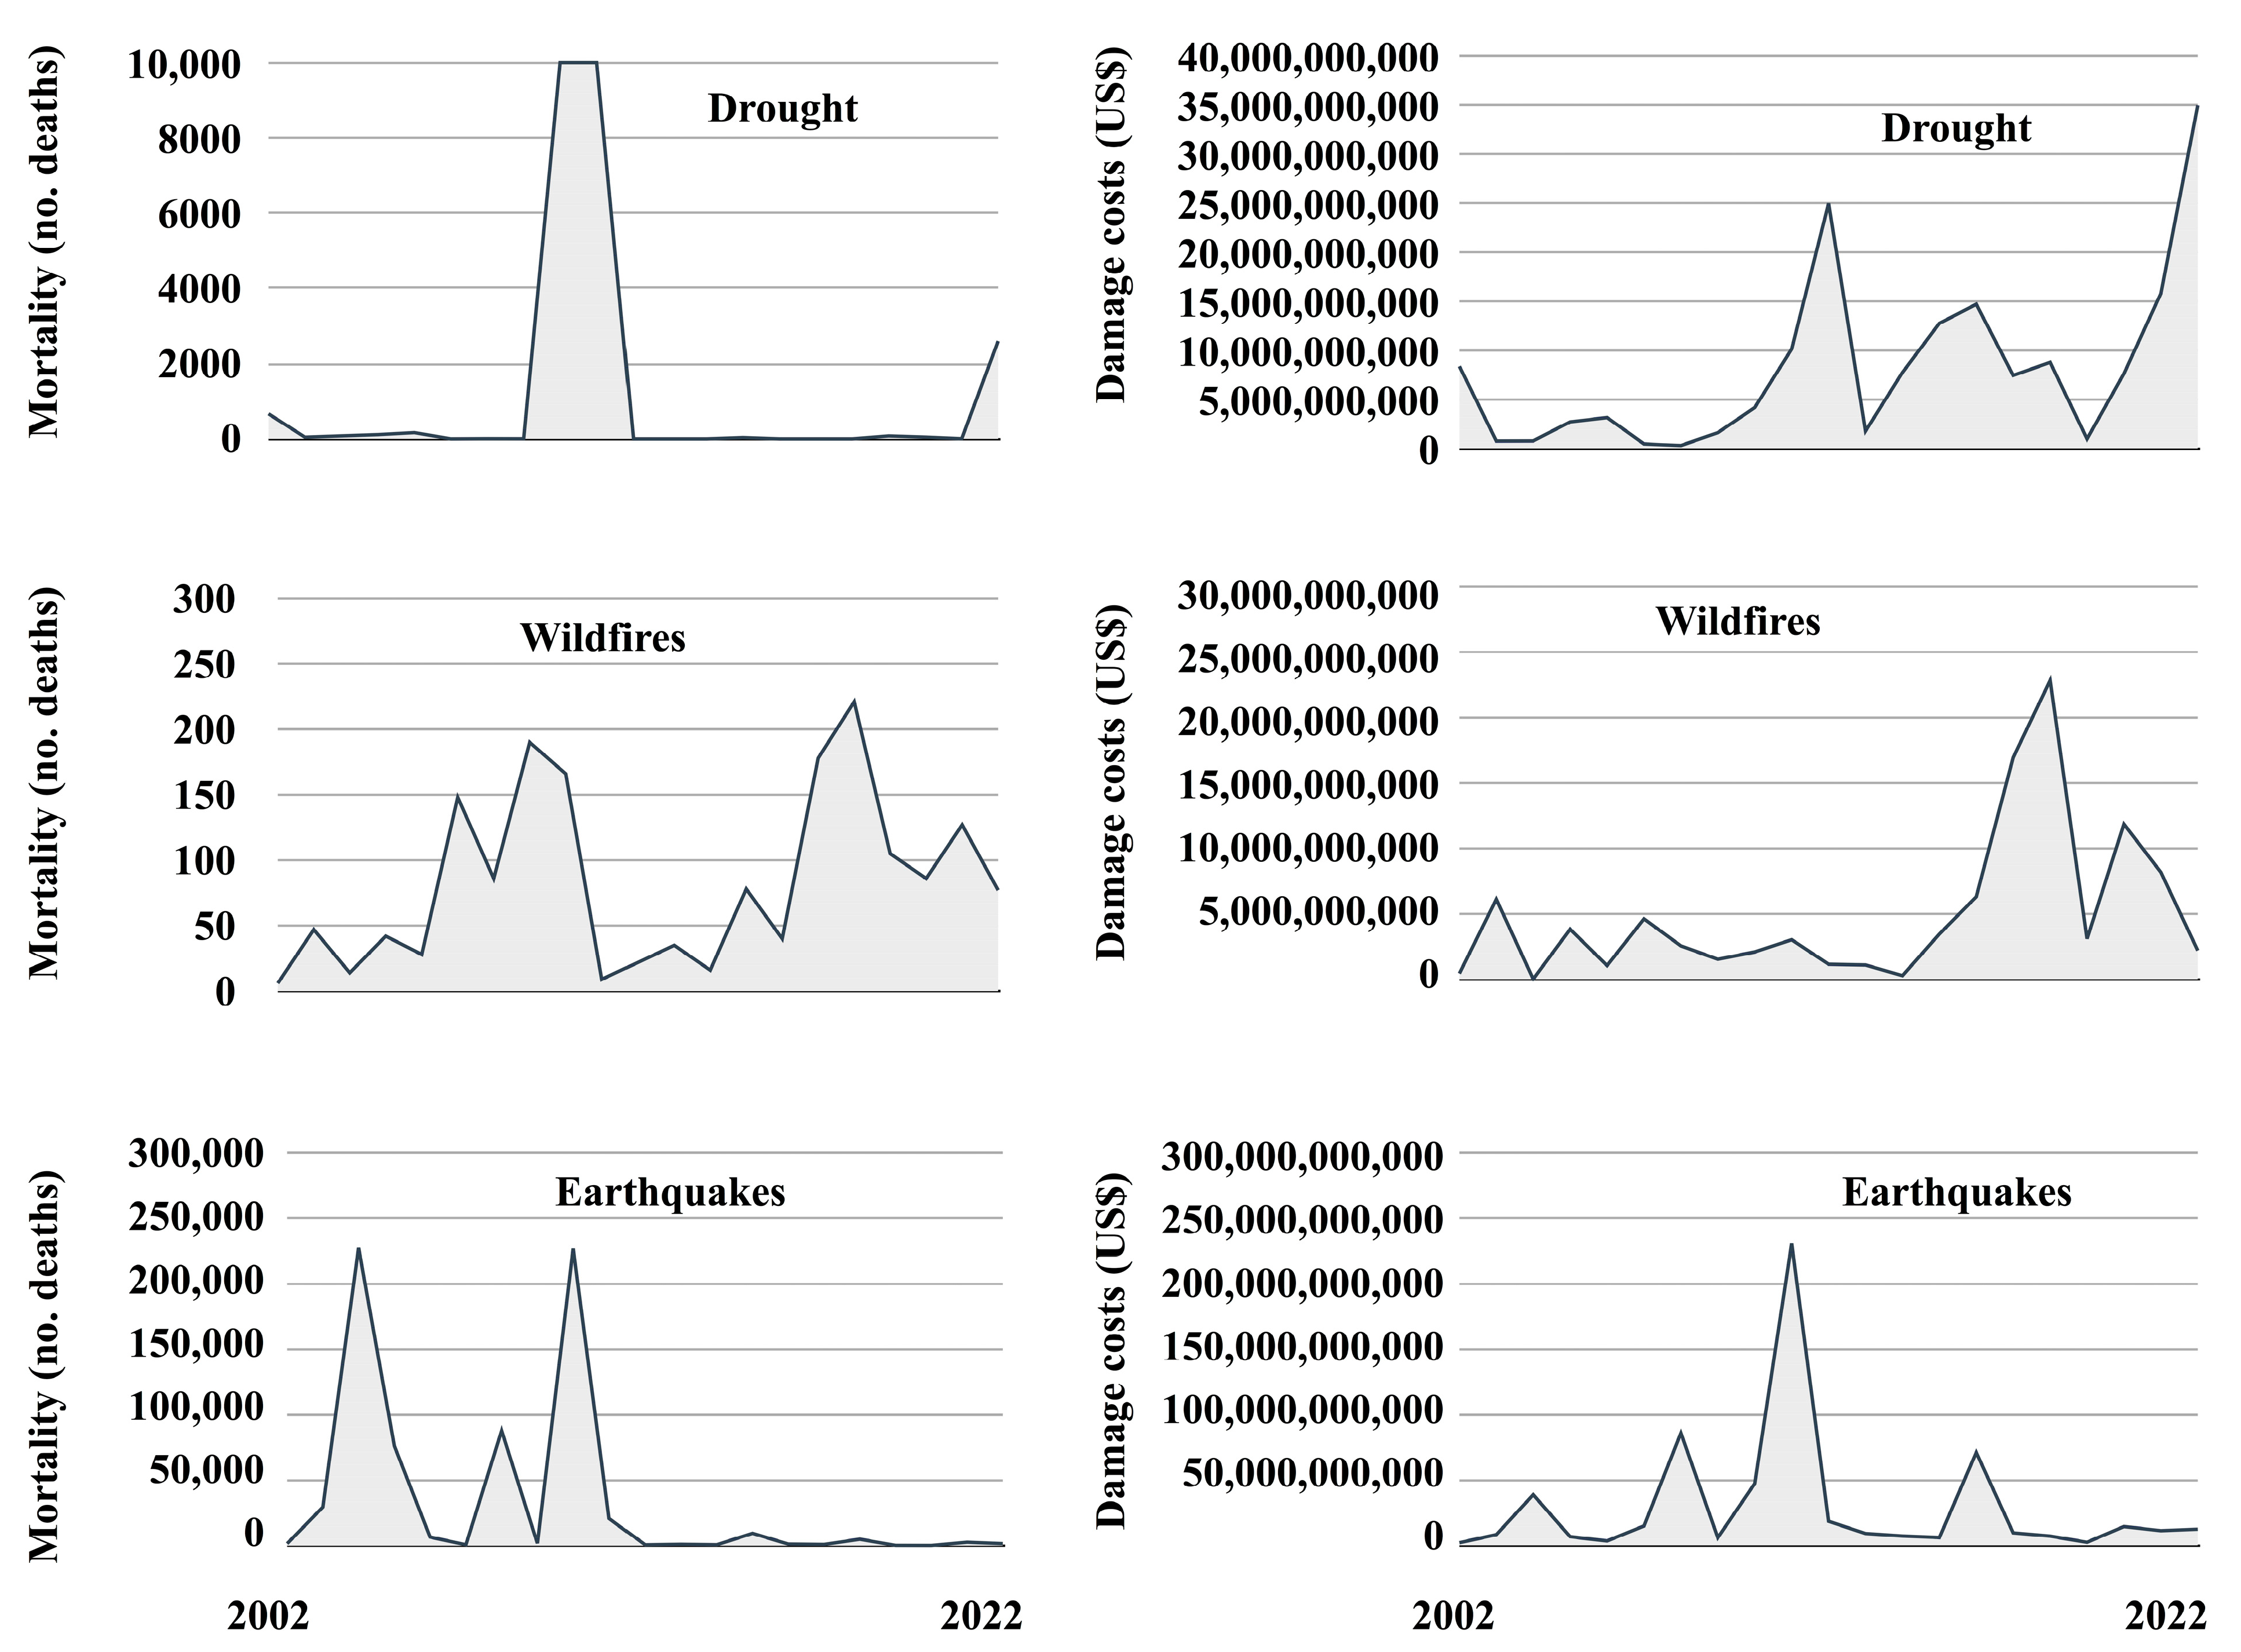
3.1. Trends of Wildfires at Different Spatial Scales

Figure 1 shows that since 2002 the extent of land subject to wildfires has generally been decreasing whilst forest fires at the global scale have not increased. During this period, in every year the extent of forest fires was less than ten percent of the total area of wildfires.
Figure 2 shows the development of annual wildfires for the period 2002 to 2022 in Africa, Europe and N America together with respective land cover types. In many regions and landcover types wildfires are decreasing. One exception are forests in N America. Forest fires in Africa also display a gradually increasing trend. In most countries the burned area is more or less constant or declining with some exceptions, for example, Canada, Bolivia and some other countries where burnt areas are significantly increasing; cf. trends in [18,19,39].
LRA results in Table 1 show coefficients of linear trends (cf. Figure 2) as well as positive and negative relationships of the extent of wildfires as the effect variable and the development of temperature and precipitation as predictors, 2002–2022. The contribution (beta) of temperature to the extent of fires in certain land cover types is negative. In this case, a direct causal relationship theoretically is highly questionable or implausible (spurious regression). Other factors such as land use, land cover change, ecosystem type and/or vegetation structure must be taken into account to explain the trends.
Figure 3 shows that by far the most wildfires occur in Africa (c. 560,000–710,000 fires per year), with intermediate frequencies in Asia and S America (c. 89,000–174,000 per year in Asia, 109,000–171,000 in S America), and lower frequencies in Europe, Oceania and N America (c. 24,000–65,000 fires per year in Europe, 29,000–58,000 in Oceania, and 37,000–71,000 in N America).
Table 2 shows results of the correlations between wildfire frequencies and global average annual temperatures, precipitation rates and atmospheric carbon dioxide concentration. No correlation coefficient shown in this table is highly significant (0.001 level; ***). The relationship between global temperature and atmospheric carbon dioxide concentration is significant at the 0.01 level (**). At the 0.05 level of significance (*) fire frequencies across Asia and Europe, Europe and N America, fires in N America and global precipitation rates, fires in Asia and CO2 concentration, and fires in Europe and CO2 are significant. The relations between precipitation and fire frequency in N America, CO2 and fires in Asia, and CO2 and fires in Europa are negative, i.e., fire frequencies are decreasing despite globally increasing CO2. In any case, global climate change explains very little with regard to the occurrence and extent of fires and the development of the corresponding landscape units.
Table 3 shows results of correlations between the variability of US forest fires and seasonal or annual temperature in the USA, respectively, and precipitation rates, 2012 to 2023. In this case, the correlations between temperatures (especially summer and fall) and extent of forest fires are positive, albeit not significant. The correlation between forest fires and precipitation is almost zero. Thus, the extent of forest fires in the USA during this period is determined to over 80% (1 − R2) by factors other than anomalies of annual temperature and precipitation.

3.2. Representation of Risks and Wildfires in IPCC Reports

Risk’ belongs to the words with a social and psychological meaning. By definition, a risk is a possible event in the future that—as opposed to possibility, probability, prospect or chance—is associated with the expectation of negative effects. Word frequency analyses underline the importance of the IPCC reports for the discourse related to climate, ecological conditions and social risks (see Table S1). The highest frequencies in the sum of all seven reports were found for the terms ‘climate’ (87,202), ‘increase’ (22,532), ‘risk’ (21,794), ‘carbon’ (19,484), ‘warming’ (18,864), ‘temperature’ (14,321), ‘forest’ (13,633), ‘ecosystem’ (12,139), and ‘extreme’ (11,128). Other terms such as ‘heat’ (8231), drought’ (6555), ‘soil’ (5957), ‘benefit’ (5884), ‘fire’ (4224), ‘peat’ (1131), ‘grassland’ (750) or ‘savanna’ (425), which may also be important for understanding ecologically relevant distribution patterns and processes, and which also allow numerical analyses, are represented in medium frequencies.
Table 4 shows the counts of opposite word combinations in IPCC Reports related to trends of wildfires. Word combinations indicating an increase of wildfires or increase of fire weather were counted 49 times, whereas the opposite terms indicating decreasing wildfires or a decrease of fire weather are untraceable in the reports. This shows the one-sided reflection of trends or the so-called repetition bias.
Table 5 represents numbers of text sections indicating an increase or decrease of wildfires, increasing or decreasing risks, an increasing or decreasing maladaptation, a moderate risk, no clear trend or causality doubted in the context of the development of wildfires. The analysis of the 2018 and 2023 reports comprise the whole texts. In the case of the other IPCC reports the summaries for policy makers and technical summaries were examined. The focus was on empirical data and models. Recommendations of the IPCC to mitigate negative effects or adaptation measures were not taken into account.
According to these characteristics, 66 text sections of the IPCC Reports are about an increase of wildfires, increasing risks or increasing maladaptation to wildfires or fire weather, 23 are about a moderate risk, no clear increase or decrease in wildfires or fire weather or causality doubted. The IPCC Report about Climate change and Land confirms the global decline of burned area in recent decades at least in one sentence in the middle of the text section [28]:
“Climate change is playing an increasing role in determining wildfire regimes alongside human activity (medium confidence), with future climate variability expected to enhance the risk and severity of wildfires in many biomes such as tropical rainforests (high confidence). Fire weather seasons have lengthened globally between 1979 and 2013 (low confidence). Global land area burned has declined in recent decades, mainly due to less burning in grasslands and savannahs (high confidence). While drought remains the dominant driver of fire emissions, there has recently been increased fire activity in some tropical and temperate regions during normal to wetter than average years due to warmer temperatures that increase vegetation flammability (medium confidence). The boreal zone is also experiencing larger and more frequent fires, and this may increase under a warmer climate (medium confidence). {Cross-Chapter Box 4 in Chapter 2}”
This sentence is framed by expressions such as “increasing role in determining wildfire regimes”, “expected to enhance the risk and severity of wildfires”, “fire weather seasons have lenthened globally”, “increased fire activity”, “increase vegetation flammability”, “experiencing larger and more frequent fires”, “increase under a warmer climate”. This quote and the text sections in Table S2 indicate a predominantly negative assessment of wildfires. The negative impacts and risks of fires are emphasised, while the benefits for humans or biodiversity are hardly mentioned.
The IPCC confidence level given to the text sections represented by Table 5 was “high” (29), “medium” (22) or “medium to high” (9) in 60 cases, and low (1), high to very high (1) and “very high” (1) in three cases. 27 text sections were not characterized by a level of confidence. 41 text sections are related to global scales or general statements without any spatial reference, the other ones to regional or continental scales.

3.3. Perception of Trends and Risks of Wildfires

Media often do not distinguish between wildfires and forest fires. The word “wildfire” translated to other languages—e.g., via Google translator or Deepl–equates to incendio boschivo, incendio forestal, incendie de forêt, and Waldbrand, for example. By translating it into another language and back, a wildfire in many cases is shifting to a forest fire.
Furthermore, the current online communication about forest fires is much larger than about wildfires (77:23 percent via Google; accessed on 5 October 2024). Therefore, the digital discourse about wildfires and forest fires is somewhat intermingled. This view is underlined e.g., by the dramatic fire in Lahaina on Maui, Hawaiian Islands, in August 2023, which left more than hundred people dead and which has often been designated a “forest fire” in TV, newspapers and online reports, even if there was no forest—but instead a large fire in the city which destroyed many old houses that were constructed using a lot of timber.
The first ten links connected with the term “wildfires” and the first ten links connected with the combination “increase decrease wildfires” on the internet showed the following headings and text fragments (Table 6).
These first 20 links to the respective webpages indicate a focus on the connection between climate change, climate and/or weather conditions and the occurrence of wildfires. They point to or question an increase in wildfires and/or extreme wildfires, but do not mention the global decline in fires or a decrease in burnt landscapes at the regional level. Furthermore, they are mainly attributed to risks and negative effects—“unplanned”, ”uncontrolled”, “unpredictable”, “getting worse”, “hazardous air pollutants”, “wildfire risks”. Benefits are not mentioned, neither for humans nor for ecosystems or species diversity.
Mortality and damage costs are important factors affecting the perception. Drought is a direct effect of weather conditions. The occurrence of wildfires depends on weather and other conditions independent of climate, while earthquakes are geological phenomena that are independent of weather and climate (Figure 4).
Figure 4 shows a high variability in death rates and damage costs caused by drought, wildfires and earthquakes at global scales from 2002 to 2022. Fatalities and damage costs from wildfires show an increasing trend (albeit not significant) but overall the numbers are lower than the death rates and costs from droughts or earthquakes.
Table 7 shows the relationship between global temperature and precipitation anomalies, and damage costs caused by drought, wildfires and earthquakes. Damage costs caused by wildfires are positively related with warming. However, the relationship between precipitation and damage costs caused by earthquakes is also significant (0.05 level of significance). This example shows that climatic factors can overshadow other relevant factors such as e.g., zone of high tectonic activity.

4. Discussion

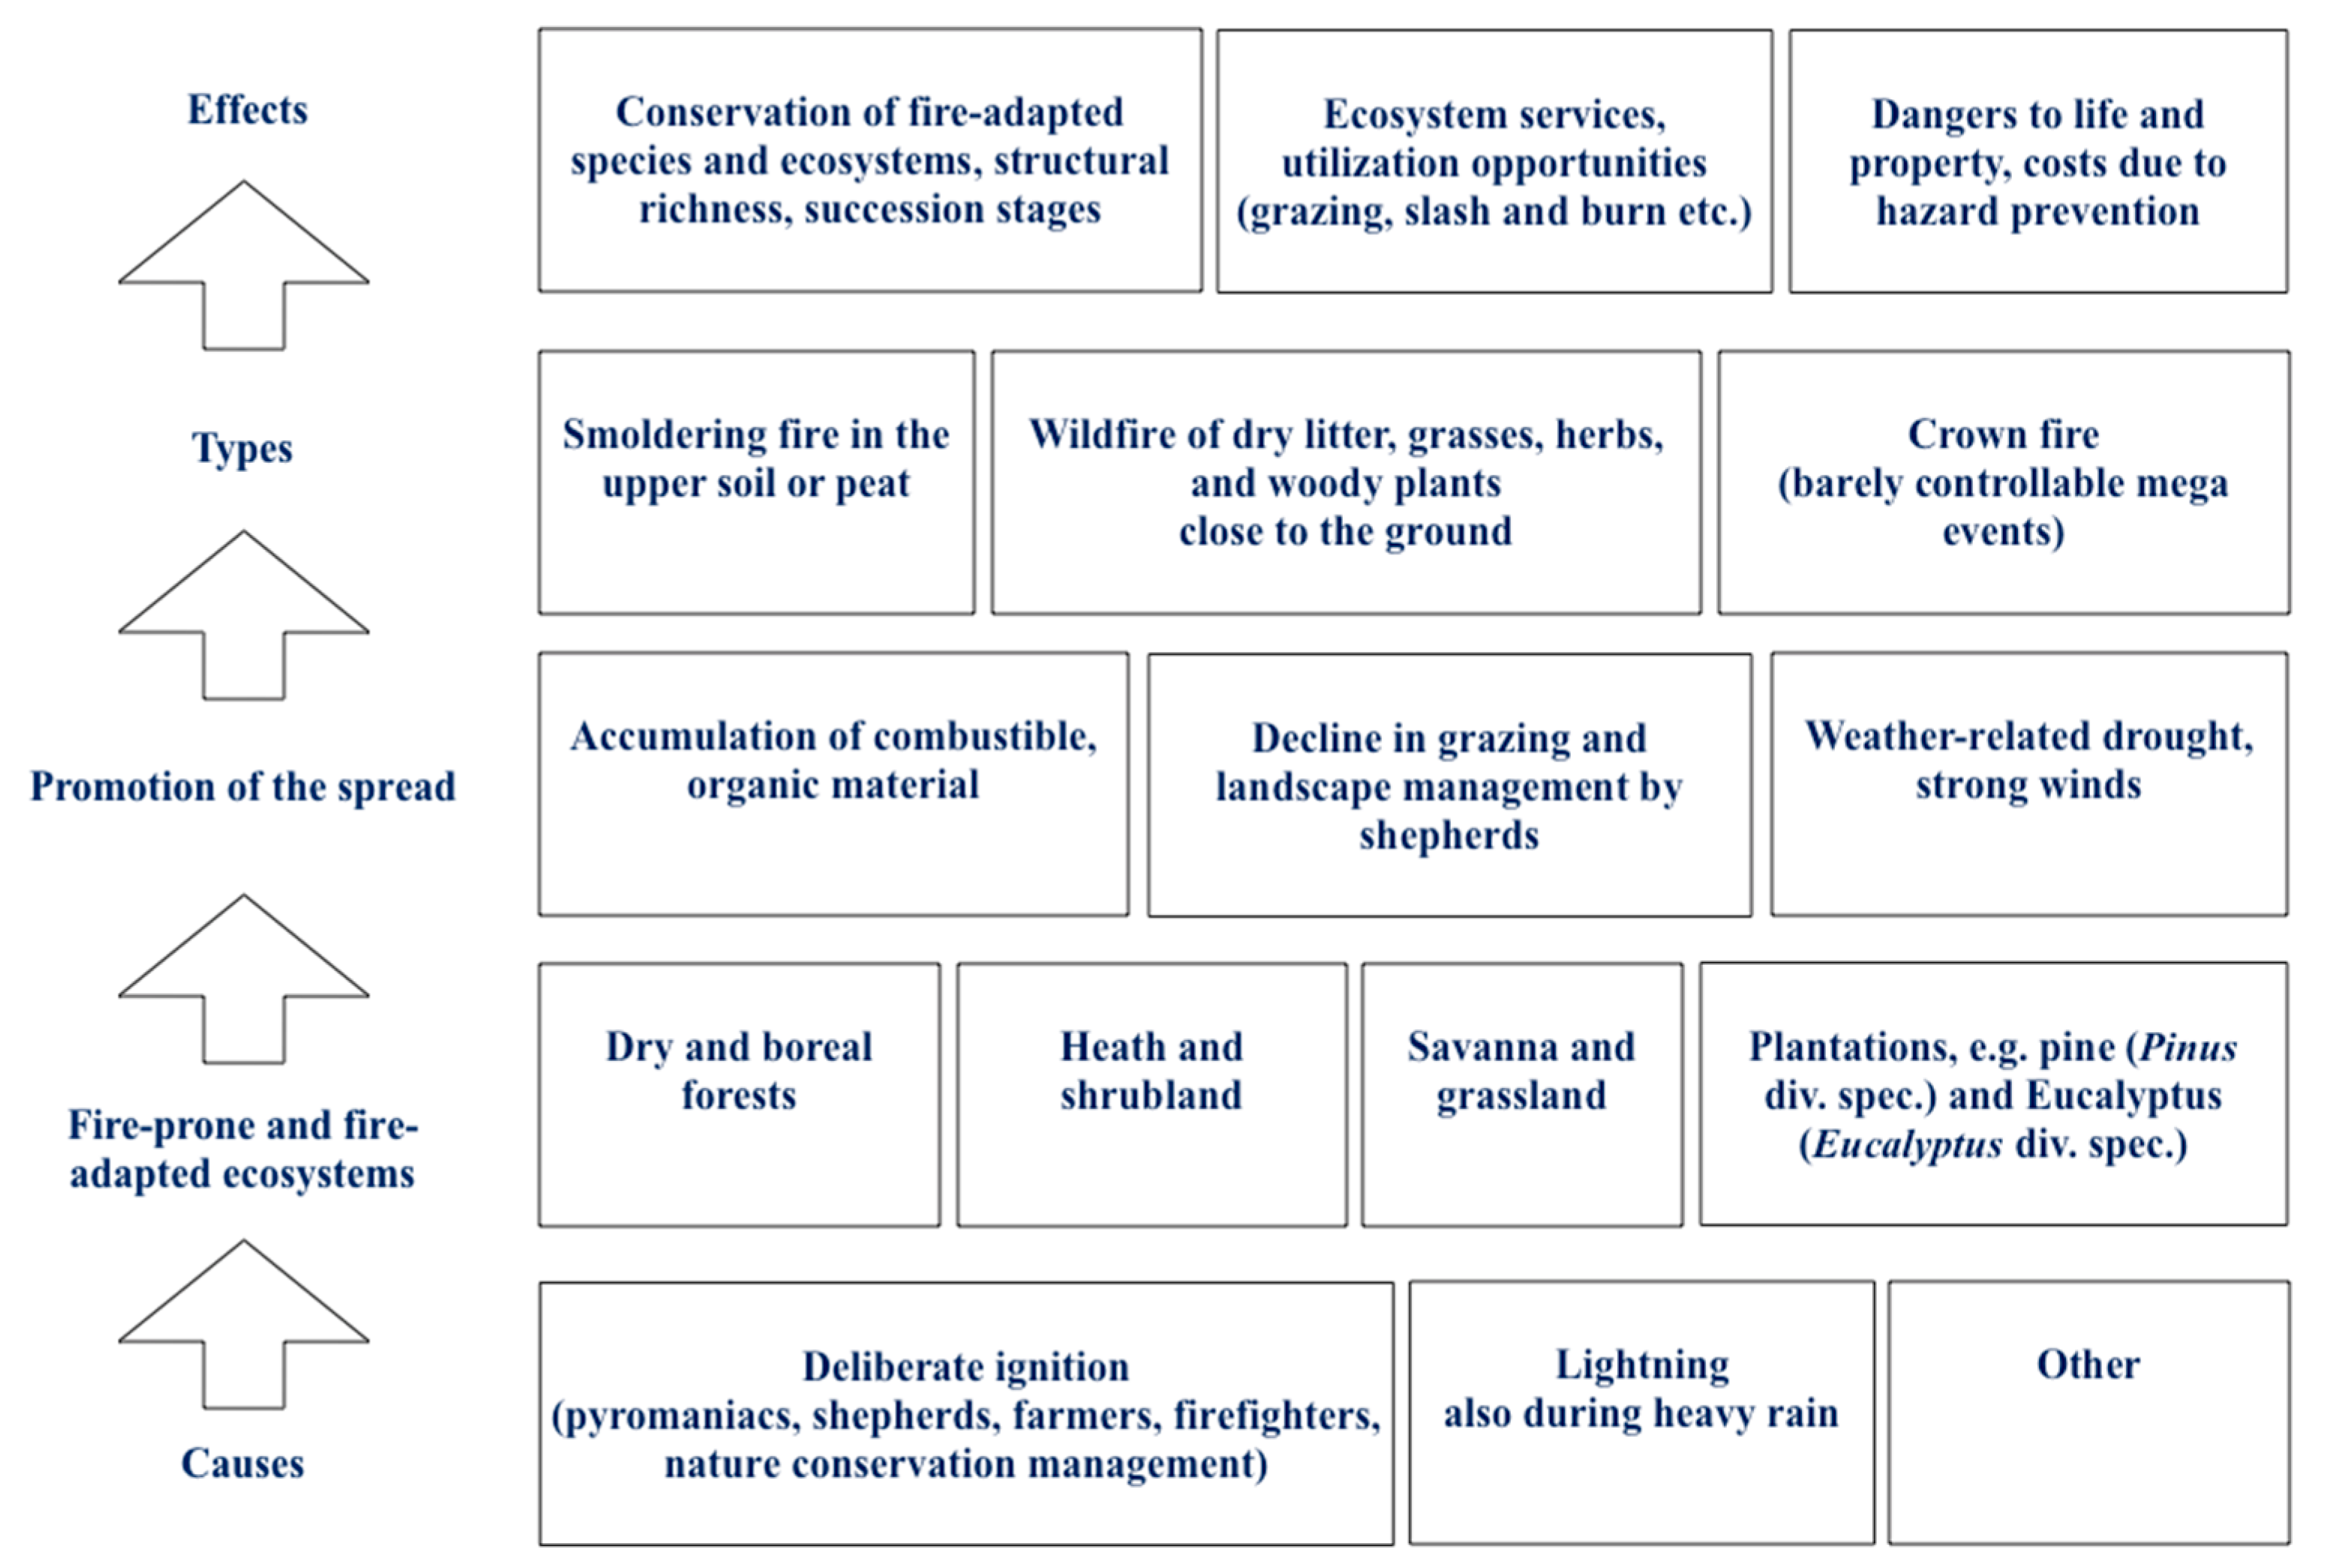
4.1. General Ecological Conditions, Processes and Trends of Wildfires

Wildfires are difficult to predict. When assessing fire risk to support local preparedness and fire management, various ecological aspects are taken into account. These can be the proximity of combustible landscape units, flammability and density of all materials, topography and soil conditions, species composition and vegetation structure including the age class of trees, the probability of fire weather, land use including burning, firefighting, nature conservation management, and livestock grazing but also the distribution patterns of houses and settlements and the shape of the wildland-urban interface [43,44].
At global scales and in many regions wildfires are declining for decades. However, differences in this trend have been identified with respect to climate zone, land cover type and use. Burned vegetation of open landscapes is declining more than, for example, the fire in forests or bogs [45]. An expansion of wildfires has been detected at the wildland-urban interface, most likely due to the growth of cities and urban boundaries in all parts of the world [46].
In general, more reliable data and longer timelines with regard to the annual burned area (in hectares) are available than frequencies (i.e., weeklys cumulative number of fires in a region per year). Also the severity of the fires is part of the current discussion, even if different definitions are used and relate, inter alia, to mortality, costs and/or temperatures that can be detected via remote sensing [47]. An increasing severity of forest fires has been indicated in some regions of Australia, N America, Mediterranean, and the boreal zone [48,49], while grazing in forest reduced the severity [50]. However, we did not find any robust quantification for severity measures and trends focusing on other factors than climate change and drought as well, but instead, many forecasts about a global increase of severe fires and dramatic or uncontrollable mega-fire events on Earth e.g., [51].
Haas et al. reviewed empirical studies on predictors for the development of fires. In contrast to popular perception, ignitions in general are not a limiting factor for the occurrence of wildfires. Variables considered important for predictions of burnt area were precipitation, vegetation cover as a measure of fuel continuity, temperature, atmospheric humidity as a measure of fuel drying, antecedent vegetation, vegetation type, lightning, antecedent precipitation, economic aspects/land use, soil moisture, and other factors of minor importance [52]. Not all of these variables are interrelated with climate change, and various climate-related and climate-independent factors for the development depend on regional conditions such as land cover and land use [53].
Land cover change, the expansion and intensification of agriculture, increasing infrastructure and fragmentation of landscapes, the reduction of biomass through intensive grazing in certain regions, and effective fire-fighting measures, also by controlled burning, have been identified as important factors limiting the occurrence and favouring the decline of wildfires at landscape to global scales. Furthermore, many regions and ecosystems can be identified that never burn. Even though climate change currently favours the occurrence of fires at least in certain continental areas, land use and land cover change, inter alia, have resulted in a global decline in fires in recent decades. This shows that climate factors can be overcompensated, but also that socio-demographic influences can have a strong and long-term effect on ecological conditions (Figure 5).
Humans and lightning strikes are the main causes for burning landscapes and settlements. Other causes represent rare ignition events [61]. Heath and shrubland, savanna and grassland, dry and boreal forests as well as tree plantations are the vegetational units comprising the largest fraction of the area burning every year. Many other units such as bogs or settlements can also burn but these represent only a small percentage of the whole area affected [62,63]. After ignition, fires can spread under specific ecological conditions. Flammable material in the surroundings, including living and dead biomass, strong winds, and dry and hot weather conditions can promote an existing fire. Landscapes ignited by lightning strikes can burn even if it is wet. In wet savanna such as Cerrado in Brazil this is quite normal [64]. In contrast, land use by farmers, activities of shepherds and livestock grazing can reduce the likelyhood, area and severity of wildfires [65].
If there is enough dry organic material in the soil, a smoldering fire can spread. However, in most cases woody shrubs, dry herbs and grasses, and dry organic matter on top of the soil surface is what is burning. Extremely hot and difficult to control events with fires in the tree crown can occur, for example, when flammable trees such as pines (Pinus div. spec:) or Eucalyptus spp. grow in dense stands or monocultures [66,67].
Nevertheless, to better understand the ecology, frequency, risks and benefits of fires for humans, ecosystems and species diversity, more research is needed. For example, the relationships between area and frequency including extreme and mean ecological conditions are not fully understood [68,69]. Resins and oils are flammable substances that are found in many woody plants, especially conifers, Eucalyptus trees but also shrubs and herbs of diverse ecosystems adapted to fire as well. As an essential component of combustible biomass, these substances can play a decisive role in the spread of fires. At elevated air temperatures in particular, these organic components are released as combustible gases through the living surface of the plants into the surrounding air. They react with oxygene and lead, together with other burning substances, to a decrease in the oxygen concentration of the near surroundings, and therefore, may protect the living biomass if the wind is not too strong. It can be assumed, that the amount of these substances has an influence on the frequency (increase?), area (?) and severity (decrease?) of the fires [70,71]. However, the interaction of these factors in space and time under the conditions of land use and weather/climate is still poorly understood. The ecological impact of the decline in fires and how this decline affects biodiversity, ecosystem functions and populations of fire-adapted species needs to be analysed in relation to climate zone, weather conditions, traditional use, modern fire management and ecosystem type. Open questions, uncertainties and the focus on global scales, on the other hand, give space for speculation and the assertion of essential climate factors favouring wildfires [72].
The atmospheric carbon dioxide concentration is continuously increasing and its spatial variability is comparatively low. Other factors such as temperature, humidity, precipitation, wind speed, land cover, ecosystem type, vegetation structure, biodiversity, soil conditions including organic matter, and land use including environmental investments and management vary in space and time. Therefore, it is useful to analyse ecological processes including wildfires and management strategies at landscape scales and not global scales. The study of Jones et al. underscores the importance of regional considerations when developing strategies to manage fire and protect forest ecosystems [73]. In general, weather conditions and climate zone are ecologically important. However, also the contribution of climate change on the occurrence, extent, frequency, and severity of wildfires and CO2 emissions caused by wildfires depends on local and regional factors, cf. e.g., [74,75,76].

4.2. Presentation of Scientific Findings and Prognoses in IPCC Reports

The organizational structure of the IPCC, the reporting process and the IPCC reports are subject to scientific criticism, and the criticism of how the relationship between climate change, ecology and social risks is performed is extensive [77]. Objections to interrelationships, processes, impacts, projections and scientific integrity such as those presented by the IPCC reports come from various disciplines, including statistics and modeling, climatology, environmental sciences, ecology, social sciences, economics and environmental psychology. The criticism relates, inter alia, to the presentation of empirical data, models, statistics and the assessment of the confidence level [78,79,80,81,82,83], to the internal, consecutive process of combining scientific information and messages [84,85,86,87], to the cognitive distortions resulting from the selection process, repetition and emphasis on alarming scenarios, for discussion cf. [88], and to the aim of guiding environmental and energy politics, especially in the Summaries for Policymakers [89]. Thus, the biased presentation of wildfires and fire ecology as has been demonstrated here, is in line with other analyses that show a questionable or biased presentation of scientific findings by the IPCC. Even if these are mentioned in a few text sections, benefits of fires for people, fire-adapted ecosystems and biodiversity are almost completely ignored or overshadowed by a miriad of negative examples.
A downward trend in fires at a global or regional level, the benefits of fires for humans, ecosystems and biodiversity, and the decline in carbon dioxide emissions from wildfires over many decades are only mentioned on occasion [90]. The following text section represents one of the positive eamples [30]:
“Total emissions from fires have been on the order of 8.1 GtCO2-eq yr–1 in terms of gross biomass loss for the period 1997–2016 (SRCCL, Chapter 2, and Cross-Chapter Box 3 in Chapter 2). Reduction in fire CO2 emissions was calculated to enhance land carbon sink by 0.48 GtCO2-eq yr–1 for the 1960–2009 period (Arora and Melton 2018) (SRCCL, Table 6.16).”
The central message of Arora and Melton as indicated in the title of their publication, is that carbon dioxide emissions are declining since 1930. This es not reviewed in IPCC reports, neither in the texts, nor in the Summaries for Policy Makers.
The IPCC addresses climate change with the aim of informing the public and policy makers and providing science-based recommendations to limit the risks. However, in the case of wildfires, general trends, the benefits of wildfires at macroecological scales and best practice examples of management are only marginally considered. It is therefore not possible to provide an undistorted picture of reality. Misleading representations can be supported by scientific uncertainties and/or explained by a different focus and motivation. The IPCC’s reporting process follows its own dynamic, which differs from standard scientific practice. The messages and summaries of such extensive meta-analyses, which have their own procedure for confidence assessment, do not have to meet the same ethical standards as the usual scientific procedures and publications. The selection and composition of—in almost all individual text sections quite realistically and convincingly portraited—findings, such as those about wildfires in the IPCC reports, which are then aggregated in the summaries and dispersed via other media, can lead to perceptions that do not adequately reflect or, in some cases, even contradict ecological findings and remote sensing studies. Furthermore, not all ecological conditions and processes at a macroecological scale need to be explained through the lens of climate change.
Overall, three problems can be identified in connection with the presentation of complex human-environment interactions in IPCC reports and the dissemination of information by other media: (i) insufficient scientific accuracy and lack of consideration of ecological findings, (ii) cognitive distortions and (iii) the often uncritical dissemination of alarmist forecasts.

4.3. Repetition Bias and Negativity Bias

Global annual mortality and direct damage costs caused by wildfires are relatively small compared e.g., to earthquakes, drought or car accidents, cf. Figure 4 and [91]. However, the related trendlines are not falling parallel to the declining extent of wildfires. Reasons for this phenomenon have to be discussed in the context of the rapid growth of the wildland-urban interface all over the world, a declining livestock grazing at least in certain regions, the totally uneven distribution patterns of investments in private goods, infrastructure and firefighting, increasing numbers of tree plantations and a forestry interested in a dense tree-layer [92].
Both the knowledge surrounding and the perception of wildfires, as part of the climate debate, has been the subject of recent research. Surveys have been conducted to determine the level of knowledge on wildfires that residents in areas with frequent fires have. The perception of wildfires, well-being and the willingness to pay for protection of life and goods were examined e.g., in the USA [93,94]. Concerns about increasing fires and the conviction that the extent, frequency and severity of wildfires increase due to global warming and increasing drought were confirmed [95,96,97]. Linking the ecology of wildfires and the risks they pose to people’s lives and property with global parameters such as greenhouse gas emissions or warming increases the perception of the risks and can significantly capture the awareness [98,99,100,101]. Conversely, the risk of forest fires can reduce the economic value of forests through indirect effects, for example through changes in income expectations [102].
CO2 emissions globally increase since more than 150 years. CO2 emissions caused by wildfires globally decrease since many decades (at least since 70 years). CO2 emissions caused by forest fires globally are more or less constant during the last decades. CO2 emissions caused by forest fires in boreal zones and certain other regions increase during the last 20–25 years [cf. Figure 1, Figure 2 and Figure 4, and refs. there]. Under these circumstances, it is possible to identify regions and ecosystems where fires and/or CO2 emissions caused by fires are on the rise along with global warming and/or prolonged drought. The attribution of extreme events to climate change is a recurring feature of public communication, as many dramatic events such as floods, heat, drought and also wildfires are associated with climate change, climate zone and/or weather conditions. The establishment of the relationship between climate/weather and catastrophes in the climate communication has exacerbated tensions between people including scientists who worry about inappropriate alarmism and people who emphasize responsibility to those most at risk or harmed by extreme weather events or wildfire [103].
As can be summarized, wildfires and especially forest fires in the world are often discussed with a focus on increasing risks under climate change scenarios. This confirms and reinforces both the Repetition and Negativity Bias of the observations.

5. Conclusions

Scientists should, in principle, be able to publish their findings with the expectation that these are reflected accurately and not in a biased manner. Ecological conditions and processes vary from one climate zone to the other, from landscape to landscape, and from one year to another year. Therefore, the ecological factors influencing wildfires and their significance in regards to the risks and benefits for humans, other species and ecosystems need to be analysed at local to regional scales. Even if global warming and regionally persistent droughts increase the likelihood of wildfires, local and regional measures that are already successful can be intensified to limit and prevent deaths and damage. If the reduction of greenhouse gas emissions remains as ineffective globally as it currently is, land use management offers many opportunities to offset or overcompensate for the fire-ecological impacts of weather or climate. Human forcing in the landscape has long been in place and just needs to be implemented more consistently. Forest management, agriculture (including livestock grazing), the reduction of combustible material, firefighting (including controlled burning), and many other measures can be scaled up with respect to the landscape unit and according to the needs.
In general, we recommend presenting ecological findings in a more balanced and less superficial way and including more ecological expertise in future. Otherwise, the polarisation between climate change alarmism and climate change denial could intensify and further undermine trust in science. For the purpose of nature conservation, it is also necessary to reflect the benefits of fires in the landscape. The goal of completely eradicating wildfires is unacceptable with respect to the aspiration and principles of the Convention on Biological Diversity (CBD).

Supplementary Materials

The following supporting information can be downloaded at: https://www.mdpi.com/article/10.3390/su17010134/s1, Table S1: Word frequencies in IPCC Reports (2018–2023); Table S2: Text sections.

Author Contributions

Conceptualization, analyses of ecological findings, Text Mining including Word Frequency Analyses, visualization (figs.) and writing of the first draft, C.H., formal analyses/statistics, V.M.-B. All authors have read and agreed to the published version of the manuscript.

Funding

This research received no external funding.

Institutional Review Board Statement

Not applicable.

Informed Consent Statement

Not applicable.

Data Availability Statement

Data are contained within the article, in Tables S1 and S2 (Supplementary Materials), or adapted from freely available databases on the internet (cf. refs.).

Acknowledgments

We are thankful to David Walmsley, Leuphana University in Lüneburg, for comments, information and critical remarks.

Conflicts of Interest

The authors declare no conflicts of interest.

References

  1. Walter, H. Einfuhrung in die Phytologie III: Grandlagen der Pflanzenverbreitung; Eugen Ulmer Verlag: Stuttgart, Germany, 1951; p. 509, (own translation from German language). [Google Scholar]
  2. Fidelis, A. Is fire always the “bad guy”? Flora 2020, 268, 151611. [Google Scholar] [CrossRef]
  3. Huntley, B. The ecological role of fire. In Ecology of Angola: Terrestrial Biomes and Ecoregions; Springer Nature: Cham, Switzerland, 2023. [Google Scholar] [CrossRef]
  4. Santos, F.; Bailey, J.K.; Schweitzer, J.A. The eco-evolutionary role of fire in shaping terrestrial ecosystems. Func. Ecol. 2023, 37, 2090–2095. [Google Scholar] [CrossRef]
  5. Pinto, M.F. Methodological and cognitive biases in science: Issues for current research and ways to counteract them. Perspect. Sci. 2023, 31, 535–554. [Google Scholar] [CrossRef]
  6. Karyotakis, M.-A.; Lo, K. The political ecology of wildfire: Media and the politics of blame in the Evros wildfires in Greece. Trees For. People 2024, 18, 100682. [Google Scholar] [CrossRef]
  7. UN Environment Programme. Report Spreading Like Wildfire. The Rsing Threat of Extraordinary Landscape Fires. Available online: https://www.unep.org/resources/report/spreading-wildfire-rising-threat-extraordinary-landscape-fires (accessed on 10 September 2024).
  8. Jalin, H.; Sapin, A.; Macherey, A.; Boudoukha, A.H.; Congard, A. Understanding eco-anxiety: Exploring relationships with environmental trait affects, connectedness to nature, depression, anxiety, and media exposure. Curr. Psychol. 2024, 43, 1–14. [Google Scholar] [CrossRef]
  9. Erofeeva, I.; Tolstokulakova, Y.; Muravyov, A. The Coronavirus Pandemic in the Conceptual Sphere of Media Discourse in Russia and China: A Survival Strategy. Theor. Pr. Issues J. 2021, 10, 78–93. [Google Scholar] [CrossRef]
  10. Lazarus, J. Negativity Bias: An evolutionary hypothesis and an empirical programme. Learn. Motiv. 2021, 75, 101731. [Google Scholar] [CrossRef]
  11. Snezhkova, A.; Barebina, N.; Semenova, O. Identification linguistic markers of alarmism in media discourse. Bull. Baikal State Univ. 2023, 33, 433–440. [Google Scholar] [CrossRef]
  12. Korteling, J.E.; Paradies, G.L.; Sassen-van Meer, J.P. Cognitive bias and how to improve sustainable decision making. Front. Psychol. 2023, 14, 1129835. [Google Scholar] [CrossRef] [PubMed]
  13. Boykoff, M.; Pearman, O. Now or never: How media coverage of the IPCC Special Report on 1.5 °C shaped climate-action deadlines. One Earth 2019, 1, 285–288. [Google Scholar] [CrossRef]
  14. Painter, J.; Marshall, S.; Leitzell, K. Communicating climate futures: A multi-country study of how the media portray the IPCC scenarios in the 2021/2 Working Group reports. Clim. Change 2024, 177, 82. [Google Scholar] [CrossRef]
  15. Wachinger, G.; Renn, O. Risk Perception and Natural Hazards; CapHaz-Net WP3 Report; DIALOGIK Non-Profit Institute for Communication and Cooperative Research: Stuttgart, Germany, 2010. Available online: https://edmo.seadatanet.org/report/2199 (accessed on 1 October 2024).
  16. Zang, Y.; Hwang, S.N.; Lindell, M.K. Hazard proximity or risk perception? Evaluating effects of natural and technological hazards on housing values. Environ. Behav. 2010, 42, 597–624. [Google Scholar] [CrossRef]
  17. Marques, V.; Ursi, S.; Lima Silva, E.; Katon, G. Environmental perception: Notes on transdisciplinary approach. Sci. J. Biol. Life Sci. 2020, 1, 1–9. [Google Scholar] [CrossRef]
  18. Global Wildfire Information System (GWIS). GWIS Statistics Portal (with Minor Processing by Samborska, V. Ritchie, H. Wildfires). Available online: https://gwis.jrc.ec.europa.eu/apps/gwis.statistics/ (accessed on 20 October 2024).
  19. Samborska, V.; Ritchie, H. Wildfires. Available online: https://ourworldindata.org/wildfires (accessed on 18 October 2024).
  20. Artés, T.; Oom, D.; de Rigo, D.; Houston-Durrant, T.; Maianti, P.; Liberta, G.; San-Miguel-Ayanz, J. A global wildfire dataset for the analysis of fire regimes and fire behaviour. Sci. Data 2019, 6, 296. [Google Scholar] [CrossRef] [PubMed]
  21. Global Wildfire Information System. GWIS Weekly Number of Fires. Available online: https://gwis.jrc.ec.europa.eu/apps/gwis.statistics/seasonaltrend (accessed on 20 October 2024).
  22. NOAA. Global Precipitation Anomaly. Processed via the US EPA in Our World in Data. Available online: https://ourworldindata.org/grapher/global-precipitation-anomaly (accessed on 12 October 2024).
  23. NOAA. Register for NOAAGlobalTemp. Available online: www.ncei.noaa.gov/products/land-based-station/noaa-global-temp (accessed on 12 October 2024).
  24. NOAA. Hurricane Database. In: Ritchie, H.; Rosado P. Natural Disasters. Available online: https://ourworldindata.org/natural-disasters (accessed on 12 October 2024).
  25. NOAA. Mauna Loa CO2 Annual Mean Data (Text) or (CSV). Available online: https://gml.noaa.gov/webdata/ccgg/trends/co2/co2_annmean_mlo.txt (accessed on 12 October 2024).
  26. IPCC. Global Warming of 1.5 °C. An IPCC Special Report on the Impacts of Global Warming of 1.5 °C Above Pre-Industrial Levels and Related Global Greenhouse Gas Emission Pathways, in the Context of Strengthening the Global Response to the Threat of Climate Change, Sustainable Development, and Efforts to Eradicate Poverty; Cambridge University Press: Cambridge, UK; New York, NY, USA, 2018; p. 616. [CrossRef]
  27. IPCC. IPCC Special Report on the Ocean and Cryosphere in a Changing Climate; Cambridge University Press: Cambridge, UK; New York, NY, USA, 2019; p. 755. [CrossRef]
  28. IPCC. Climate Change and Land: An IPCC Special Report on Climate Change, Desertification, Land Degradation, Sustainable Land Management, Food Security, and Greenhouse Gas Fluxes in Terrestrial Ecosystems; Cambridge University Press: Cambridge, UK; New York, NY, USA, 2019; pp. 44–896. [CrossRef]
  29. IPCC. Climate Change 2021: The Physical Science Basis. Contribution of Working Group I to the Sixth Assessment Report of the Intergovernmental Panel on Climate Change; Cambridge University Press: Cambridge, UK; New York, NY, USA, 2023; p. 2391. [CrossRef]
  30. IPCC. Climate Change 2022: Mitigation of Climate Change; Cambridge University Press: Cambridge, UK; New York, NY, USA, 2023; pp. 783–2042. [CrossRef]
  31. IPCC. Climate Change 2022: Impacts, Adaptation and Vulnerability; Cambridge University Press: Cambridge, UK; New York, NY, USA, 2023; p. 3056. [CrossRef]
  32. Climate Change 2023: Synthesis Report. Contribution of Working Groups I, II and III to the Sixth Assessment Report of the Intergovernmental Panel on Climate Change; IPCC: Geneva, Switzerland, 2023; p. 184. [CrossRef]
  33. Whelan, R.J. The Ecology of Fire; Cambridge Studies in Ecology; Cambridge University Press: Cambridge, UK, 2008; ISBN 978-0521338141. [Google Scholar]
  34. Müller-Bendict, V. Grundkurs Statistik in den Sozialwissenschaften, 5th ed.; Verlag für Sozialwissenschaften: Wiesbaden, Germany, 2011. [Google Scholar] [CrossRef]
  35. Warton, D.I. Eco-Stats: Data Analysis in Ecology; Springer: Cham, Switzerland, 2022. [Google Scholar] [CrossRef]
  36. Feldman, R.; Sanger, J. The Text Mining Handbook: Advanced Approaches in Analyzing Unstructured Data; Cambridge University Press: Cambridge, UK; New York, NY, USA, 2006. [Google Scholar]
  37. Marsi, E.; Øzturk, P. Text Mining of related natural science literature. Lect. Notes Comput. Sci. 2016. [Google Scholar] [CrossRef]
  38. Farrell, M.J.; Brierley, L.; Willoughby, A.; Yates, A.; Mideo, N. Past and future uses of text mining in ecology and evolution. Proc. R. Soc. B 2022, 289, 20212721. [Google Scholar] [CrossRef]
  39. Our World in Data. Average Temperature Anomaly. Data Source: Met Office Hadley Centre (2024). Available online: https://ourworldindata.org/grapher/temperature-anomaly (accessed on 1 September 2024).
  40. National Oceanic and Atmospheric Administration (NOAA). Global Time Series. Available online: www.ncei.noaa.gov/access/monitoring/climate-at-a-glance/global/time-series (accessed on 1 October 2024).
  41. National Oceanic and Atmospheric Administration (NOAA). EPA’s Climate Change Indicators in the United States. Temperature Anomalies Calculated in °C. Available online: https://epa.gov/climate-indicators/climate-change-indicators-seasonal-temperature (accessed on 18 October 2024).
  42. National Oceanic and Atmospheric Administration; HURDAT. Accumulated Cyclone Energy Index. Processed by Our World in Data. 2024. Available online: https://ourworldindata.org/grapher/ace-north-atlantic-hurricanes (accessed on 1 July 2024).
  43. Arno, S.F.; Scott, J.H.; Hartwell, M.G. Age-Class Structure of Old Growth Ponderosa Pine/Douglas Fir Stands and Its Relationship to Wildfire History; U.S. Forest Service Research Paper; Intermountain Research Station: Ogden, UT, USA, 1995.
  44. Schmidt, J.I.; Ziel, R.H.; Calef, M.P.; Varvak, A. Spatial distribution of wildfire threat in the far north: Exposure assessment in boreal communities. Nat. Hazards 2024, 120, 4901–4924. [Google Scholar] [CrossRef]
  45. Chen, Y.; Hall, J.; van Wees, D.; Andela, N.; Hantson, S.; Giglio, L.; van der Werf, G.R.; Morton, D.C.; Randerson, J.T. Multi-decadal trends and variability in burned area from the fifth version of the Global Fire Emissions Database (GFED5). Earth Syst. Sci. Data 2023, 15, 5227–5259. [Google Scholar] [CrossRef]
  46. Tang, W.; He, C.; Emmons, L.; Zhang, J. Global expansion of wildland-urban interface (WUI) and WUI fires: Insights from a multiyear worldwide unified database (WUWUI). Environ. Res. Lett. 2024, 19, 044028. [Google Scholar] [CrossRef]
  47. Fernández-García, V.; Alonso-González, E. Global patterns and dynamics of burned area and burn severity. Remote Sens. 2023, 15, 3401. [Google Scholar] [CrossRef]
  48. May-Stubbles, J.C.; Gracanin, A.; Mikac, K.M. Increasing fire severity negatively affects greater glider density. Wildlife Res. 2022, 49, 709–718. [Google Scholar] [CrossRef]
  49. Wassermann, T.N.; Mueller, S.E. Climate influences on future fire severity: A synthesis of climate-fire interactions and impacts on fire regimes, high-severity fire, and forests in the western United States. Fire Ecol. 2023, 19, 43. [Google Scholar] [CrossRef]
  50. Lovreglio, R.; Lovreglio, J.; Satta, G.G.A.; Mura, M.; Pulina, A. Assessing the role of forest grazing in reducing fire severity: A mitigation strategy. Fire 2024, 7, 409. [Google Scholar] [CrossRef]
  51. United Nations Environment Programme. In Spreading like Wildfire—The Rising Threat of Extraordinary Landscape Fires; A UNEP Rapid Response Assessment: Nairobi, Kenya, 2022.
  52. Haas, O.; Keeping, T.; Gomez-Dans, J.; Prentice, I.C.; Harrison, S.P. The global drivers of wildfire. Front. Environ. Sci. 2024, 12, 1438262. [Google Scholar] [CrossRef]
  53. Younes, O.S.; Mousannif, H.; Al Moatassime, H. Predictive modeling of wildfires: A new dataset and machine learning approach. Fire Saf. J. 2019, 104, 130–146. [Google Scholar] [CrossRef]
  54. Naveh, Z. Ecological and cultural landscape restoration and the cultural evolution towards a post-industrial symbiosis between human society and nature. Restor. Ecol. 1998, 6, 135–143. [Google Scholar]
  55. Rundel, P.W.; Montenegro, G.; Jaksic, F.M. (Eds.) Landscape Disturbance and Biodiversity in Mediterranean-Type Ecosystems; Springer Science: Berlin/Heidelberg, Germany, 1998. [Google Scholar]
  56. Oikonomou, D.; Vrahnakis, M.; Yiakoulaki, M.; Xanthopoulos, G.; Kazoglou, Y. Grazing as a Management Tool in Mediterranean Pastures: A Meta-Analysis Based on A Literature Review. Land 2003, 12, 1290. [Google Scholar] [CrossRef]
  57. Andela, N.; Morton, D.C.; Giglio, L.; Chen, Y.; van der Werf, G.R.; Kasibhatla, P.S.; DeFries, R.S.; Collatz, G.J.; Hantson, S.; Kloster, S.; et al. A human-driven decline in global burned area. Science 2017, 356, 1356–1362. [Google Scholar] [CrossRef]
  58. Diaz, J.L.; Chas-Amil, M.-L.; Aquilué, N.; Sil, Â.; Brotons, L.; Regos, A.; Touza, J. Incorporating fire-smartness into agricultural policies reduces suppression costs and ecosystem services damages from wildfires. J. Environ. Manag. 2023, 337, 117707. [Google Scholar] [CrossRef] [PubMed]
  59. Burton, L.; Lampe, S.; Kelley, D.I.; Thiery, W.; Hantson, S.; Christidis, N.; Gidmundsson, L.; Forrest, M.; Burke, E.; Chang, J.; et al. Burned area increasingly explained by climate change. Nat. Clim. Change 2024, 14, 1186–1192. [Google Scholar] [CrossRef]
  60. Hobohm, C. Umweltpolitik aus sozialökologischer Perspektive: Aktuelle Analysen-überraschende Ergebnisse-Handlungsoptionen; Springer: Berlin/Heidelberg, Germany, 2025. (in press) [Google Scholar]
  61. Prestemon, J.P.; Hawbaker, T.J.; Bowden, M.; Carpenter, J.; Brooks, M.T.; Abt, K.L.; Sutphen, R.; Scranton, S. Wildfire Ignitions: A Review of the Science and Recommendations for Empirical Modeling. Gen. Tech. Rep. SRS-171 2013, 171, 1–20. Available online: https://www.srs.fs.usda.gov/pubs/gtr/gtr_srs171.pdf (accessed on 4 October 2024).
  62. Meyn, A.; White, P.S.; Buhk, C.; Jentsch, A. Environmental drivers of large, infrequent wildfires: The emerging conceptual model. Prog. Phys. Geogr. Earth Environ. 2007, 31, 287–312. [Google Scholar] [CrossRef]
  63. He, T.; Lamont, B.B.; Pausas, J.G. Fire as a key driver of Earth’s biodiversity. Biol. Rev. 2019, 94, 1983–2010. [Google Scholar] [CrossRef] [PubMed]
  64. Song, Y.; Xu, C.; Li, X.; Oppong, F. Lightning-induced wildfires: An Overview. Fire 2024, 7, 79. [Google Scholar] [CrossRef]
  65. Davies, K.W.; Boyd, C.S.; Bates, J.D.; Svejcar, L.N.; Porensky, L.M. Ecological benefits of strategically applied livestock grazing in sagebrush communities. Ecosphere 2023, 15, e4859. [Google Scholar] [CrossRef]
  66. Adams, M.A. Mega-fires, tipping points and ecosystem services: Managing forests.and woodlands in an uncertain future. For. Ecol. Manag. 2013, 294, 250–261. [Google Scholar] [CrossRef]
  67. Armenteras, D.; de la Barrera, F. Landscape management is urgently needed to address the rise of megafires in South America. Commun. Earth Environ. 2023, 4, 305. [Google Scholar] [CrossRef]
  68. Lutz, J.A.; Key, C.H.; Kolden, C.A.; Kane, J.T.; Van Wagtendonk, J.W. Fire frequency, area burned, and severity: A quantitative Approach to defining a normal fire year. Fire Ecol. 2011, 7, 51–65. [Google Scholar] [CrossRef]
  69. Cunningham, C.X.; Williamson, G.J.; Bowman, D.M.J.S. Increasing frequency and intensity of the most extreme wildfires on Earth. Nat. Ecol. Evol. 2024, 8, 1420–1425. [Google Scholar] [CrossRef]
  70. Guerrero, F.; Hernández, C.; Toledo, M.; Espinoza, L.; Carrasco, Y.; Arriagada, A.; Muñoz, A.; Taborga, L.; Bergmann, J.; Carmona, C. Leaf thermal and chemical properties as natural drivers of plant flammability of native and exotic tree species of the Valparaíso Region, Chile. Int. J. Environ. Res. Public Health 2021, 18, 7191. [Google Scholar] [CrossRef]
  71. Chen, F.; Si, L.; Zhao, F.; Wang, M. Volatile oil in Pinus yunnanensis potentially contributes to extreme fire behavior. Fire 2023, 6, 113. [Google Scholar] [CrossRef]
  72. Currie, A. Science and speculation. Erkenntnis 2023, 88, 597–619. [Google Scholar] [CrossRef]
  73. Jones, M.W.; Veraverbeke, S.; Andela, N.; Doerr, S.H.; Kolden, C.; Mataveli, G.; Pettinari, M.L.; Le Quéré, C.; Rosan, T.R.; van der Werf, G.R.; et al. Global rise in forest fire emissions linked to climate change in the extratropics. Science 2024, 386, eadl5889. [Google Scholar] [CrossRef] [PubMed]
  74. Goldammer, J.G. Feuer in Waldökosystemen der Tropen und Subtropen; Birkhäuser: Basel, Switzerland, 1993. [Google Scholar]
  75. McGranahan, D.A.; Wonkka, C.L. Ecology of Fire-Dependent Ecosystems, 1st ed.; CRC Press: Boca Raton, FL, USA, 2020. [Google Scholar] [CrossRef]
  76. Fidelis, A.; Alvarado, S.T.; Barradas, A.C.S.; Pivello, V.R. The year 2017. Megafires and management in the Cerrado. Fire 2018, 1, 49. [Google Scholar] [CrossRef]
  77. De Pryck, K.; Hulme, M. (Eds.) A Critical Assessment of the Intergovernmental Panel on Climate Change; Cambridge University Press: Cambridge, UK; New York, NY, USA, 2022. [Google Scholar]
  78. Castles, I.; Henderson, D. The IPCC emission scenarios: An economic-statistical critique. Energy Environ. 2003, 14, 159–185. [Google Scholar] [CrossRef]
  79. Burgess, M.G.; Ritchie, J.; Shapland, J.; Roger Pielke, R. IPCC baseline scenarios have over-projected CO2 emissions and economic growth. Environ. Res. Lett. 2020, 16, 014016. [Google Scholar] [CrossRef]
  80. Chakraborty, R.; Sherpa, P.Y. From climate adaptation to climate justice: Critical reflections on the IPCC and Himalayan climate knowledges. Clim. Change 2021, 167, 49. [Google Scholar] [CrossRef]
  81. Pielke, R.; Ritchie, J. How climate scenarios lost touch with reality. Issues Sci. Technol. 2021, 37, 74–83. [Google Scholar]
  82. Alimonti, G.; Mariani, L.; Prodi, F.; Ricci, R.A. A critical assessment of extreme events trends in times of global warming. Phys. J. Plus 2022, 137, 112. [Google Scholar] [CrossRef]
  83. Pedersen, J.T.S.; van Vuuren, D.; Gupta, J.; Santos, F.D.; Edmond, J.; Swart, B. IPCC emission scenarios: How did criticques affect their quality and relevance 1990–2022? Glob. Environ. Change 2022, 75, 102538. [Google Scholar] [CrossRef]
  84. Wojick, D.E. The UN IPCC’s artful bias: Summary of findings: Glaring omissions, false confidence and misleading statistics in the summary for ploicymakers. Energy Environ. 2002, 13, 311–328. [Google Scholar] [CrossRef]
  85. McKitrick, R. What Is Wrong with the IPCC? GWPF Report 4; The Global Warming Policy Foundation: London, UK, 2011; ISBN 978-0-9566875-4-8. [Google Scholar]
  86. Bjurström, A.; Polk, M. Physical and economic bias in climate change research: A scientometric study of IPCC Third Assessment Report. Clim. Change 2011, 108, 1–22. [Google Scholar] [CrossRef]
  87. Asayama, S. The history and future of IPCC special reports: A dual role of politicisation and normalisation. Clim. Change 2024, 177, 137. [Google Scholar] [CrossRef]
  88. Stevens, C. Climate Change Isn’t Everything: Liberating Climate Politics from Alarmism by Mike Hulme. Glob. Environ. Polit. 2024, 24, 170–173. [Google Scholar] [CrossRef]
  89. O’Lear, S.; Hane, M.K.; Neal, A.P.; Stallings, L.L.M.; Wadood, S.; Park, J. Environmental geopolitics of climate engineering proposals in the IPCC 5th Assessment Report. Front. Clim. 2021, 3, 718553. [Google Scholar] [CrossRef]
  90. Arora, V.K.; Melton, J. Reduction in global area burned and wildfire emissions since 1930s enhances carbon uptake by land. Nat. Comm. 2018, 9, 1326. [Google Scholar] [CrossRef] [PubMed]
  91. James, S.L.; Lucchesi, L.R.; Bisignano, C.; Castle, C.D.; Dingels, Z.V.; Fox, J.T.; Hamilton, E.B.; Liu, Z.; McCracken, D.; Nixon, M.R.; et al. Morbidity and mortality from road injuries: Results from the Global Burden of Disease Study 2017. Inj. Prev. 2020, 26, i46–i56. [Google Scholar] [CrossRef]
  92. Tudge, S.J.; Harris, Z.M.; Murphy, R.J.; Purvis, A.; De Palma, A. Global trends in biodiversity with tree plantation age. Glob. Ecol. Conserv. 2023, 48, e02751. [Google Scholar] [CrossRef]
  93. Kaval, P.; Loomis, J. The relationship between well-being and wildfire. Int. J. Ecol. Econ. Stat. 2007, 7, 29–43. [Google Scholar]
  94. Kaval, P.; Loomis, J.; Seidl, A. Willingness-to-pay for prescribed fire in the Colorado (USA) wildland urban interface. For. Policy Econ. J. 2007, 9, 928–937. [Google Scholar] [CrossRef]
  95. Champ, P.A.; Donovan, G.H.; Barth, C.M. Living in a tinderbox: Wildfire risk perceptions and mitigating behaviours. Int. J. Wildl. Fire 2013, 22, 832–840. [Google Scholar] [CrossRef]
  96. Champ, P.A.; Brenkert-Smith, H. Is Seeing believing? Perceptions of wildfire risk over time. Risk Anal. 2016, 36, 816–830. [Google Scholar] [CrossRef] [PubMed]
  97. Doerr, S.H.; Santín, C. Global trends in wildfire and its impacts: Perceptions versus realities in a changing world. Philos. Trans. R. Soc. B: Biol. Sci. 2016, 371, 20150345. [Google Scholar] [CrossRef] [PubMed] [PubMed Central]
  98. Spano, G.; Elia, M.; Cappelluti, O.; Colangelo, G.; Giannico, V.; D’este, M.; Lafortezza, R.; Sanesi, G. Is experience the best teacher? Knowledge, perceptions, and awareness of wildfire risk. Int. J. Environ. Res. Public Health 2021, 18, 8385. [Google Scholar] [CrossRef]
  99. Masri, S.; Shenoi, E.A.; Garfin, D.R.; Wu, J. Assessing perception of wildfires and related impacts among adult residents of Southern California. Int. J. Environ. Res. Public Health 2023, 20, 815. [Google Scholar] [CrossRef] [PubMed]
  100. Craig, C.A.; Allen, M.W.; Feng, S.; Spialek, M.L. Exploring the impact of resident proximity to wildfires in the northern Rocky Mountains: Perceptions of climate change risks, drought, and policy. Int. J. Disaster Risk Reduct. 2019, 44, 101420. [Google Scholar] [CrossRef]
  101. Lee, T.; Markowitz, E.; Howe, P.; Ko, C.-Y.; Leiserowitz, A.A. Predictors of public climate change awareness and risk perception around the world. Nat. Clim. Change 2015, 5, 1014–1020. [Google Scholar] [CrossRef]
  102. Wang, Y.; Lewis, D.J. Wildfires and climate change have lowered the economic value of western U.S. forests by altering risk expectations. J. Environ. Econ. 2024, 123, 102894. [Google Scholar] [CrossRef]
  103. Russill, C. Alarmism and accountability in climate communication during extreme events. Soc. Media Soc. 2023, 9, 205630512311778. [Google Scholar] [CrossRef]
Figure 1. Development of the global extent of wildfires, as sum of non-forest and forest fires (hectares) from 2002 to 2022 data adapted from [19].
Sustainability 17 00134 g001
Figure 2. Development of the extent of annual wildfires (hectares) from 2002–2022 at continental scales with respect to land cover [19].
Sustainability 17 00134 g002
Figure 3. Annual frequencies of wildfires (i.e., weekly cumulative number of fires per region and year), 2012 to 2023. R2 of linear regressions below significance [18].
Sustainability 17 00134 g003
Figure 4. Variability of global mortality (annual number of dead people) and damage costs (current US Dollars/year) caused by drought, wildfires and earthquakes, 2002–2022 [24].
Sustainability 17 00134 g004
Figure 5. General conditions and processes of wildfires [translated and adapted according to [54,55,56,57,58,59,60] and refs. cited there].
Sustainability 17 00134 g005
Table 1. Results of LRA for relationships between extent of wildfires and global temperature and precipitation anomalies from 2002 to 2022 [data from NOAA, Mt Office Hadley Centre, and GWIS, processed by Our World in Data; [19,22,23]; numbers represent beta values (and significance; n.s. = p > 0.1; p < 0.1 in brackets)].
Linearity of the TrendGlobal Temperature AnomalyGlobal Precipitation Anomaly
Global temperature anomaly0.83 (0.00)
Global precipitation anomalyn.s.
Africa forest fires (hectares)n.s.n.s.0.39 (0.08)
Europe forest fires (hectares)n.s.n.s.n.s.
N America forest fires (hectares)0.46 (0.04)0.48 (0.03)n.s.
Oceania forest fires (hectares)n.s.n.s.n.s.
S America forest fires (hectares)n.s.n.s.n.s.
World forest fires (hectares)n.s.n.s.n.s.
Africa cropland fires (hectares)−0.88 (0.00)−0.65 (0.00)n.s.
Europe cropland fires (hectares)−0.60 (0.00)−0.54 (0.01)n.s.
N America cropland fires (hectares)−0.38 (0.09)n.s.n.s.
Oceania cropland fires (hectares)n.s.n.s.n.s.
S America cropland fires (hectares)−0.64 (0.00)−0.48 (0.03)n.s.
World cropland fires (hectares)−0.85 (0.00)−0.67 (0.00)n.s.
Africa savanna fires (hectares)−0.78 (0.00)−0.60 (0.00)n.s.
Europe savanna fires (hectares)n.s.n.s.n.s.
N America savanna fires (hectares)−0.39 (0.08)n.s.n.s.
Oceania savanna fires (hectares)−0.48 (0.03)−0.51 (0.02) n.s.
S America savanna fires (hectares)n.s.n.s.n.s.
World savanna fires (hectares)−0.82 (0.00)−0.63 (0.00)n.s.
Africa shrubland fires (hectares)−0.42 (0.06)n.s.n.s.
Europe shrubland fires (hectares)n.s.n.s.n.s.
N America shrubland fires (hectares)n.s.n.s.n.s.
Oceania shrubland fires (hectares)n.s.−0.46 (0.04)n.s.
S America shrubland fires (hectares)n.s.n.s.n.s.
World shrubland fires (hectares)−0.75 (0.00)−0.75 (0.00)n.s.
Africa other land fires (hectares)0.61 (0.00)0.48 (0.03)n.s.
Europe other land fires (hectares)0.55 (0.01)n.s.n.s.
N America other land fires (hectares)n.s.n.s.n.s.
Oceania other land fires (hectares)n.s.n.s.n.s.
S America other land fires (hectares)0.41 (0.07)n.s.n.s.
World other land fires (hectares)0.59 (0.01)0.48 (0.03)n.s.
Table 2. Correlation coefficients (Pearson) of trends in wildfire frequencies (weekly cumulative number of fires per year) in Asia, Europe, Oceania, N America, S America, annual rates of global precipitation (1901–2000 average as a baseline for depicting change in mm), temperature (1901–2000 average as a baseline for depicting change in °C) and CO2 concentration in the atmosphere (ppmV); all coefficients relate to the period 2012 to 2023 [22,23,24,25,40]. * p ≤ 0.05, ** p ≤ 0.01.
AsiaEuropeOceaniaN AmericaS AmericaPrecip.CO2Temp.
Africa0.5260.123−0.486−0.1020.2090.268−0.442−0.157
Asia 0.607 *−0.016−0.1460.074−0.202−0.577 *−0.530
Europe 0.224−0.629 *0.090.309−0.623 *−0.450
Oceania 0.121−0.281−0.307−0.189−0.201
N America 0.105−0.601 *0.4360.216
S America −0.1220.3430.278
Precip. −0.4430.003
CO2 0.737 **
Table 3. Correlation coefficients (Pearson) for relationships of extent of forest fires (hectares), seasonal and annual temperature and precipitation anomalies (1901–2000 average as baseline for depicting change), in the USA (48 continental states) and accumulated cyclone energy of North Atlantic hurricanes (ACE), 2002–2022. Data from [41,42]. * p ≤ 0.05, ** p ≤ 0.01,*** p ≤ 0.001.
Winter T Anomaly (Dec.–Feb. in °C)Spring T Anomaly (Mar.–May in °C)Summer T Anomaly (Jun.–Aug. in °C)Fall T Anomaly (Sept.–Nov. in °C)Annual T Anomaly (°C)Prec. Anomaly (mm/a)Accumulated Cyclone Energy of North Atlantic Hurricanes (ACE)
Forest fires (USA) in hectares0.2620.0740.3900.3310.3440.0360.164
Winter T anomaly (Dec.–Feb. in °C) 0.4240.3950.2460.796 ***−0.2460.123
Spring T anomaly (March–May in °C) 0.2920.3780.768 ***−0.1710.213
Summer T anomaly (June–August in °C) 0.2380.602 **−0.441 *−0.013
Fall T anomaly (Sept.–Nov. in °C) 0.626 **0.0380.329
Annual T anomaly (°C) −0.2710.238
Prec. anomaly (mm/a) 0.107
Table 4. Counts of selected opposite word combinations in IPCC Reports [26,27,28,29,30,31,32].
TermsSynthesis Report (2023)Impacts, Adaptation and Vulnerability (2022)Mitigation of Climate Change (2022)The Ocean and Cryosphere in a Changing World (2022)Climate Change and Land (2022)The Physical Science Basis (2021)Global Warming of 1.5 °C (2018)Sum
“increased wildfire” 0180330024
“increased wildfires” 23000005
“wildfire increased”01000001
“wildfires increased” 01000001
“wildfires increasing”00000000
“increasing wildfires”03002106
“increased fire weather”02100407
“fire weather increased”01000102
“increasing fire weather”03000003
“fire weather increasing”00000000
49
“decreased wildfire” 00000000
“decreased wildfires” 00000000
“wildfire decreased”00000000
“wildfires decreased” 00000000
“wildfires decreasing”00000000
“decreasing wildfires”00000000
“decreased fire weather”00000000
“fire weather decreased”00000000
“decreasing fire weather”00000000
“fire weather decreasing”00000000
0
Table 5. Number of text sections in IPCC Reports indicating an increase or decrease of wildfires and/or risks related to wildfires and adaptation measures (for explanation and differences to Table 5 see text. Detailed information including text sections are presented in Table S2 (Supplementary Materials).
IPCC ReportIncrease of Wildfires, Increasing Wildfires, Increasing Risk or Increasing Maladaptation in the Context of Wildfires or Fire WeatherDecrease of Decreasing Wildfires, Decreasing Risk or Decreasing Maladaptation in the Context of Wildfires or Fire WeatherModerate Risk, No Moderate Risk, no Clear Increase or Decrease of Wildfires or Fire Weather or Causality Doubted
Synthesis report (2023)401
Mitigation of climate change (2022)701
Impacts, adaptation and vulnerability (2022)502
Climate change and land (2022)1114
The ocean and cryosphere in a changing world (2022)405
The physical science basis (2021)1802
Global warming of 1.5 °C (2018)1708
Sum66123
Table 6. Headings and text fragments of links related to “wildfires and “increase decrease wildfires” online (via Startpage on 1 October 2024, literally cited).
LinkWildfiresIncrease Decrease Wldfires
1https://en.wikipedia.org/wiki/WildfireWildfire · A wildfire, forest fire, or a bushfire is an unplanned, uncontrolled and unpredictable · Wildfires can be classified by cause of ignition, physical …https://www.wri.org/insights/global-trends-forest-fires The Latest Data Confirms: Forest Fires Are Getting Worse 13.08.2024 … Climate change is the main cause of increasing fire activity in boreal forests. Northern high-latitude regions are warming at a faster rate than …
2https://www.nifc.gov/fire-information/nfn National Fire News|National Interagency Fire Center Active wildfires have burned 1,580,407 acres. 9905 wildland firefighters … Acres: 3,095,240. 10-year average Year-to-Date. 2014–2023, Fires: 46,194, Acres: …https://wfca.com/wildfire-articles/are-wildfires-increasing-or-decreasing-in-the-us/ Are Wildfires Increasing or Decreasing in the U.S.?|WFCA The United States has seen an increase in acreage burned by wildfires each year since the 1980s, but does this mean the number of wildfires is increasing? …
3https://www.who.int/health-topics/wildfires Wildfires—World Health Organization (WHO) Wildfire smoke is a mixture of hazardous air pollutants, such PM2.5, NO2, ozone, aromatic hydrocarbons, or lead. In addition to contaminating the air with toxic …https://www.epa.gov/climate-indicators/climate-change-indicators-wildfires Climate Change Indicators: Wildfires|US EPA 23.07.2024 … The extent of area burned by wildfires each year appears to have increased since the 1980s. According to National Interagency Fire Center data …
4https://www.ready.gov/wildfires Wildfires|Ready.gov Wildfires are unplanned fires that burn in natural areas like forests, grasslands or prairies. These dangerous fires spread quickly and can devastate not only …https://www.c2es.org/content/wildfires-and-climate-change/ Wildfires and Climate Change—C2ES Increased drought, and a longer fire season are boosting these increases in wildfire risk. For much of the U.S. West, projections show that an average annual 1 …
5https://www.edf.org/climate/heres-how-climate-change-affects-wildfires Wildfires|Environmental Defense Fund Climate change affects wildfires by exacerbating the hot, dry conditions that help these fires catch and spread. As global temperatures rise, we expect the size …https://www.iqair.com/newsroom/wildfires-increasing-or-decreasing?srsltid=AfmBOorqFspFrkZVV1Br2nbSMtalTov8dBl0OdTvPGVmuO1Kh9P8XyKs Are wildfires increasing or decreasing?—IQAir 13.08.2022 … Predictions are that the number of extreme fires globally will grow 14% by 2030, 30% by 2050 and 50% by 2099 …
6https://education.nationalgeographic.org/resource/wildfires/Wildfires—National Geographic Education 19.10.2023 … Wildfires can start with a natural occurrence—such as a lightning strike—or a human-made spark. However, it is often the weather conditions that …https://www.nature.org/en-us/what-we-do/our-priorities/tackle-climate-change/climate-change-stories/extreme-wildfires-are-getting-worse-with-climate-change/ Yes, Climate Change is Raising the Risks of Extreme Wildfires 09.07.2024 … One of their key findings was that wildfire risks in some areas of the world would increase, while in other areas, it would actually decrease. A …
7https://fire.airnow.gov/ AirNow Fire and Smoke Map This map shows fine particle pollution (PM2.5) from wildfires and other sources. It provides a public resource of information to best prepare and manage …https://ourworldindata.org/wildfires Wildfires—Our World in Data 02.04.2024 … Is the area burnt by wildfires increasing or decreasing globally? … There is increasing concern about the impacts of global warming on wildfire …
8https://civil-protection-humanitarian-aid.ec.europa.eu/what/civil-protection/wildfires_en Wildfires—European Commission 2023 was a record-breaking year, with the largest fire ever in Europe, one of the worst wildfire seasons on record in the EU.https://www.nature.com/articles/s43247-023-00977-1 Abrupt, climate-induced increase in wildfires in British Columbia … 05.09.2023 … Results show that after a century-long decline, fire activity increased from 2005 onwards, coinciding with a sharp reversal in the wetting trend of the 20th …
9https://www.ifrc.org/our-work/disasters-climate-and-crises/what-disaster/wildfires Wildfires—IFRC Wildfires (also known as bushfires, brush fires or forest fires) are large, uncontrolled and potentially destructive fires that can affect both rural and …https://www.un.org/en/un-chronicle/wildfires-increase-integrated-strategies-forests-climate-and-sustainability-are-ever-0 As Wildfires Increase, Integrated Strategies for Forests, Climate and … 31.07.2023 … Climate change exacerbates wildfire risk through increased drought, high air temperatures, low relative humidity, dry lightning and strong winds …
10https://www.nifc.gov/fire-information/nfn National Fire News|National Interagency Fire Center Active wildfires have burned 1,580,407 acres. 9905 wildland firefighters … Acres: 3,095,240. 10-year average Year-to-Date. 2014–2023, Fires: 46,194, Acres: …https://wfca.com/wildfire-articles/are-wildfires-increasing-or-decreasing-in-the-us/ Are Wildfires Increasing or Decreasing in the U.S.?|WFCA The United States has seen an increase in acreage burned by wildfires each year since the 1980s, but does this mean the number of wildfires is increasing? …
Table 7. Results of trivariate LRA for relationships between damage costs (current US Dollars) from natural disasters and global temperature as well as precipitation anomalies from 2002 to 2022. Damage costs from earthquakes are used for comparison. All data from EM-Dat processed by Our World in Data [24].
Effect Variable (2002–2022)Beta Global Temp. Anomalies (p)Beta Global Prec. Anomalies (p)R2
Global damage costs caused by wildfires0.52 (0.02)0.25 (0.23)29.5%
Global damage costs caused by earthquakes−0.17 (0.43)0.45 (0.04)25.1%
Global damage costs caused by drought0.37 (0.55)−0.13 (0.11)16.5%
Disclaimer/Publisher’s Note: The statements, opinions and data contained in all publications are solely those of the individual author(s) and contributor(s) and not of MDPI and/or the editor(s). MDPI and/or the editor(s) disclaim responsibility for any injury to people or property resulting from any ideas, methods, instructions or products referred to in the content.

