Abstract
The real-time assessment of ecological conditions in arid and semi-arid regions is essential for global ecological sustainability. This study utilizes an improved three-dimensional ecological footprint model to assess the ecological footprint, ecological carrying capacity, and footprint depth of Xilingol League, analyzing its spatiotemporal evolution characteristics. An ecological pressure index is developed to evaluate ecological security, and two-way ANOVA and M-K mutation tests are employed to analyze the effects of county-level and year-level factors on these indicators and their evolving trends. The results show that the following: (1) From 2011 to 2021, the ecological footprint and footprint depth in Xilingol League first increased and then decreased, while its ecological carrying capacity slightly improved, leading to an overall reduction in ecological deficit. Spatially, ecological footprint and carrying capacity were higher in the northeast than in the southwest, and ecological pressure was higher in the eastern and western regions compared to the central area. (2) Grassland ecological footprint and footprint depth were relatively high, with a higher carrying capacity than other land types; however, the ecological deficit was severe, reaching a minimum value of −5 in 2019. (3) County-level factors had a significant impact on ecological footprint, carrying capacity, ecological balance, footprint depth, and ecological pressure, while year-level factors significantly influenced footprint depth and ecological pressure. (4) From 2013 to 2021, the ecological footprint significantly increased, while ecological carrying capacity notably improved from 2016 to 2021; however, ecological balance remained in a deficit. Footprint depth showed a significant increase from 2011 to 2016 and a significant decrease from 2016 to 2021, while ecological pressure significantly increased from 2011 to 2018 and then significantly decreased from 2018 to 2021. This study highlights the spatiotemporal dynamics of the ecological system in Xilingol League and provides scientific support for ecological management in arid and semi-arid regions.
1. Introduction
Ecological carrying capacity refers to the maximum capacity of an ecosystem within a given region and time period to support human economic and social activities in terms of resource utilization and environmental consumption [1]. However, rapid global economic and social development—including accelerated industrialization, urbanization, and significant advancements in modernization—has led to the ecological carrying capacity being exceeded, posing serious threats to ecosystem health [2]. Therefore, accurately assessing regional ecological carrying capacity is essential for understanding the state of the local ecological environment and promoting sustainable regional development.
The concept of carrying capacity was first introduced by British economist Thomas Malthus in his work An Essay on the Principle of Population, where he argued that the Earth’s limited resources would come into conflict with the rapidly growing human population, affecting the population growth rate [3]. In the 20th century, Robert E. Park and Ernest W. Burgess described the concept of carrying capacity from an ecological perspective, defining it based on the relationship between humans and finite resources [4]. Canadian resource ecologist Professor William E. Rees later introduced the concepts of ecological footprint and adaptive carrying capacity, primarily addressing the shortcomings of urban economics in evaluating urban sustainability [5]. Rees and Mathis Wackernagel subsequently developed the ecological footprint model, linking resource supply with population demand to analyze their relationship [6]. This model became a key metric for measuring the balance between natural resource capacity and human resource consumption.
Due to the model’s limitations in flexibility, Valentina Niccolucci proposed a three-dimensional ecological footprint assessment method, where the depth of resource use is represented as a third dimension, providing a more intuitive way to visualize resource utilization [7]. This method offers better insight into the spatial distribution and variation in resource consumption and environmental pressure. Kai Fang further refined the three-dimensional ecological footprint model by introducing two new indicators: the capital flow occupancy rate and the stock-flow utilization ratio [8].
Today, the three-dimensional ecological footprint model has become an essential tool for studying regional ecological conditions. For instance, Shixing Jiao et al. used the model to analyze the spatiotemporal characteristics of the water ecological footprint in 31 Chinese provinces and applied a partial least squares regression model for driver analysis. Their results indicated that population size significantly impacted 12 provinces and municipalities (e.g., Hebei); industrial structure strongly affected 18 regions (including Beijing); economic development influenced 19 provinces (including Hebei); and technological progress had a considerable impact on 21 provinces (such as Tianjin) [9]. Lu Yu and colleagues applied the improved three-dimensional ecological footprint model to calculate the footprint depth, footprint breadth, and regional three-dimensional ecological footprint of Northwest China from 2009 to 2017 [10]. They calculated five indices to analyze changes in ecological security and used an extended STIRPAT model combined with principal component regression to identify the main drivers of ecological footprint evolution. Their findings revealed high ecological resource pressure, low resource use efficiency, severe environmental pollution, and poor coordination between the ecological environment and economic development [10]. Similarly, Ying Xiong et al., using an improved three-dimensional ecological footprint model, considered the unique ecological characteristics and resource utilization in the study area to analyze the spatiotemporal evolution of ecological sustainability. Their results showed that land resource allocation in the Dongting Lake area was suboptimal, with a significant depletion of natural capital stocks in all accounts except for forestland, leading to high ecological deficits [11].
Under the backdrop of sustainable development, ecological footprint research has grown rapidly, expanding into various regions and fields of study. For example, Yating Dai et al., using an improved three-dimensional footprint model, measured the use of natural land capital in Shaanxi Province over a 20-year period based on the product–land type–region scale and the global hectare method; they further analyzed the decoupling effect between natural capital utilization and economic development, finding that most cities in Shaanxi exert significant pressure on grassland and water resources, with severe depletion of stock capital [12]. Various studies have demonstrated that the three-dimensional ecological footprint model is suitable for different scales, regions, and fields, providing a more comprehensive and accurate assessment of natural capital utilization [13,14,15].
The Xilingol grassland, located in arid and semi-arid regions, is a crucial part of the Chinese grassland ecosystem and serves as an important ecological barrier in northern China [16]. It is also a region highly sensitive to global climate change [17]. Ecological issues such as grassland desertification and land degradation, exacerbated by climate change and human activities [18], have become increasingly severe, pushing the ecological carrying capacity of the Xilingol grassland beyond its natural limits and leading to a significant imbalance in the ecosystem. However, most ecological studies on Xilingol League have focused on analyzing the overall ecological conditions or grassland status from a macro perspective, without addressing the significant ecological differences between the eastern and western regions [19,20]. A detailed analysis is necessary, taking into account the specific conditions of these regions. Thus, this study, based on county and land use units, utilizes an improved three-dimensional ecological footprint model to assess the temporal and spatial evolution of the ecological footprint, ecological carrying capacity, and footprint depth in Xilingol League. Additionally, an ecological pressure index is constructed to analyze the region’s ecological security. This study employs two-way ANOVA and the Mann–Kendall trend test to analyze the effects of counties and years on various indices, as well as to identify change points and trends. The findings provide a theoretical basis for enhancing ecological conservation efforts in the region.
2. Materials and Methods
2.1. Overview of the Study Area
Xilingol League (41°35′ N–46°46′ N, 111°9′ E–119°58′ E) is located in the mid-eastern part of Inner Mongolia, in northern China. The region experiences a distinct temperate continental climate, characterized by strong winds, aridity, and cold temperatures. The average annual precipitation is approximately 295 mm, with rainfall decreasing progressively from southeast to northwest. Xilingol League covers an area of 203,000 km2, primarily composed of high plains and diverse geomorphological units. Its grassland area accounts for one-quarter of the total grasslands in Inner Mongolia (Figure 1). Administratively, Xilingol League consists of two cities, nine banners, one county, and one management district. It is bordered by Xing’an League, Tongliao City, Chifeng City, Hebei Province, and Mongolia. Xilingol is not only a vital livestock production base for China, but also the closest natural grassland pastoral area to Beijing, Tianjin, and Hebei.
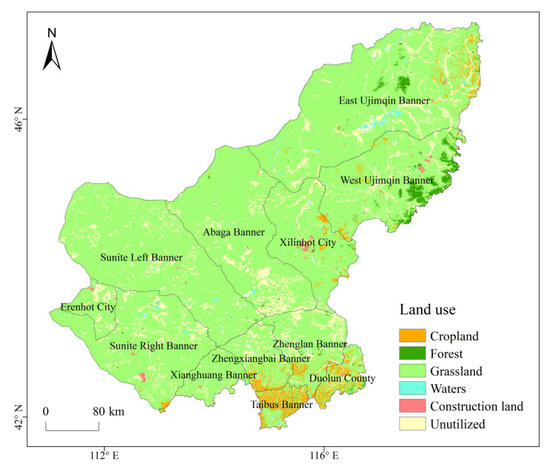
Figure 1.
Land use of the study area.
2.2. Data Source and Processing
The population and bioproductivity data used in this study were sourced from the Xilingol League Statistical Yearbook (2011–2021). Land use vector data were obtained from the Xilingol League Natural Resources Bureau. Land use categories are classified into six primary types: arable land, grassland, forest land, construction land, water bodies, and unused land [21]. The indicators selected for the biocapacity and fossil energy accounts in the ecological footprint calculation are shown in Table 1. The equivalence factors and yield factors were derived from Liu et al.’s calculations of Inner Mongolia’s equivalence factors based on net primary productivity (Table 2). Given the significant proportion of grassland in Xilingol League, the global yield factor of 0.19, calculated by Wackernagel, was used to better reflect local conditions [22]. The Ulagai Management District was not included in this analysis due to its administrative affiliation with East Ujimqin Banner and the difficulty in obtaining some of its data.

Table 1.
Ecological footprint calculation accounts in Xilingol League.
Table 2.
Equivalence factors and yield factors used in the ecological footprint calculation.
2.3. Research Method
2.3.1. Calculating the Ecological Footprint
The ecological footprint model converts the consumption of various resources and energy into six types of biologically productive land: cropland, forest land, grassland, water bodies, construction land, and fossil energy land (Table 1) [23], to determine whether the ecosystem is in a sustainable state [24]. The calculation formula is as follows:
where EF represents the ecological footprint of the study area (hm²), n is the population of the study area, ef is the ecological footprint per capita (hm²/person), rj is the equivalence factor for the j-th land type, and efj is the ecological footprint of the j-th land type in the study area (j = 1, 2, 3, 4, 5, and 6 represent the six land use categories).
2.3.2. Calculating Ecological Carrying Capacity
Ecological carrying capacity refers to the population size and corresponding ecological capital that a region’s ecosystem can support without causing harm to the ecological environment [25]. The value of ecological carrying capacity is directly proportional to its ability to sustain it [26]. The calculation formula is as follows:
where EC represents the ecological carrying capacity of the region (hm²), ec is the ecological carrying capacity per capita (hm²/person), aj is the area of the j-th land use type within the region, rj is the equivalence factor for the j-th land type, and yj is the yield factor for the j-th land type.
2.3.3. Calculating Ecological Deficit/Surplus
The ecological deficit or surplus is derived from comparing the ecological footprint and ecological carrying capacity within the study area. An ecological deficit occurs when the ecological footprint exceeds the ecological carrying capacity that the region can provide. Conversely, an ecological surplus is observed when the ecological footprint is less than the ecological carrying capacity. The ecological deficit or surplus reflects the population’s utilization of natural resources [27]. The formula for calculating ecological deficit is as follows:
where ED represents the ecological deficit/surplus of the region (hm²). If ED > 1, it indicates an ecological surplus. If ED < 1, it indicates an ecological deficit. If ED = 1, it indicates a balanced state. EC and EF refer to ecological carrying capacity and ecological footprint, respectively, as defined previously.
2.3.4. Calculating the Three-Dimensional Ecological Footprint
In the three-dimensional ecological footprint model, the natural capital differences between ecological deficit and ecological surplus are not considered. This often leads to an overestimation of the footprint breadth and an underestimation of the footprint depth at the regional scale. The calculation methods for footprint depth and footprint breadth are only applicable to single land types [28]. To more comprehensively and accurately reflect the human utilization of natural capital, Fang Kai [8,29,30] improved the three-dimensional ecological footprint model to enable the calculation of footprint depth and breadth across products, land types, and regions. The calculation formulas are as follows:
where EFdepth,region represents the regional footprint depth, EFi is the ecological footprint of the i-th land type (hm²), ECi is the ecological carrying capacity of the i-th land type (hm²), EFsize,region is the regional footprint breadth (hm²), and EF3D is the regional three-dimensional ecological footprint (hm²).
2.3.5. Ecological Pressure Index
The ecological pressure index is defined as the ratio of the ecological footprint of renewable resources to the ecological carrying capacity of a given country or region. This index reflects the degree of environmental pressure experienced in the area [31]. The calculation formula is as follows:
where ETI represents the ecological pressure index, ef is the ecological footprint of renewable resources in the region, and ec is the ecological carrying capacity. To ensure the rationality of the indicator evaluation, the World Wildlife Fund (WWF) established a grading standard based on global data [32], as detailed in Table 3.
Table 3.
Ecological safety levels based on ecological pressure index.
2.3.6. Two-Factor ANOVA
Two-factor ANOVA is used to investigate the significant effects of two independent variables on a single dependent variable. This study employed SPSS software and utilized the main effects method to examine the independent impacts of county and year on the ecological footprint, ecological carrying capacity, ecological deficit/surplus, and footprint depth in Xilingol League. The calculation method is as follows:
(1) Hypothesis Formulation
To test the effects of two factors, the following hypotheses are proposed for each factor. For the factor of year, the hypotheses are as follows:
H0.
u1 = u2 = … = u11, i.e., the year has no significant effect on the dependent variable.
H1.
ui (i = 1, 2, …, 11), are not all equal, i.e., the year has a significant effect on the dependent variable. Here, ui represents the mean value of the dependent variable for the i-th level of year.
For the factor of county (flagship), the hypotheses are as follows:
H0.
u1 = u2 = … = u12, i.e., the county has no significant effect on the dependent variable.
H1.
uj (j = 1, 2, …, 12), are not all equal, i.e., the county has a significant effect on the dependent variable. Here, uj represents the mean value of the dependent variable for the j-th level of county.
(2) Construction of the Test Statistic
To test whether H0 holds, it is necessary to determine the test statistics for the year and county factors. SPSS software is used for the analysis, significantly reducing the computational workload and making the process clearer. The significance of the effect of the independent variable on the dependent variable can be determined by comparing the p-value of the independent variable with 1 − α [33].
2.3.7. M-K Mutation Test Method
The M-K mutation test method is a widely used non-parametric statistical testing approach that can be employed to predict long-term trends in meteorological and hydrological elements [34]. Non-parametric tests do not require the change factors to follow a normal distribution and are not influenced by a few outliers. Due to their high degree of quantification, broad detection range, low interference, and simple calculations, these methods are suitable for analyzing trends with non-normal distribution characteristics [35]. For a time series x(t), the first step is to determine the number of pairs (xi, xj) where xi < xj (for i < j). Then, the variance var(xn) and the statistic U are calculated. The calculation formula is as follows:
If UFn > 0, the sequence indicates an upward trend; otherwise, it indicates a downward trend. Given a significance level α, the critical value Uα/2 can be found from the normal distribution table. If |UFn| > Uα/2, the null hypothesis is rejected, indicating that the trend is significant; otherwise, it is not significant.
During the mutation analysis, the time series x(t) is reversed, and the above process is repeated to compute UBn, where UB1 = 0. If UBn or UFn exceeds 0, this indicates an upward trend; conversely, a value less than 0 indicates a downward trend. If UBn and UFn exceed the critical value, this indicates a significant trend, and the range exceeding the critical line is defined as the time region where a mutation occurs. The intersection point of the two curves within the critical value range corresponds to the start time of the mutation [36].
3. Results
3.1. Ecological Footprint Analysis
3.1.1. Changes in Ecological Footprint Across Banners and Counties
The spatial distribution of ecological footprints across the banners and counties in Xilingol League is illustrated in Figure 2. The results indicate a pattern of higher ecological footprints in the eastern regions and lower values in the western regions. In 2011, the highest ecological footprint was observed in West Ujimqin Banner, followed by Sunite Left Banner and Abaga Banner, while the lowest footprint was recorded in Erenhot City. This suggests that human activities in West Ujimqin Banner, Sunite Left Banner, and Abaga Banner have exerted significant ecological pressure, whereas Erenhot City has experienced relatively low levels of human-induced impact. By 2021, the highest ecological footprint was found in Abaga Banner, followed by Zhenglan Banner and Sunite Left Banner, with Erenhot City still exhibiting the lowest footprint. This indicates that over the decade, ecological pressure in Abaga Banner has increased due to population growth and intensified human activities. Zhenglan Banner and Sunite Left Banner also face substantial ecological challenges. In contrast, Erenhot City continues to have minimal human impact on its ecological environment.
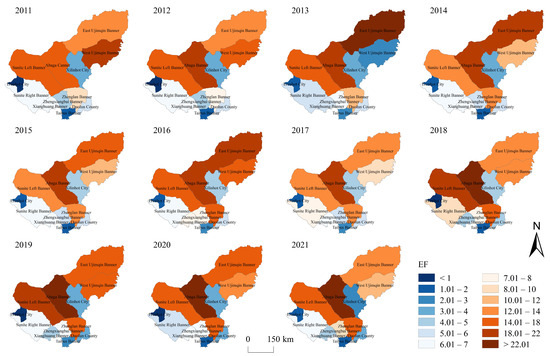
Figure 2.
Ecological footprints of Xilingol League from 2011 to 2021.
The annual changes in ecological footprints across the banners and counties are illustrated in Figure 3. During the study period, Abaga Banner consistently exhibited a high ecological footprint, showing a gradual annual increase. Sunite Left Banner, West Ujimqin Banner, and East Ujimqin Banner all displayed ecological footprints exceeding 10 global hectares per capita. In Sunite Left Banner, the ecological footprint initially decreased from 15.20 in 2011 to 13.49 in 2015, then rose to 21.20 in 2018, before declining again to 15.02 by 2021. Conversely, West Ujimqin Banner showed a consistent decline, dropping from 18.44 in 2011 to 10.99 in 2021. East Ujimqin Banner demonstrated an initial increase followed by a decrease, rising from 12.09 in 2011 to 22.60 in 2013—a growth of approximately 86.9%—before fluctuating downwards to 13.34 by 2021. Zhenglan Banner exhibited an annual increase, growing from 8.15 in 2011 to 16.35 in 2021, effectively doubling over the decade. Both Xilingol Banner and Sunite Right Banner had ecological footprints ranging between 6 and 7 in 2011. The footprint in Sunite Right Banner remained relatively stable, fluctuating slightly from 6.68 in 2011 to 6.67 in 2021. In contrast, Xianghuang Banner exhibited a downward trend, decreasing from 6.99 in 2011 to 4.13 in 2021. Zhengxiangbai Banner displayed a consistent upward trend, rising from 4.06 in 2011 to 9.53 in 2021, more than doubling over the decade. Duolun County’s ecological footprint steadily declined from 5.33 in 2011 to 3.30 in 2021. Xilinhot City’s footprint initially increased before declining, starting at 3.21 in 2011, reaching 4.35 in 2018, and then decreasing to 2.94 by 2021. Erenhot City and Taibus Banner both had ecological footprints ranging from 1 to 2, exhibiting minor fluctuations. Erenhot City’s footprint showed a slight increase, rising from 0.89 in 2011 to 1.01 in 2021. In contrast, Taibus Banner experienced a modest decline, decreasing from 1.86 in 2011 to 1.63 in 2021 after minor fluctuations.
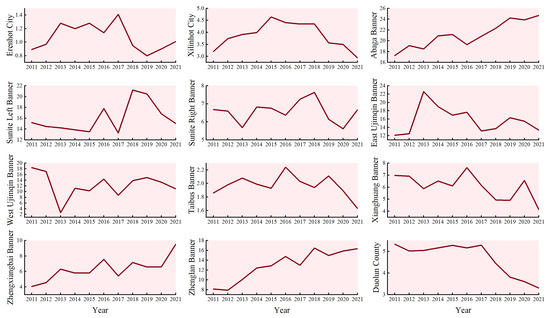
Figure 3.
Changes in ecological footprints in Xilingol League from 2011 to 2021.
3.1.2. Changes in Ecological Footprint by Land Use Type
The changes in ecological footprints of various land use types in Xilingol League from 2011 to 2021 are illustrated in Figure 4. Different land types exhibited varying trends during this period. The ecological footprints of cropland and construction land remained relatively stable, with a slight upward trend observed between 2020 and 2021. In contrast, the ecological footprints of forest land, waters, and energy land showed varying degrees of decline, with energy land experiencing the most significant decrease.
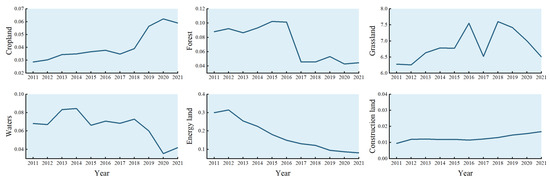
Figure 4.
Changes in ecological footprints of various land types in Xilingol League from 2011 to 2021.
Grassland ecological footprints were considerably higher than those of other land types. From 2016 to 2018, grassland footprints first increased and then decreased. This is not only because grassland occupies the largest area in Xilingol League, but is also due to significant impacts from multiple factors—such as prolonged droughts, rapid population growth, overexploitation, and climate change—on the grasslands, increasing pressure on the ecological environment.
3.2. Ecological Carrying Capacity Analysis
3.2.1. Changes in Ecological Carrying Capacity Across Banners and Counties
The spatial distribution of ecological carrying capacity across the banners and counties of Xilingol League is illustrated in Figure 5. The results show higher ecological carrying capacity in the northeast and lower capacity in the southwest. In 2011, East Ujimqin Banner had the highest ecological carrying capacity, followed by Sunite Left Banner, while Taibus Banner exhibited the lowest capacity. This indicates that the ecosystems in East Ujimqin Banner and Sunite Left Banner were capable of supporting higher levels of human economic and social activities during this period, whereas Taibus Banner had a much lower capacity. By 2021, East Ujimqin Banner and Sunite Left Banner still had the highest ecological carrying capacities, while Taibus Banner continued to have the lowest. This suggests that over the decade, the ecological carrying capacities in these regions remained relatively stable, reflecting consistent ecological conditions and land productivity.
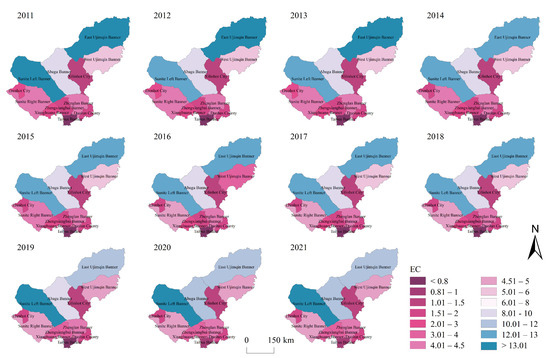
Figure 5.
Ecological carrying capacities in Xilingol League from 2011 to 2021.
The annual changes in per capita ecological carrying capacity across the banners and counties are illustrated in Figure 6. During the study period, Sunite Left Banner and East Ujimqin Banner had the highest levels, with values exceeding 10 global hectares per capita. Specifically, East Ujimqin Banner’s capacity decreased from 13.12 in 2011 to 10.57 in 2021, while Sunite Left Banner’s capacity increased slightly from 13.04 to 13.61. Abaga Banner experienced an upward trend, increasing from 8.44 in 2011 to 10.10 in 2021. Sunite Right Banner and West Ujimqin Banner maintained capacities around 5. Sunite Right Banner increased slightly from 4.45 to 4.72, while West Ujimqin Banner decreased from 5.26 to 4.84. Zhenglan Banner showed a modest increase from 4.09 to 4.33. Xianghuang Banner, Zhengxiangbai Banner, and Duolun County all demonstrated increasing trends. Xianghuang Banner rose from 2.47 to 3.52, Zhengxiangbai Banner more than doubled from 1.69 to 3.81, and Duolun County increased from 1.59 to 1.96. Erenhot City and Xilinhot City showed consistent declines. Erenhot City’s capacity decreased from 2.14 to 1.55, and Xilinhot City’s capacity declined from 1.39 to 1.22. Taibus Banner consistently had the lowest capacity, remaining below 1 throughout the study period.
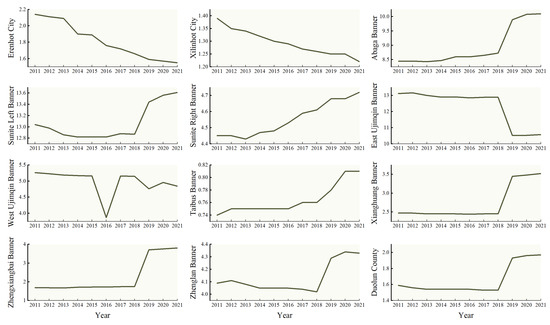
Figure 6.
Changes in per capita ecological carrying capacity in Xilingol League from 2011 to 2021.
3.2.2. Changes in Ecological Carrying Capacity by Land Use Type
The changing trends in ecological carrying capacity by land use type are shown in Figure 7. The capacities of cropland, forest land, and construction land were on an upward trajectory. The carrying capacity of cropland remained stable from 2011 to 2018, then rose rapidly to 0.23 between 2018 and 2019, remaining stable thereafter. Forest land followed a similar pattern, with a sharp increase to 1.05 between 2018 and 2019. Construction land showed gradual and modest growth from 2011 to 2018, accelerating between 2018 and 2021 to reach 0.16. In contrast, grassland showed a gradual decline, fluctuating downward from 2.66 in 2011 to 2.51 in 2021. The carrying capacity of water bodies remained relatively stable. Grassland consistently had the highest capacity among all land types, though it declined over time, suggesting that ecological restoration efforts should continue.
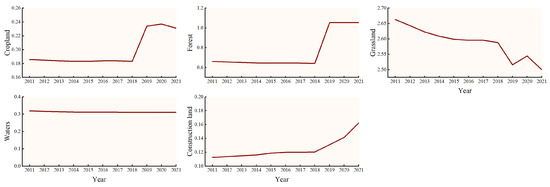
Figure 7.
Changes in ecological carrying capacity of various land types in Xilingol League from 2011 to 2021.
3.3. Analysis of Ecological Surplus and Deficit Across Banners and Counties
3.3.1. Changes in Ecological Surplus and Deficit Across Banners and Counties
The spatial distribution of per capita ecological surplus and deficit is shown in Figure 8. The per capita ecological deficit is more severe in the eastern regions than in the west. In 2011, West Ujimqin Banner had the most severe deficit, followed by Abaga Banner. Erenhot City and East Ujimqin Banner were the only regions with an ecological surplus, indicating that their ecological capacities met or exceeded resource consumption. By 2021, Abaga Banner had the most severe deficit, followed by Zhenglan Banner, with Erenhot City remaining the only area with a surplus. Over the 11-year period, the deficits in Abaga Banner and Zhenglan Banner worsened, while Erenhot City’s capacity remained sufficient.
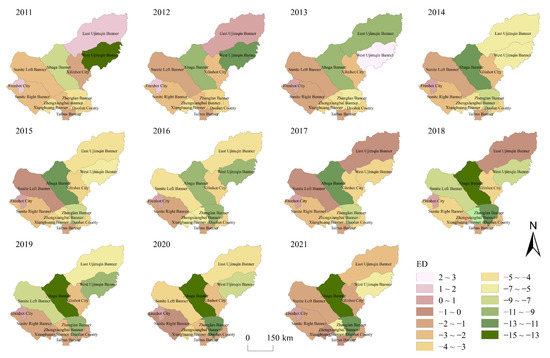
Figure 8.
Ecological surplus and deficit in Xilingol League from 2011 to 2021.
The interannual changes are shown in Figure 9. Throughout the study period, all regions except Erenhot City experienced ecological deficits. The deficits were particularly severe in West Ujimqin Banner, Abaga Banner, and Zhenglan Banner. Abaga Banner’s deficit increased from −8.83 in 2011 to −14.61 in 2021, and Zhenglan Banner’s deficit grew from −4.06 to −12.02. West Ujimqin Banner showed improvement, with its deficit decreasing from −13.18 to −6.16, indicating gradual recovery. East Ujimqin Banner shifted from a surplus in 2011 to a deficit by 2013 but improved to −2.77 by 2021. Zhengxiangbai Banner’s deficit worsened from −2.37 to −5.72. Other regions, including Xilinhot City, Sunite Left Banner, Sunite Right Banner, Taibus Banner, Xianghuang Banner, and Duolun County, showed improvements. Erenhot City’s surplus declined from 1.25 to 0.54, edging closer to a deficit.
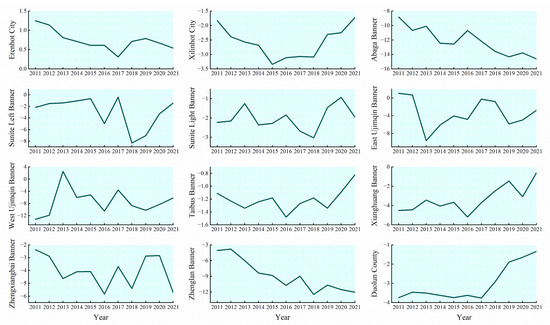
Figure 9.
Changes in ecological surplus and deficit in Xilingol League from 2011 to 2021.
3.3.2. Changes in Ecological Surplus and Deficit by Land Use Type
The trends in per capita ecological deficit for different land types are shown in Figure 10. Grassland and energy land consistently experienced an ecological deficit, although the deficit for energy land gradually improved. Grassland’s deficit fluctuated, reaching a low of −5 in 2019 before slightly recovering. The deficit’s decline after 2019 is largely attributable to ecological benefits from grazing prohibitions and restoration programs. Other land use types demonstrated ecological surpluses. Cropland and forest land showed stable trends from 2011 to 2018, with significant increases between 2018 and 2019. From 2020 to 2021, the cropland surplus index declined, while forest land continued to increase. Overall, grassland’s ecological carrying capacity is far lower than its ecological footprint, resulting in a persistent deficit. This underscores the need for strengthened conservation and restoration efforts, including restoring degraded grasslands, reducing overgrazing, implementing grazing bans and rotational grazing, and establishing protective forest belts to prevent further degradation.
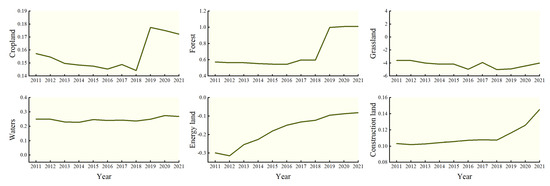
Figure 10.
Ecological surplus and deficit of various land types in Xilingol League from 2011 to 2021.
3.4. Footprint Depth Analysis
3.4.1. Changes in Footprint Depth Across Banners and Counties
The spatial distribution of per capita ecological footprint depth is illustrated in Figure 11. The pattern shows higher footprint depth in the southeast and lower in the northwest. In 2011, West Ujimqin Banner had the highest footprint depth, followed by Xianghuang Banner, while Erenhot City had the lowest. This indicates significant consumption of natural capital in West Ujimqin and Xianghuang Banners, whereas Erenhot City had not depleted its natural capital reserves.
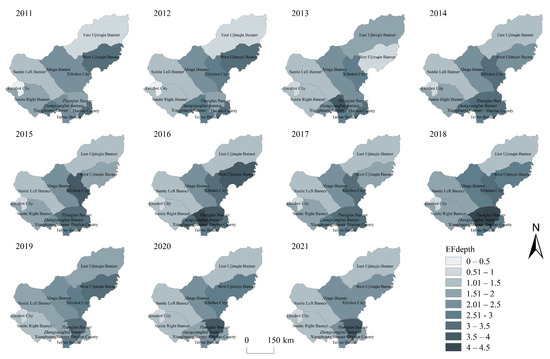
Figure 11.
Footprint depth in Xilingol League from 2011 to 2021.
By 2021, Zhenglan Banner had the highest footprint depth, followed by Abaga Banner, with Erenhot City still the lowest. Over the 11-year period, Zhenglan Banner accelerated its consumption of natural capital, and Abaga Banner’s depletion was also significant, while Erenhot City continued to preserve its capital.
Throughout the study period, only Erenhot City maintained a footprint depth below 1; all other regions exceeded 1. Erenhot City’s footprint depth increased from 0.42 to 0.65. Regions like East Ujimqin Banner, Abaga Banner, Zhengxiangbai Banner, Sunite Left Banner, and Taibus Banner showed an increasing trend followed by a gradual decrease.
3.4.2. Changes in Footprint Depth by Land Use Type
The trends in footprint depth across various land use types are illustrated in Figure 12. Except for grassland, the footprint depths of cropland, forest land, waters, energy land, and construction land consistently remained at 1, signifying ecological balance. Grassland’s footprint depth exceeded 1, indicating an additional depletion of natural capital. By 2021, it reached 2.60, suggesting it would take an additional 2.6 years to regenerate the resources consumed in one year.
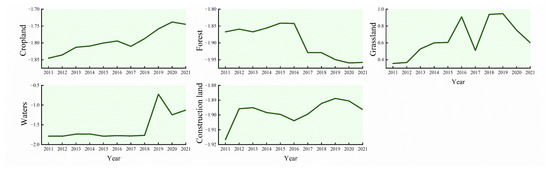
Figure 12.
Footprint depth of various land types in Xilingol League from 2011 to 2021.
Grassland footprint depth increased annually from 2011 to 2019 but began declining from 2020, indicating a significant change in natural capital depletion and suggesting progress in ecological protection initiatives.
3.5. Ecological Pressure Analysis
3.5.1. Changes in Ecological Pressure Across Banners and Counties
Using Equation (7), the ecological pressure index of the 12 banners and counties was calculated. Ecological security was classified into six levels: Level I (<0.5, very safe), Level II (0.51–0.80, relatively safe), Level III (0.81–1.00, slightly unsafe), Level IV (1.01–1.50, moderately unsafe), Level V (1.51–2.00, highly unsafe), and Level VI (>2.01, severely unsafe). The spatial distribution is shown in Figure 13. The results indicate that ecological security is relatively low, with lower levels in the central region and higher levels in the western and northeastern regions. The ecological pressure indices for Xilingol League in 2011, 2016, and 2021 were 1.64, 1.91, and 1.46, respectively, showing an initial increase and subsequent decrease, suggesting continuous improvement since 2016. There was a noticeable pattern of westward expansion and contraction in severely insecure areas. In 2011, severely and highly insecure regions were primarily located in West Ujimqin Banner and Duolun County. By 2016, these areas expanded to include Xilinhot City, Zhenglan Banner, Zhengxiangbai Banner, Xianghuang Banner, and Taibus Banner. By 2021, only Zhenglan Banner remained severely insecure. Moderately and mildly insecure areas were centrally concentrated by 2021, mainly covering Abaga Banner, Xilinhot City, West Ujimqin Banner, Zhengxiangbai Banner, and Taibus Banner. Secure regions were mostly in the western and northern parts, including Erenhot City, Sunite Left Banner, Sunite Right Banner, Xianghuang Banner, Duolun County, and East Ujimqin Banner.
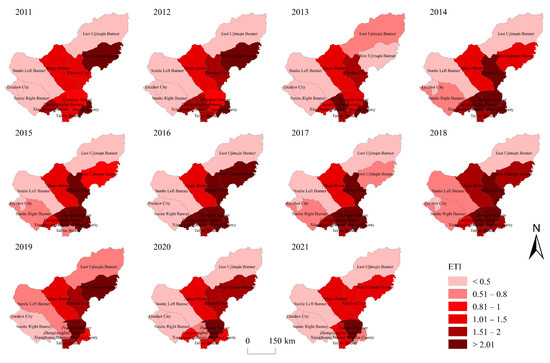
Figure 13.
Spatial distribution of ecological security levels in Xilingol League from 2011 to 2021.
The changes in area proportions of ecological security levels are illustrated in Figure 14. In 2021, the region was predominantly classified as very safe (55%), followed by moderately insecure areas (38%). The area of severely insecure regions initially increased sharply from 14% in 2011 to 31% in 2016, then decreased to 5% in 2021. Highly insecure regions consistently decreased from 3% to 0%. Moderately insecure regions initially declined from 27% to 14% in 2016, then rose to 38% in 2021. Mildly insecure areas decreased by five percentage points, reaching 0% in 2021. Relatively safe areas increased from 0% to 2%, and very safe areas increased slightly by three percentage points.
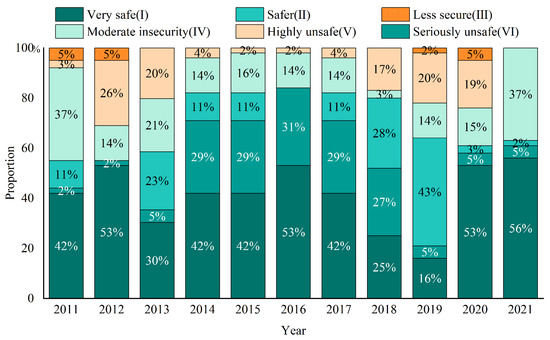
Figure 14.
Proportions of ecological security levels in Xilingol League from 2011 to 2021.
3.5.2. Changes in Ecological Pressure by Land Use Type
The trends of ecological pressure index changes for various land use types are shown in Figure 15. Ecological pressure increased from 2011 to 2016, then declined from 2017 to 2021. Grasslands experienced steadily increasing pressure due to continuous grazing leading to degradation and desertification. However, starting in 2019, the grassland ecological pressure index slowly declined, indicating slight improvement. Other land use types remained relatively safe.
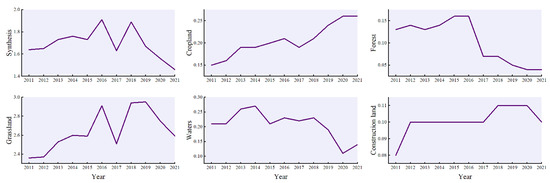
Figure 15.
Changes in ecological pressure indices of various land types in Xilingol League from 2011 to 2021.
3.6. Two-Way ANOVA
SPSS software was used to conduct a two-way analysis of variance (ANOVA) on ecological indicators across the banners and counties from 2011 to 2021. This analysis examined the impact of two categorical independent variables—banner/county and year—on five quantitative indicators. The results are shown in Table 4.
Table 4.
Two-way ANOVA results for ecological indicators in Xilingol League.
3.6.1. Ecological Footprint
The two-way ANOVA results reveal that the p-value for banners and counties is 0.000 (p < 0.05), indicating a significant main effect on the ecological footprint. The year factor has a p-value of 0.345 (p > 0.05), indicating no significant effect. As shown in Figure 16a, Abaga Banner, Sunite Left Banner, and East Ujimqin Banner had the highest impact, while Taibus Banner and Erenhot City had the lowest.
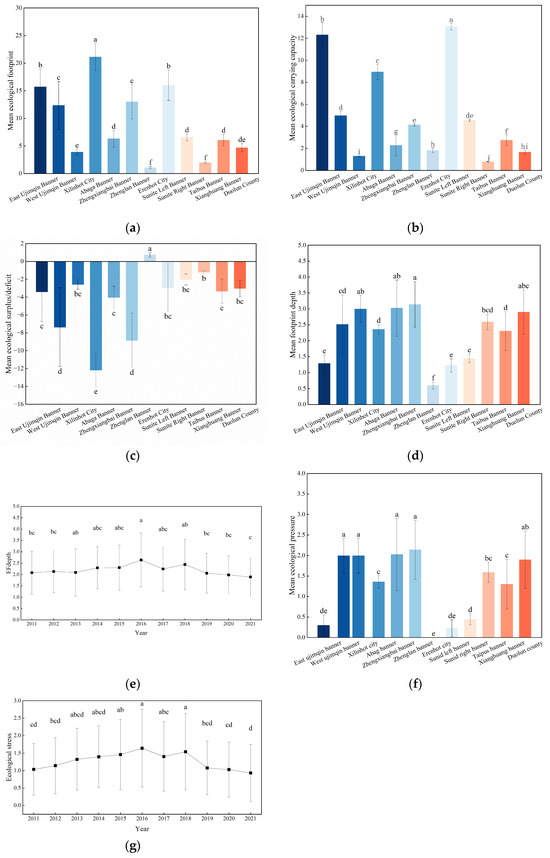
Figure 16.
Results of two-way analysis of variance. (a) Impact of banners on ecological footprint; (b) impact of banners on ecological carrying capacity; (c) impact of banners on ecological surplus/deficit; (d) impact of banners on footprint depth; (e) impact of year on footprint depth; (f) impact of banners on ecological pressure; (g) impact of year on ecological pressure. The significant difference lettering method was used to indicate the significance of differences in group means: identical letters represent no significant difference, different letters indicate significant differences, and more letters imply similarity with more groups. Completely different letters signify distinct differences, effectively illustrating the hierarchical relationships of group differences.
3.6.2. Ecological Carrying Capacity
The p-value for banners and counties is 0.000 (p < 0.05), indicating a significant main effect on ecological carrying capacity. The year factor has a p-value of 0.703 (p > 0.05), indicating no significant effect. As shown in Figure 16b, Sunite Left Banner, East Ujimqin Banner, and Abaga Banner had the highest impact, while Xilinhot City and Taibus Banner had the lowest.
3.6.3. Ecological Surplus/Deficit
The p-value for banners and counties is 0.000 (p < 0.05), demonstrating a significant main effect on ecological surplus/deficit. The year factor has a p-value of 0.346 (p > 0.05), indicating no significant effect. As illustrated in Figure 16c, Abaga Banner, Zhenglan Banner, and West Ujimqin Banner had the highest impact, while Xilinhot City and Taibus Banner had the lowest.
3.6.4. Footprint Depth
Both the banner/county and year factors have p-values of 0.000 and 0.027, respectively (p < 0.05), indicating significant main effects on footprint depth. As shown in Figure 16d,e, Abaga Banner, Zhenglan Banner, and West Ujimqin Banner have the highest impact, while Xilinhot City and Taibus Banner have the lowest. By year, 2016 had the greatest effect, and 2021 had the lowest.
3.6.5. Ecological Pressure
Both factors have p-values less than 0.05, demonstrating significant main effects on ecological pressure. As shown in Figure 16f,g, Zhengxiangbai Banner has the highest impact, while Zhenglan Banner has the lowest. By year, 2016 had the greatest effect, and 2021 had the lowest.
3.7. M-K Mutation Analysis
Mann–Kendall (M-K) mutation tests were conducted on the ecological indicators from 2011 to 2021. The significance level (α) was set at 0.05, with a critical value of ±1.96. The resulting statistical curves for UF and UB are illustrated in Figure 17.
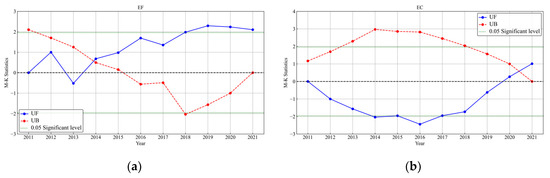
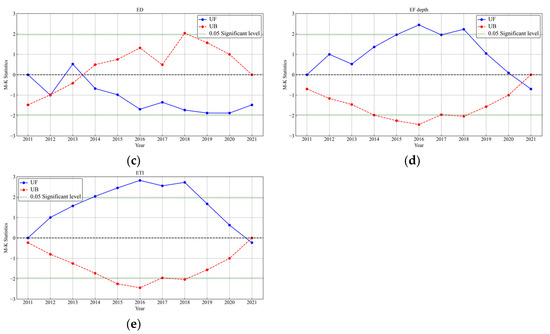
Figure 17.
M-K mutation test curves for ecological indicators in Xilingol League. (a) M-K test for ecological footprint; (b) M-K test for ecological carrying capacity; (c) M-K test for ecological surplus/deficit; (d) M-K test for footprint depth; (e) M-K test for ecological pressure.
3.7.1. Temporal Trend Changes in Ecological Footprint
The ecological footprint series exhibited a declining trend in 2013, while other years showed an upward trend. The trend lines from 2018 to 2021 exceeded the critical value, indicating a significant trend at the 95% confidence level. The mutation starting point occurred in 2013.
3.7.2. Temporal Trend Changes in Ecological Carrying Capacity
The ecological carrying capacity showed a declining trend from 2011 to 2016 and an upward trend thereafter. Trend lines from 2013 to 2017 exceeded the critical value, indicating a significant trend. The mutation starting point occurred in 2020.
3.7.3. Temporal Trend Changes in Ecological Surplus/Deficit
The surplus/deficit series exhibited fluctuating trends without exceeding the critical value, indicating no statistically significant trends. Mutation starting points occurred in 2012 and 2013.
3.7.4. Temporal Trend Changes in Footprint Depth
The footprint depth showed a declining trend in 2021 and an upward trend in other years. Trend lines from 2015 to 2018 exceeded the critical value, indicating a significant trend. The mutation starting point occurred in 2020.
3.7.5. Temporal Trend Changes in Ecological Pressure
The ecological pressure displayed a declining trend in 2021 and an upward trend in other years. Trend lines from 2013 to 2018 exceeded the critical value, indicating a significant trend. The mutation starting point occurred in 2020.
4. Discussion
Real-time assessment of ecological conditions in arid and semi-arid regions is crucial for the sustainable development of global ecosystems. Based on an improved three-dimensional ecological footprint model, this study systematically analyzes the spatiotemporal evolution characteristics of ecological footprint, ecological carrying capacity, footprint depth, and ecological pressure in Xilingol League from 2011 to 2021. Two-way ANOVA and M-K mutation tests are employed to examine the effects of county-level and year-level factors on these indices, as well as to identify the mutation points and evolution trends of each index.
This study indicates significant spatial differences in the ecological footprint and ecological carrying capacity of Xilingol League, with the ecological deficit in the northeast significantly lower than that in the southwest. This finding is consistent with previous research on the ecological carrying capacity of Xilingol League [20]. Zambrano et al. found that the spatial differences in ecological carrying capacity globally are primarily driven by the dual factors of natural resource distribution and socioeconomic activities [37]. Furthermore, the overexploitation of grassland resources and the exacerbation of ecological deficits are also prevalent in arid and semi-arid regions, such as the Sahara in Africa and the Pampas grasslands in South America [38,39]. Additionally, the results show that the ecological deficit of the grassland ecosystem in Xilingol League peaked in 2019 but has since improved, which is closely linked to China’s implementation of the “returning grazing land to grass” policy. A similar recovery trend has been observed in other regions, such as in Australia, where land management policies controlling overgrazing have led to significant ecosystem recovery in grasslands [40].
This study also confirms that the series of ecological protection policies implemented by the Chinese government since 2000 have had a significant impact on the restoration of the grassland ecosystem in Xilingol League [41]. For example, projects such as returning grazing land to grass and controlling sandstorms in the Beijing–Tianjin region have notably improved the grassland ecological footprint and alleviated ecological pressure [42]. However, Xilingol League still faces challenges in the policy implementation process, including a lack of funding, insufficient technical support, and a low level of management sophistication [43]. The policies in Xilingol League need to be further strengthened in terms of scale and depth, and the long-term goals of grassland ecological restoration can only be achieved through enhanced management of the grass–livestock balance, rational resource allocation, and strict enforcement of ecological protection boundaries. In addition, (1) similarly to the ecological protection experiences in Xilingol League, it is recommended that other arid and semi-arid regions worldwide adopt an integrated approach to watershed and ecosystem management, such as the “mountain, water, forest, farmland, lake, and grass” system, to balance ecological protection with economic development. (2) Policy formulation should consider regional characteristics and specific needs. In regions with severe ecological deficits, targeted restoration measures should be implemented. For example, scientific planning of rotational grazing and grazing bans can help reduce overconsumption of grassland resources. (3) Ecological restoration in arid and semi-arid regions is a global challenge. Strengthening international cooperation and knowledge sharing, and promoting successful experiences such as Xilingol League’s “returning grazing land to grass” policy or Australia’s grassland restoration techniques, will help other regions address similar ecological crises.
Compared to traditional ecological footprint models, this study is the first to apply an improved three-dimensional ecological footprint model to Xilingol League, a typical arid and semi-arid region, revealing the spatiotemporal changes in ecological carrying capacity and footprint depth at the county scale. Notably, through two-way ANOVA and M-K mutation tests, this study quantitatively assessed the significant trends of ecological system changes in the region, providing a scientific basis for refined management. However, compared to previous studies that only qualitatively described ecological deficits, the quantitative analysis in this study significantly enhances our understanding of the dynamic sustainability of the region’s ecology. Additionally, it offers practical guidance for ecological management in arid and semi-arid regions globally. By further strengthening financial support, technical assistance, and management sophistication, the experience of Xilingol League can serve as an important reference for global ecological carrying capacity assessments and the achievement of sustainable development goals.
5. Conclusions
From 2011 to 2021, the ecological footprint and footprint depth in Xilingol League exhibited an initial increase followed by a decline, while the ecological carrying capacity showed slight improvement. Spatially, the ecological footprint and carrying capacity across the various counties revealed a pattern where the northeastern region outperformed the southwestern region. The league is in a state of ecological deficit, with all counties except Erenhot City experiencing deficits, resulting in overall excessive ecological pressure. The ecological footprint and footprint depth of grasslands are relatively high, and although their ecological carrying capacity exceeds that of other land types, they remain in a serious state of ecological deficit. This indicates that grasslands are under significant ecological stress despite their productivity. Two-way ANOVA indicates that the county factor significantly influences the ecological footprint, carrying capacity, ecological surplus/deficit, footprint depth, and ecological pressure across Xilingol League’s counties and land uses. In contrast, the year factor significantly affects only footprint depth and ecological pressure. Notably, the influences of Abaga Banner, Sunite Left Banner, and East Ujimqin Banner on these indices are particularly pronounced. The Mann–Kendall mutation test demonstrates that the ecological footprint of Xilingol League exhibited a significant upward trend from 2013 to 2021. Meanwhile, the ecological carrying capacity began to show a significant increase from 2016 to 2021. The ecological surplus/deficit has consistently remained in a deficit state, with a notable downward trend observed from 2013 to 2021. Footprint depth significantly increased from 2011 to 2016, followed by a marked decline from 2016 to 2021. Ecological pressure showed a significant increase from 2011 to 2018, followed by a significant decrease from 2018 to 2021. Overall, these findings highlight the urgent need for sustainable land use practices and ecological restoration efforts in Xilingol League. Addressing the ecological deficits, particularly in grassland areas, is crucial for promoting environmental sustainability and supporting the region’s long-term ecological health.
Author Contributions
J.W. conducted data analysis, drafted the manuscript, and processed and analyzed the evaluation charts. X.Y. proposed the research topic and methodology, provided data sources, and offered suggestions and revisions during the editing process for this paper. All authors have read and agreed to the published version of the manuscript.
Funding
This research was funded by “Study on the Industrial Layout and Land Ecological Evaluation of Xilinguole Grassland”, grant number (NJSY21459), and the High-level/Excellent Doctoral Talent Introduction Research Initiation Project at Inner Mongolia Agricultural University—“Natural Resource Survey and Land Spatial Planning”, grant number (NDYB2019-23).
Institutional Review Board Statement
This study was approved by the regional Ethics Committee of our hospital, and all researchers signed their informed consent.
Informed Consent Statement
All authors are informed.
Data Availability Statement
The authors confirm that the data supporting the findings of this study are available within the article.
Acknowledgments
Special thanks go to the Inner Mongolia Autonomous Region Higher Education Scientific Research Project: “Study on the Industrial Layout and Land Ecological Evaluation of Xilinguole Grassland” (NJSY21459) and the High-level/Excellent Doctoral Talent Introduction Research Initiation Project at Inner Mongolia Agricultural University—“Natural Resource Survey and Land Spatial Planning” (NDYB2019-23) for providing financial support for this study.
Conflicts of Interest
The authors declare no conflicts of interest.
References
- Smaal, A.; Prins, T.; Dankers, N. Minimum requirements for modelling bivalve carrying capacity. Aquat. Ecol. 1997, 31, 423–428. [Google Scholar] [CrossRef]
- Qian, X.; Wei, S.; Yili, Z.; Fengyun, M. Research Progress in Ecological Carrying Capacity: Implications, Assessment Methods and Current Focus. J. Resour. Ecol. 2017, 8, 514–525. [Google Scholar] [CrossRef]
- Malthus, T. An Essay on the Principle of Population, 1st ed.; J. Johnson: London, UK, 1798. [Google Scholar]
- Robert, E.P.; Ernest, W.B. Introduction to the Science of Sociology, 1st ed.; The University of Chicago Press: Chicago, IL, USA, 1921. [Google Scholar]
- Rees, W.E. Ecological foot prints and appropriated carrying capacity: What urban economical eaves out. Environ. Urban. 1992, 4, 121–130. [Google Scholar] [CrossRef]
- Wackernagel, M.; Rees, W.E. Perceptual and structural barriers to investing in natural capital: Economics from an ecological footprint perspective. Ecol. Econ. 1997, 20, 3–24. [Google Scholar] [CrossRef]
- Niccolucci, V.; Bastianoni, S.; Tiezzi, E.B.P.; Wackernagel, M.; Marchettini, N. How deep is the footprint? A 3D representation. Ecol. Model. 2009, 220, 2819–2823. [Google Scholar] [CrossRef]
- Fang, K.; Heijungs, R. A Review on Three-Dimensional Ecological Footprint Model for Natural Capital Accounting. Prog. Geogr. 2012, 31, 1700–1707. [Google Scholar]
- Jiao, S.H.; Wang, A.Z.; Chen, L.F.; Zhang, J.W.; Li, Z.X.; Yin, Y.X. Three-dimensional water ecological footprint measurement and its driving factors in China’s provinces. World Reg. Stud. 2022, 31, 988–997. [Google Scholar]
- Lu, Y.; Zhao, Y.D.; Dong, J.H. Ecological security evaluation and driving force analysis of three-dimensional ecological footprint in Northwestern China. Acta Ecol. Sin. 2022, 42, 1354–1367. [Google Scholar]
- Xiong, Y.; Ai, G.X.; Zhou, C.; Yao, Y.; Xie, Q. Temporal and spatial evolution of ecological sustainability in Dongting Lake area based on the improved three-dimensional ecological footprint model. Acta Ecol. Sin. 2022, 42, 1165–1179. [Google Scholar]
- Dai, Y.T.; Zhu, D.L.; Zhang, H.; Guo, L.L. Sustainable Use of Land Natural Capital and Decoupling Effect in Shaanxi Province Based on Three-dimensional Ecological Footprint. Resour. Environ. Yangtze Basin 2022, 31, 1926–1937. [Google Scholar]
- Bi, M.; Yao, C.; Xie, G.; Liu, J.; Qin, K. Improvement and application of the three-dimensional ecological footprint model. Ecol. Indicators 2021, 125, 107480. [Google Scholar] [CrossRef]
- Xun, F.; Hu, Y. Evaluation of ecological sustainability based on a revised three-dimensional ecological footprint model in Shandong Province, China. Sci. Total Environ. 2019, 649, 582–591. [Google Scholar] [CrossRef] [PubMed]
- Zhang, X.X.; Zeng, H. Dynamic of three-dimensional ecological footprint in the Pearl River Delta and its driving factors. Acta Sci. Circumstantiae 2017, 37, 771–778. [Google Scholar]
- Liu, Y.H.; Shi, L.; Chang, H.; Xie, Y.; Wei, L.; Sun, H.L.; Zhai, X. Analysis of driving factors that influence the pattern and quality of the ecosystem in Xilingol League. Acta Prataculturae Sin. 2021, 30, 17–26. [Google Scholar]
- Liu, A.J.; Han, J.G. The Study of Method about Monitoring Grazing Intensity in Xilingol Rangeland Using RS Data. Chin. J. Grassl. 2007, 2, 70–74. [Google Scholar]
- Li, H.; Zhang, L.; Qin, X.; Wang, G.; Meng, X.; Gao, K.; Zhang, J.; Zhang, B.; Guo, J.; Lu, Z. Assessment of regional ecological carrying capacity of the coal-electricity development area in arid and semi-arid grassland of Inner Mongolia. Chin. J. Ecol. 2024, 43, 522–532. [Google Scholar]
- Bao, R.; Qiu, S.; Tang, M.; Deng, H. Evaluation of Ecological Carrying Capacity in Xilingol League Based on DPSIR Model. Ecol. Econ. 2020, 36, 139–145. [Google Scholar]
- Aodenggaowa, M. Changes in Carrying Capacity of Grassland in Xilingol League of Inner Mongolia from 2013 to 2020. Bull. Soil Water Conserv. 2024, 44, 446–454. [Google Scholar]
- Wang, S.; Huang, L.; Xu, X.; Li, J. Evaluation of soil, water resources and ecological carrying status of the Tarim River basin from the perspective of three-dimensional ecological footprint model. Environ. Eng. 2022, 40, 286–294. [Google Scholar]
- Wackernagel, M.; Onisto, L.; Bello, P.; Linares, A.C.; Falfán, I.S.L.; García, J.M.; Guerrero, A.I.S.; Guerrero, M.G.S. National natural capital accounting with the ecological footprint concept. Ecol. Econ. 1999, 29, 375–390. [Google Scholar] [CrossRef]
- Li, Y.F.; Chen, Z.; Lei, H.L.; Liu, C.; Lu, Y.R. Spatial-temporal evolution and ecological sustainability analysis of ecological footprint in Heilongjiang Province. J. Environ. Eng. Technol. 2023, 13, 1194–1203. [Google Scholar]
- Siche, R.; Pereira, L.; Agostinho, F.; Ortega, E. Convergence of ecological footprint and emergy analysis as a sustainability indicator of countries: Peru as case study. Commun. Nonlinear Sci. Numer. Simul. 2010, 15, 3182–3192. [Google Scholar] [CrossRef]
- Wei, B.H.; Kasimu, A.; Reheman, R.; Zhao, Y.Y. Ecological carrying capacity evolution and ecological sensitivity analysis of urban agglomeration in the northern slope of Tianshan Mountains. Acta Ecol. Sin. 2023, 43, 1399–1411. [Google Scholar]
- Liu, H.B.; Xia, C.Z.; Lin, T.; Xu, H.; Lian, S.M.; Xu, Z.L. Sustainable development evaluation based on an improved ecological footprint model: A case study of northern Xinjiang. Acta Ecol. Sin. 2023, 43, 234–248. [Google Scholar]
- Cui, X.R.; Li, X.X.; Zhang, H.M.; Zhang, N.Y.; Feng, Z. Dynamic evaluation of natural capital in Zhejiang Province based on the three-dimensional ecological footprint extension model. Chin. J. Ecol. 2019, 38, 2177–2183. [Google Scholar]
- Fang, K.; Gao, K.; Li, C.H. International comparison of natural capital use: A three-dimensional model optimization of ecological footprint. Geogr. Res. 2013, 32, 1657–1667. [Google Scholar]
- Fang, K. Assessing the natural capital use of eleven nations: An application of a revised three-dimensional model of ecological footprint. Acta Ecol. Sin. 2015, 35, 3766–3777. [Google Scholar]
- Fang, K. Ecological footprint depth and size: New indicators for a 3D model. Acta Ecol. Sin. 2013, 33, 267–274. [Google Scholar] [CrossRef]
- Zhao, X.G.; Ma, C.H.; Gao, L.F.; Wei, L.H. Assessment of ecological safety under different scales based on ecological tension index. Chin. J. Eco-Agric. 2007, 15, 135–138. [Google Scholar]
- Ma, C.X.; Yang, R.X.; Ke, X.L.; Ma, Z. Construction and optimization of ecological security pattern in Yangtze River delta based on the perspective of ecological pressure. Resour. Environ. Yangtze Basin 2022, 31, 135–147. [Google Scholar]
- Xu, D.; Feng, C.H. The statistical analysis of employment structure and its influencing factors based on Two-way ANOVA. Mod. Econ. Inf. 2014, 9, 88. [Google Scholar]
- Wang, C.Y.; Gong, W.; Chang, P.B. Analysis of radiation characteristics of Yan ’an station in 30 years based on MK test. Shaanxi Water Resour. 2022, 10, 184–185. [Google Scholar]
- Lan, X.C. Influence of Mass Elevation Effect Factors on Latent and Sensible Heat Fluxes on the Tibetan Plateau. Master’s Thesis, Henan University, Zhengzhou, China, 2023. [Google Scholar]
- Zhang, H.B.; Wang, W.; Song, Y.J.; Miao, L.G.; Ma, C. Ecological index evaluation of arid inflow area based on the modified remote sensing ecological index: A case study of Tabu River Basin at the northern foot of the Yin Mountains. Acta Ecol. Sin. 2024, 44, 523–543. [Google Scholar]
- Zambrano-Monserrate, M.A.; Ruano, M.A.; Ormeño-Candelario, V.; Sanchez-Loor, D.A. Global ecological footprint and spatial dependence between countries. J. Environ. Manag. 2020, 272, 111069. [Google Scholar] [CrossRef] [PubMed]
- Wu, S.; Gao, X.; Lei, J.; Zhou, N.; Guo, Z.; Shang, B. Ecological environment quality evaluation of the Sahel region in Africa based on remote sensing ecological index. J. Arid Land 2022, 1, 14–33. [Google Scholar] [CrossRef]
- Modernel, P.; Rossing, W.A.; Corbeels, M.; Dogliotti, S.; Picasso, V.; Tittonell, P. Land use change and ecosystem service provision in Pampas and Campos grasslands of southern South America. Environ. Res. Lett. 2016, 11, 113002. [Google Scholar] [CrossRef]
- New, T.R. Australian Grasslands—Variety and Extent. In Insect Conservation and Australia’s Grasslands; Springer: Cham, Switzerland, 2019; pp. 37–57. [Google Scholar]
- ‘Reducing Sheep and Increasing Cattle’ Sang the New Pastoral Song of Grassland. Available online: http://grassland.china.com.cn/2019-07/16/content_40828966.html (accessed on 16 July 2019).
- Fang, J.Y.; Bai, Y.F.; Li, L.H.; Jiang, G.M.; Huang, J.H.; Huang, Z.Y.; Zhang, W.H.; Gao, S.Q. Scientific basis and practical ways for sustainable development of China’s pasture regions. Chin. Sci. Bull. 2016, 61, 155–164. [Google Scholar]
- Tana. Evaluation and cause analysis of grassland ecological deficit—A case study of Xinlin Gol League. J. Anhui Agric. Sci. 2024, 52, 247–249. [Google Scholar]
Disclaimer/Publisher’s Note: The statements, opinions and data contained in all publications are solely those of the individual author(s) and contributor(s) and not of MDPI and/or the editor(s). MDPI and/or the editor(s) disclaim responsibility for any injury to people or property resulting from any ideas, methods, instructions or products referred to in the content. |
© 2024 by the authors. Licensee MDPI, Basel, Switzerland. This article is an open access article distributed under the terms and conditions of the Creative Commons Attribution (CC BY) license (https://creativecommons.org/licenses/by/4.0/).