Article

Goodbye Plastic Bags? Lessons from the Shopping Plastic Bag Ban in Chile

by
Maximiliano Frey
1,2,* and
Luis A. Cifuentes
1
1
School of Engineering, Pontificia Universidad Católica de Chile, Santiago, Chile
2
School of Government, Pontificia Universidad Católica de Chile, Santiago, Chile
*
Author to whom correspondence should be addressed.
Sustainability 2024, 16(9), 3690; https://doi.org/10.3390/su16093690
Submission received: 26 January 2024 / Revised: 8 April 2024 / Accepted: 20 April 2024 / Published: 28 April 2024

Abstract

:
Bans on single-use plastic shopping bags (SUPBs) are a popular policy to tackle plastic pollution. However, their success has been evaluated solely based on reduced SUPBs consumption, ignoring the impacts of substitutes. This article addresses this gap by analyzing the Chilean plastic bag ban law. Results show a reduction of ~249 kilotons of SUPBs consumed and a change in the materiality of shopping bags (mainly toward paper), but also an increase of more than 50% of bin liners after the enactment of the ban. Despite some undesired effects, an improvement in the environmental performance of the bag market is obtained in fifteen of the eighteen categories studied. The environmental impacts are on average 38% lower than in the counterfactual scenario. This suggests that the law is being effective in protecting the environment. The strictness of the ban and its rapid enforcement were positive aspects of its design, but ignoring the end-of-life of the bags could be limiting its impact. To reduce the environmental impact of substitutes, it is recommended to create design guidelines for shopping bags and bin liners.

1. Introduction

Plastic is present in most of the products and services we consume. The material has remarkable properties, is highly durable, can be both flexible and rigid, is hygienic, chemically resistant and has a low production cost [1,2]. Given the above, it may come as no surprise that more than 360 million metric tons of plastic are being produced each year [3,4]. Unfortunately, 79% of the total plastic produced has ended up in landfills or open environments [5]. One of the main reasons for this is the linear consumption pattern of the society, which has resulted in the widespread use of fast-disposable plastics [6,7]. This is the case of single-use plastic shopping bags (SUPBs) that have dominated the market since the 1980s [8,9], constituting one of the most convenient and popular tools for shopping [10,11]. Today, up to 5 trillion plastic bags are being produced annually [12,13]. Consequently, discussion on their environmental impacts and possible solutions has become a recurring theme in all regions of the world.
The most visible impact of SUPBs is their contribution to littering both in nature and in public spaces within cities [14,15]. This phenomenon degrades the visual attractiveness of landscapes and represents a danger to the safety and health of people and ecosystems [16,17]. In poor waste management systems, the bags can clog sewers and water drains, generating flooding and enabling spaces conducive to vector emergence [18,19]. Moreover, degraded plastics have been shown to release a wide range of toxic chemicals, including plasticizers, flame retardants, and colorants, which have the potential to leach into the environment, thereby contaminating soil, water, and air [2,11,20,21].
One popular solution used by national governments to address plastic pollution is the ban of a product [3,22]. This is due to the simplicity of the instrument and costs of monitoring compliance relative to other types of initiatives. Specifically, banning SUPBs is the most frequent public policy [22,23,24]. In 2018, UNEP identified 83 countries that had banned the free distribution of SUPBs and 61 countries that banned their manufacture and import [24]. Therefore, it is possible to find a wide variety in the type and stringency of the restriction used [22,23,24]. In most cases, it is not a total blocking of the product. There are regulations that limit the volumes produced, establish thresholds and/or material requirements (for example, a percentage of recycled plastic or the biodegradability of the product).
Despite the successful adoption of the policy worldwide, its effectiveness for environmental stewardship is under debate [24,25,26]. The academic literature on the environmental effectiveness of banning SUPBs is limited [24,27,28]. Evaluations conducted focus on looking at the difference in the amount of SUPBs before and after the ban, but only mention the appearance of substitutes discursively. For example, an increase in the number of paper bags is often mentioned, but the change in quantities is not discussed. Also, few studies have explored the environmental impacts of the ban. The exceptions are the works of Taylor [29], which outlines the carbon footprint of the policy, and Macintosh et al. [27] which calculates the presence of SUPBs as littering.
On August 3 of 2018, Chile had become the first Latin American country to enact a ban of plastic bags at the national level (Law Nº 21,100). A report in the local newspaper La Tercera identified some of the consequences of the ban one year after its implementation: companies linked to the production of SUPBs were closed, and there was a strong entry of paper bags and an explosive increase in the sale of bin liners [30]. On the other hand, González-Arcos et al. [31] analyzed the changes in consumer behavior at the beginning of the ban and managed to identify some of the substitutes that were emerging. It was observed that supermarkets began to sell cardboard boxes and reusable bags. Meanwhile, neighborhood stores offered newspaper cones to make it easier to carry groceries. Some consumers began to make their own reusable bags with old fabrics, and some took advantage of the pull and pack bags to carry products. In addition to the above, the Ministry of the Environment (MMA: Ministerio de Medio Ambiente) estimated that about 11.5 million of plastic bags had been avoided due to the law [32]. However, to our knowledge, the environmental impacts have not been studied. This is relevant since avoiding the production of SUPBs does not necessarily imply protecting the environment. Especially, because in certain situations, the environmental impacts of substitutes to SUPBs can be greater [11,33,34].
The purpose of this work is to contribute to the design of effective public policies to protect the environment through the analysis of the shopping plastic bag ban in Chile. The main objective is to evaluate the public policy effectiveness in order to learn lessons about its design. The structure of the paper is as follows. First, background information about Chile and the ban is provided. Second, the theoretical model and data is presented. Third, estimates of the consumption of SUPBs and substitutes, and their expected environmental impacts are shown. Fourth, the results of its effectiveness and the design factors that could explain it are discussed. Finally, we conclude by summarizing the lessons learned.

2. Policy Context in Chile and Its Plastic Bag Ban

2.1. Background Information

Chile is a country of long and narrow geography located in the extreme south of Latin America with a great diversity of ecosystems https://www.gob.cl/nuestro-pais (accessed on 1 February 2024). Demographically it has a population of around 19 million people, where more than 9.5% of them identify themselves as native people [35,36,37]. It is recognized for having a high level of endemism and has been awarded three times as the best green destination in the world [38,39]. In fact, 21.3% of its continental territory is protected under the National System of Wildlife Areas [40]. However, it is also one of the countries that are most vulnerable to climate change, constantly affected by natural disasters and with a water deficit of more than 14 years [41,42,43,44].
In this context, environmental care has gained great relevance in the country during the last decades. This is reflected in the profound change that its environmental institutional framework has had since 2010. Where specific bodies for design, execute, evaluate, and oversight environmental policies where created (Law Nº 20,600, 2012; Law Nº 20,417, 2010). Also, along with the enactment of the plastic bag ban, other initiatives that address the plastic pollution problem have been developed. Of note are the Law on Extended Producer Responsibility and Promotion of Recycling (Law Nº 20,920), the Chilean Plastics Pact [45], the Circular Economy Roadmap [46], the Law regulating the delivery of single-use plastics (Law Nº 21,368, 2021) and the Climate Change framework law (Law Nº 21,455). In fact, before the national bag ban, 92 cities and towns created ordinances and municipal agreements regulating the delivery of SUPBs in their territories [47].

2.2. The Chilean Plastic Bag Ban

The plastic bag ban in Chile regulation aims to “protect the environment by prohibiting the delivery of shopping plastic bags” (Law Nº 21,100, 2018, Article 1). It defines a plastic bag as flexible packaging produced mostly from petroleum with a tubular body closed at one of its ends. The adjective “shopping” means that the bag is supplied by a commercial establishment for the transportation of goods. Excluding bags that constitute primary packaging for foodstuff or that are necessary for hygienic reasons. It was implemented in three stages: (1) After enactment, the delivery was limited to two shopping plastic bags for each purchase made. (2) After six months, the delivery of shopping plastic bags was prohibited from large commercial shops, i.e., companies with sales and service revenues greater than 4.33 million of dollars annually could not deliver the product (Law Nº 20,416). (3) After two years, the prohibition was extended to all commercial shops in the country.
Three particularities of the Chilean case should be highlighted with respect to other legislation banning plastic bags in the world [22,24,25]. First, only the distribution of the product is being banned. This means that plastic bags can continue to be produced and imported. Second, it is observed that only the material of the bag is considered as an exclusion criterion, i.e., design elements (thickness, size, functionality) are not considered. And third, references to the end-of-life of the material are omitted. Concepts such as recyclability, biodegradability or reusability do not appear in the regulation.
Finally, the incorporation of an explicit environmental education component in the regulation is noteworthy. This is because although the Law on General Bases of the Environment (Law Nº 19,300) defines environmental education as an instrument of environmental management, it does not specify the topics to be worked on. The Law Chao Bolsas Plásticas requires addressing the issue of plastic bag pollution, such that: “The [MMA] will promote and implement environmental education programs aimed at citizens, on the use of plastic shopping bags in circulation and their impact on the ecosystem, including their reuse and recycling” (Law Nº 21,100, Article 7).

3. Method

3.1. Theorical Model of the Environmental Impacts of the Law

The theoretical model is shown in Figure 1 in which the law changes the consumption of SUPBs and their substitutes after its enactment. Using the unit environmental impacts of each type of bag, the expected environmental impact of the law can be estimated. It should be noted that substitutes consider the secondary function of SUPBs as bin liners (in this article, bin liner, garbage bag, rubbish bag and refuse bag are used interchangeably as synonyms). Also, all the relationships are embedded in a country context, so there are external factors (economic activity, socio-political situation, among others) that also influence the variables, but are not shown in the figure.
Therefore, to evaluate the expected environmental impact of the law, the situation before and after its enactment is observed (Equation (1)). The assumption is that the changes that occur in the period in the consumption of SUPBs and their substitutes are the direct and indirect product of the law under analysis. This means that if the law had not been enacted, the situation of SUPBs and their substitutes would have remained constant. For this purpose, a counterfactual is created that extrapolates the trend that SUPBs and their substitutes had in the period 2014 to 2017 to the subsequent period. Thus, the net expected environmental impact is obtained by the following:
D i t = Y ¯ i t Y i t             i ,   t [ 2014 ,   2021 ]
where D i t is the net expected environmental impact i at time t. Y ¯ i t is the expected environmental impact i at time t without the legislation. Y i t is the expected environmental impact i at time t with the legislation. The expected environmental impacts are calculated as follows:
Y i t = s β i s η s t       i ,   t [ 2014 ,   2021 ]
where β i s is the unit environmental impact i of one gram of the bag material s and η t s is the total mass of bag s consumed at time t. The following details how the quantities of bags consumed in the country were estimated and how the unitary environmental impacts were selected.

3.2. Estimation of Consumption of Bags in Chile

The consumption of bags is given by the number of bags produced in Chile plus net imports (imports minus exports of each bag). Since there is no official database that groups together this information, the available quantities of shopping plastic bags and their substitutes are estimated through different channels. This includes data from CENEM (Centro de Envases y Embalajes de Chile), a guild that groups the main suppliers of plastic and paper bags in the country, sustainability reports of supermarkets and retail companies, the National Institute of Statistics (INE) and the National Customs Service. Furthermore, 15 interviews were conducted with key actors in the sector and in the policy process (see Appendix A). This allowed us to cross-check information and draw additional lessons about the law and its consequences. The detail of the estimation for each bag is given below.

3.2.1. Bags Produced in Chile

Plastic Bags

The Statistical Reports of CENEM gives us an estimation of the number of plastic bags locally produced during the period 2014 to 2021 from the main plastic bag companies [48,49]. Before the law, these corresponded to Plásticos Mendoza (38% of production), Inapol (30%), Cambiaso Hermanos (15%) and Somaplas (10%) [30]. The remainder corresponded to small producers who, after the ban, captured part of the demand following the closure of Inapol and Plásticos Mendoza.
The disaggregated information of each type of plastic bag is not available in the Statistical Reports of CENEM. However, according to Claudio Morales from Plásticos Mendoza (Interview 1), the production of the main plastic bag companies was mainly for supermarkets and big retailers. Bags that were mainly made of HDPE and LDPE, respectively, while street markets and little shops have other suppliers. It is relevant to mention that plastic shopping bags often contain other components than plastic. However, due to the diversity of suppliers, it is not feasible to consider this detail for the estimates. In any case, Appendix B shows the details of the composition of the main plastic shopping bags in Chile.
From the interview with CENEM (Interview 2), it was possible to estimate the percentage of plastic bags that go to supermarkets (HDPE bags): 35%, and department stores (LDPE Bags): 43%, and which were plastic bin liners: 16% (Plastic bin liners, recycled HPDE). These proportions are assumed constant until the enactment of the plastic bag ban. The remaining 6% includes other types of plastics, such as PVC and Nylon (other plastic bags) and polypropylene (PP bags). It is assumed that PP BAGS represents 90% of this group.
After the implementation of the ban, the quantities of HDPE and LDPE bags drop to zero for supermarkets and retailers. However, street markets continued delivering the HDPE bags as primary food packing. The only recorded data about the number of plastic bags consumed by this sector corresponds to the year 2016: 2 million [50]. Because of this, it was assumed that the number of plastic bags delivered by this sector was proportional to the number of street markets registered each year [50,51,52,53].

Paper Bags

The Statistical Reports of CENEM gives us an estimation of the number of paper bags locally produced during the period 2014 to 2016 [49]. For the year 2017, the average of the last three years was used. To estimate the quantities of paper bags after the ban (2018 to 2021), it was assumed a substitution of the product like the one occurred in the Paris store [54], one of the main departments stores in the country. Likewise, it was weighed by the growth of the commerce sector each year [55,56].

Plant Based Bags

Plant based bags are shopping bags (Biobags) and bin liners (Bio bin liners) that have a relevant percentage of vegetable raw material other than cellulose. The number of biobags and bio bin liners locally produced during the period 2014 to 2021 was estimated from the interviews (Interview 3, 4, 5 and 6) and secondary data from news [30,57,58,59] and company websites (Progress SPA, Plastival, SoydeMaíz, Megapol S.A, Esquina Blanca, Bolsas verdes, Ecopacks, Soycompostable, Biogleam, Soinpla, Unibag, Ceroplas, Biobag). It is important to note that in this case it was not possible to access a statistical record of the bags.

3.2.2. Net Imports of Bags

Net imports were recovered from the database of the National Customs Service for the period from 2014 to 2021. During this period, more than 3000 companies imported some type of bag into the Chilean market, with Fabrica de Bandejas Limitada, Walmart Chile S.A. and Suraga S.A. being the main importers with 9%, 7% and 5% of the registered imports. Glosses with a direct reference to “bags” in their name were selected and then filtered through their trade description (see Appendix C). So, only shopping or rubbish bags appeared as products.
This returned 74,967 registers, which were classified according to the categories: plastic bin liners, bio bin liners, biobags, paper bags, HDPE bags, LDPE bags, PP bags and other plastic bags. This was completed through the identification of keywords in the trade description of each item. For example, if the pattern polypropylene bag (or similar) matched, it was classified as PP bags. However, two important assumptions were made: plastic bags without other material indications were classified as other plastic bags and all polyethylene bags were classified as PE bags and then divided into HDPE and LDPE bags based on the proportions of local production.

3.3. Unit Environmental Impacts for Type of Bag

The unit environmental impacts were determined based on a literature review of the Life Cycle Assessment (LCA) for each type of bag, since calculating unit impacts is beyond the scope of this work. LCA is a standardized method for quantifying the expected environmental impacts of products or services by analyzing the inputs and outputs of the system at each stage of its life cycle [60,61]. The ISO standard proposes factors for many impact categories (greenhouse gas emissions, water consumption, toxicity, among others), but does not specify which ones should be included in a specific analysis. These should be selected by the researcher in conjunction with stakeholders, according to the purpose and available resources [62]. In addition, the application of the factors depends on the characteristics of the system (geographical location, energy matrix, waste management system, among others), so special emphasis is placed on the selection of a study that meets conditions like those in Chile.
Due to the above, the study of Stafford et al. was selected [63]. It is one of the few studies that assumes end-of-life treatment like the Chilean case, where most waste ends up in landfill or similar facilities [64]. Besides, it performs an analysis of a wide range of bag categories studied and environmental impact categories, which allows for a comprehensive comparison between different bag types. Details of the studies reviewed can be found in Appendix C.

4. Results

4.1. Change in the Consumption of SUPBs and Their Substitutes

Table 1 shows the consumption of bags by type in Chile during 2014 to 2021. These are divided into two markets: the shopping bags market and the bin liners market. Within the former, SUPBs (SUPBs are assumed to be HDPE and LDPE bags) coexist with other types of bags categorized as “other shopping bags” in Figure 2.
In the shopping bag market (SUPBs plus other shopping bags), a reduction in total bag consumption is observed after the enactment of the law, which then remains constant over the years. This is a consequence of the decrease in the amount of SUPBs consumed and the increase in other shopping bags. Specifically, SUPBs decreased from 7931 million units consumed in 2017 to only 3327 million units in 2021, while other shopping bags increased by almost 3000 million units over the same period.
The above reveals a change in the market share of bag types, where SUPBs went from holding 97% to less than 50%. In Table 1, it is possible to identify that the main substitute for the primary function of SUPBs are paper bags, which went from having 1.7% of the shopping bags market share in 2017 to more than 30% in 2019, 2020 and 2021. Biobags have also had a relevant growth and each year have won at least 1% more of the market share since 2017. The same happened with PP and other plastic bags, which doubled their consumption both in absolute quantities and as a percentage of total bags.
In the bin liners market, there has been an evident growth in consumption. From 2018 to 2021, the amount of garbage bags increased to 2420 million units. When looking by type, it is worth noting that the number of bio bin liners has an increasingly larger share of the market since 2014. However, in the two years after the enactment of the law, the growth rate soared from an average 0.42% to 5.37% from 2019 to 2020 and then decreased in 2021.
At the aggregate level (shopping bag market plus bin liners market), it is observed that the total number of bags remains almost constant, even though the average consumption of shopping bags fell from 442 to 304 units per capita per year during the study period. This means that, although there has not been a complete substitution of SUPBs for other products in their primary use, the quantities are compensated for from their secondary use as refuse bags. In fact, plastic still has a dominant position in the total consumption in 2021: 73% of bags in Chile were made of this material (plastic bin liners, HDPE bags, LDPE bags, PP bags and other plastic bags). However, the tons of plastic did decrease substantially, as on average the material used to make a rubbish bag is much less than that of a SUPB (see Appendix E).
One question that remains is whether the design of plastic bags changed during the study period. Unfortunately, local consumption data is not sufficiently disaggregated to assess this. But it is possible to look at some trends through the records of the National Customs Service. It is important to note that net imports of plastic bags represent between 10% and 29% of total consumption depending on the year, so these results should be interpreted with caution (see Figure 3).
Figure 4 shows the percentage of reusable, biodegradable and recycled plastic bags in relation to the net import of plastic bags. As it can be seen, there is a slight increase in the share of reusable (+6.5%), biodegradable (+4%) and recycled (+0.3%) plastic bags in 2019. But it is not possible to point to these changes as significant, especially since there is not a clear trend in the data. However, interviewees agree that there was an important increase in the total consumption of reusable and biodegradable plastic bags in the first months after the enactment. Where, one of the reasons given, is that there was confusion about the scope of the law. Several companies did not realize that all plastic shopping bags were banned, therefore tried to switch to plastic options that they felt were more sustainable.

4.2. Environmental Impacts of the Bags Market

To assess the net expected environmental impact, equations 1 and 2 (see methodology) are used. These are presented through the graphs of eighteen dimensions of expected environmental impact for the scenario with (orange line) and without law (blue line) (Figure 5). These show the expected variation of the environmental indicator due to the change in the vector of consumption of shopping bags and bin liners during the study period. It is important to remember that this indicator is constructed based on the theoretical model presented and is not a direct measure of the different emissions, pollutants or resources used. The values in the graphs are normalized based on the average of the years 2014 to 2017 and the black dotted line indicates the year of enactment of the law.
Figure 5 shows that in fifteen of the eighteen categories there was a reduction in the expected environmental impact after the enactment of the law. Specifically, in these fifteen categories, the impacts are on average 38% lower than in the counterfactual scenario, with a standard deviation of 15.7%. In fact, each year the gap between scenarios is widening and, in 2021, eleven of the indicators show more than a 50% reduction in the expected environmental impact. On the other hand, there are three categories where the expected environmental impact was not positive: ozone depletion, water consumption and land use (see last row of Figure 5). However, only in one (land use) does a negative impact of the legislation seem evident (increasing its impact by up to five times).

5. Discussion

5.1. Lessons Learned on the Design and Implementation of the Ban

The results show an important reduction in both SUPBs consumption and total plastic shopping bags post-ban. Although it is not possible to be sure of causality with these results, interviewees agree that it was the enactment of the law that was the main reason for the change in bag consumption. This differs from other experiences were reduction of plastic due to SUPBs was almost compensated by the increase in other types of plastic carrier bags [22,24,27]. For example, in the Australian Capital Territory, only bags made of polyethylene with a thickness of <35 μm were banned. This led to a substantial increase in the consumption of thicker plastic bags after the ban, with only a slight reduction in total plastic consumption [27]. However, it should be noted that the shift to thicker bags is not a negative effect in itself, as long as the bags have better end-of-life management (e.g., through a higher reuse and/or recycling rate).
The effective reduction of plastic shopping bags shows that it is not necessary to ban the production of a product in order to limit its consumption. Recall that in this case, the ban focused on distribution from commercial shops. This is a relevant finding for the industry, since it suggests that is not necessary to close down manufacturing companies to implement this type of regulation. Given them the possibility of refocusing the supply of their product to other sectors or services of the economy. Unfortunately, the Chilean experience shows that if no additional measures are taken to facilitate this transition to the companies, prohibiting the distribution of a product could have the same effect as prohibiting its production: the closure of the manufacturing companies. This is one of the adverse effects most often cited in the literature and, when producer groups have significant bargaining power, they have ended up revoking the ban [65,66].
The speed with which the ban was implemented is an element worth discussing. When the time between the announcement of the law and its implementation is too short for the market to adapt, it has led to negative consequences such as the lack of substitute products, the emergence of illegal markets and the breakdown of the industry [24,26,65]. Of course, determining the precise speed is not a simple exercise as it will depend on the conditions of each country. In this case, there is consensus among interviewees (except from the plastics industry) that the timing of the implementation of the “Chao Bolsas Plásticas” law was positive for its effectiveness. They emphasized that the rapid speed of implementation generated a shock among the population that made them aware of the impacts of their shopping habits, raising a social norm that repudiated the delivery of SUPBs by commercial stores. However, we must be cautious about generalizing this conclusion. There have been experiences with totally opposite results, such as that of Zimbabwe. In that case, people take a stand against the measure, arguing that it was a way to avoid the government’s responsibility for waste management [26]. One possible explanation for this difference could be that in Chile, citizens had been demanding the ban and several municipalities had already implemented similar initiatives in their communities [67,68].
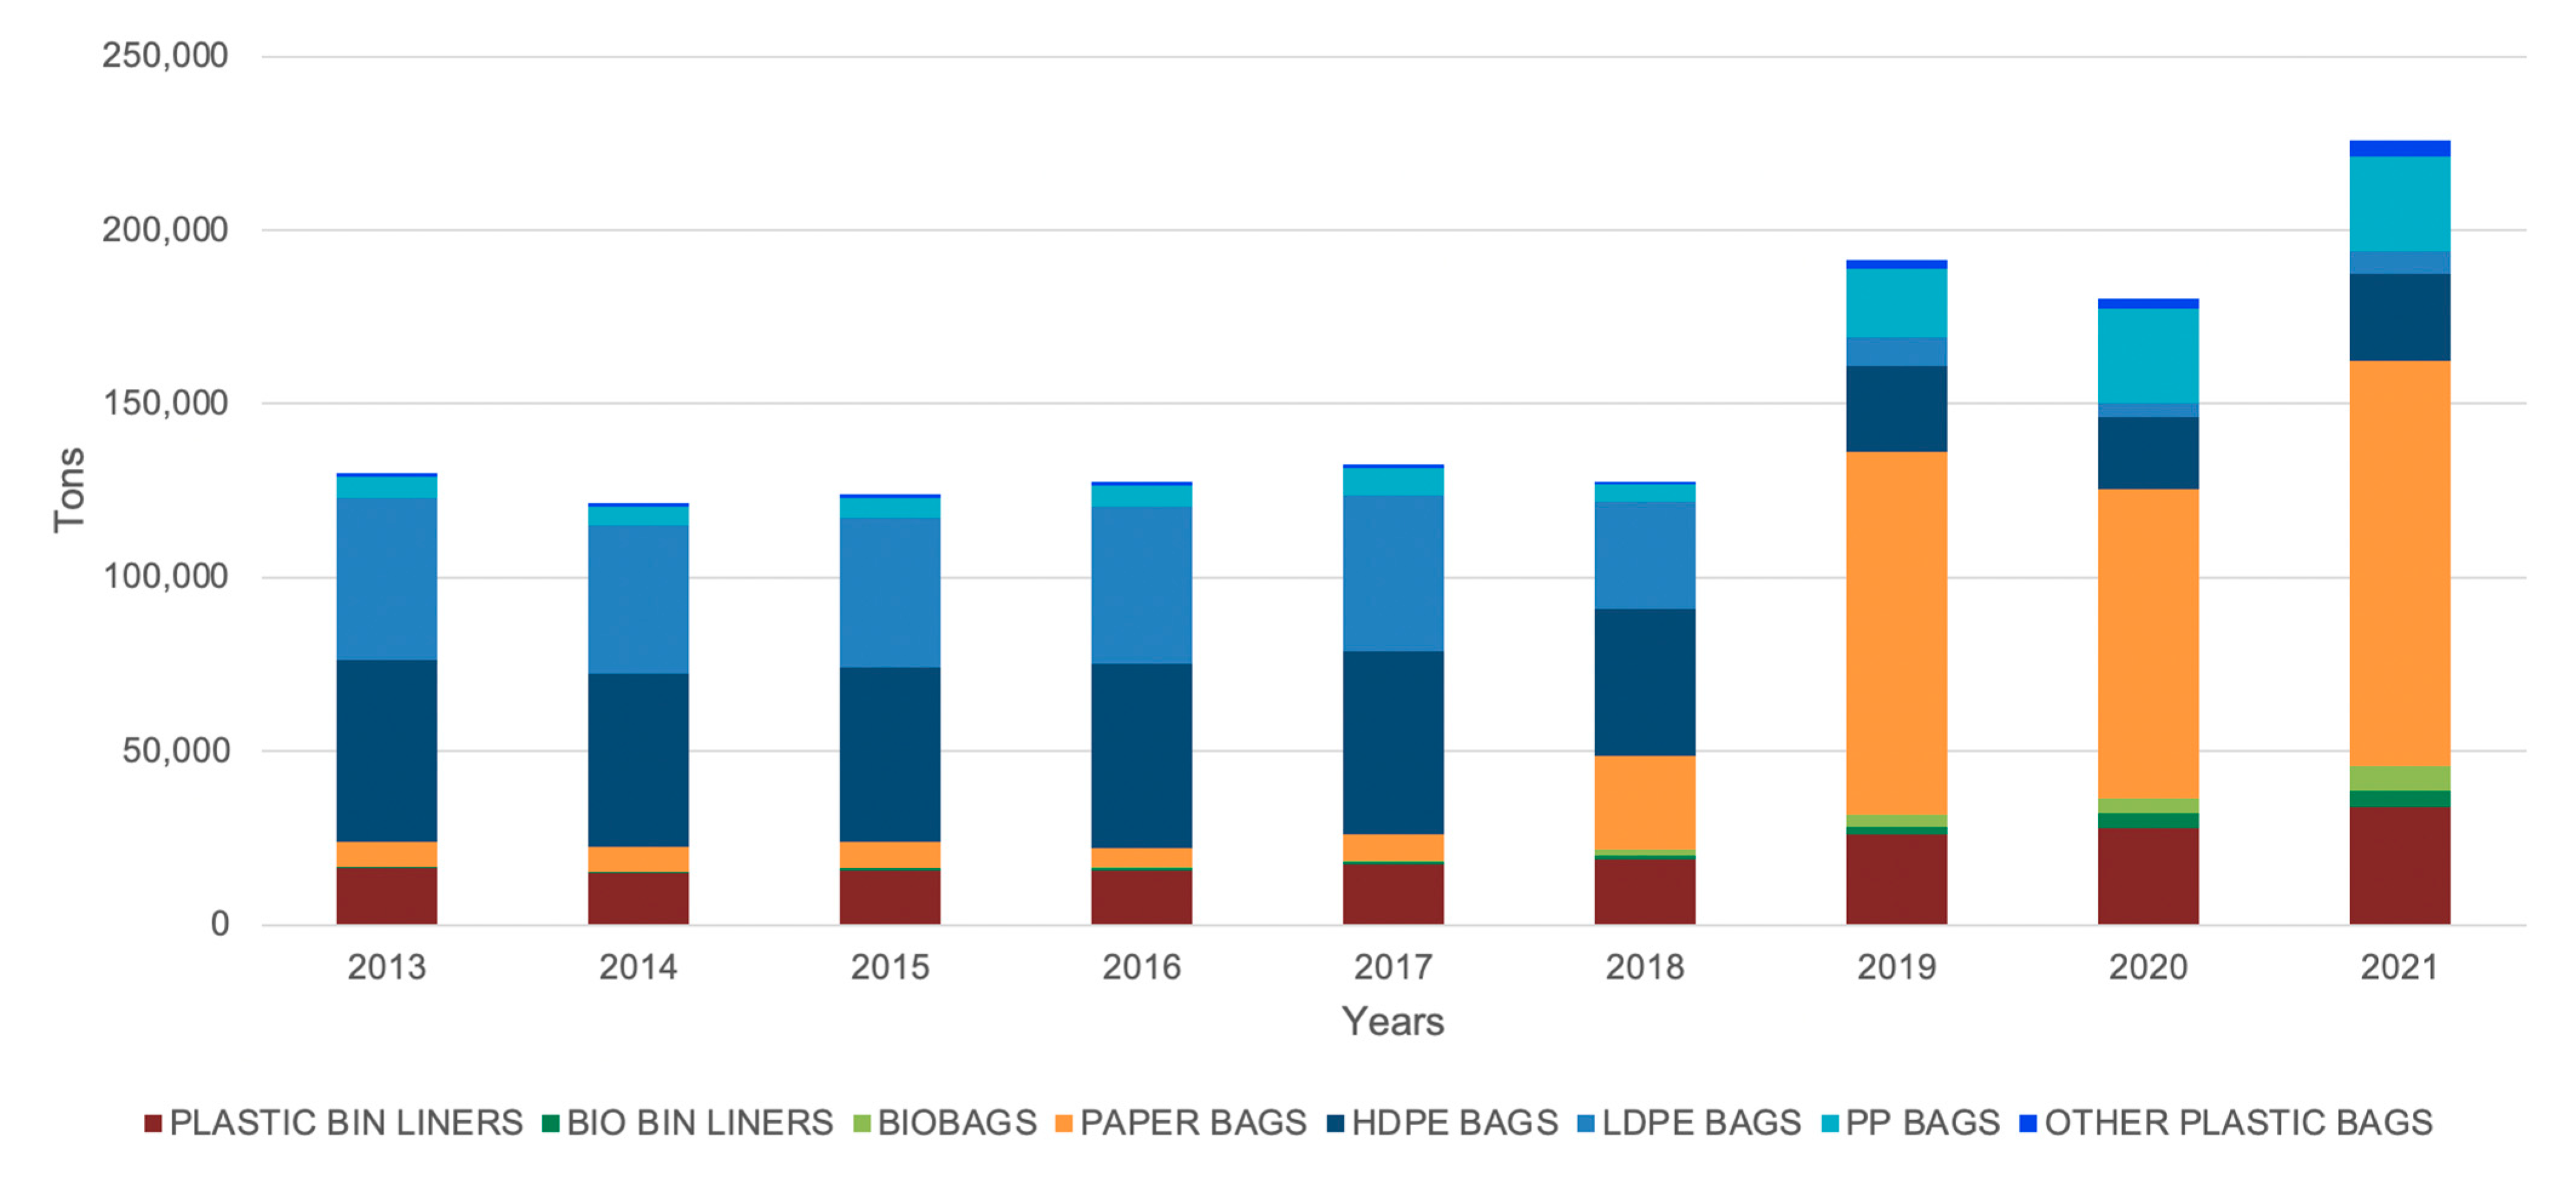
At the industry level, is striking how quickly the paper companies responded to the demand for shopping bags, as in 2019 they had to produce more bags than the sum of the four years prior to the legislation. This was only possible because Chile has a robust forestry sector that contributes about 2% of the national GDP [69], so it had the capacity to provide the raw material and technology to develop paper bags. In contrast, the plastic bag industry had no time to adapt, and the main producers went bankrupt. This is reflected in how the proportions of imported and domestically produced bags varied during the study period.
Finally, the model shows a reduction in the expected environmental impact of the bag market in almost all indicators studied. This suggests that the law is effective in protecting the environment, except for the three mentioned categories (ozone depletion, water consumption and land use). It also highlights the importance of considering potential substitutes to SUPBs in the design of the law. This is because although the number of bags used (i.e., considering bin liners) continues to increase after the law, most of the expected environmental impacts were reduced for the change in materiality in shopping bags. However, this was due to fortune rather than design, as the history of the law shows, it was an unsubstantiated assumption [70]. If Chile had had other conditions, for example high solid waste recovery rates or access to local oil, the conclusions would probably be different. Especially since SUPBs were mainly replaced by other single-use bags.

5.2. Public Policy Recommendations

The results show that banning the commercial distribution of a product can be an effective public policy to protect the environment. However, the form and context in which the ban is carried out is decisive for its success. It is crucial to take substitutes into account in the design of prohibitive public policies. It should be discussed ex-ante, which is the substitute with the lowest environmental impact and incentives should be created for the market to move towards this option. For this, it is necessary to use a rigorous methodology for measurement such as life cycle analysis, but a general rule is to move from single-use to reusable products. Additionally, it is not enough to have products that can be reused, it is necessary to have an ecosystem that allows this in practice (for example, through deposit schemes).
In the case of banning SUPBs, it is recommended that special emphasis be placed on their secondary use as bin liners. Not only because part of the demand will be shifted to garbage bags. But also, because this may impact the economy of households that will be forced to buy bags that they used to get for free. In the worst-case scenario, this could lead to an increase in the illegal disposal of waste in the environment because there is no adequate container for its deposition. Creating design guidelines for shopping bags and bin liners could help reduce the environmental impact of substitutes. For example, requiring that the product certifies that its materiality allows for its use a defined number of times or is made from a certain percentage of recycled material.
Another issue that should be considered in the design of this type of public policy is the impact they may have on industry. Evidently, one way to facilitate the transition of companies is to progressively implement the ban. However, as we have seen, speed is a factor that contributes to its success if the right conditions are in place (citizen support, effective control, and available substitutes). Therefore, the authors suggest that, given these conditions, subsidies for innovation and/or technological transformation could be created for the affected companies. Of course, this raises deeper questions that are beyond the scope of this article, such as: does the State seek to maintain the companies that produce these types of products, or to what extent should it seek to protect the national industry?

6. Conclusions

Plastic pollution is a global problem that has resulted in various public policies to address it, the most popular of which has been the banning of SUPBs. However, the effect of regulation has been heterogeneous across countries. The type of ban, citizen support and institutional conditions have been decisive in its consequences. So far, the success or failure of the policy has been evaluated based on whether or not it reduced the amount of SUPBs consumed, leaving aside the environmental impacts that substitutes might be causing. This paper addresses this gap in the literature and incorporates the analysis of the expected environmental impacts of the entire bag market. Furthermore, it is the first country-level study of the impacts of a plastic shopping bag ban in Latin America.
The finding suggests that the law is being effective in protecting the environment, despite having negative effects on land use. The amount of SUPBs consumed was reduced by 249,378 kilotons in 4 years with respect to the counterfactual scenario and positive results were achieved in fifteen of the eighteen environmental impact categories. The strictness of the law in banning all types of plastic bags and the speed of implementation were positive aspects of its design. While not considering that the end of life of the bags could be limiting its impact, both in terms of increased consumption of bin liners and the missed opportunity to move towards reusable bags.
A limitation of the study is that it was not possible to have more disaggregated data on domestic production, which prevented a detailed analysis of bag design. Therefore, it is important to keep in mind that the expected environmental impacts are modelled as if there were one bag design per category. But in reality, we know that there is a great variety in sizes, amount of recycled material, thicknesses, among others. Finally, it is important to note that this is not a rigorous causality study, but it does provide important insights into the consequences that the law could be having. Likewise, the paper evaluates the effectiveness of the law, but not its efficiency. Thus, the question of whether a ban is the best option remains open and should be addressed in future work.

Author Contributions

Conceptualization, M.F. and L.A.C.; Methodology, M.F. and L.A.C.; Formal analysis, M.F.; Investigation, M.F.; Data curation, M.F.; Writing—original draft, M.F.; Writing—review & editing, L.A.C.; Visualization, M.F.; Supervision, L.A.C. All authors have read and agreed to the published version of the manuscript.

Funding

This research received no external funding.

Institutional Review Board Statement

The study was conducted in accordance with the Declaration of Helsinki and approved by the Institutional Review Board of the School of Government and the School of Engineering of the Pontificia Universidad Católica de Chile. Date of approval: 25 January 2023. Protocol code: 30222 (School of Engineering).

Informed Consent Statement

Informed consent was obtained from all subjects involved in the study.

Data Availability Statement

Additional data to that published in the main article and appendix is unavailable due to privacy restrictions.

Conflicts of Interest

The authors declare no conflict of interest.

Appendix A. Interviewees

Table A1. Interviewees.
IdNameDescriptionDate of Interview
1Claudio MoralesFormer Managing Partner of Plásticos Mendoza6 October 2022. In person.
2Mariana SotoGeneral Manager of CENEM11 October 2022. Video call
3Augusto CubillosGeneral Manager of BioBag12 October 2022. Video call
4Franco CatergianiCo-founder and manager of Ceroplas12 October 2022. Video call
5Eliana MorenoCo-founder and Innovation and sustainability manager of Unibag13 October 2022. Video call
6Pedro LoeserGeneral Administrator of Yute Natural14 October 2022. Video call
7Magdalena BalcellsGeneral Manager of ASIPLA17 October 2022. Video call
8Guillermo GonzálezHead of the Legislative Implementation and Circular Economy Office for the period 2018–202217 October 2022. In person.
9Bárbara PeñafielProfessional Legislative Implementation and Circular Economy Office 202218 October 2022. Video call
10Stefanie Pope y Raúl CarrascoManager of Shared Value and Sustainability Walmart Chile/Manager of Environment and Risk Prevention Walmart Chile19 October 2022. Video call
11Ingrid HenríquezLawyer of the Ministry of Environment during the law drafting process. 20 October 2022. Video call
12Alejandro ChacónDirector of Ecodesign and professor at the University of Chile21 October 2022. Video call
13Viviana PintoExecutive Director of Plastic Ocean28 October 2022. Video call
14Cristóbal De La MazaFormer environmental superintendent31 October 2022. Video call
15Macarena GuajardoCo-founder and Executive Director of Fundación Basura2 November 2022. Video call

Appendix B. Composition of the Principal Plastic Shopping Bags in Chile

Table A2. Composition of an averaghere HDPE Bag in Chile.
CompoundQuantity Unit [g]
HDPE6.9
LLDPE0.89
Titanium Oxide0.16
Chalk0.81
Total7.95
Note. [71]. LLDPE: linear low-density polyethylene.
Table A3. Composition of an average LDPE Bag in Chile.
CompoundQuantity Unit [g]
LDPE32.85
LLDPE0.7
Titanium Oxide1.05
Total34.6
Note. [71]. LLDPE: linear low-density polyethylene.
Table A4. Composition of an average PP Bag in Chile.
CompoundQuantity Unit [g]
PP115.83
Total115.83
Note. [71].

Appendix C. Considered Gloses from the National Customs Service

Table A5. Considered gloses from the National Customs Service.
GloseOriginal NameTranslation
39232110De polímeros de etileno bolsasEthylene polymer bags
39232910De los demás plásticos bolsas.Of other plastic bags.
48194000Los demas sacos (bolsas), bolsitas y cucuruchosOther bags, sacks, bags and cones
48173000Cajas, bolsas y presentaciones similares, de papel o cartón, con un surtido de artículos de correspondencia.Boxes, bags and similar presentations, made of paper or cardboard, with an assortment of mailing items.
63052000Sacos (bolsas) y talegas, para envasar de algodónCotton sacks and bags, for cotton packaging
63051000Sacos (bolsas) y talegas, para envasar de yute o demas fibras textiles del.Sacks and bags, for packaging, of jute or other textile fibers of the.
Note. National Customs Service.

Appendix D. Characteristics of the LCAs Reviewed

Table A6. Characteristics of the LCAs reviewed.
IdAuthorsYearGeographical RegionLCA MethodSystem BoundariesEnd-of-Life Treatment (%)
1Hernández, C.2020ChileCML2001Cradle to the graveLandfill
2Civancik-Uslu et al.2019EspañaCML2001Cradle to the graveIncineration with energy recovery, recycling, landfilling with energy recovery from biogas
3Bisinella et al.2018DinamarcaEASETECHCradle to the graveIncineration
4COWI A/S and Utrecht University2018EuropaEASTECHCradle to the graveIncineration (39), industrial recycling/composting (30), landfill (31)
5Ahamed et al.2021SingaporeCML2001Cradle to the graveIncineration
6Askham et al.2021NoruegaReCiPe 2016Cradle to the graveIncineration, recycling
7Kimmel2014USAReCiPe 2008Cradle to the graveIncineration, landfill and recycling
8Stafford et al.2022SudáfricaReCiPe 2016Cradle to the graveOpen landfill (32), landfill (29), poor landfill (38), recycling (1)
9Pitawala et al.2022Sri LankanReCiPe 2016Cradle to the graveIncineration (50), landfill (50)
10Bienvenido et al.2015FilipinasEDIP 97 modificadoCradle to the graveLandfill, dumped in sewage, burned on site, source composting
11Edwards and Fry2011Reino UnidoCML2001Cradle to the graveLandfill, incineration, mechanical recycling, composting
12Edwards and Parker2013Reino UnidoCML2001Cradle to the graveLandfill, incineration
Source: author estimates. In descending order, the references are: [71,72,73,74,75,33,76,63,77,78,79,80].

Appendix E. Consumption of SUPBs and Substitutes with and without the Ban

Table A7. Parameters used for the design of each bag category.
CategoryMass (g)Wide (cm)Long (cm)Volumetric Capacity (L)Recycled Material (%)
Plastic bin liners5.070.090.060.0100
Bio bin liners5.070.090.070.00
Reusable biobags52.040.045.021.60
Single-use biobags8.040.050.09.00
Paper bags55.029.943.022.554.8
HDPE bags8.040.050.019.150
LDPE bags34.640.050.021.50
PP bags115.840.043.022.50
Other plastic bags66.740.043.026.885
Note. Author estimates. For the percentage of recycled material, the parameters of [63] are used directly based on the information given by interviews.
Figure A1. Consumption of SUPBs and substitutes for the period 2014–2021 (with the ban) in tons. Source: author estimates.
Sustainability 16 03690 g0a1
Figure A2. Consumption of SUPBs and substitutes for the period 2014–2021 (without the ban) in tons. Source: author estimates.
Sustainability 16 03690 g0a2

References

  1. Soares, J.; Miguel, I.; Venancio, C.; Lopes, I.; Oliveira, M. Public views on plastic pollution: Knowledge, perceived impacts, and pro-environmental behaviours. J. Hazard. Mater. 2021, 412, 125227. [Google Scholar] [CrossRef] [PubMed]
  2. Welden, N. Chapter 8—The environmental impacts of plastic pollution. In Environmental Impact, Societal Issues, Prevention, and Solutions; Academic Press: London, UK, 2020; pp. 195–222. [Google Scholar] [CrossRef]
  3. Organization for Economic Co-operation and Development [OECD]. Global Plastics Outlook: Economic Drivers, Environmental Impacts and Policy Options; OECD Publishing: Paris, France, 2022. [Google Scholar] [CrossRef]
  4. Statista. Producción de Plástico a Nivel Mundial de 1950 a 2019. 26 October 2021. Available online: https://es.statista.com/estadisticas/636183/produccion-mundial-de-plastico/ (accessed on 8 August 2023).
  5. Brooks, A.; Jambeck, J.; Mozo-Reyes, E. Plastic Waste Management and Leakage in Latin America and the Caribbean; Interamerican Development Bank: Washington, DC, USA, 2020. [Google Scholar] [CrossRef]
  6. Geyer, R.; Jambeck, J.; Lavender, K. Production, use, and fate of all plastics ever made. Sci. Adv. 2017, 3, e1700782. [Google Scholar] [CrossRef] [PubMed]
  7. Kumar, R.; Verma, A.; Shome, A.; Sinha, R.; Sinha, S.; Jha, P.K.; Kumar, R.; Kumar, P.; Shubham; Das, S.; et al. Impacts of Plastic Pollution on Ecosystem Services, Sustainable Development Goals, and Need to Focus on Circular Economy and Policy Interventions. Sustainability 2021, 13, 9963. [Google Scholar] [CrossRef]
  8. Hagberg, J. Agencing practices: A historical exploration of shopping bags. Consum. Mark. Cult. 2016, 19, 111–132. [Google Scholar] [CrossRef]
  9. Valtin-Erwin, L. A Bag for All Systems: Historicizing Shopping Bags in Eastern European Consumer Culture, 1980–2000. J. Contemp. Hist. 2022, 57, 159–177. [Google Scholar] [CrossRef]
  10. Bharadwaj, B.; Baland, J.; Nepal, M. What makes a ban on plastic bags effective? The case of Nepal. Environ. Dev. Econ. 2019, 25, 95–114. [Google Scholar] [CrossRef]
  11. Ekvall, T.; Liptow, C.; Miliutenko, S. Single-Use Plastic Bags and Their Alternatives—Recommendations from Life Cycle Assessments; United Nations Environment Programme: Nairobi, Kenya, 2020; Available online: https://www.lifecycleinitiative.org/wp-content/uploads/2020/04/Single-use-plastic-bags-and-alternatives-Recommendations-from-LCA-final.pdf (accessed on 8 August 2023).
  12. Plastic Oceans International [PlasticOceans]. Plastic Pollution Facts: “Annually, Approximately 500 Billion Plastic Bags Are Used Worldwide. More Than One Million Bags Are Used Every Minute”. 2022. Available online: https://plasticoceans.org/the-facts/ (accessed on 20 October 2023).
  13. United Nations Environmental Programme [UNEP]. Our Planet Is Chocking on Plastic. 10 September 2022. Available online: https://www.unep.org/interactives/beat-plastic-pollution/?gclid=Cj0KCQjw6_CYBhDjARIsABnuSzqhlh_j6I2eCf_MgRzAs113u3op5vqRksWKpNLm980FFtLYBAyvMB8aAqUqEALw_wcB (accessed on 20 October 2023).
  14. United Nations Environment Program [UNEP]. Single-Use Plastics: A Roadmap for Sustainability. 2018. Available online: https://wasteaid.org/single-use-plastics-a-roadmap-for-sustainability/#:~:text=The%20recent%20United%20Nations%20(UN,recycling%20of%20single%2Duse%20plastics (accessed on 20 October 2023).
  15. World Wildlife Fund [WWF]. Solving Plastic Pollution through Accountability. 2019. Available online: https://files.worldwildlife.org/wwfcmsprod/files/Publication/file/nj6fjdc35_SOLVING_PLASTIC_POLLUTION_THROUGH_ACCOUNTABILITY_ENF_SINGLE.pdf?_ga=2.79689047.217419449.1662947199-2052157299.1662947199 (accessed on 8 August 2023).
  16. Muposhi, A.; Mpinganjira, M.; Wait, M. Considerations, benefits and unintended consequences of banning plastic shopping bags for environmental sustainability: A systematic literature review. Waste Manag. Res. 2022, 40, 248–261. [Google Scholar] [CrossRef]
  17. Knoblauch, D.; Mederake, L.; Stein, U. Developing Countries in the Lead—What Drives the Diffusion of Plastic Bag Policies? Sustainability 2018, 10, 1994. [Google Scholar] [CrossRef]
  18. Clapp, J.; Swanston, L. Doing away with plastic shopping bags: International patterns of norm emergence and policy implementation. Environ. Politics 2009, 18, 315–332. [Google Scholar] [CrossRef]
  19. Pervin, I.; Rahman, S.; Nepal, M.; Haque, A.; Karim, H.; Dhakal, G. Adapting to urban flooding: A case of two cities in South Asia. Water Policy 2020, 22, 162–188. [Google Scholar] [CrossRef]
  20. Ten Brink, P.; Schweitzer, J.; Watkins, E.; Howe, M.; Plastics Marine Litter and the Circular Economy. Institute European Environmental Policy. 2016. Available online: https://ieep.eu/uploads/articles/attachments/15301621-5286-43e3-88bd-bd9a3f4b849a/IEEP_ACES_Plastics_Marine_Litter_Circular_Economy_briefing_final_April_2017.pdf?v=63664509972 (accessed on 8 August 2023).
  21. Yusuf, A.; Ampah, J.; Soudagar, M.; Veza, I.; Kingsley, U.; Afrane, S.; Jin, C.; Liu, H.; Elfasakhany, A.; Buyondo, K. Effects of hybrid nanoparticle additives in n-butanol/waste plastic oil/diesel blends on combustion, particulate and gaseous emissions from diesel engine evaluated with entropy-weighted PROMETHEE II and TOPSIS: Environmental and health risks of plastic waste. Energy Convers. Manag. 2022, 264, 115758. [Google Scholar] [CrossRef]
  22. Karasik, R.; Vegh, T.; Diana, Z.; Bering, J.; Caldas, J.; Pickle, A.; Rittschof, D.; Virdin, J. 20 Years of Government Responses to the Global Plastic Pollution Problem: The Plastics Policy Inventory; Nicholas Institute for Environmental Policy Solutions, Duke University: Durham, NC, USA, 2020. [Google Scholar]
  23. Knoblauch, D.; Mederake, L. Government policies combatting plastic pollution. Curr. Opin. Toxicol. 2021, 28, 87–96. [Google Scholar] [CrossRef]
  24. United Nations Environment Program [UNEP]. Legal Limits on Single-Use Plastics and Microplastics: A Global Review of National Laws and Regulations. 2018. Available online: https://www.unep.org/resources/publication/legal-limits-single-use-plastics-and-microplastics-global-review-national (accessed on 8 August 2023).
  25. Dan Nielsen, T.; Holmberg, K.; Stripple, J. Need a bag? A review of public policies on plastic carrier bags—Where, how and to what effect? Waste Manag. 2019, 87, 428–440. [Google Scholar] [CrossRef] [PubMed]
  26. Nwafor, N.; Walker, T. Plastic Bags Prohibition Bill: A developing story of crass legalism aiming to reduce plastic marine pollution in Nigeria. Mar. Policy 2017, 120, 104160. [Google Scholar] [CrossRef]
  27. Macintosh, A.; Simpson, A.; Neeman, T.; Dickson, K. Plastic bag bans: Lessons from the Australian Capital Territory. Resour. Conserv. Recycl. 2020, 154, 104638. [Google Scholar] [CrossRef]
  28. Xanthos, D.; Walker, T. International policies to reduce plastic marine pollution from single-use plastics (plastic bags and microbeads): A review. Mar. Pollut. Bull. 2017, 118, 17–26. [Google Scholar] [CrossRef] [PubMed]
  29. Taylor, R. Bag leakage: The effect of disposable carryout bag regulations on unregulated bags. J. Environ. Econ. Manag. 2019, 93, 254–271. [Google Scholar] [CrossRef]
  30. Ojeda, J.; Los Ganadores y Perdedores Que Dejó la Ley Que Prohibió la Entrega de Bolsas Plásticas. La Tercera. 27 July 2019. Available online: https://www.latercera.com/nacional/noticia/los-ganadores-perdedores-dejo-la-ley-prohibio-la-entrega-bolsas-plasticas/756748/ (accessed on 8 August 2023).
  31. González-Arcos, C.; Jourbert, A.; Scaraboto, D.; Guesalaga, R.; Sandberg, J. “How Do I Carry All This Now?” Understanding Consumer Resistance to Sustainability Interventions. J. Mark. 2021, 85, 44–61. [Google Scholar] [CrossRef]
  32. González, C. Ley “Chao Bolsas Plásticas”: Aciertos, Vacíos y Desafíos a dos Años de su Implementación Total. País Circular. 10 August 2022. Available online: https://www.paiscircular.cl/empresa-e-innovacion/ley-chao-bolsas-plasticas-aciertos-vacios-y-desafios-a-dos-anos-de-su-implementacion-total/ (accessed on 8 August 2023).
  33. Askham, C.; Furberg, A.; Baxter, J. Life Cycle Assessment of Plastic Bags and Other Carrying Solutions for Groceries in Norway. Norwegian Institute for Sustainability Research, Report Number: OR.45.21. 2021. Available online: https://norsus.no/wp-content/uploads/OR45_21-LCA-plastic-bags-and-other-carrying-solutions_Norway.pdf (accessed on 2 October 2023).
  34. López, I.; Serna, A. The dilemma of plastic bags and their substitutes: A review on LCA studies. Sustain. Prod. Consum. 2022, 30, 107–116. [Google Scholar] [CrossRef]
  35. Instituto Nacional de Estadísticas [INE]. Estimaciones y Proyecciones a Nivel Regional de la Población de Chile. 2019. Available online: https://www.ine.cl/docs/default-source/proyecciones-de-poblacion/publicaciones-y-anuarios/base-2017/estimaciones-y-proyecciones-2002-2035_base-2017_reg_%C3%A1rea_infograf%C3%ADa.pdf?sfvrsn=5d8b3bcc_5 (accessed on 3 November 2023).
  36. International Work Group for Indigenous Affairs [IWGIA]. (18 de Marzo de 2021). El Mundo Indígena 2021: Chile. Available online: https://iwgia.org/es/chile/4127-mi-2021-chile.html (accessed on 5 January 2024).
  37. Ministerio de Desarrollo Social y Familia [MINDES]. Pueblos Indígenas: Síntesis de Resultados. 2017. Available online: http://observatorio.ministeriodesarrollosocial.gob.cl/storage/docs/casen/2017/Casen_2017_Pueblos_Indigenas.pdf (accessed on 5 January 2024).
  38. Ministerio de Medio Ambiente [MMA]. Estrategia Nacional de Biodiversidad 2017–2030. 2018. Available online: https://mma.gob.cl/wp-content/uploads/2018/03/Estrategia_Nac_Biodiv_2017_30.pdf (accessed on 5 January 2024).
  39. Servicio Nacional de Turismo [SERNATUR]. Chile Gana un Nuevo ‘Oscar del Turismo’ Como el Mejor Destino Verde del Mundo 2022. 14 November 2022. Available online: https://www.sernatur.cl/chile-gana-un-nuevo-oscar-del-turismo-como-el-mejor-destino-verde-del-mundo-2022/ (accessed on 5 January 2024).
  40. Corporación Nacional Forestal [CONAF]. Protección SNASPE: Proteger las Áreas Silvestres Protegidas del Estado Contra el Fuego, es una Prioridad Para CONAF. 10 January 2023. Available online: https://www.conaf.cl/incendios-forestales/prevencion/proteccion-snaspe/ (accessed on 5 January 2024).
  41. Center for Climate and Resilience Research [CR2]. Hacia un Chile Resiliente Frente a Desastres: Una Oportunidad. 2016. Available online: https://www.cr2.cl/wp-content/uploads/2017/01/INFORME-DESASTRES-NATURALES.pdf (accessed on 5 January 2024).
  42. Fundación Chile [FCh]. Radiografía del Agua: Brecha y Riesgo Hídrico en Chile. 2019. Available online: https://fch.cl/wp-content/uploads/2019/05/radiografia-del-agua.pdf (accessed on 5 January 2024).
  43. Fundación Amulén. Pobres de Agua. Radiografía del Agua Rural en Chile: Visualización de un Problema Oculto. 2019. Available online: https://drive.google.com/file/d/1Bv6BoTX2xrFbp8meGFPjjigISTPPPZ-a/view (accessed on 25 January 2023).
  44. Ministerio de Medio Ambiente [MMA]. Estrategia Climática de Largo Plazo de Chile: Camino a la Carbono Neutralidad y Resiliencia a Más Tardar al 2050. 2021. Available online: https://cambioclimatico.mma.gob.cl/wp-content/uploads/2021/11/ECLP-LIVIANO.pdf (accessed on 25 January 2023).
  45. Fundación Chile [FCh]. Hoja de Ruta: Pacto Chileno de los Plásticos. Santiago. 2020. Available online: https://fch.cl/wp-content/uploads/2020/01/roadmap-pacto-chileno-de-los-plasticos.pdf (accessed on 8 August 2023).
  46. Ministerio de Medio Ambiente [MMA]. Hoja de Ruta Para un Chile Circular al 2040. 2021. Available online: https://economiacircular.mma.gob.cl/wp-content/uploads/2021/07/HOJA-DE-RUTA-PARA-UN-CHILE-CIRCULAR-AL-2040-ES-VERSION-ABREVIADA.pdf (accessed on 8 August 2023).
  47. Ministerio de Medio Ambiente [MMA]. #CHAOBOLSASPLÁSTICAS. Recuperado 25 de Septiembre, 2022, de. 10 August 2018. Available online: https://web.archive.org/web/20180810230422/http://chaobolsasplasticas.cl/en/ (accessed on 8 August 2023).
  48. Centro de Envases y Embalajes de Chile [CENEM]. Anuario Estadístico 2021; Centro de Envases y Embalajes de Chile [CENEM]: Vitacura, Chile, 2022. [Google Scholar]
  49. Centro de Envases y Embalajes de Chile [CENEM]. Anuario Estadístico 2017; Centro de Envases y Embalajes de Chile [CENEM]: Vitacura, Chile, 2018. [Google Scholar]
  50. Sercotec. Catastro Nacional de Ferias Libres. 2016. Available online: https://www.catastroferiaslibres.cl/doc/catastro_ferias.pdf (accessed on 3 November 2023).
  51. Confederación Gremial Nacional de Organización de Ferias Libres, Persas y Afines [ASOF]. Informe Estructural ENFEL. 2013. Available online: https://www.asof.cl/wordpress/wp-content/uploads/2013/04/INFORME-ESTRUCTURAL-ENFEL-2013-final-1.pdf (accessed on 3 November 2023).
  52. Estudios Urbanos UC Y Observatorio de Ciudades. Análisis de Situación de Ferias Libres en la Región Metropolitana y su Relación Con el Sistema de Transporte de Pasajeros. 2010. Available online: https://lecturasurbanas.files.wordpress.com/2011/08/ferias-uc_2010-12-03_02_informe-final.pdf (accessed on 3 November 2023).
  53. Instituto de Desarrollo Agropecuario. [INDAP]. Minagri Aboga Por Crear “Ferias Libres 2.0 Donde Todos Cumplan Con Los Protocolos Sanitarios”. 22 June 2020. Available online: http://www.indap.gob.cl/noticias/minagri-aboga-por-crear-ferias-libres-20-donde-todos-cumplan-con-los-protocolos-sanitarios (accessed on 3 November 2023).
  54. Paris. Reporte Conciencia Celeste 2018. 2019. Available online: https://www.paris.cl/on/demandware.static/-/Sites/es_CL/marketing/imagenes/conciencia-celeste/estrategia/Reporte_cceleste_2018_compressed.pdf (accessed on 10 November 2023).
  55. Instituto Nacional de Estadísticas [INE]. Crecimiento en Las Ventas de Supermercado a Precios Constantes. ISUP Base 2014. [Conjunto de Datos]. 2022. Available online: https://si3.bcentral.cl/Siete/ES/Siete/Cuadro/CAP_IND_SEC/MN_IND_SEC20/IS_COM2/IS52 (accessed on 10 November 2023).
  56. Instituto Nacional de Estadísticas [INE]. Crecimiento Sector Comercio, Bienes No Durables: IAC Base 2014. Para el Crecimiento de Los Años 2013 y 2014 se Usa IVCM Base 2013 [Conjunto de Datos]. 2022. Available online: https://si3.bcentral.cl/Siete/ES/Siete/Cuadro/CAP_IND_SEC/MN_IND_SEC20/IS_COM1/IS51 (accessed on 10 November 2023).
  57. Melo, A. Adiós al Plástico, Bienvenido el Papel y el Algodón: Las Opciones de Los Retailers Para Sus Bolsas. 13 June 2018. Available online: https://www.df.cl/tendencias/360/adios-al-plastico-bienvenido-el-papel-y-el-algodon-las-opciones-de-los (accessed on 10 November 2023).
  58. Moreno, E. Ley de Prohibición de Bolsas Plásticas en Chile: Impactos y Alternativas Disponibles. País Circular. 2018. Available online: https://www.paiscircular.cl/opinion/ley-de-prohibicion-de-bolsas-plasticas-en-chile-impactos-y-alternativas-disponibles/ (accessed on 8 August 2023).
  59. Villalobos, F.; Cómo se Puede ser Exitoso Con Bolsas Reutilizables y Reciclables en Chile. Emol. 4 June 2016. Available online: https://www.emol.com/noticias/Economia/2016/06/03/805965/emprendimiento-bolsas-reutilizables-unibag.html (accessed on 8 August 2023).
  60. ISO 14040:2006; Environmental Management—Life Cycle Assessment—Principles and Framework. International Organization for Standardization [ISO]: Geneva, Switzerland, 2006. Available online: https://www.iso.org/standard/37456.html (accessed on 3 October 2023).
  61. ISO 14044:2006; Environmental Management—Life Cycle Assessment—Requirements and Guidelines. International Organization for Standardization [ISO]: Geneva, Switzerland, 2006. Available online: https://www.iso.org/standard/38498.html#:~:text=ISO%2014044%3A2006%20specifies%20requirements,and%20critical%20review%20of%20the (accessed on 3 October 2023).
  62. United Nations Environmental Programme [UNEP] & Society of Environmental Toxicology and Chemistry [SETAC]. Global Guidance for Life Cycle Impact Assessment Indicators. Life Cycle Initiative, Volume 1. 2016. Available online: https://www.lifecycleinitiative.org/training-resources/global-guidance-lcia-indicators-v-1/ (accessed on 3 October 2023).
  63. Stafford, W.; Russo, V.; Nahman, A. A comparative cradle-to-grave life cycle assessment of single-use plastic shopping bags and various alternatives available in South Africa. Int. J. Life Cycle Assess. 2022, 27, 1213–1227. [Google Scholar] [CrossRef]
  64. Ministerio de Medio Ambiente [MMA]. Reporte del Estado del Medio Ambiente 2022. 2023. Available online: https://sinia.mma.gob.cl/estado-del-medio-ambiente/reporte-del-estado-del-medio-ambiente-2022/ (accessed on 28 March 2024).
  65. Adam, I.; Walker, T.; Bezerra, J.; Clayton, A. Policies to reduce single-use plastic marine pollution in West Africa. Mar. Policy 2020, 116, 103928. [Google Scholar] [CrossRef]
  66. Bezerra, J.; Walker, T.; Clayton, A.; Adam, I. Single-use plastic bag policies in the Southern African development community. Environ. Chall. 2021, 3, 100029. [Google Scholar] [CrossRef]
  67. Dirección de Estudios Sociales [DESUC]. Informe Final Encuesta Nacional de Medio Ambiente 2018. 2018. Available online: https://mma.gob.cl/wp-content/uploads/2018/03/Informe-Final-Encuesta-Nacional-de-Medio-Ambiente-2018.pdf (accessed on 28 March 2024).
  68. Amenábar, M.; Holzapfel, C.; Medina, N.; De Veer, D.; Gonzalez, C.; Holtmann, G.; Honorato-Zimmer, D.; Kiessling, T.; Leyton, A.; Narváez, S.; et al. The rise and demise of plastic shopping bags in Chile—Broad and informal coalition supporting ban as a first step to reduce single-use plastics. Ocean Coast. Manag. 2019, 187, 105079. [Google Scholar] [CrossRef]
  69. González, V.; Poblete, P.; Soto, D.; Gysling, J.; Kahler, C.; Pardo, E.; Bañados, J.; Baeza, D. Anuario Forestal 2022. Instituto Forestal, Ministerio de Agricultura, Chile. 2022. Available online: https://wef.infor.cl/index.php/publicaciones/boletines-estadisticos/anuario-forestal (accessed on 28 March 2024).
  70. Biblioteca del Congreso Nacional [BCN]. Historia de la Ley 21.100. Available online: https://www.bcn.cl/historiadelaley/historia-de-la-ley/vista-expandida/7567/ (accessed on 28 March 2024).
  71. Hernández, C. Influencia de la Manufactura en el Ciclo de vida de las Bolsas Plásticas en Chile. 2020. Available online: https://repositorio.uchile.cl/handle/2250/176678 (accessed on 2 October 2023).
  72. Civancik-Uslu, D.; Puig, R.; Hauschild, M.; Fullana-i-Palmer, P. Life cycle assessment of carrier bags and development of a littering indicator. Sci. Total Environ. 2019, 685, 621–630. [Google Scholar] [CrossRef] [PubMed]
  73. Bisinella, V.; Albizzati, P.F.; Astrup, T.F.; Damgaard, A. (Eds.) Life Cycle Assessment of grocery carrier bags. Danish Environmental Protection Agency. Miljoeprojekter No. 1985. 2018. Available online: https://www2.mst.dk/Udgiv/publications/2018/02/978-87-93614-73-4.pdf (accessed on 2 October 2023).
  74. COWI A/S and Utrecht University. Environmental Impact Assessments of Innovative Bio-Based Product; Publications Office of the European Union: Luxembourg, 2018. [Google Scholar] [CrossRef]
  75. Ahamed, A.; Vallam, P.; Shiva Iyer, N.; Veksha, A.; Bobacka, J.; Lisak, G. Life cycle assessment of plastic grocery bags and their alternatives in cities with confined waste management structure: A Singapore case study. J. Clean. Prod. 2021, 278, 123956. [Google Scholar] [CrossRef]
  76. Kimmel, R. Life Cycle Assessment of Grocery Bags in Common Use in the United States. Environ. Stud. 2014, 6. Available online: https://tigerprints.clemson.edu/cudp_environment/6 (accessed on 2 October 2023).
  77. Pitawala, P.; Danthurebandara, M.; Rajapaksha, L. Life cycle assessment of paper and plastic grocery bags used in Sri Lankan supermarkets. Int. J. Environ. Sci. Technol. 2022, 19, 11183–11198. [Google Scholar] [CrossRef]
  78. Bienvenido, J.; Ubando, A.; Gonzaga, J.; Claire, H. A Comparative Life Cycle Analysis of Plastic and Paper Packaging Bags. In Proceedings of the Philippines 8th IEEE International Conference Humanoid, Nanotechnology, Information Technology Communication and Control, Environment and Management (HNICEM), Cebu City, Philippines, 9–12 December 2015. [Google Scholar]
  79. Edwards, C.; Fry, J. Evidence: Life Cycle Assessment of Supermarket Carrier Bags: A Review of the Bags Available in 2006; Environment Agency: Bristol, UK, 2011; ISBN 978-1-84911-226-0. [Google Scholar]
  80. Edwards, C.; Parker, G. A Life Cycle Assessment of Oxo-biodegradable, Compostable and Conventional Bags. 2012. Available online: https://www.biodeg.org/wp-content/uploads/2020/09/intertek-final-report-15.5.121.pdf (accessed on 2 October 2023).
Figure 1. Theoretical model of the expected environmental impact of the law. Source: authors.
Sustainability 16 03690 g001
Figure 2. Consumption of SUPBs and substitutes for the period 2014–2021 (with the ban). Source: author estimates.
Sustainability 16 03690 g002
Figure 3. Share of net imports and total consumption for the period 2014–2021 (with the ban). Source: author estimates.
Sustainability 16 03690 g003
Figure 4. Share of reusable, biodegradable and recycled plastic bags for net imports in the period 2014–2021 (with the ban). Source: author estimates.
Sustainability 16 03690 g004
Figure 5. Expected environmental impacts of bag consumption in the period 2014–2021 with (orange line) and without (blue line) the ban. The dotted line corresponds to the year in which the ban was implemented. Source: author estimates.
Sustainability 16 03690 g005
Table 1. Consumption of bags by type for the period 2014–2021 (in million units).
20142015201620172018201920202021
Bin liners
Plastic29703145314834693802522655906798
Bio97117140168202413812884
Shopping bags
Bio13152832187402509803
Paper12913299140489189716122123
HDPE62476341668966365342311326513136
LDPE1232124112981295891236113192
PP4851546643172233235
Other plastic1415171613394871
Total10,75011,05711,47211,82110,96811,49811,56914,242
Note. authors estimates.
Disclaimer/Publisher’s Note: The statements, opinions and data contained in all publications are solely those of the individual author(s) and contributor(s) and not of MDPI and/or the editor(s). MDPI and/or the editor(s) disclaim responsibility for any injury to people or property resulting from any ideas, methods, instructions or products referred to in the content.

