Abstract
Against the backdrop of global carbon reduction, China, as the country with the highest carbon emissions, must implement carbon reduction actions more efficiently to promote the sustainable development of the global environment. Balancing their economic and environmental benefits has become an important issue for corporations, as they are crucial entities in the final implementation of carbon reduction efforts. This study selects the data of listed companies in China from 2012 to 2022 and develops a two-way fixed-effects model to verify the effect of digital transformation on corporate carbon reduction performance. The study found that digital transformation can positively promote corporate carbon reduction performance and shows heterogeneity under different conditions. Green technology innovation plays a mediating role in the relationship between digital transformation and corporate carbon reduction performance. Furthermore, environmental subsidies play a positive moderating role in the relationship between digital transformation and green technology innovation, constituting a moderated mediation model. Meanwhile, tax reduction incentives play a positive moderating role in the relationship between digital transformation and promoting corporate carbon reduction performance. This study provides empirical suggestions for balancing economic and environmental benefits for 5323 Chinese listed companies and global corporations from both internal and external perspectives, emphasizing the potential for digital transformation to drive both commercial success and environmental stewardship in the pursuit of sustainable development goals.
1. Introduction
Carbon emission reduction, as a necessary theme, is crucial for promoting environmental sustainability. In most developing countries, energy production has long been dominant and constitutes the primary source of global carbon emissions [1]. Being the largest developing country, China attaches great significance to carbon emission reduction for fostering green and sustainable economic and social development. National targets require action from micro-level entities. Listed companies, key economic players, pursue profits while reducing carbon emissions. The “Carbon Emission Ranking of Listed Companies in China (2023)” reported that the carbon dioxide emissions of 100 listed companies in China amounted to 5.046 billion tons in 2022, representing 44% of the nation’s total carbon dioxide emissions. Corporate carbon emission reduction holds significant importance for China’s overall achievement of carbon emission reduction goals. Amidst volatile business environments, balancing carbon emission reduction with economic stability is crucial. Digital transformation’s link to carbon emission reduction is vital, aligning with global carbon emission reduction objectives. Artificial intelligence (AI), as a part of digital technology, aids in solving complex carbon emission reduction challenges. AI optimizes processes, offering innovative solutions. Integrating AI in carbon emission reduction enhances strategy effectiveness, maintaining economic viability. Hence, exploring the mechanisms and pathways between digital transformation and carbon emission reduction performance is imperative. This initiative aligns with the global context of carbon emission reduction.
This study mainly focuses on the following issues to carry out empirical research:
- Can digital transformation positively enhance corporate carbon emission reduction performance? Are there heterogeneous results under different conditions?
- How does digital transformation influence corporate carbon emission reduction performance? Is there mediation or moderation?
- If present, what are the mechanisms of mediation or moderation? Are they positive or negative?
The rest of the paper is organized as follows:
Section 2 introduces recent research progress on the involved variables; Section 3 presents the theoretical framework and hypotheses; Section 4 conducts variable measurement and theoretical modeling; Section 5 presents study results; further heterogeneity analysis is discussed in Section 6; and Section 7 provides research conclusions, recommendations, and explorations.
2. Literature Review
2.1. Corporate Carbon Emission Reduction Performance
Since the Paris Agreement in 2016, scholars have extensively researched macro-level carbon emission reduction. However, fewer studies have delved into corporate-level carbon emission reduction performance. Carbon emission reduction performance, as a key aspect of environmental performance, is used to measure the effectiveness of input and output of carbon dioxide-related activities in corporations, which can reflect the efforts made by corporations in carbon reduction. Existing research primarily examines influencing factors. Externally, government oversight [2], stakeholder influence [3], regional market orientation [4], and carbon emissions trading [5] significantly affect corporate carbon emission reduction performance. Internally, factors such as traditional energy consumption [6], board characteristics [7], and carbon disclosure [8] also play a role. Thus, both internal and external factors influence corporate carbon emission reduction performance, necessitating further exploration of their mechanisms.
2.2. Digital Transformation
Digital transformation is the use of digital technology by companies to drive change and promote business growth. It has been a research hotspot in recent years, and its research direction can be roughly divided into impact factor research, path research, and impact role research. In terms of impact research, digital transformation can play an important role in cost reduction and efficiency improvement [9], governance capacity [10], financial performance [11], and technology capability [12]. It can also bring non-economic benefits to corporations in terms of social responsibility [13], Environmental, Social and Governance performance [14], and environmental governance [15]. Based on this, the impact of digital transformation has a wide range of roles, while there is still a gap in the study of its impact on carbon emission reduction, which can be further explored.
2.3. Green Technology Innovation
Green technology innovation refers to technological advancements specifically geared towards environmental preservation. Current research on corporate green technology innovation primarily concentrates on investigating the influencing factors and economic ramifications of such innovation. Concerning influencing factors, scholars contend that corporate governance [16], technological capability [17], science and technology financing [18], and policy regulations [19] significantly influence corporate green technology innovation. It is imperative to recognize that technological profitability is pivotal for the sustainable advancement of technology, as investors’ primary objective is fund recovery. Consequently, technological profitability emerges as a paramount influencing factor for green technology innovation. Regarding economic consequences, green technology innovation is perceived to impact corporate profitability [20], total factor productivity [21], financial performance [22], and industrial–organizational upgrading [23]. Consequently, there is a need to investigate the mechanism of green technology innovation concerning digital transformation and the carbon emission reduction performance of corporations, given the nature of influencing factors and economic ramifications associated with such innovation.
In summary, while there is existing research on digital transformation, green technology innovation, and carbon emission reduction performance individually, few studies have integrated these elements into a single framework for corporate-level research with tested theoretical mechanisms. This paper addresses this gap by considering green technology innovation as a mediator variable. It analyzes how digital transformation impacts corporate carbon emission reduction performance and further examines how this impact varies based on different corporate characteristics. This research aims to provide valuable insights for corporations seeking to reduce their carbon emissions.
3. Theoretical Framework and Research Hypotheses
3.1. Impact of Digital Transformation on Corporate Carbon Emission Reduction Performance
The impact of digital transformation on corporate carbon emission reduction performance manifests in several key areas, as follows: (1) digital transformation integrates internal corporate resources, reduces strategic adjustment time, minimizes resource redundancy and waste, optimizes management and production methods, lowers overall carbon emissions, and enhances carbon emission reduction performance; (2) it fosters information transparency among stakeholders, strengthens stakeholder relationships, reinforces corporate environmental monitoring, and drives corporate responses to stakeholder demands for environmental responsibility through carbon emission reduction; and (3) digital transformation facilitates the dissemination and accessibility of low-carbon environmental knowledge, thereby enhancing awareness of carbon emission reduction and corporate performance in this regard. Based on this analysis, we propose the following hypothesis:
Hypothesis 1 (H1).
Digital transformation can positively contribute to corporate carbon reduction performance improvement.
3.2. The Mediating Role of Green Technology Innovation
Green technology innovation, facilitated by digital transformation, enhances carbon emission reduction performance in the following two main ways: (1) digitization streamlines resource acquisition and utilization, bolstering efficiency and enabling green technology innovation. This innovation fosters the substitution of fossil fuels with clean energy, reducing carbon emissions and improving emission reduction performance; (2) in terms of costs, corporate investment in green technology innovation typically entails significant expenses over a prolonged period. Digital transformation supports resource consolidation and knowledge dissemination, enhancing corporations’ capacity to leverage internal and external information, thereby enhancing the efficiency of green technology innovation while reducing costs. Lower input costs facilitate the systematic advancement of green technology innovation, enabling corporations to optimize production processes, adopt cleaner production methods, and reduce pollution emissions, consequently enhancing carbon emission reduction performance. Thus, the following hypothesis is proposed:
Hypothesis 2 (H2).
Green technology innovation mediates the relationship between digital transformation and corporate carbon emission reduction performance.
3.3. Moderating Effect of Tax Reduction Incentives
Tax reduction incentives encompass alterations in tax regulations and systems, including adjustments to tax rates, the elimination of tax categories, and narrowing the scope of taxation, with the aim of mitigating the tax burden on taxpayers. From an expenditure perspective, tax reduction incentives alleviate the financial burden of corporate taxation, thereby facilitating funding for corporate digital transformation initiatives. This, in turn, fosters an elevation in corporate digitization levels, consequently enhancing corporate performance in reducing carbon emissions. From a revenue standpoint, corporations will prioritize enhancing their production processes to capitalize on tax incentives and advancing sewage technology through the adoption of low-carbon equipment and optimization of resource allocation. This, in turn, will result in improved performance in reducing carbon emissions [24]. Based on the aforementioned, the following hypothesis is proposed:
Hypothesis 3 (H3).
Tax reduction incentives play a positive moderating role in the relationship between digital transformation and corporate carbon emission reduction performance.
3.4. Moderating Effect of Environmental Subsidies on Green Technology Innovation
The advancement of corporate green technology is primarily hindered by a lack of awareness and funding. (1) Environmental subsidies can act as incentive signals for corporations, encouraging them to cultivate a green development mindset and subsequently increase investments in green technology innovation, thereby enhancing the level of corporate green technology innovation. (2) Environmental subsidies offer direct financial support to corporations for green technology innovation activities, alleviating resource constraints and reducing capital costs associated with such initiatives, thereby allowing corporations to allocate more resources to green technology innovation. Based on the aforementioned points, the following hypotheses are proposed:
Hypothesis 4 (H4).
Environmental subsidies play a positive moderating role in the relationship between digital transformation and green technology innovation.
Through the above analysis, to more intuitively reflect the research ideas of this paper and the relationship between variables, the theoretical model is constructed, as shown in Figure 1.
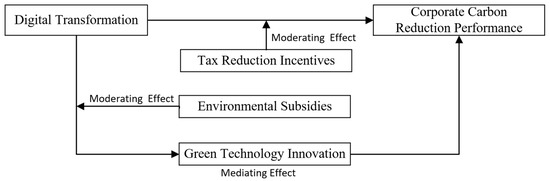
Figure 1.
The theoretical model.
4. Empirical Analysis and Results
4.1. Sample Selection and Data Sources
In this paper, we select the data of China’s listed companies from 2012–2022 and screen the sample of selected firms using the following steps: (1) excluding firms labeled with ST (Special Treatmentspecial treatment), *ST, and PT (Particular Transferparticular transfer) during the observation period; (2) excluding firms listed or delisted during the observation period; and (3) excluding firms with missing data. Finally, we obtained 3239 sample firms with a total of 22,943 observation records. Among them, the green patent application data are from the China Research Data Service Platform, and all other data are from annual reports of listed companies and the China Stock Market & Accounting Research Database. To reduce the interference of extreme values on the research results, the continuous variables involved in this paper are all subjected to 1–99% Winsorize treatment. Data processing mainly utilizes Python and Stata17.0 software.
4.2. Definition of Variables
4.2.1. Carbon Emission Reduction Performance
Based on the theoretical framework established in the previous paper and drawing on Clarkson’s approach to environmental performance measurement, this study utilizes the methodology proposed by Wang Hao et al. (2022) [25] for calculating the total carbon emissions of listed companies. When companies directly disclose their annual direct carbon emissions, indirect carbon emissions, or total carbon emissions, the data provided in their reports are utilized and standardized to a common unit.
For corporations that do not provide direct carbon emissions data, an alternative method is employed. Carbon emissions are estimated by aggregating data on various forms of fossil energy consumption, electricity consumption, and heat consumption. These different sources of emissions are standardized to a common unit using conversion factors specified in Table 1.

Table 1.
Energy conversion factors for standard coal and carbon emission factors.
The specific calculation process involves the following steps:
- (1)
- Identifying and collecting data on fossil energy consumption, electricity consumption, and heat consumption for corporations that do not disclose direct carbon emissions.
- (2)
- Applying the appropriate conversion factors from Table 1 to standardize these different forms of consumption into a common unit, typically carbon emissions equivalent.
- (3)
- Summing up the standardized values to estimate the total carbon emissions for each corporation.
The formula used for calculating the carbon emissions of listed companies is as follows:
Carbon emissions of listed companies = combustion and energy fuel emissions + production process emissions + waste emissions + emissions due to land use change (forest to industrial land).
Furthermore, to assess corporate carbon emission reduction performance, the study refers to the research of Yan Huahong et al. (2019) [26]. The ratio of corporate operating income to corporate carbon emissions is employed as a measure. A higher value of this variable indicates a better carbon emission reduction performance of the corporation. The specific calculation process is as follows:
Corporate carbon emission reduction performance = Ln (corporate operating income/corporate carbon emissions).
This methodology ensures consistency in the assessment of carbon emissions and carbon emission reduction performance across all listed companies, thereby facilitating meaningful comparisons and analysis.
4.2.2. Digital Transformation
Based on existing research findings, this paper employs the text analysis method to quantify the level of corporate digital transformation and establishes explanatory variables using keywords associated with “digitalization” in the annual reports of listed companies. Drawing on Wu Fei’s work (2021) [27], the study analyzes word frequencies across five dimensions: artificial intelligence technology, blockchain technology, cloud computing technology, big data technology, and the application of digital technology. Subsequently, a corporate digitalization term dictionary (as shown in Table 2) comprising 76-word frequencies is compiled, to quantify the extent of corporate digital transformation. Considering the skewed distribution of word frequencies, the paper aggregates digitized word frequencies and applies logarithmic processing for analysis.
Table 2.
Dictionary of corporate digitization terms.
4.2.3. Green Technology Innovation (EnvrPat)
This paper draws upon Wang Xin and Wang Ying’s (2020) [28] aggregation of green invention patent applications and green utility model patent applications to measure corporate green technology innovation. Green patents most intuitively reflect corporate green technology innovation output and are quantifiable. Patents have a clear technological classification, allowing for further categorization based on different technological properties compared to research and development (R&D) inputs. Furthermore, patents often represent innovations already integrated into corporate operations at the time of application, thus providing a more accurate measure of green technology innovation.
4.2.4. Tax Reduction Incentives
This paper adopts Liu Guangqiang’s (2016) [29] methodology to ascertain the value of tax reduction incentives based on the specific segment of the fiscal operation process where firms receive incentives. The extent of corporate tax reduction incentives is gauged by the ratio of total tax refunds received by corporations to the aggregate of taxes paid. Tax refunds include reimbursements for various taxes and fees like value-added tax, income tax, consumption tax, and education tax surcharge. Taxes paid encompass current-period taxes and fees, as well as those paid in advance and for preceding periods.
4.2.5. Environmental Subsidy (Subsidy)
This paper builds upon the work of Bo Cheng and Yuxi Fang (2021) [30], employing the ratio of government environmental subsidies to corporate total assets as an indicator of the extent of government-provided environmental subsidies. This ratio is computed by dividing the amount of government environmental subsidies received by the corporation by its total assets for the current year, multiplied by 100.
4.2.6. Control Variables
In line with prior research, corporate carbon emission reduction performance may be influenced by various marketing factors. To ensure the accuracy and rigor of the regression analysis, this paper incorporates the following five control variables: corporation size (Size), debt asset ratio (LEV), return on assets (ROA), number of years listed (ListAge), and return on equity (ROE).
The variables are defined as shown in Table 3.
Table 3.
Variable definitions.
4.3. Regression Models
4.3.1. Benchmark Modeling
To investigate the positive relationship between digital transformation and corporate carbon emission reduction performance, we construct an econometric model, as follows:
where i and t represent firms and years, respectively; α represents the parameter to be estimated; signifies the firm fixed effect; and indicates the year fixed effect. CV denotes the control variable, and ε represents the random perturbation term.
4.3.2. Mediating Effects Model
Through theoretical analysis, it is known that the mechanism through which digital transformation enhances corporate carbon emission reduction performance may involve green technology innovation. Following Wen Zhonglin’s (2004) [31] method, we verify the mediating effect through a stepwise regression coefficient test. The model is structured as follows:
Combining the regression results of the above three models, the sign and significance of the estimated coefficients α1, β1, θ1, and θ2 are used to determine whether there is a mediating effect or not.
4.3.3. Moderating Effects Model
To verify the moderating effect of the tax reduction incentive, we introduce the cross-multiplier terms of digital transformation and tax reduction incentives. If both coefficient in the baseline model and coefficient in Equation (4) are significant and share the same sign, it indicates an enhanced moderating effect. Conversely, if they are significant with opposite signs, it denotes a disruptive moderating effect. When both coefficients are significant and positive, it suggests that green technology innovation can enhance the positive impact of carbon performance on financial performance.
4.3.4. Moderated Mediation Effects Model
To verify the moderating role of environmental subsidy (Subsidy) in the relationship between digital transformation for green technology innovation, the cross-multiplier term of green technology innovation and environmental subsidy is introduced. By estimating the coefficient in Equation (2) and the coefficient in Equation (5) sign and significance of the coefficients in Equation (2), we can determine whether there is a moderating effect.
5. Results
5.1. Descriptive Statistics
As depicted in Table 4, the corporate carbon emission reduction performance varies significantly, ranging from 5.887388 to 21.09832. The standard deviation of the digital transformation level is considerable at 1.385933, with an average of only 1.25785, indicating an overall low level. Green technology innovation ranges from 0 to 7.158514, with fewer evident overall differences but significant individual variations. Consequently, further analysis is necessary to determine whether differences exist in the relationship between digital transformation and carbon emission reduction performance under various green technology innovation backgrounds, and how the level of green technology innovation influences digital transformation and carbon emission reduction performance.
Table 4.
Descriptive statistics.
5.2. Multicollinearity Test
5.2.1. Correlation Analysis
The initial correlation analysis, as presented in Table 5, indicates that digital transformation, green technology innovation, and tax reduction incentives positively contribute to enhancing corporate carbon emission reduction performance. The correlation coefficients are significant, although their absolute values are less than 0.7, suggesting no severe multicollinearity at this stage. Nevertheless, conducting further empirical tests would be beneficial to obtain more precise and comprehensive results.
Table 5.
Results of correlation analysis.
5.2.2. Variance Inflation Factor Analysis
The introduction of control variables can indeed introduce multicollinearity concerns. To address this, the variance inflation factor (VIF) test was employed to assess the reasonableness of the research design. As depicted in Table 6, the VIF values for the explanatory variables are well below 10, with the maximum reaching 1.53. Therefore, it is concluded that multicollinearity is not a significant issue in this study.
Table 6.
VIF analysis.
Based on the correlation coefficient and VIF results, it seems that multicollinearity is not a concern, allowing for a regression analysis to be conducted confidently.
5.3. Regression Analysis
Before performing a regression analysis, the appropriate type of model should be determined by advanced F-test, Lagrange multiplier (LM) -test, and Hausman test.
- (1)
- The F-test suggests that the fixed effects (FE) model is superior to the mixed cross-sectional effects model, with a significant probability value (Prob > F = 0.000).
- (2)
- The LM test indicates that the random effects (RE) model is preferable to the mixed cross-sectional effects model, also with a significant probability value (Prob > chibar2 = 0.0000).
- (3)
- Hausman’s test shows that the fixed effects model is superior to the random effects model, with a significant probability value (Prob > chi2 = 0.0000).
Considering the outcomes of these tests collectively, the two-way fixed effects model (FE) is selected as the most appropriate model for regression analysis in this context.
5.3.1. Baseline Regression
The regression analysis results presented in Table 7 reveal the following:
Table 7.
Benchmark regression and robustness test results.
Firstly, in Model 1, where only digital transformation (DCG) is utilized as an explanatory variable without any control variables, the regression coefficient with carbon emission reduction performance (CP) is 0.638. This coefficient is statistically significant at the 1% level, indicating a positive relationship between digital transformation and corporate carbon emission reduction performance.
Secondly, in Model 2, control variables are introduced alongside digital transformation. Despite this addition, the regression coefficient for digital transformation remains notably positive at 0.603 and remains statistically significant at the 1% level. This suggests that, even after controlling for other factors, digital transformation continues to exert a significant positive influence on corporate carbon emission reduction performance.
These results provide preliminary support for Hypothesis 1, indicating that digital transformation indeed plays a significant role in promoting corporate carbon emission reduction performance.
5.3.2. Robustness Test
① Transform digital transformation measurement methodology
The methodology employed to measure the digitalization level of corporations seems robust and precise, utilizing Zhang Yongkun’s approach (2021) [32]. This method involves calculating the ratio of digital transformation-related intangible assets to total intangible assets based on the financial reports of listed companies. Specifically, assets such as “software”, “network”, “client”, “management system”, and “intelligent platform”, along with relevant patents, are identified as “digitization technology intangible assets”. The proportion of these assets to total intangible assets is then calculated, providing a proxy variable for the degree of corporate digital transformation.
By implementing this methodology and reexamining the impact of digital transformation on corporate carbon emission reduction performance in Model 3 of Table 7, the results continue to demonstrate significantly positive regression coefficients for digital transformation. This consistency with previous findings strengthens the robustness of the conclusions drawn regarding the positive correlation between digital transformation and corporate carbon emission reduction performance.
② Endogeneity test
Controlling for endogeneity is crucial in regression analysis to ensure the robustness of the findings. In this study, the endogeneity issue is addressed by introducing the one-period lag term of the explanatory variables into the regression model. This approach helps control for potential dynamic effects within the model.
Upon the implementation of this method, the estimated coefficients of the first-order lag term of carbon emission reduction performance (L.CP) are found to be statistically significant at the 1% level. This indicates that the lagged values of carbon emission reduction performance have a significant influence on the current performance, thus providing support for the robustness of the conclusions.
For further details and a comprehensive understanding of the results, refer to Table 7, Model 4, where the detailed regression analysis outcomes are presented.
5.3.3. Mediating Effects
To test Hypothesis 2, which examines the role of green technology innovation (EnvrPat) as a mediator, regression analyses are conducted, and the results are presented in Table 8, Models 2 and 3.
Table 8.
Mediated effects regression results.
In Model 2, the regression coefficient of digital transformation on green technology innovation is found to be significantly positive at the 1% level. This suggests that digital transformation effectively promotes the development of green technology innovation within corporations.
Moving to Model 3, the regression coefficient of green technology innovation on carbon emission reduction performance is also significantly positive at the 1% level. Furthermore, compared to the baseline regression results, the regression coefficient of digital transformation on carbon emission reduction performance is reduced. This reduction indicates that a portion of the effect of digital transformation on carbon emission reduction performance is mediated by green technology innovation. Hypothesis 2 is verified.
5.3.4. Moderating Effect
To test the moderating effect of tax reduction incentives (TRI) and make the model more explanatory, tax reduction incentives and digital transformation are first centered and cross-multiplier terms are constructed.
Table 9 presents the results of the benchmark model after centering, along with the outcomes of incorporating the moderating effect. Upon adding the interaction term, it is observed that the coefficient of the cross-multiplier term involving digital transformation and tax reduction incentives is significantly positive at the 1% level, alongside a positive main effect.
Table 9.
Moderated effects regression results.
This finding suggests that the moderating variable, tax reduction incentives, significantly strengthens the relationship between digital transformation and carbon emission reduction performance. Tax reduction incentives play a positive moderating role in enhancing the impact of digital transformation on promoting corporate carbon emission reduction performance. Hypothesis 3 is verified.
5.3.5. Moderated Mediation Effects
To construct a regulated mediation effect model, based on verifying that green technology innovation plays a mediation effect in the positive impact of digital transformation on the carbon emission reduction performance of corporations, it is also necessary to verify that environmental subsidies play a moderating effect in the relationship between digital transformation and green technology innovation, thus constituting a moderated mediator effect.
To test the moderating effect of environmental subsidies (Subsidy) and make the model more explanatory, it is necessary to center the environmental subsidies and construct their cross-multipliers with the centered digital transformation variables.
Table 10 shows the results after model centering and the results of the mediation effect, from the results, it can be seen that, when adding the interaction term, the coefficient of the cross-multiplier term of digital transformation and environmental subsidies is significantly positive at the 5% level, and the main effect is positively correlated. This indicates that the moderating variable, environmental subsidy, significantly enhances the relationship between digital transformation and green technology innovation; environmental subsidy also plays a positive moderating role in the relationship between digital transformation and green technology innovation, which, when combined with the results of the mediation effect test, constitutes a mediation model with moderation, and Hypothesis 3 is verified.
Table 10.
Moderated mediation effects regression results.
6. Further Analysis
6.1. Fixed Effects Panel Quantile Regression
Considering that mean regression cannot fully capture the conditional distribution, whereas quantile regression can observe the tails of the dependent variable more accurately, this paper investigates the impact of digital transformation on the conditional distribution of corporate carbon emission reduction performance. Three quantile points at 0.25, 0.50, and 0.75 classify corporate carbon emission reduction performance into high, medium, and low levels. Quantile regression, performed on model (1), explores this impact among corporations with different performance levels. Previous studies relied on panel data and fixed-effects models; thus, the panel quantile regression model with fixed effects is utilized here to account for cross-section dependence and slope non-homogeneity. The regression results are presented in Table 11.
Table 11.
Fixed effects panel quantile regression test results.
Figure 2 illustrates the fluctuations in the estimated digital transformation (DCG) coefficients across quartiles. The horizontal axis represents quartiles, while the vertical axis represents regression coefficients. Shaded areas depict the 95% confidence intervals for the quartiles, and dashed areas represent the 95% confidence intervals for the ordinary least squares regression. Shaded areas indicate 95% confidence intervals for the regression curves, solid lines indicate coefficients for the linear regression curves, and dotted lines indicate confidence intervals for the linear regression curves.
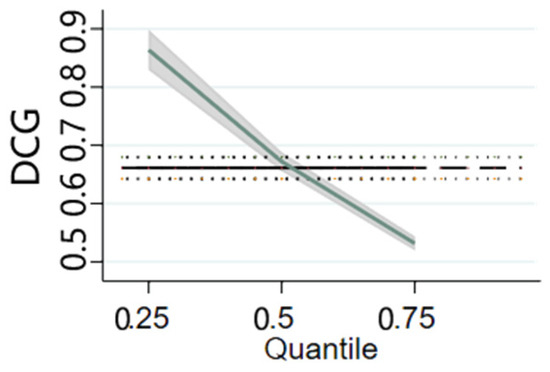
Figure 2.
Quantile regression coefficients.
According to the empirical test results, the regression coefficient of digital transformation on corporate carbon emission reduction performance is significantly positive at the 1% confidence level, irrespective of the level of carbon emission reduction performance of the corporations, whether high, medium, or low. As the carbon emission quartile increases from 0.25 to 0.5 to 0.75, the regression coefficient of digital transformation decreases from 0.825 to 0.523. This suggests that the influence of digital transformation on carbon emission reduction performance diminishes as the level of carbon emission reduction performance increases. In other words, corporations with lower carbon emission reduction performances are more profoundly impacted by digital transformation, compared to those with higher performance levels. This could be attributed to the fact that corporations with lower carbon emission reduction performances typically exhibit lower levels of digitization. In such instances, the enhancement in carbon emission reduction performance due to digital transformation is more noticeable. Conversely, corporations with higher carbon emission reduction performances tend to have higher levels of digitization, resulting in a relatively lower impact on performance enhancement. This phenomenon suggests the presence of a marginal diminishing effect.
6.2. Tests for Regional Heterogeneity
The percentage of corporations undergoing digital transformation in the central, western, and northeastern regions of China is notably lower than in the eastern region [33]. Taking into account the regional disparities in corporate digital transformation, we refer to Shen Xiaobo et al.’s (2021) [34] study, and categorize corporations into sample groups, eastern, central, and western, to conduct a regional heterogeneity analysis. The results of the regional heterogeneity test in Table 12 indicate that the regression coefficients of digital transformation on the carbon emission reduction performances of corporations in the sample groups of eastern, central, and western regions are all significantly positive at the 1% confidence level. This further confirms that digital transformation positively contributes to enhancing the carbon emission reduction performance of corporations, consistent with the conclusions of the previous study.
Table 12.
Tests for regional heterogeneity.
From the regression coefficients of the empirical test, it can be seen that the effect of digital transformation on corporate carbon emission reduction performance varies across regions, with the central region exhibiting the most significant impact, followed by the western region, and the eastern region showing the least pronounced effect. This may be attributed to the higher overall level of digitalization among corporations in the eastern region, coupled with a lower presence of corporations in key industries contributing to carbon emissions, resulting in a comparatively weaker impact of digital transformation on carbon emission reduction performance, compared to other regions. The western region, characterized by abundant resources and a significant presence of industries such as power generation, iron and steel, and building materials, exhibits higher carbon emissions. Although digital transformation can moderately influence carbon emission reduction performance, the overall scale of carbon emissions diminishes the impact of digital transformation on performance. Considering the development status, the digitalization level of corporations and carbon emissions in the central region is relatively coordinated, so the degree of digital transformation affecting carbon emission reduction performance is very close, which is ideal.
6.3. Tests for Heterogeneity in Property Rights
Given the influence of property rights on corporate digital transformation [35], the sample companies are divided into two groups based on property rights: state-owned and non-state-owned. This division aims to examine how digital transformation affects carbon emission reduction performance across different property rights. The test results are depicted in Table 13. The empirical results indicate significantly positive regression coefficients for digital transformation’s impact on carbon emission reduction performance in both state-owned and non-state-owned corporations, with larger coefficients observed in state-owned corporations.
Table 13.
Tests for heterogeneity in property rights.
The results of this test reveal variations in the impact of corporate digital transformation on carbon emission reduction performance across different corporate property rights. The reason may lie in the fact that, under the current arrangement of China’s property rights system, state-owned corporations have a stronger endogenous social responsibility mission, and their digitalization results may be relatively more invested in carbon emission reduction actions, while private corporations, as corporations dominated by the logic of the market, may focus their digitalization efforts more on enhancing market competitiveness. Moreover, China’s carbon emissions are primarily concentrated in key industries such as power generation, iron and steel, building materials, nonferrous metals, petrochemicals, chemicals, paper, aviation, etc., which collectively contribute to about 75% of the national carbon dioxide emissions. These industries constitute a larger proportion of state-owned corporations. Under the dual impetus of industry-wide carbon reduction objectives and social responsibility missions, state-owned corporations tend to apply digital transformation more frequently to carbon emission reduction efforts, resulting in a more pronounced impact on corporate carbon emission reduction performance. Moreover, state-owned corporations typically possess greater financial resources to absorb additional production costs and exhibit a stronger capacity to undertake digital transformation efforts [36].
6.4. Tests for Heterogeneity in Industry Type
Referring to the Industry Classification Standard, all industries in the sample are classified according to the intensity of production factors. Drawing on the industry classification method of Lutong et al. (2012) [37], fixed asset ratio and R&D expenditure remuneration ratio are selected as classification indicators, and the widely used sum of squares method of cluster analysis is used to cluster all industries in this sample. The sample corporations are divided into three sample groups, namely technology-intensive, asset-intensive, and labor-intensive, to examine the heterogeneity of the impact of digital transformation on the performance of carbon emission reduction of corporations in different industry types. The industry classifications are shown in Table 14.
Table 14.
Factor intensity industry classification.
Importantly, as shown in Table 15, there are differences in the impact of digital transformation on corporate carbon emission reduction performance across different industry types. In the sample of labor-intensive and asset-intensive corporations, the regression coefficient of digital transformation on carbon emission reduction performance is significantly positive; however, in technology-intensive corporations, it is negative and insignificant. This may be because technology-intensive corporations already possess a higher degree of digital transformation and exhibit lower emissions. Additionally, the process of upgrading their level of digitalization may lead to additional carbon emissions, thereby making the impact statistically insignificant. Moreover, in the sample of labor-intensive firms, digital transformation exhibits a significantly positive effect at the 1% confidence level; whereas, in the sample of asset-intensive firms, it demonstrates a statistically significant impact at the 5% confidence level, revealing variations across industries. Therefore, when formulating policies to enhance precision and effectiveness, it is necessary to fully consider the differences across industries.
Table 15.
Heterogeneity test for industry type.
7. Conclusions
7.1. Research Findings
This paper selects data from listed companies spanning 2012 to 2022 and constructs a two-way fixed-effects model. Green technology innovation is additionally included as a mediator variable in the model to explore the internal mechanism by which digital transformation affects the carbon emission reduction performance of corporations. The findings indicate the following:
- (1)
- Digital transformation can positively contribute to corporate carbon emission reduction performance improvement and shows heterogeneity when there are differences in the level of carbon emission reduction performance of corporations, the region where corporations are located, the nature of property rights, and the type of industry.
- (2)
- Green technology innovation mediates the relationship between digital transformation and corporate carbon emission reduction performance.
- (3)
- Tax reduction incentives play a positive moderating role in the relationship between digital transformation and corporate carbon emission reduction performance.
- (4)
- Environmental subsidies play a positive moderating role in the relationship between digital transformation and green technology innovation.
Overall, the findings emphasize the crucial role of technology in addressing environmental challenges, highlighting how corporations can contribute to sustainability through digital efforts. They also stress the importance of customized strategies to optimize sustainability initiatives, along with the positive impact of integrating green technology investments into digital transformations. Furthermore, they underscore the significance of supportive policies in promoting sustainable business practices, suggesting a holistic approach to achieving environmental goals. By acknowledging these interrelated factors, policymakers and businesses can work together to foster more sustainable and environmentally friendly practices.
7.2. Policy Recommendations
- (1)
- Internally, promoting the research, development, and application of digitization technologies within corporations is crucial for accelerating digital transformation. This can be achieved by establishing a corporate digital resource-sharing platform and increasing subsidies for digital transformation. These measures can lower the information threshold and financial pressure associated with digital transformation, thus expediting the process and enhancing corporations’ performance in reducing carbon emissions.
- (2)
- Externally, it is vital to acknowledge the influence of various factors and implement diverse measures to enhance corporations’ carbon emission reduction performance. Supporting green technology innovation and leveraging tax reduction incentives can be effective. Strengthening existing subsidies for green technology innovation while emphasizing environmental subsidies can enhance corporate carbon emission reduction performance through refined regulatory mechanisms.
- (3)
- Adapting digital transformation policies to suit the diverse landscape of corporations globally is paramount. These policies must account for variables such as carbon emission reduction efficacy, geographical distribution, intellectual property rights, and industry classifications. This necessitates the development of incentive structures tailored to varying degrees and extents. Facilitating collaboration across regions, industries, and enterprises, and enacting a comprehensive strategy for industrial spatial planning, can help alleviate discrepancies in digital transformation efforts. This, in turn, bolsters the efficacy of carbon emission reduction initiatives on a global scale.
7.3. Limitations and Future Research
Taking listed companies in China as a case study, this paper investigates the relationship between digital transformation and corporate carbon emission reduction performance, providing lessons for companies in other parts of the world.
The following deficiencies and extensibility still exist:
- (1)
- In terms of research samples and methods, this paper selects Chinese listed companies as research objects, and in the future, it can focus on specific industries (e.g., chemical industry, iron and steel industry, etc.) to carry out empirical evidence or case studies, to obtain more typical and targeted research results.
- (2)
- In terms of internal mechanism, this paper focuses on the mediating role of green technology innovation and the moderating role of tax reduction incentives, and in the future, we can further analyze the internal mechanism of carbon emission reduction performance driven by corporate digital transformation from other perspectives.
- (3)
- In the selection of explanatory and interpreted variables, future research can further change the variables based on this study and conduct more specific research. For example, by considering the impact of individual technologies in digitalization, such as artificial intelligence technology itself, on corporate carbon emission reduction performance, or by considering changing carbon emission reduction performance to other energy-related variables, the impact of digital transformation on fossil fuel prices can be explored.
- (4)
- In the existing research on digital transformation and carbon emission reduction, there has been abundant progress in macro-level research, with scholars mainly focusing on regional economic development, technological-level policy influence, etc. This paper enriches the research at the corporate level, and in the future, we can consider further research at the corporate level by taking into account the above factors at the regional level.
Author Contributions
Conceptualization, L.G.; methodology, L.G.; software, M.T.; validation, L.G. and M.T.; writing—original draft preparation, M.T.; writing—review and editing, M.T. All authors have read and agreed to the published version of the manuscript.
Funding
This research was funded by the National Natural Science Foundation of China under Grant No. 71473194, “Theoretical and Applied Research on Multi-stage Investment Management of Coal Resources under Uncertain Environment”.
Institutional Review Board Statement
Not applicable.
Informed Consent Statement
Not applicable.
Data Availability Statement
The data presented in this study are available on request from the corresponding authors.
Conflicts of Interest
The authors declare no conflicts of interest.
Abbreviations
| AI | artificial intelligence |
| IPCC | Intergovernmental Panel on Climate Change |
| ST | special treatment |
| PT | particular transfer |
| VIF | variance inflation factor |
| LM | Lagrange multiplier |
| FE | fixed effects |
| RE | random effects |
| R&D | research and development |
| Nomenclature | |
| i | firm |
| t | year |
| α | the parameter to be estimated in Equation (1) |
| γi | the firm fixed effect |
| σt | the year fixed effect |
| CV | control variable |
| ε | the random perturbation term |
| β | the parameter to be estimated in Equation (2) |
| θ | the parameter to be estimated in Equation (3) |
| δ | the parameter to be estimated in Equation (4) |
| μ | the parameter to be estimated in Equation (5) |
References
- Guo, Y.; Gou, X.; Xu, Z.; Skare, M. Carbon Pricing Mechanism for the Energy Industry: A Bibliometric Study of Optimal Pricing Policies. Acta Montan. Slovaca 2022, 27, 49–69. [Google Scholar]
- Biglan, A. The Role of Advocacy Organizations in Reducing Negative Externalities. J. Organ. Behav. Manag. 2009, 29, 215–230. [Google Scholar] [CrossRef] [PubMed]
- Zhou, Z.; Li, J.; Zeng, H. Research on the influence of political and economic stakeholders on corporate carbon performance—An empirical analysis based on Chinese listed companies. J. Yunnan Univ. Financ. Econ. 2020, 36, 72–88. [Google Scholar]
- Chen, H.; Dong, Z. Research on factors influencing corporate carbon performance—An analytical perspective based on legitimacy theory. Sci. Technol. Dev. 2020, 16, 284–292. [Google Scholar]
- Wang, P.; Huang, S.; Wang, Y.; Li, W. The impact of carbon emissions trading on corporate carbon performance. Res. Manag. 2023, 44, 158–169. [Google Scholar]
- Zhang, C.-P.; He, T.; Liu, M. Evaluation of carbon performance of paper corporates based on the perspective of the carbon value stream. J. Dalian Univ. Technol. (Soc. Sci. Ed.) 2021, 42, 50–60. [Google Scholar]
- Ghassan, H.M.; Fathia, E.L. Impact of foreign directors on carbon emissions performance and disclosure: Empirical evidence from France. Sustain. Account. Manag. Policy J. 2021, 13, 221–246. [Google Scholar]
- Alsaifi, K. Carbon disclosure and carbon performance: Evidence from the UK’s listed companies. Manag. Sci. Lett. 2021, 11, 117–128. [Google Scholar] [CrossRef]
- Zhao, C.; Wang, W.; Li, X. How digital transformation affects corporate total factor productivity. Financ. Trade Econ. 2021, 42, 114–129. [Google Scholar]
- Qi, Y.; Xiao, X. Corporate management change in the era of digital economy. Manag. World 2020, 36, 135–152+250. [Google Scholar]
- Yi, L.; Wu, F.; Xu, S. Research on the performance-driven effect of corporate digital transformation. Secur. Mark. Her. 2021, 349, 15–25+69. [Google Scholar]
- Guo, F.; Yang, S.; Chai, Z. Does Digital Transformation of Corporates Promote “Increase in Quantity and Improve in Quality” of Green Technology Innovation?—A textual analysis based on annual reports of Chinese-listed companies. South. Econ. 2023, 2, 146–162. [Google Scholar]
- Zhao, C. Research on the Impact of Digital Transformation on Corporate Social Responsibility. Contemp. Econ. Sci. 2022, 44, 109–116. [Google Scholar]
- Hu, J.; Han, Y.; Zhong, Y. How Corporate Digital Transformation Affects Corporate ESG Performance-Evidence from Listed Companies in China. Ind. Econ. Rev. 2023, 54, 105–123. [Google Scholar]
- Xu, C.; Chen, X.; Dai, W. Effects of Digital Transformation on Environmental Governance of Mining Corporates: Evidence from China. Int. J. Environ. Res. Public Health 2022, 19, 16474. [Google Scholar] [CrossRef] [PubMed]
- Zhu, Q.; Liu, Y.; Zhang, W. Party Organization Participation in Governance, Environmental Regulation and Green Technology Innovation-Empirical Evidence from China’s A-share Listed Companies in Heavy Pollution Industries. Corp. Econ. 2023, 42, 68–78. [Google Scholar]
- Zheng, J.; Han, M. Environmental Regulation, Technological Capability, and Green Innovation-Moderating Effects Based on Managers’ Environmental Awareness. Sci. Econ. 2023, 36, 31–35. [Google Scholar]
- Wang, M.; Li, Y.; Wang, Z.; Cao, X.; Shi, W. Research on the impact of corporates’ common technology innovation participation on green technology innovation under the perspective of innovation chain. J. Manag. 2023, 20, 856–866. [Google Scholar]
- Zou, G.; Yuan, Y.; Xu, Q. Environmental costs, financial subsidies and corporate green innovation. China Soft Sci. 2023, 386, 169–180. [Google Scholar]
- Bae, J.; Cho, C. Green technology innovation and economic performance: Evidence from the Korean manufacturing industry. J. Clean. Prod. 2018, 196, 1315–1324. [Google Scholar]
- Wu, L.; Chen, W.; Lin, L.; Feng, X. Research on the impact of innovation and green technology innovation on corporate total factor productivity. Math. Stat. Manag. 2021, 40, 319–333. [Google Scholar]
- Fan, B.; Wang, W. Synergistic effects of environmental protection investment and green technology innovation on financial performance of coal corporates. Chongqing Soc. Sci. 2019, 295, 70–82. [Google Scholar]
- Liu, Z.; Wang, F. Impact of green science and technology innovation and financial investment on industrial structure upgrading—An empirical analysis based on 2003–2019 data of the Yangtze River Economic Belt. Sci. Technol. Prog. Countermeas. 2021, 38, 53–61. [Google Scholar]
- Zhu, W. How Environmental Protection Taxes Affect Corporate Carbon Emission Reduction Performance: Internal Mechanism and Empirical Evidence. Mod. Manag. Sci. 2023, 4, 127–135. [Google Scholar]
- Wang, H.; Liu, J.; Zhang, L. Carbon Emissions and Asset Pricing: Evidence from Chinese Listed Companies. J. Econ. 2022, 9, 28–75. [Google Scholar]
- Yan, H.; Jiang, J.; Wu, Q. Research on the impact of carbon performance on financial performance based on the analysis of property rights nature. Math. Stat. Manag. 2019, 38, 94–104. [Google Scholar]
- Wu, F.; Hu, H.; Lin, H.; Ren, X. Corporate digital transformation and capital market performance-Empirical evidence from stock liquidity. Manag. World 2021, 37, 130–144. [Google Scholar]
- Wang, X.; Wang, Y. Research on green credit policy to enhance green innovation. Manag. World 2021, 37, 173–188+11. [Google Scholar]
- Liu, G. Analysis of incentive effect of tax preference and financial subsidy policy—An empirical study based on the perspective of information asymmetry theory. Manag. World 2016, 8, 62–71. [Google Scholar]
- Cheng, B.; Fang, Y. Environmental Regulation “Combination Punch” and Performance of Environmental Subsidies. Financ. Econ. Mon. 2021, 22, 28–37. [Google Scholar]
- Wen, Z.; Zhang, L.; Hou, J.; Liu, H. The mediation effect test program and its application. J. Psychol. 2004, 5, 614–620. [Google Scholar]
- Zhang, Y.; Li, X.; Xing, M. Corporate digital transformation and audit pricing. Audit. Res. 2021, 3, 62–71. [Google Scholar]
- Shi, Y.; Wang, Y.; Zhang, W. Digital transformation of corporates in China: Status quo, problems and prospects. Econ. 2021, 12, 90–97. [Google Scholar]
- Shen, X.; Chen, Y.; Lin, B. The impact of technological progress and industrial structure distortion on energy intensity in China. Econ. Res. 2021, 56, 157–173. [Google Scholar]
- Zhang, Z.; Ma, Y. Crisis or opportunity: Corporate customer relationship and digital transformation. Econ. Manag. 2022, 44, 67–88. [Google Scholar]
- Zhang, D. How does environmental policy affect firm upgrading in China?—A quasi-natural experiment from the “two control zones” policy. Ind. Econ. Res. 2020, 5, 73–85. [Google Scholar]
- Lu, T.; Dang, Y. Corporate governance and technological innovation: A comparison by industry. Econ. Res. 2014, 49, 115–128. [Google Scholar]
Disclaimer/Publisher’s Note: The statements, opinions and data contained in all publications are solely those of the individual author(s) and contributor(s) and not of MDPI and/or the editor(s). MDPI and/or the editor(s) disclaim responsibility for any injury to people or property resulting from any ideas, methods, instructions or products referred to in the content. |
© 2024 by the authors. Licensee MDPI, Basel, Switzerland. This article is an open access article distributed under the terms and conditions of the Creative Commons Attribution (CC BY) license (https://creativecommons.org/licenses/by/4.0/).