Article

Optimization Decision Study of Business Smart Building Clusters Considering Shared Energy Storage

1
School of Economics and Management, Shanghai University of Electric Power, Shanghai 201306, China
2
Shanghai Qiyuan Green Power Technology Co., Ltd., Shanghai 200010, China
*
Author to whom correspondence should be addressed.
Sustainability 2024, 16(8), 3422; https://doi.org/10.3390/su16083422
Submission received: 20 February 2024 / Revised: 3 April 2024 / Accepted: 17 April 2024 / Published: 19 April 2024
(This article belongs to the Collection Power System and Sustainability)

Abstract

:
Smart buildings have a large number of dispatchable resources, both for power production and consumption functions, and the energy consumption of intelligent building clusters has a good complementary and interactive relationship, which can better promote the local consumption of distributed energy. In order to realize the goal of “dual-carbon” and promote the construction of a new power system mainly based on renewable energy, this paper takes the Business Smart Building (BSB) cluster with photovoltaic (PV) power generation as the research object. A peer-to-peer (P2P) energy trading model with shared energy storage (SES) for BSBs is constructed, and the potential risk of the stochastic volatility of photovoltaic power generation to BSBs is evaluated using conditional value-at-risk (CVaR). Finally, the optimal strategy for P2P energy sharing among BSBs is obtained by distributed solving using the alternating direction multiplier method (ADMM). The results show that the proposed model can minimize the operating cost of the multi-BSB alliance and realize win–win benefits for building users and shared energy storage operators. Meanwhile, the proposed CVaR gives a trade-off between benefits and risks, which can satisfy the needs of decision-makers with different risk preferences in making decisions.

1. Introduction

With the continuous acceleration of China’s urbanization and the improvement of people’s standard of living comfort, new buildings and existing buildings emit a large amount of carbon dioxide during their construction and operation [1,2]. According to the Research Report on Energy Consumption and Carbon Emission of Buildings in China (2023), published by the China Building Energy Efficiency Association, the energy use of housing buildings in China will account for 36.3% of the total national energy consumption in 2021, and their carbon emissions will account for 38.2% of the total national carbon emissions [3]. As for high-energy-consuming buildings, commercial intelligent buildings have abundant and widely distributed roof resources, which have a huge potential for developing and constructing rooftop photovoltaics [4,5]. Therefore, the green and low-carbon development of commercial buildings plays a crucial role in realizing the “dual-carbon” goal and promoting the consumption of new energy.
Photovoltaic output has randomness and uncertainty, and its output curve and the electricity load curve in the building cannot match exactly [6]. To realize a continuous and stable power supply, it needs strong and powerful energy storage technology as a support. In recent years, China has proposed the use of new energy and energy storage, promoting the rapid development of the energy storage industry [7,8]. However, at this stage, energy storage equipment has the disadvantages of high construction cost, low utilization rate, long payback period, inconspicuous short-term economic benefits, and low motivation to configure energy storage, which makes it difficult to realize the self-supply of energy storage in each commercial intelligent building [9]. Shared energy storage is the introduction of the concept of a “sharing economy”, which was first proposed by the State Grid Qinghai Electric Power Company in 2018 [10]. The separation of ownership and usage of shared energy storage is the essential feature of shared energy storage that distinguishes it from self-distributed energy storage. The literature [11] allocates shared energy storage on the generation side of wind and PV renewable energy sources to store surplus power from non-dispatchable generators and provide auxiliary services. The results show that a shared energy storage plant can reduce the cost of coal-fired power generation by $10.8 million, wind power generation by 10.2%, and solar power generation by 14.2%. The literature [12] investigated the economically optimal scheduling of shared energy storage applied to microgrid clusters and showed that a microgrid cluster equipped with a shared energy storage system saves 17.23% of the total electricity cost. And the more microgrids connected to the shared energy storage system, the more electricity consumption costs can be saved. The literature [13] configures shared energy storage on the residential consumption side and incorporates P2P trading between residences to enable distributed energy owners to share excess energy with other local residential buildings. However, most of the above studies on shared energy storage have focused on centralized shared energy storage at the source, grid, and load sides, while less research has been conducted on distributed shared energy storage with multiple subjects at the power and load sides.
There are two forms of transactions involved in BS buildings: centralized and decentralized. The difference between decentralized transactions and centralized transactions is that decentralized transactions are direct P2P transactions between energy producers and consumers, which achieve decentralization and make transactions more flexible [14,15]. The literature [16] studied the willingness of community users to participate in P2P trading and the trading preferences of different target groups. The results of the study showed that 77.4% of users were willing to participate in P2P transactions. The literature [17] established a demand response strategy model for an electric vehicle fleet under a P2P energy sharing mechanism; the results showed that the power purchase cost of the electric vehicle fleet in the P2P energy sharing model was reduced by $1094.73 compared with the traditional model, and the rate of PV’s close-by consumption was increased to 87.72%. The literature [18] proposed a two-level network-constrained P2P energy inter-transaction in multi-microgrids and modeled the solution of the P2P energy trading process between multiple BSBs using the multi-leader, multi-follower Stackelberg game method. Most of the above studies on P2P trading focus on electricity trading; except for electricity trading, joint P2P trading of electricity and carbon emissions can both promote new energy consumption and reduce carbon emissions.
Uncertainty of PV output within the BSB can pose a risk to the safe and stable operation of the power system, which, in turn, affects the operational profitability of the system [19]. Conditional value-at-risk (CVaR) is an improved risk analysis method developed from the value-at-risk (VaR) method [20]. CVaR effectively overcomes the shortcomings of the VaR method in describing the degree of loss and its subadditivity insufficiencies [21], and CVaR, as an effective risk metric, has been widely used in risk avoidance, risk measurement, and risk constraints of power system risk management [22,23]. The literature [24] considered the uncertainty of solar power generation and energy demand in an integrated energy system and added the CVaR method to the system optimization model for risk management. The results were obtained by comparing the CVaR method with the traditional stochastic planning method. Due to the better ability of the system to withstand shocks caused by uncertainty, the total system cost of the system that considers the CVaR method is relatively larger, but it improves the flexibility of the system. The literature [25] developed a microgrid-based distribution robust CVaR framework under renewable energy output uncertainty to help decision-makers understand the risk level of different decisions and maximize the total profit of the microgrid. The literature [26] proposes a risk-aversion-based forecasting of renewable energy generation using CVaR to assess the extreme forecasting errors of the model to reduce the risk of financial losses under extreme forecasting errors.
In summary, this paper proposes an optimal scheduling decision for a cluster of BS buildings with the participation of shared energy storage, which makes it possible to conduct transactions between BS buildings P2P and between BS buildings and shared energy storage operators. In this paper, firstly, the energy trading model for BS building clusters, including shared energy storage, is established by integrating the characteristics of distributed generation and producers and sellers. Secondly, a P2P trading model between BSBs is constructed, which includes carbon emissions trading in addition to electric energy trading, adding trading varieties, and broadening the way of trading, which is conducive to the realization of the economy and low carbon. Then, from the perspective of the risk management method, CVaR theory is integrated into the BSB trading model to avoid the risk caused by the uncertainty of PV output within BSBs. Finally, to protect the privacy of the subject, a distributed algorithm is used to solve the model. A scenario analysis is established to verify the rationality and effectiveness of the multi-BSB electric-carbon P2P trading mechanism considering shared energy storage.

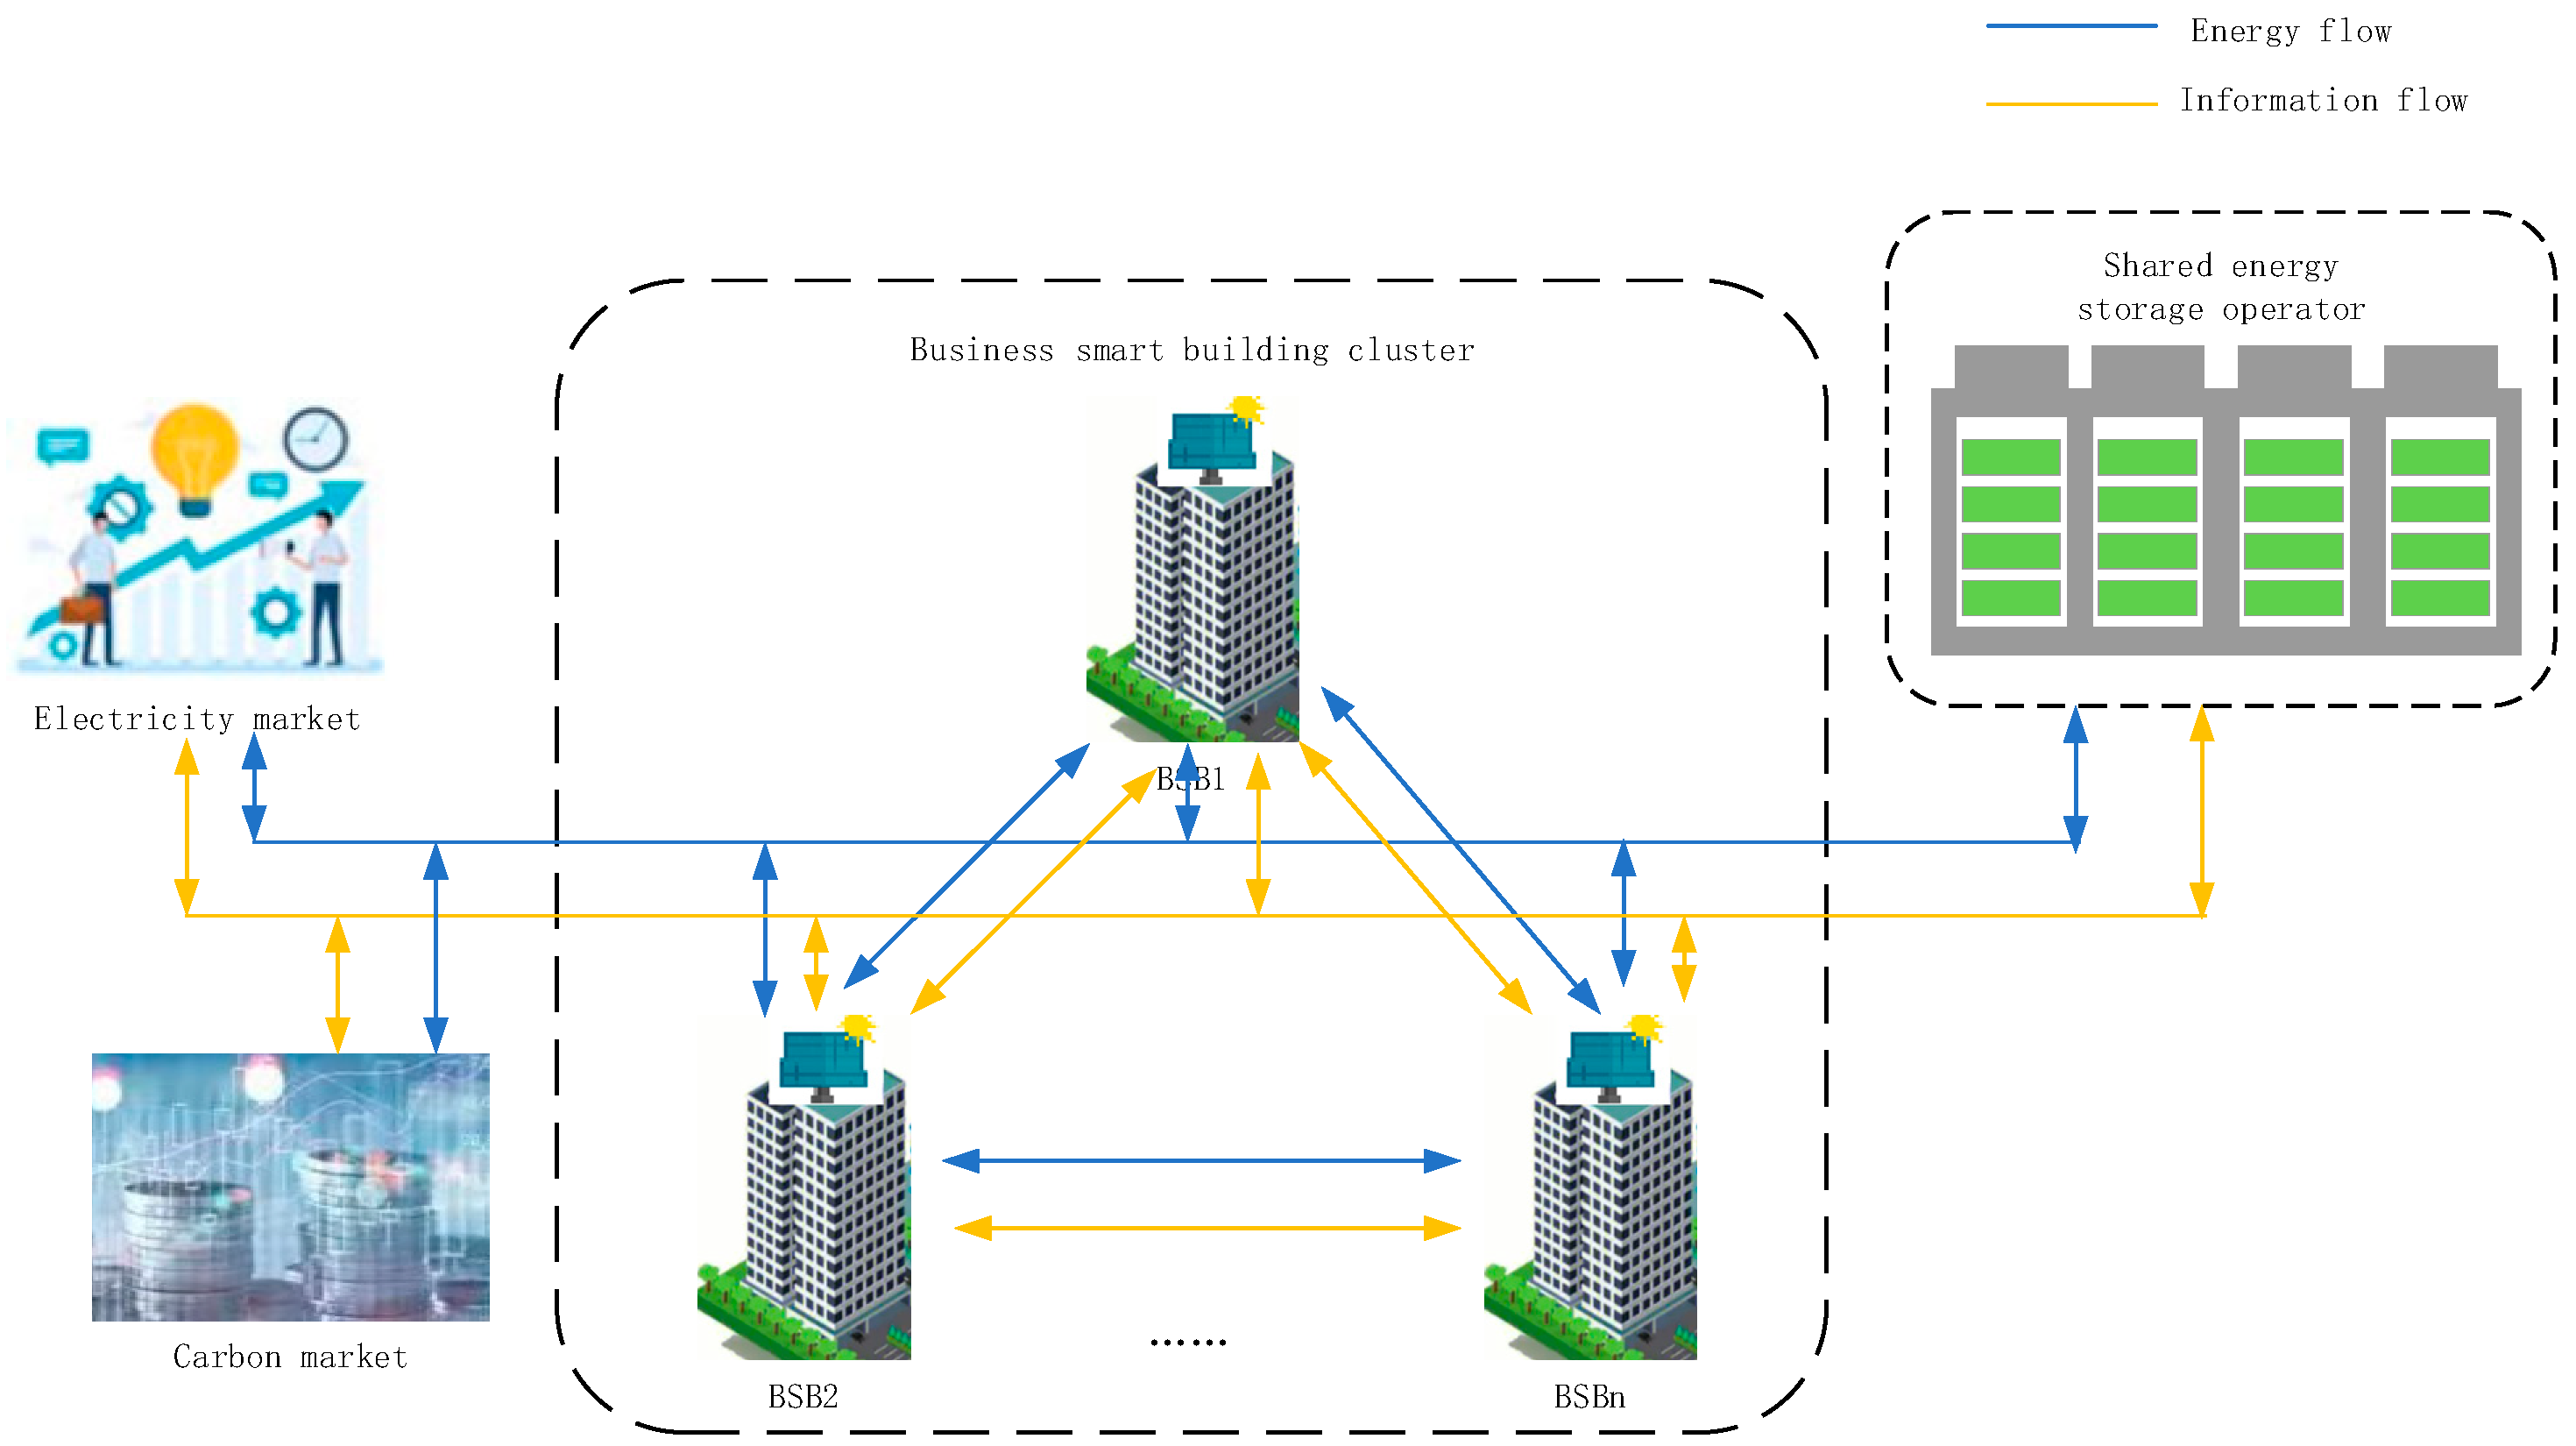
2. Energy Trading Framework for BSB Clusters

In this paper, we take clusters of BSB as the object of study. With the large number of rooftop PV accesses, BSBs are transformed from a single consumer of electric energy to a producer and seller [27,28]. Due to the existence of good complementary characteristics and interactions between the energy usage of different BSBs, BSBs with excess electricity are regarded as sellers, and BSBs with shortages of electricity are regarded as buyers at different periods. The supply and demand sides are matched, and the BSBs prioritize trading P2P electricity with other BSBs to promote the nearness of the consumption of electricity among the BSBs. When the BSB cluster as a whole has a surplus or shortage of electricity, it then trades with the shared energy storage and the electricity market. Similarly, BSBs with high carbon emissions are regarded as buyers, BSBs with low carbon emissions are regarded as sellers, and BSBs are prioritized to trade with other BSBs in P2P carbon trading. When the carbon quota of the BSB cluster as a whole is surplus or insufficient, it then participates in the carbon market for trading [29]. The trading framework of the BSB cluster considering shared energy storage participation is shown in Figure 1. Each BSB is equipped with distributed PV, Heating Ventilating and Air Conditioning (HVAC) loads, and flexible loads, in addition to a shared energy storage system configured outside the cluster of BSBs [30]. Each BSB can switch between buyers and sellers according to its own supply and demand status of electricity and carbon emissions and can freely choose to trade electricity or carbon emissions, while the electricity and carbon prices can incentivize power generation and consumption behaviors in real-time, thus stimulating the vitality of the market.

3. Energy Trading Model for BSB

In this paper, business smart buildings containing distributed PV, HVAC, and flexible loads are studied.

3.1. Objective Function

This chapter addresses the ith BSB whose optimization objective is to minimize the total cost of B S B i . The expression is shown below:
min C i = s = 1 S t = 1 T ρ s ( C i , t E + C i , t C + C i , t S E S + C i , s , t P V + C i , s , t H V A C + C i , s , t R E S )
where s is the scenario of the PV output; S is the total number of PV output scenarios; t is the trading session; T is the total number of trading sessions, taken as T = 24 h; ρ s is the probability of PV output scenario s; C i is the total cost of B S B i ; C i , t E is the transaction cost of B S B i with the electricity market; C i , t C is the transaction cost of B S B i with the carbon emission market; C i , t S E S is the service fee paid by B S B i to the charging and discharging behavior of the SES; C i , s , t P V is the operating cost of the PV; and C i , s , t H V A C , C i , s , t R E S are the costs incurred in regulating HVAC and flexible load comfort, respectively.
(1)
Electricity transaction cost
C i , t E = σ t b P i , t b u y σ t s P i , t s e l l
where σ t b , σ t s are the purchased and discharged electricity prices from B S B i to the grid at time t. To prevent BSB arbitrage, generally σ t b > σ t s ; P i , t b u y , P i , t s e l l are the purchased and sold electricity from B S B i to the grid at time t, respectively.
(2)
Carbon trading costs
C i , t C = μ t b E i , t b u y μ t s E i , t s e l l
where μ t b , μ t s are the unit price of carbon emissions purchased and sold to the carbon market by B S B i at time t, and E i , t b u y , E i , t s e l l are the carbon emissions purchased and sold to the carbon trading market by B S B i at time t, respectively.
(3)
SES charge/discharge costs
C i , t S E S = ν t c P i , t c + ν t d P i , t d
where ν t c and ν t d are the price of battery loss due to the charging and discharging behaviors of the shared energy storage power station, respectively; P i , t c and P i , t d are the amount of charging and discharging of the energy storage power station from B S B i , respectively.
(4)
PV operating costs
C i , s , t P V = λ P V P i , s , t P V
where λ P V is the annual unit operating cost of PV power generation; P i , s , t P V is the amount of electricity generated by the PV in period t under scenario s for B S B i .
(5)
HVAC and flexible load conditioning costs
C i , s , t H V A C = m 1 ( T i , s , t i n T i r e f ) 2 C i , s , t R E S = m 2 ( P i , s , t R E S P i , t R E S , b a s e ) 2
where m 1 and m 2 are user discomfort coefficients; T i , s , t i n is the indoor temperature value of B S B i at time t; T i r e f is the most comfortable temperature value of B S B i ; P i , s , t R E S is the value of the flexible load in B S B i ; and P i , t R E S , b a s e is the value of the load base in B S B i .

3.2. Constraints

(1)
Electrical power balance constraints
P i , s , t H V A C + P i , s , t R E S + P i , t c + P i , t s e l l = P i , s , t P V + P i , t d + P i , t b u y
where P i , s , t H V A C and P i , s , t R E S are the operating power of the HVAC and flexible loads in B S B i at moment t, respectively.
(2)
Carbon emission constraints
B E i , s , t = κ P i , s t P V
where B E i , s , t is the carbon emission reduction of PV power generation in B S B i ; κ is the C O 2 emission factor of regional grid power generation.
B E i , s , t + E i , t b u y E i , t l o a d + E i , t s e l l
where E i , t l o a d is the carbon emissions from the loads within B S B i .
(3)
Charge and discharge power and capacity constraints for SES
0 i = 1 N P i , t c γ t c P c max 0 i = 1 N P i , t d γ t d P d max γ t c + γ t d 1 γ t c 0 , 1 ,   γ t d 0 , 1
where P c max and P d max are the maximum charging and discharging power of the SES; γ t c and γ t d are the charging and discharging states of the SES at moment t, which are 0–1 variables to ensure that the energy flow between the B S B i and the SES at the same moment can only be unidirectional.
Charge state continuity constraints for SES:
E t = E t 1 + η c i = 1 N P i , t c 1 η d i = 1 N P i , t d E min E t E max E 0 = E 24
where E t is the charging state of the SES at time t; η c and η d are the charging and discharging efficiencies of the energy storage, respectively; E min and E max are the minimum and maximum capacity of the SES, respectively; E 0 and E 24 are the initial energy storage of the energy storage plant and the end storage energy of the SES operation cycle, respectively, which ensures the continuity of the energy storage equipment from the initial state to the end state during the scheduling cycle, to ensure that the energy storage equipment can be operated normally in the next scheduling cycle.
(4)
Constraints on HVAC
T i , s , t i n = e β i γ i T i , s , t 1 i n + ( 1 e β i γ i ) ( α i , t β i σ i P i , s , t H V A C β i ) T i n , min T i , s , t i n T i n , max
where α i , t , β i , and γ i are parameters of meteorological conditions related to the building characteristics of B S B i and the outdoor temperature; σ i is the energy efficiency ratio of the HVAC unit in B S B i ; P i , s , t H V A C is the power of the HVAC in B S B i . T i n , min and T i n , max are the minimum and maximum indoor temperature values of the building, respectively.
(5)
Constraints on flexible loads
t = 1 T P i , s , t R E S = t = 1 T P i , t R E S , b a s e P i , t R E S , min P i , s , t R E S P i , t R E S , max
where P i , t R E S , min and P i , t R E S , max are the adjustable lower limit and adjustable upper limit of the flexible load in B S B i , respectively.

4. BSB Cluster Energy Trading Model with P2P Transactions

4.1. Objective Function

The optimization objective of energy trading for BSB clusters containing P2P transactions is to minimize the total cost of BSB clusters:
min     C 1 = i = 1 N t = 1 T ( C i , t E + C i , t C + C i , t S E S + C i , s , t P V + C i , s , t H V A C + C i , s , t R E S + C i , t P 2 P )
where C 1 is the total cost of the BSB cluster; C i , t P 2 P is the cost of P2P transactions between B S B i and other buildings.
The P2P transaction costs are approximated as a linear function of the transactions between the BSBs [31]:
C i , t P 2 P = j = 1 , j i N i ( a i j P i , j , t + b i j E i , j , t )
where C i , t P 2 P is the P2P transaction cost of B S B i ; a i j and b i j are bilateral transaction coefficients indicating the difference between B S B i and B S B j ; P i , j , t and E i , j , t are the amount of electricity and carbon emissions traded between B S B i and B S B j at time t, respectively. P i , j , t > 0 denotes that at moment t, B S B i buys electricity from B S B j ; P i , j , t < 0 denotes that at moment t, B S B i sells electricity to B S B j ; and P i , j , t = 0 denotes that at moment t, no electricity is traded between B S B i and B S B j . E i , j , t > 0 indicates that B S B i buys carbon emissions from B S B j ; E i , j , t < 0 indicates that B S B i sells carbon emissions to B S B j ; and E i , j , t = 0 indicates that there is no carbon trading between B S B i and B S B j . N i is the total number of BSBs involved in the transaction.

4.2. Constraints

The purchase and sale of energy by each BSB needs to be constrained to maintain user balance:
P i , j , t + P j , i , t = 0     ( j i ) E i , j , t + E j , i , t = 0     ( j i ) P i , s , t H V A C + P i , s , t R E S + P i , t c + P i , t s e l l = P i , s , t P V + P i , t d + P i , t b u y + j = 1 , j i N P i , j , t B E i , t + E i , t b u y + j = 1 , j i N E i , j , t E i , t l o a d + E i , t s e l l
In summary, the energy trading model of a cluster of business smart buildings containing P2P transactions is composed of the objective function (14) and constraints (2)–(6), (8), (10)–(13), and (15)–(16).

5. CVaR-Based Energy Trading Model for a Cluster of Business Smart Buildings

5.1. Risk Assessment Model for CVaR

VaR reflects the potential maximum loss of the system for a given confidence level α [32]. Let f ( x , y ) be the loss function, where x is the decision variable y is the random variable, and let ρ ( y ) be the probability density function of the PV outturn of the random variable y. The distribution function of the loss function f ( x , y ) less than or equal to the threshold δ is as follows:
φ ( x , δ ) = f ( x , y ) δ ρ ( y ) d y
For a given confidence level α ( 0 , 1 ) , the value of the V a R function can be obtained from the following equation:
V V a R α = min δ R : φ ( x , δ ) α
where V V a R α is the V a R value at confidence level α .
V a R can adjust for risk by adjusting the confidence level α , but it cannot monitor tail cases when losses are higher than this value. C V a R is an improvement on V a R that compensates well for the shortcomings of the V a R value. For a given confidence level α ( 0 , 1 ) , the C V a R function value can be obtained from the following equation:
V C V a R α = 1 1 α f ( x , y ) V V a R α f ( x , y ) ρ ( y ) d y
where V C V a R α is the C V a R value at confidence level α .
Since it is very difficult to solve the V a R value accurately in the actual solution process, the auxiliary function F α ( x , δ ) is constructed to simplify the CVaR function.
F α ( x , δ ) = δ + 1 1 α y R m [ f ( x , y ) δ ] + ρ ( y ) d y
where [ f ( x , y ) δ ] + max f ( x , y ) δ , 0 , δ is the V a R value; R m is the m-dimensional real number space.
Due to the difficulty of solving the ρ ( y ) -analytic equation, calculated by substituting integrals at sampling points, discretization of the auxiliary function F α ( x , δ ) is calculated as follows:
F ˜ α ( x , δ ) = δ + 1 N Ω ( 1 α ) ω = 1 N Ω [ f ( x , y ω ) δ ] +
where N Ω is the total number of samples; y ω is the ω th sample of the random variable y. Then, V C V a R α = min F ˜ α ( x , δ ) .

5.2. Energy Trading Strategies for a Cluster of BSB Considering CVaR

The CVaR method was used to measure the risk associated with the uncertainty of PV output in B S B . Use θ i to denote the CVaR value of the B S B i cost:
θ i = ϕ i + 1 1 α s = 1 S ρ s z i , s
where ϕ i is the V a R value of B S B i costs; z i , s is the value of B S B i cost over V a R , which is broken down into the following two equations for ease of calculation:
z i , s 0 z i , s t = 1 T ( C i , t C + C i , t E + C i , t S E S + C i , s , t P V + C i , s , t H V A C + C i , s , t R E S + C i , t P 2 P ) ϕ i
Ultimately, the transaction model for the BSB cluster considering CVaR is as follows:
min     C = ( 1 L ) i = 1 N t = 1 T ( C i , t E + C i , t C + C i , t S E S + C i , s , t P V + C i , s , t H V A C + C i , s , t R E S + C i , t P 2 P ) + i = 1 N L θ i s . t .       ( 2 ) ( 6 ) ,   ( 8 ) ,   ( 10 ) ( 13 ) ,   ( 15 ) ( 16 ) ,   ( 22 ) ( 23 )
where C is the total cost of the BSB cluster after considering CVaR; L is the risk preference coefficient, which indicates the decision-maker’s attitude toward the risk— L [ 0 , 1 ] , with a small L ( L < 0.1 ), indicates that the decision-maker is risk-loving, and a large L ( L > 0.5 ) indicates that the decision-maker is risk-averse [33].

6. Example Analysis

In this section, the simulation is carried out with BSB cluster load data as an example to verify the feasibility of the BSB cluster optimization decision model considering shared energy storage. The arithmetic case analysis is based on the Matlab 2018b platform, and the modeling and solving are carried out by the solver Cplex12.8 and the solver MOSEK, with the PC hardware environment of an Intel Core i5 2.40 GHz CPU and 16.0 GB RAM.

6.1. Parameter Setting and Scene Description

(1)
Parameter setting
In this paper, a cluster of business smart buildings in a southern part of China is selected to contain three buildings, N = 3, and each building contains rooftop PV, central air-conditioning, and flexible loads. The load of one of the commercial intelligent buildings is 0 at 24:00 p.m.–7:00 a.m. [34]. The baseline values of the flexible loads are shown in Figure 2 [35], and the Monte Carlo method is utilized to generate five sets of predicted PV output values for different scenarios, as shown in Figure 3. The parameters related to the shared energy storage system are shown in Table 1 [36]. The time-of-day electricity price in the electricity market is referenced to the general industrial and commercial electricity price; the carbon trading price is set to 57 yuan / t [37], which is considered to be 1.5 times the carbon selling price for BSBs’ carbon purchase price in the carbon market. To show the P2P transaction between BSBs more clearly, the arithmetic example only shows the optimized operation results from 08:00 to 18:00 (PV working hours).
(2)
Scene description
Case 1: Each BSB trades power directly with the electricity market without considering inter-building P2P energy trading.
Case 2: Each BSB trades electricity and carbon with the electricity market and carbon market, respectively, without considering inter-building P2P energy trading.
Case 3: BSB trades electricity with the electricity market and between other buildings.
Case 4: Electricity–carbon trading between BSBs and electricity markets, carbon markets, and other buildings.
Case 5: BSBs trade electricity and carbon with the electricity market, the carbon market, and other buildings, and each building is equipped with independent energy storage.
Case 6: BSBs engage in electricity–carbon trading with electricity markets, carbon markets, and other buildings, and SES is involved.

6.2. Analysis of Simulation Results

6.2.1. Total Cost Analysis of BSBs in Different Cases

The costs of the BSB clusters in each different case are shown in Table 2. Case 2 compared to Case 1 and Case 4 compared to Case 3 add carbon emissions trading in addition to electricity trading. The building clusters have increased carbon trading benefits due to the sale of carbon reductions from PV output by BSB to the carbon market. Therefore, the total cost of building clusters in Case 2 and Case 4 is lower than in Case 1 and Case 3.
From the comparison of Case 1 and Case 3 and Case 2 and Case 4, it can be concluded that the consideration of P2P trading among BSBs reduces the cost of electricity trading. Because P2P trading adds a new trading channel for BSBs, BSBs will flexibly change their purchasing and selling roles according to the supply and demand status of electric energy and carbon emissions. When the P2P transaction price is smaller than the price of purchasing electricity from the grid or larger than the price of selling electricity to the grid, BSBs will favor P2P transactions and reduce electricity transactions with the grid through the complementarity of surplus generation power and shortage power, which ultimately makes the total cost of BSBs lower.
In addition, from the comparison of Cases 5 and 6, it can be found that the total cost of building clusters under Case 5 is higher than the total cost of building clusters under Case 6 because when each building is configured with the energy storage mode, each building needs to bear the initial investment and construction costs of energy storage on its own, whereas the construction cost of configuring independent energy storage is on the high side and the payback period is longer. Through third-party investment and construction of a shared energy storage power station, it is possible to not only realize the centralized sharing of electric energy but also to improve the enthusiasm of building users to apply energy storage. The comparison results of different scenarios illustrate that electricity–carbon P2P trading between clusters of BSB and the configuration of shared energy storage can minimize the transaction cost.

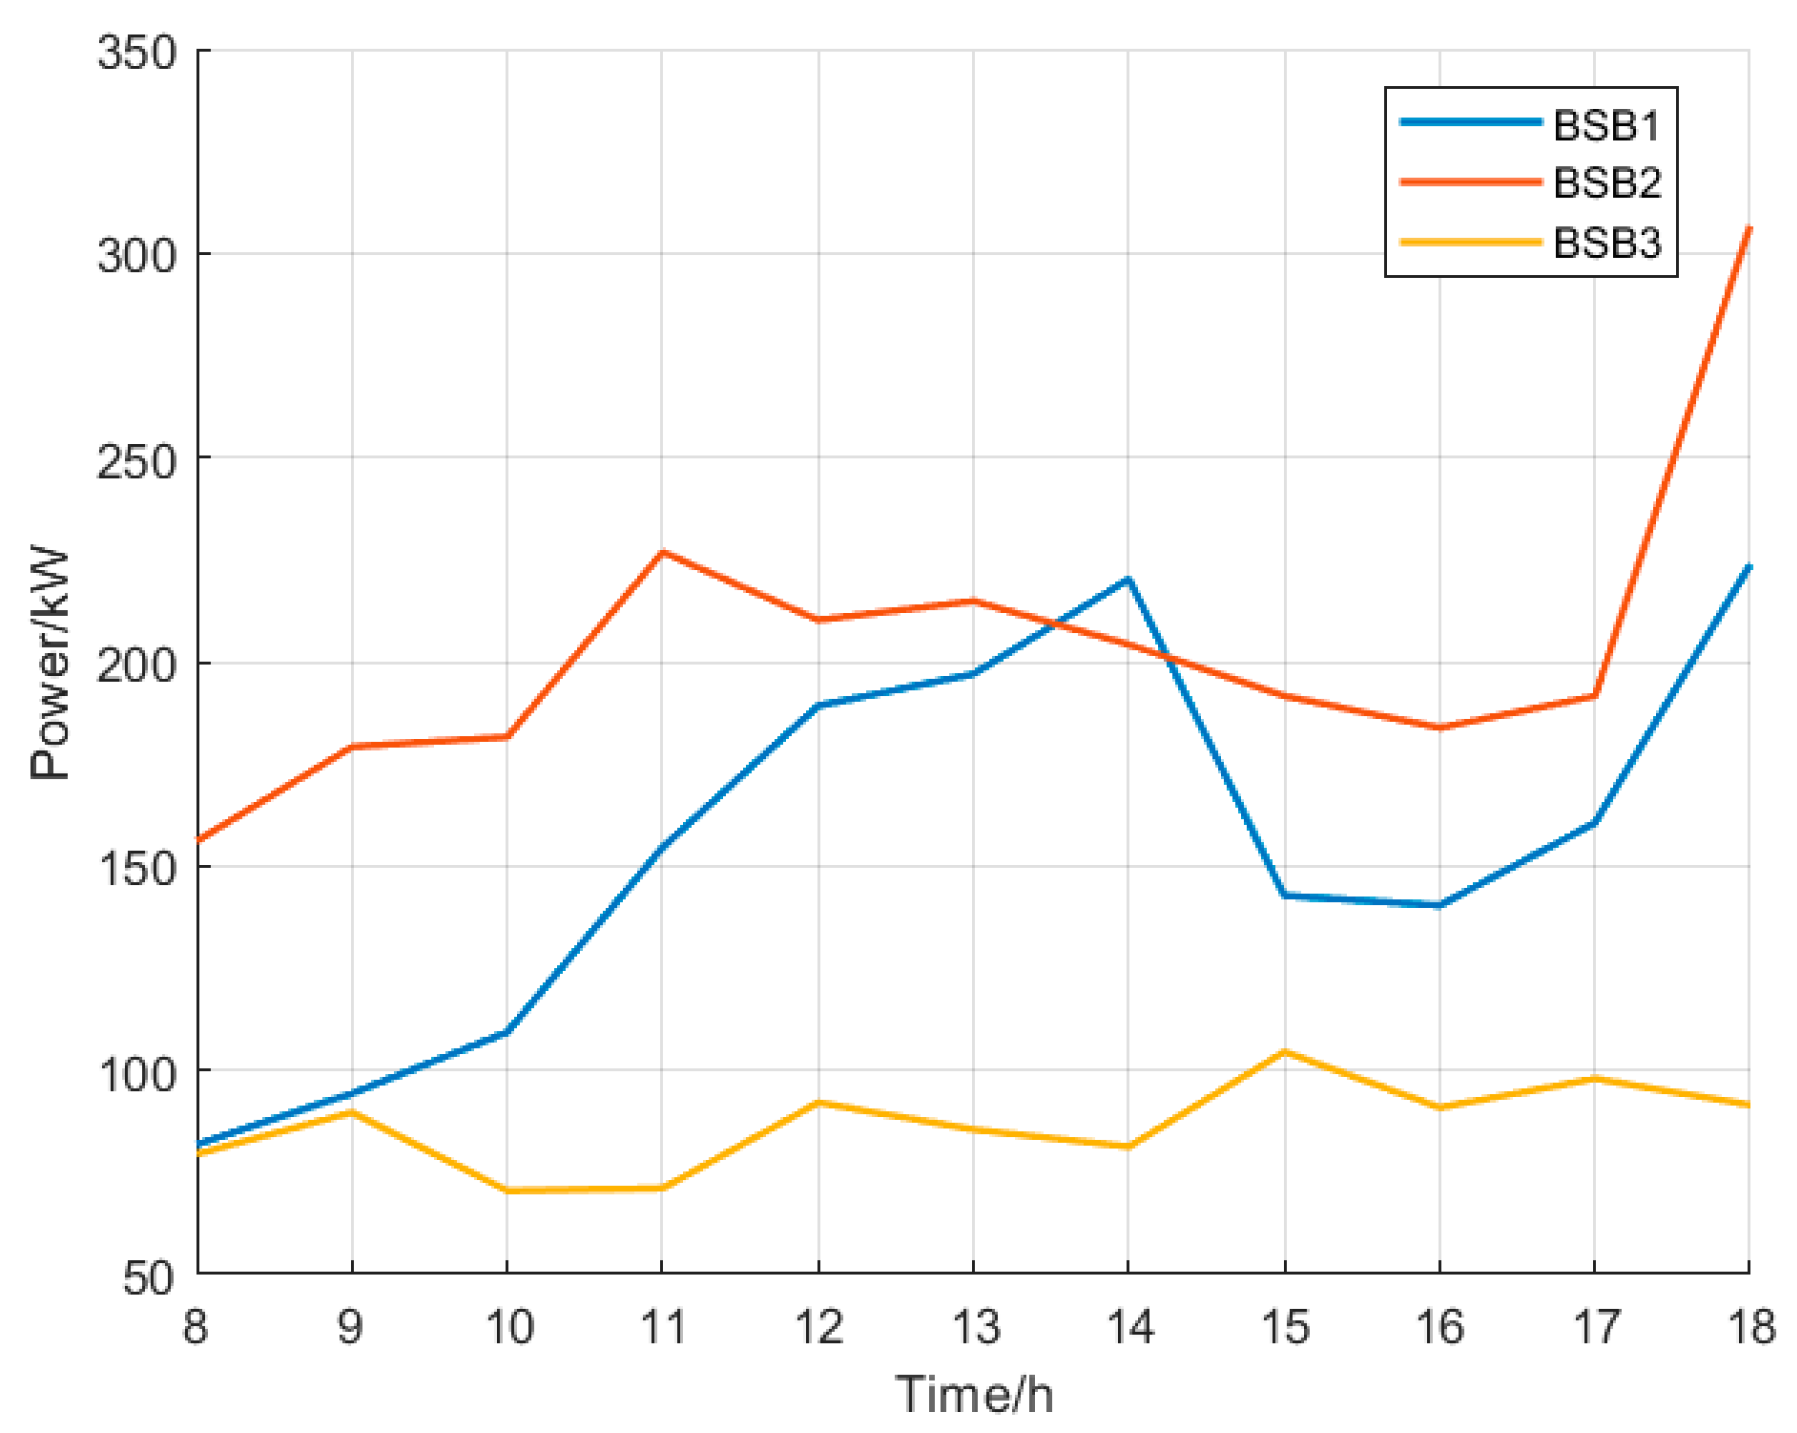
6.2.2. Analysis of the Results of P2P Energy Trading between BSBs

Figure 4 illustrates the P2P electricity–carbon trading between BSBs in Case 6. A positive value of shared energy between the two buildings in the figure indicates that the BSB buys products through P2P transactions, and a negative value indicates that the BSB sells products through P2P transactions. Among them, Figure 4a shows the electricity trading between BSBs, and the electricity trading between buildings mainly occurs between building 1 and other buildings, and BSB1 sells electricity to BSB2 and BSB3 between 11:00 and 17:00 when the PV output is higher in the building. Figure 4b shows the trading of carbon emissions between BSBs. The carbon trading between BSBs mainly focuses on 8:00 and 19:00, and BSB1 buys carbon emissions from BSB2 and BSB3, which is because, at this time, the PV output is low and the carbon emission quota allocated to BSB1 is insufficient; thus, BSB1 needs to buy carbon emissions to make up for the shortfall.

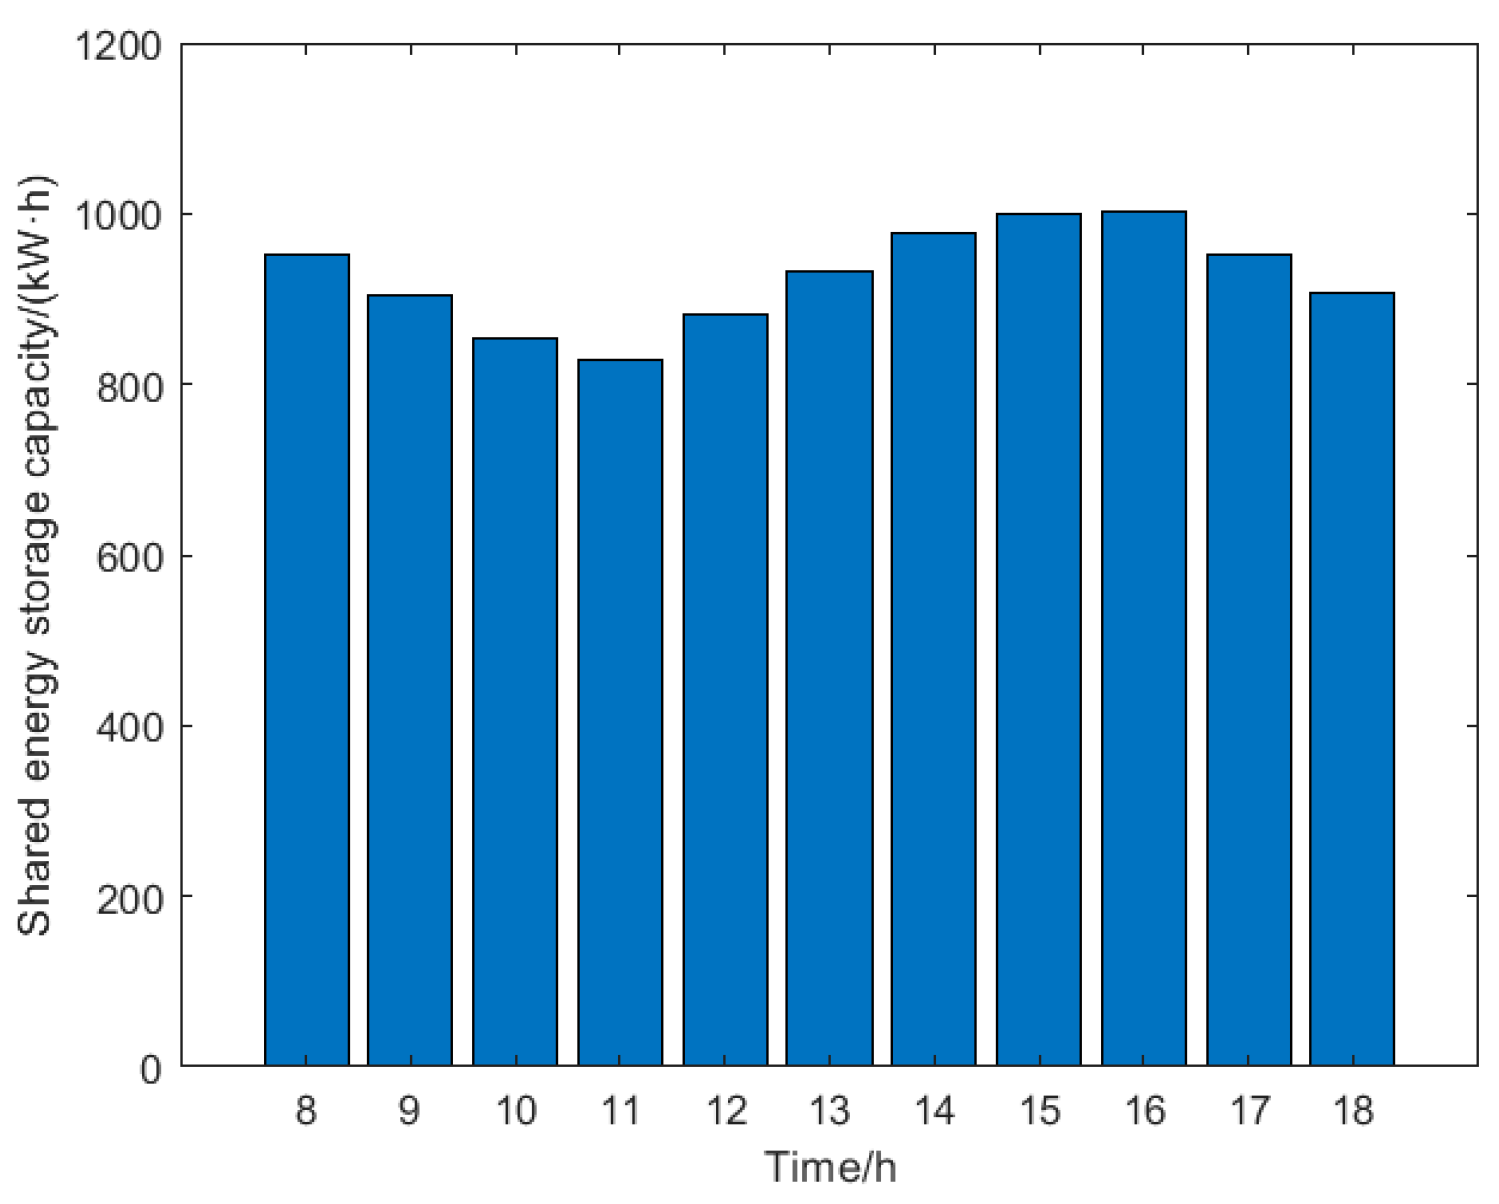
6.2.3. Capacity Changes in SES

Figure 5 shows the capacity change curve of SES at 8:00–18:00. The capacity of SES continues to increase in the 12:00–16:00 time period, which is a higher PV output time. BSBs have surplus power and choose to charge the shared energy storage. In the grid, the price is in the low valley or the valley time, and the energy storage will choose to purchase power from the grid to be used when the price peaks. The SES capacity shows a decreasing trend during 09:00–11:00 and 16:00–18:00 h. When the load in the smart building increases, the PV output can no longer meet the building load, and the shared energy storage charges the BSB.

6.2.4. Analysis of Transaction Results Considering CVaR Values

As can be seen in Figure 6, as L increases, the sum of the costs of the BSB’s day-ahead and intraday phases increases, and the CVaR value decreases. When L is small, the BSB behaves as risk-loving, and its ability to bear risk is higher, making the sum of the BSB’s costs in the day-ahead and intraday phases also lower; when L is large, the BSB behaves as risk-adverse and tends to reduce the value of the CVaR to increase the ability to withstand risk, making the BSB’s total cost higher, but the slope of its cost increase is gradually decreasing.
Table 3 compares the costs of the BSB deterministic and CVaR models. The deterministic model does not consider the PV output uncertainty in the day-ahead decision-making; thus, in the intraday phase, when the real PV output value is lower than the predicted value, each BSB has to buy the insufficient generation at a high price, which makes the intraday BSB cost and total cost increase significantly. The CVaR model takes the PV output uncertainty into account in day-ahead decision-making, and the intraday dispatch cost and total cost are lower than those of the deterministic model, thus proving the economy of the CVaR model.

7. Conclusions

In this paper, a P2P energy sharing optimization model for building clusters considering shared energy storage is constructed for BSB clusters, and the CVaR model is used to assess the risk faced by the uncertainty of the PV output within the BSB. The following conclusions are obtained by analyzing the arithmetic examples:
(1)
The shared energy storage system can store power during the lower hours of the building load and release power during the peak hours of electricity consumption, which can effectively level out the deviation of PV output and realize the cost of purchasing power for the building clusters.
(2)
The P2P energy sharing transaction reduces the dependence on external energy sources, reduces the operating costs of the BS building cluster as well as each building while meeting the building loads, and improves the flexibility of the building cluster operation as well as the level of in-building PV consumption.
(3)
P2P energy sharing itself has the advantage of carbon reduction, and the text couples carbon trading into P2P energy trading, which can further explore the potential of BSBs to reduce emissions and lower the operating costs of BSBs.
(4)
The introduction of the CVaR model allows for the quantification of BSB returns and risks under PV output uncertainty, providing different risk management measures for decision-makers with different risk appetites, thus assisting decision-makers in determining risk appetites that meet their own psychological expectations and corresponding trading decisions.
Future work will focus on the following aspects: energy sharing between clusters of smart buildings with different functions (office, industrial, agricultural buildings, etc.) can be considered to further improve the local consumption of renewable energy; with the gradual increase in the scale of electric vehicles, which can be regarded as both electrical loads and energy storage devices, with a strong potential for electric energy dispatch, smart buildings containing electric vehicles can be considered; and the potential risks posed by distributed photovoltaic power generation, uncertainties in energy demand, and electricity prices to clusters of smart buildings can be further considered.

Author Contributions

Conceptualization, W.Z. and S.X.; methodology, S.X.; software, S.X.; validation, W.Z., S.X., and P.G.; formal analysis, P.G.; data curation, S.X.; writing—original draft preparation, S.X.; writing—review and editing, W.Z.; funding acquisition, W.Z. All authors have read and agreed to the published version of the manuscript.

Funding

This research is supported by the National Key Research and Development Program of China (Grant No. 2022YFE0207700).

Institutional Review Board Statement

Not applicable.

Informed Consent Statement

Not applicable.

Data Availability Statement

The data that support the findings of this study are available from the corresponding author, Shuting Xu, upon reasonable request.

Conflicts of Interest

Author Peng Guo was employed by Shanghai Qiyuan Green Power Technology Co., Ltd. The remaining authors declare that the research was conducted in the absence of any commercial or financial relationships that could be construed as a potential conflict of interest.

References

  1. Huo, T.F.; Du, Q.X.; Xu, L.B.; Shi, Q.W.; Cong, X.B.; Cai, W.G. Timetable and roadmap for achieving carbon peak and carbon neutrality of China’s building sector. Energy 2023, 274, 127330. [Google Scholar] [CrossRef]
  2. Ang, J.H.; Yusup, Y.; Zaki, S.A.; Salehabadi, A.; Ahmad, M. Comprehensive Energy Consumption of Elevator Systems Based on Hybrid Approach of Measurement and Calculation in Low- and High-Rise Buildings of Tropical Climate towards Energy Efficiency. Sustainability 2022, 14, 4779. [Google Scholar] [CrossRef]
  3. China Association for Building Energy Efficiency. China Building Energy Consumption and Carbon Emissions Research Report (2023). Architecture 2024, 02, 46–59. [Google Scholar]
  4. Liang, L.; Fu, C.C.; Gao, Y.X.; Su, T.C.; Wan, F.H.; Xiong, X.; Pan, M.Z.; Guan, W. An optimal siting and economically optimal connectivity strategy for urban green 5G BS based on distributed photovoltaic energy supply. Energy Convers. Manag. 2023, 301, 118043. [Google Scholar] [CrossRef]
  5. Fontenot, H.; Ayyagari, K.S.; Dong, B.; Gatsis, N.; Taha, A. Buildings-to-distribution-network integration for coordinated voltage regulation and building energy management via distributed resource flexibility. Sustain. Cities Soc. 2021, 69, 102832. [Google Scholar] [CrossRef]
  6. Haider, H.; Jun, Y.; Rashed, G.I.; Peixiao, F.; Kamel, S.; Li, Y.H. A robust optimization model for microgrid considering hybrid renewable energy sources under uncertainties. Environ. Sci. Pollut. Res. 2023, 30, 82470–82484. [Google Scholar] [CrossRef]
  7. Morstyn, T.; Collett, K.A.; Vijay, A.; Deakin, M.; Wheeler, S.; Bhagavathy, S.M.; Fele, F.; McCulloch, M.D. OPEN: An open-source platform for developing smart local energy system applications. Appl. Energy 2020, 275, 115397. [Google Scholar] [CrossRef]
  8. Andreev, M.; Bay, Y.; Malyuta, B. Novel method for setting up the relay protection of power systems containing renewable energy sources and hydrogen energy storage systems. Int. J. Hydrogen Energ. 2023, 48, 29425–29445. [Google Scholar] [CrossRef]
  9. Li, L.X.; Cao, X.L.; Zhang, S. Shared energy storage system for prosumers in a community: Investment decision, economic operation, and benefits allocation under a cost-effective way. J. Energy Storage 2022, 50, 104710. [Google Scholar] [CrossRef]
  10. Lu, Q.Y.; Yang, Y.G.; Xie, P.P.; Chen, Y.; Wu, J.K.; Lei, Z. Two-stage optimized operation strategy for wind farm cluster lease-sharing energy storage. Grid Technol. 2024, 48, 1146–1165. [Google Scholar]
  11. Ma, M.T.; Huang, H.J.; Song, X.L.; Pena-Mora, F.; Zhang, Z.; Chen, J. Optimal sizing and operations of shared energy storage systems in distribution networks: A bi-level programming approach. Appl. Energy 2021, 307, 118170. [Google Scholar] [CrossRef]
  12. Cao, S.M.; Zhang, H.L.; Cao, K.; Chen, M.; Wu, Y.; Zhou, S.Y. Day-Ahead Economic Optimal Dispatch of Microgrid Cluster Considering Shared Energy Storage System and P2P Transaction. Front. Energy Res. 2021, 9, 645017. [Google Scholar] [CrossRef]
  13. Duan, P.F.; Zhao, B.X.; Zhang, X.H.; Fen, M.D. A day-ahead optimal operation strategy for integrated energy systems in multi-public buildings based on cooperative game. Energy 2023, 275, 127395. [Google Scholar] [CrossRef]
  14. Esmat, A.; de Vos, M.; Ghiassi-Farrokhfal, Y.; Palensky, P.; Epema, D. A novel decentralized platform for peer-to-peer energy trading market with blockchain technology. Appl. Energy 2020, 282, 116123. [Google Scholar] [CrossRef]
  15. Li, B.; Qin, Q.Y.; Qi, B. An overview of the design of blockchain-based distributed energy trading schemes. Grid Technol. 2019, 43, 961–972. [Google Scholar]
  16. Hahnel, U.J.J.; Herberz, M.; Pena-Bello, A.; Parra, D.; Brosch, T. Becoming prosumer: Revealing trading preferences and decision-making strategies in peer-to-peer energy communities. Energy Policy 2019, 137, 111098. [Google Scholar] [CrossRef]
  17. Zhou, W.; Xu, C.M.; Yang, D.X.; Peng, F.X.; Guo, X.L.; Wang, S. Study on demand response strategy of electric vehicle fleet considering willingness dynamic adjustment under P2P energy sharing. Chin. J. Electr. Eng. 2023, 43, 8217–8230. [Google Scholar]
  18. Yan, M.Y.; Shahidehpour, M.; Paaso, A.; Zhang, L.X.; Alabdulwahab, A.; Abusorrah, A. Distribution Network-Constrained Optimization of Peer-to-Peer Transactive Energy Trading Among Multi-Microgrids. IEEE Trans. Smart Grid 2021, 12, 1033–1047. [Google Scholar] [CrossRef]
  19. Wang, G.; Tan, Z.F.; Tan, Q.K.; Yang, S.B.; Lin, H.Y.; Ji, X.H.; Gejirifu, D.; Song, X.Y. Multi-Objective Robust Scheduling Optimization Model of Wind, Photovoltaic Power, and BESS Based on the Pareto Principle. Sustainability 2023, 11, 305. [Google Scholar] [CrossRef]
  20. Maier, S.; Street, A.; McKinnon, K. Risk-averse portfolio selection of renewable electricity generator investments in Brazil: An optimised multi-market commercialisation strategy. Energy 2016, 115, 1331–1343. [Google Scholar] [CrossRef]
  21. Nojavan, S.; Majidi, M.; Zare, K. Risk-based optimal performance of a PV/fuel cell/battery/grid hybrid energy system using information gap decision theory in the presence of demand response program. Int. J. Hydrog. 2017, 42, 11857–11867. [Google Scholar] [CrossRef]
  22. Fan, W.; Tan, Z.F.; Li, F.Q.; Zhang, A.M.; Ju, L.W.; Wang, Y.W.; De, G.J.R.F. A two-stage optimal scheduling model of integrated energy system based on CVaR theory implementing integrated demand response. Energy 2022, 263, 125783. [Google Scholar] [CrossRef]
  23. Liu, Z.Q.; Cui, Y.P.; Wang, J.Q.; Yue, C.; Agbodjan, Y.S.; Yang, Y. Multi-objective optimization of multi-energy complementary integrated energy systems considering load prediction and renewable energy production uncertainties. Energy 2022, 254, 124399. [Google Scholar] [CrossRef]
  24. Fu, Y.; Sun, Q.; Wennersten, R. Effectiveness of the CVaR method in risk management in an integrated energy system. Energy Rep. 2020, 6, 1010–1015. [Google Scholar] [CrossRef]
  25. Zhang, C.; Liang, H.; Yang, L.F. A distributionally robust approximate framework consider CVaR constraints for energy management of microgrid. Sustain. Energy Grids Netw. 2023, 36, 101172. [Google Scholar] [CrossRef]
  26. Wang, J.L.; Zhou, Y.D.; Zhang, Y.; Lin, F.; Wang, J.X. Risk-Averse Optimal Combining Forecasts for Renewable Energy Trading under CVaR Assessment of Forecast. Errors. IEEE Trans. Power Syst. 2023, 39, 2296–2309. [Google Scholar] [CrossRef]
  27. Mediwaththe, C.P.; Shaw, M.; Halgamuge, S.; Smith, D.B.; Scott, P. An incentive-compatible energy trading framework for neighborhood area networks with shared energy storage. IEEE Trans. Sustain. Energy 2019, 11, 467–476. [Google Scholar] [CrossRef]
  28. Wang, X.Y.; Liu, Z. Development and Practice of Virtual Power Plant Participation in Grid Regulation and Market Operation. Power Syst. Autom. 2022, 46, 158–168. [Google Scholar]
  29. Lu, Q.; Guo, Q.S.; Zeng, W. Optimization scheduling of an integrated energy service system in community under the carbon trading mechanism: A model with reward-penalty and user satisfaction. J. Clean. Prod. 2021, 323, 129171. [Google Scholar] [CrossRef]
  30. Li, Z.N.; Su, S.; Jin, X.L.; Xia, M.C.; Chen, Q.F.; Yamashita, K. Stochastic and distributed optimal energy management of active distribution network with integrated office buildings. CSEE J. Power Energy Syst. 2022, 1–12. [Google Scholar]
  31. Cui, S.C.; Wang, Y.W.; Shi, Y.; Xiao, J.W. An Efficient Peer-to-Peer Energy-Sharing Framework for Numerous Community Prosumers. IEEE Trans. Industr Inform. 2020, 16, 7402–7412. [Google Scholar] [CrossRef]
  32. Wei, Z.N.; Chen, Y.; Huang, W.J.; Xu, Z.; Sun, G.Q.; Zhou, Y.Z. Optimal allocation model of multiple power supply capacity in virtual power plant considering conditional value-at-risk. Power Syst. Autom. 2018, 42, 39–46. [Google Scholar]
  33. Zhang, F.Y. Research on V2G Standby Decision-Making and Consumer Price Subsidy Model Based on CVaR Risk Measurement. Ph.D. Thesis, Chongqing University, Chongqing, China, 2019. [Google Scholar]
  34. Ren, W.S.; Gao, H.J.; Liu, Y.B.; Liu, J.Y.; Li, C.Y.; Liu, X.L. Intelligent Building Cluster Power Day Optimization and Sharing. Grid Technol. 2019, 43, 2568–2577. [Google Scholar]
  35. Shen, S.C.; Han, H.T.; Zhou, Y.Z.; Sun, G.Q.; Wei, Z.N.; Hu, G.W. Conditional value-at-risk-based P2P trading model for electricity-carbon-standby in multi-virtual power plants. Power Syst. Autom. 2022, 46, 147–157. [Google Scholar]
  36. Zhao, H.R.; Wang, X.J.; Li, B.K.; Siqin, Z.Y.; Zhao, M.R.; Wang, Y.W. Distributed Robust Optimal Scheduling of Multi-Community Optical Storage Systems Considering Energy Sharing. Power Syst. Autom. 2022, 46, 21–31. [Google Scholar]
  37. Shanghai Environmental Energy Exchange. National Carbon Market Monthly Transaction Data. Available online: https://www.cneeex.com/c/2023-06-30/494296.shtml (accessed on 25 August 2023).
Figure 1. Multi-BSB transaction framework.
Sustainability 16 03422 g001
Figure 2. Flexible load benchmarks within each BSB.
Sustainability 16 03422 g002
Figure 3. PV predicted output of each BSB under different scenarios.
Sustainability 16 03422 g003
Figure 4. P2P electricity–carbon coupling transaction between BSBs.
Sustainability 16 03422 g004
Figure 5. Capacity variation curve of SES.
Sustainability 16 03422 g005
Figure 6. Effective frontier curve.
Sustainability 16 03422 g006
Table 1. Parameters of the SES system.
ParametersRetrieve Value
minimum volume/(kW·h)300
maximum volume/(kW·h)1350
maximum charging and discharging power/kW50
charging and discharging efficiency/%95
charge/discharge operating cost/(yuan/kW·h)0.15
Table 2. Transaction costs of BSB.
CasesElectricity Trading Costs/(yuan)Carbon Trading Costs/(yuan)Running Costs/(yuan)Total Costs/(yuan)
14200.180766.44966.58
24103.34−1479.02758.163382.48
33899.670756.244655.91
43932.2−1452.06739.983220.12
53845.19−1401.63996.553440.11
63834.5−1450.13715.53099.87
Table 3. Comparison of deterministic and CvaR models.
CategoriesDeterministic ModelCvaR Model
Day before Stage/yuanIntraday Stage/yuanBSB Costs/yuanDay before Stage/yuanIntraday Stage/yuanBSB Costs/yuan
BSB1−1580.51650.670.1−1376.2931.2−445.0
BSB21745.9381.92127.81758.2146.81905
BSB31540.5317.01857.51689.8191.41881.2
Total costs1705.92349.54055.42071.81269.43341.2
Disclaimer/Publisher’s Note: The statements, opinions and data contained in all publications are solely those of the individual author(s) and contributor(s) and not of MDPI and/or the editor(s). MDPI and/or the editor(s) disclaim responsibility for any injury to people or property resulting from any ideas, methods, instructions or products referred to in the content.

