Abstract
Numerous studies have highlighted the health benefits associated with reducing aerosol particles and other pollutants. Recent studies have shown a positive correlation between exposure to aerosol particles and COVID-19 cases. In this study, we investigate the relationship between aerosol particle concentration and COVID-19 variants’ infection and mortality rates. Remote-sensing data on aerosol optical depth (AOD), a surrogate for atmospheric aerosol levels, were collected and analyzed in three regions within the states of California, Illinois, and North and South Carolina. These regions were selected to reflect the variability in aerosol concentration and anomalies during the COVID-19 period (2020–2022) compared to a reference period (2010–2019). We found consistent positive linear correlations across most regions between COVID-19 mortality rates and AOD levels below 0.2. These correlations were found to be independent of the change in aerosol levels relative to the reference period. In North and South Carolina, the Delta variant was associated with not only a high mortality rate but also a steeper increase in mortality rate per AOD of 39.6 ± 1.5 (R2 = 0.87) compared to Alpha at 10.5 ± 0.3 (R2 = 0.85). However, due to the lower mortality rate of the Delta variant compared to the Alpha variant in Illinois, the Delta variant has a lower correlation slope of 28.3 ± 1 (R2 = 0.94) compared to the Alpha variant at 52.1 ± 1.8 (R2 = 0.78). No correlation between mortality rate and AOD was observed for the Omicron variants in any of the investigated regions except in California where a weak positive correlation was evident. Our findings establish a compelling link between aerosol concentrations and SARS-CoV-2 infection and mortality. Our results underscore the urgent need for further research to elucidate the underlying mechanisms and broader implications, leading to more sustainable solutions to curb the airborne transmission of COVID-19 viruses and other viral infections in general.
1. Introduction
At the beginning of 2020, the world experienced an unprecedented global crisis—the COVID-19 pandemic—a type of event not witnessed since the influenza pandemic of 1918. The COVID-19 pandemic was the result of the coronavirus SARS-CoV-2, a single-stranded RNA virus. As the virus evolved, genetic variants of SARS-CoV-2 proliferated across the world. Variants of concern (VOCs) were categorized based on phenotypic alterations, most notably enhanced transmission rates [1,2]. In December 2020, the Alpha variant emerged (VOC: 29 December 2020), followed by the Delta variant around six months later (VOC: June 2021). In late 2021 and throughout early 2022 (VOC: 26 November 2021), the Omicron variant swept across the country, becoming a predominant variant [3,4].
Pandemics overwhelm the medical capacities to manage and control the outbreak; non-pharmaceutical interventions are required, such as quarantines and social distancing. Measures to quarantine persons and isolate those infected were deployed worldwide, varying in duration and extent [3]. These lockdown interventions resulted in notable changes in air quality criteria, including aerosol concentration and other atmospheric components [5]. For example, [6] reported a decrease in aerosol concentrations in North and South Carolina but a significant increase in Illinois and northern California.
Aerosols, which are suspended particles in the atmosphere, exhibit diversity in size, chemical composition (e.g., pH and ionic makeup), and physical attributes (e.g., size and solubility). Liquid aerosols present in the atmosphere can harbor active chemical species [7] while atmospheric aerosols of biological origin may carry various materials, including microorganisms or fragments of organisms [8,9]. Notably, aerosols can transport, retain, and disseminate viruses, including the novel SARS-CoV-2 virus. The development of remote-sensing techniques has provided researchers with a reliable and sustainable way of evaluating aerosol concentrations, especially over large spatial regions. Aerosol optical depth (AOD, unitless) serves as a proxy for atmospheric aerosol concentration smaller than 2.5 μm (PM2.5) via the extinction of a solar beam as it passes through the atmosphere [10]. Several studies have investigated the relationship between AOD and PM2.5 measured at the surface (e.g., [10,11,12]), and a few of these have derived empirical formulas that can be used to quantitatively determine PM2.5 concentrations based on measured AOD (e.g., [12]). However, due to the large uncertainties associated with the parameters included in these statistical approaches, further research is still needed before they can be universally used (e.g., [13,14]).
With economic development comes exacerbated air pollutants, which have undeniable consequences on human health [9,15]. Air pollution was found to be a significant factor in increasing mortality among individuals [5]. The reduction in aerosol particles and sulfur dioxide was found to significantly improve cardiovascular health, including a decrease in cardiovascular emergency visits [16]. Given their pivotal role in disease transmission, aerosols can either facilitate or diminish pathogen prevalence, underscoring the importance of monitoring aerosol concentrations and comprehending their impact on human health [17,18,19].
Short-range large-droplet and airborne small-droplet transmission is possible for most respiratory infectious agents [9]. Evidence indicates that individuals who tested positive for COVID-19 were exposed to and inhaled significant quantities of aerosols [20]. It has also been shown that the SARS-CoV-2 virus can remain infectious within an aerosol particle for up to 3 h [21]. Patients infected with COVID-19 can produce infectious droplets of differing sizes by breathing, coughing, or sneezing, and healthcare environments possess higher suspension times because of increased cross-flows [9]. Additionally, individuals with underlying health conditions such as asthma are particularly vulnerable to the adverse effects of air pollution. Therefore, people living in polluted areas will have an increased risk of developing or experiencing respiratory symptoms from the virus. A consensus reached by May 2020 confirmed that SARS-CoV-2 transmission occurred not only through direct contact but also via the inhalation of airborne viral particles [20,22]. More aggressive air quality management is not only recommended but vital for improvements in public health [23].
A recent study [24] delved into the relationship between COVID-19 cases and fatalities and exposure to fine particulate matter during the 2020 wildfires, selecting Washington, Oregon, and California as focal areas. The study found strong evidence of positive associations between daily increases in PM2.5 and increased risks of COVID-19 cases and deaths. Additionally, the results demonstrated strong evidence that high levels of PM2.5 exacerbated COVID-19 symptoms. The relationship between the transmission of different SARS-CoV-2 strains and several air quality criteria, including PM2.5 in China, was recently explored [25] which revealed a positive correlation between PM2.5 and confirmed cases of COVID-19 caused by different SARS-CoV-2 strains.
Despite the large spatial coverage, applicability, and reliability of measured AOD, the relation between AOD, and the mortality rates of SARS-CoV-2 variants has not yet been explored. In this study, we investigate the relation between AOD and the mortality rates and confirmed cases of COVID-19 variants in US regions with various AOD levels during the COVID-19 lockdown periods. We also investigate if the changes in aerosol levels during the lockdown period might have impacted these correlations.
2. Methodology
2.1. COVID-19 Cases and Deaths
COVID-19 viral tests are performed to determine if a person currently has the virus. Two types of viral tests are used in the United States: nucleic acid amplification tests (NAATs) and the antigen test. Daily confirmed COVID-19 cases and deaths were collected from the John Hopkins Data Center [26] at a county level across the states of California, North and South Carolina, and Illinois from January 2020 through December 2022. Confirmed daily COVID-19 cases are collected by county, as diagnosed by the viral tests, as well as population levels for each county. All daily data are averaged based on a 7-day running mean. We define case fatality ratios as the number of deaths divided by the number of confirmed cases.
2.2. Aerosol Optical Depth (AOD) Data Collection
Aerosol optical depth is used to quantify the amount of aerosol present in the atmosphere by measuring the extinction of a ray of light as it passes through the atmosphere of a particular area. The higher the AOD value, the higher the rate of light extinction [5]. AOD values less than 0.1 are representative of no aerosols, clear skies, and maximum visibility, whereas a value of 4 would indicate high aerosol load, hazy skies, and obstructed visibility. For this study, the MODIS (Terra) Collection 6.1 aerosol products datasets, which were obtained at Level 3 from the Atmosphere Archive and Distribution System (LAADS) Distributed Active Archive Center (DAAC), were used to collect AOD data [27]. More specifically, the product MOD08_D3 was used, which is a daily 1 product. MODIS total AOD measures three particle types: non-absorbing aerosols, absorbing aerosols, and non-spherical aerosols [28]. To decrease the effect of cloud cover and missing data points, we used the MODIS deep blue/dark target (DBDT) merged aerosol product as it provides more data points compared to the MODIS deep blue (DB) aerosol product. MODIS [29]. DBDT uses two algorithms, with minimal spatial overlap: the dark target (DT) algorithm which covers vegetated surfaces, and the deep blue (DB) algorithm over bright surfaces (such as deserts). The MODIS DBDT has 36 spectral bands from visible to thermal IR, and also has a swath width of 2300 km, providing near-global daily AOD values [29]. AOD data were collected from 2010 to 2023, with the period from 2010 to 2019 considered as a reference period.
2.3. Selected Jurisdictions
Figure 1 depicts the counties included in this analysis, and Figure S2 shows these regions within the US map. Specific counties within California (39–41° N and 120–123° W), North and South Carolina (34–36° N and 78–81° W), and Illinois (41–42 N and 87–89° W) were used since AOD levels in these regions showed different anomalies compared to the reference period [6]. Specified counties in North and South Carolina were treated as one region since they have similar patterns of AOD. For example, compared to the reference period, AOD in North and South Carolina showed a significant decrease, while in California and Illinois, there was a significant increase in AOD. This will help us to determine if the increase or decrease in AOD during the COVID-19 period played any significant role in the SARS-2 spread or infection rate. Due to the different populations in each region, we use cases or deaths per million population to express the relative number of the respective events.
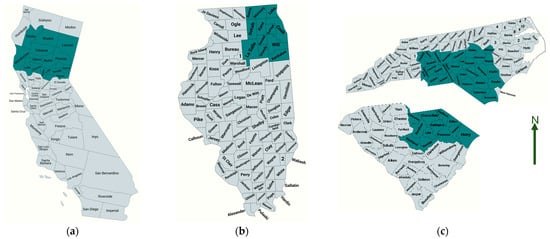
Figure 1.
The counties used for the analysis in each state are marked. Adapted from US county maps, 2023; (a) California; (b) Illinois; (c) North and South Carolina.
The Californian counties include Butte, Colusa, Glenn, Lake, Mendocino, Nevada, Placer, Plumas, Shasta, Sierra, Sutter, Tehama, Trinity, and Yuba (Table S1). North Carolina’s counties include Anson, Bladen, Brunswick, Cabarrus, Chatham, Columbus, Cumberland, Davidson, Davie, Duplin, Hoke, Iredell, Johnston, Lee, Mecklenburg, Moore, Randolph, Richmond, Robeson, Sampson, Scotland, and Stanly (Table S2). South Carolina’s counties are Chesterfield, Darlington, Dillon, Florence, Horry, Kershaw, Lancaster, Lee, Marion, Marlboro, Richland, and Sumter (Table S2). Illinois’ counties include Boone, Cook, DeKalb, DuPage, Grundy, Kane, Kankakee, Kendall, La Salle, McHenry, and Will (Table S3). The total population in Illinois’ specified counties is 8.16 million, most of which are from Cook County where Chicago is located (Figure 1). This is followed by specified counties in North and South Carolina with a total population of 4.8 million, and then California with a 1.37 million population.
2.4. Statistical Approach
We calculate the correlation between AOD and the number of fatalities or cases per million population using the standard least squares method, which is suitable for this study since we are only concerned with these two variables [30]. Correlations are based on a 7-day running mean of daily confirmed cases and deaths, and a 14-day running mean of AOD. The AOD anomaly (Section 3.2) is calculated as the difference between the measured AOD for the period from 2020 to 2022 and the mean reference period [31]:
AOD anomaly = daily AOD (2020–2022) − daily mean AOD-reference.
3. Results and Discussion
3.1. COVID-19 Data
Figure 2a–c illustrates the 7-day moving average of daily COVID-19 case numbers and deaths per million of the population in the states of California, North and South (N&S) Carolina, and Illinois (see Section 2.3). The four COVID-19 variants Alpha, Delta, and the Omicron subvariants BA.1 and BA.2 were distinguished by maxima during their respective dominancy periods. Despite differences in the number of daily cases and death numbers, all three regions have similar temporal variability with maximal death numbers typically shifted about 20 days compared to those of cases. This is due to several factors such as the treatment time, average ages of patients, vaccination rates, treatment availabilities, etc. (e.g., [32]). The correlation between the reported number of cases and deaths shows linear relationships for all variants (see Figure 2d–f). The case fatality ratio, given by the slope of the correlation between the number of deaths and the number of cases (Figure 2d–f), was highest during the Alpha and Delta variants for all regions ranging from ~1 to 1.3%, with Alpha being deadlier than Delta in Illinois compared to California and North and South Carolina (Figure 2). The Omicron variant BA.1 was much deadlier than BA.2, which had the smallest death rate. In California, variant BA.1 had almost the same case fatality ratio as the Alpha and Delta variants of about 1.1%. The low case fatality ratio of BA.2 variant might be explained by the improved treatment, recovery rates, and safety measures during the BA.2-dominant period [13,33]. These case fatality ratios of about 1% are consistent with earlier reports of case fatality ratios in the US (e.g., [34,35]). A list of all the correlation parameters is shown in Table S4.
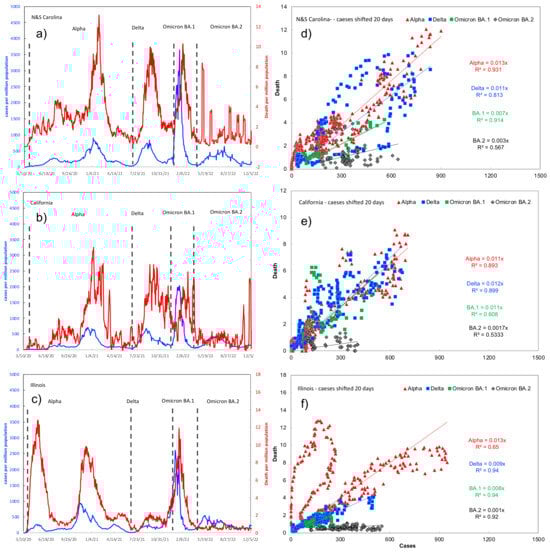
Figure 2.
The 7-day moving average of the daily number of cases and deaths per million population (a–c) and their correlations (d–f) in North and South Carolina, California, and Illinois. Note the different scales on the y-axis to represent cases per capita (left) and deaths per capita (right). The approximate range of each variant is also shown by a dotted line.
3.2. AOD Data
The calculated average AOD for the reference period of 2010–2019, and the AOD anomaly for the years 2020 to 2021 compared to the reference period are shown in Figure 3. The AOD values during the reference period are generally higher in North and South Carolina compared to California and Illinois, which is consistent with previous analysis (see Figure S1 and [6]). The seasonal cycle of the AOD reference period is different in the east US (North and South Carolina) compared to the central (Illinois) and western US (California), consistent with previous studies [10]. During the summer, AOD was the highest in North and South Carolina reaching up to ~0.5 followed by California, ~0.3, and Illinois, ~0.15. During spring, AOD reached up to ~0.4 in California and Illinois and then North and South Carolina at ~0.2. The missing anomaly data in Figure 3d–f are due to the high cloud cover in the respective time periods. However, the AOD anomaly in North and South Carolina showed a decline compared to the reference period. In California and Illinois, AOD generally showed an increase of up to ~0.2 on average compared to the reference period. The AOD anomaly in California is slightly higher than in Illinois, possibly due to wildfires [6].
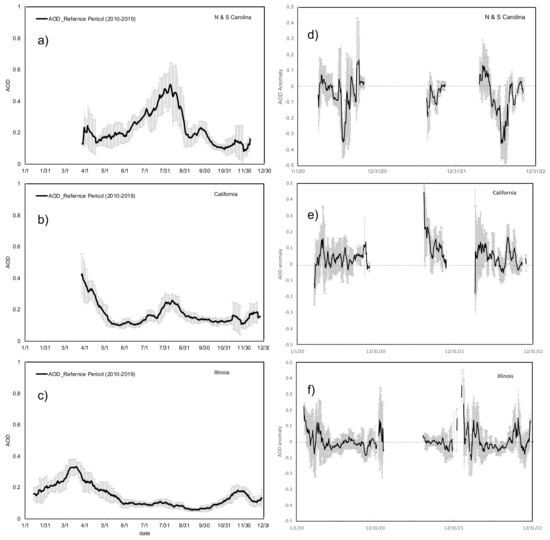
Figure 3.
The 14-day moving average of AOD for the reference period of 2010–2019 (a–c), and the calculated anomaly for the years 2020–2022 in North and South Carolina, California, and Illinois (d–f).
In the next section, we will be investigating the relationship between the number of daily COVID-19 deaths and confirmed cases and AOD levels during the period from 2020 to 2022.
3.3. Correlation between AOD and COVID-19 Data
3.3.1. An Overview
The correlations between AOD and the daily number of deaths per million population (mortality rate) for each variant in each region are calculated using the standard least squares method (e.g., [30]; see Supplementary Materials). Figure 4 shows the aggregated scatter plot for AOD and the mortality rates, as well as the AOD and confirmed cases for all variants in each region. However, we recognize different patterns for the different variants in each region. Therefore, we calculate the correlation linear fit for each variant in each region. As shown in Figure 5, Figure 6 and Figure 7, the correlation between the daily number of deaths per million population and AOD reveals a robust linear relation in all regions but with different slopes depending on the variants, the geographic region, and the AOD values. We do not explore the causal relationships (e.g., demographic factors) driving these correlations as it is out of the scope of this article. We find almost two distinctive regimes, one for AOD < 0.2 and AOD > 0.2. The linear correlations between AOD and COVID-19 data were most apparent when AOD < 0.2. The correlation between AOD and the Omicron variant is limited to the variant BA.2 since no AOD data were available during the BA.1 period (see Figure 5, Figure 6 and Figure 7).
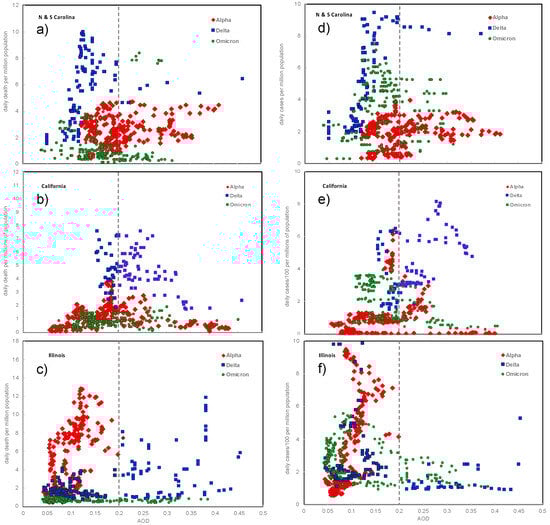
Figure 4.
Correlation between daily COVID-19-related deaths (left panel, (a–c)) and confirmed cases (right panel, (d–f)) per million population and AOD in each state from 2020 to 2022.
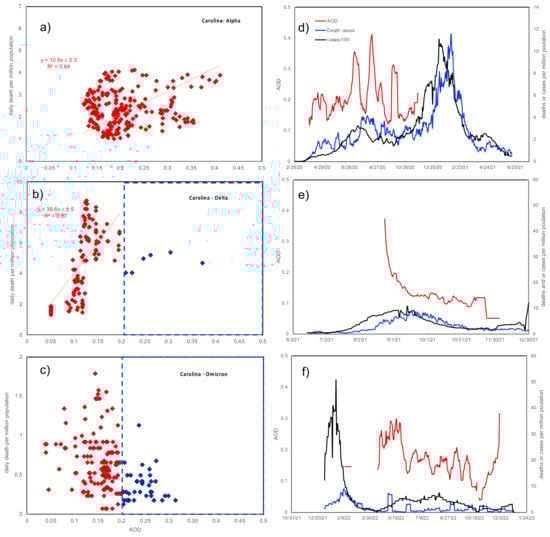
Figure 5.
Correlation of COVID-19 deaths and AOD (a–c) and time series of cases and fatalities (d–f) in North and South Carolina. Note the different scales on the y-axis.
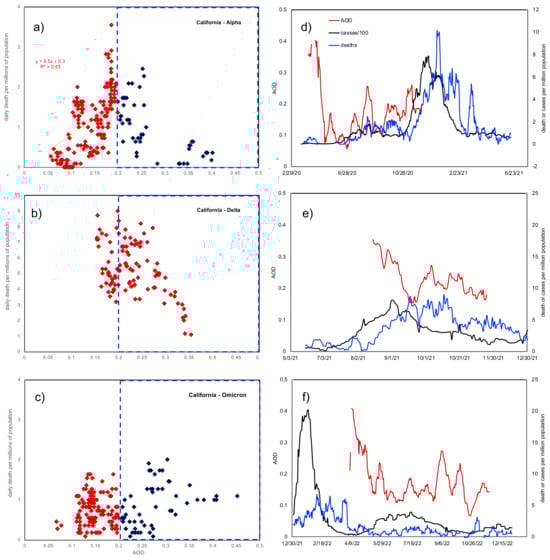
Figure 6.
Correlation of COVID-19 deaths and AOD (a–c) and time series of cases and fatalities (d–f) in California. Note the different scales on the y-axis.
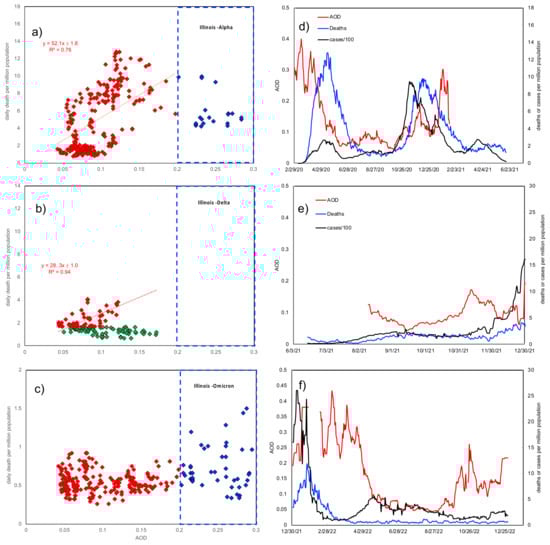
Figure 7.
Correlation of COVID-19 deaths and AOD (a–c) and time series of cases and fatalities (d–f) in Illinois. Note the different scales on the y-axis.
In North and South Carolina (Figure 5), the correlation between the COVID-19 mortality rate and AOD < 0.2 for the Delta variant had the steepest slope followed by the Alpha variant, while the Omicron BA.2 variant had almost no correlation. The reason for the BA.2 variant not showing any correlation may be due to many factors as mentioned above, including vaccination and improved treatments. This is also supported by the correlation between AOD and the COVID-19 case rate (Figure 4, right panel). While both correlations (mortality rate vs. AOD and case rate vs. AOD) for the Alpha and Delta variants are similar, the BA.2 variant shows a linear correlation for AOD < 0.2 with case rates but not with mortality rates (Figure 4). That means that people who were infected by BA.2 appeared to recover compared to the Delta and Alpha variants which had higher mortality rates. In addition, there is an absence or weaker correlation between mortality rate and AOD > 0.2 for all variants, which may be due to environmental conditions or particle size dependency. For example, aerosol particles with larger diameters will have less impact on the respiratory system (e.g., [36]). However, further analysis of the particle size dependency of the retrieved AOD is out of the scope of this study.
In California (Figure 6), the split between the AOD < 0.2 and AOD > 0.2 regimes is apparent only in the Alpha variant which has a linear fit with a slope of 8.5 ± 0.3. In contrast to North and South Carolina and Illinois, no linear correlation between AOD and mortality rate can be identified for the Delta variant in California. Similar to other states, the Omicron BA.2 variant does not show any linear correlation for the reasons mentioned above. For all variants, there is no or weak correlation between mortality rate and an AOD of >0.2.
In Illinois, the Alpha variant has the steepest slope followed by the Delta variant to a much lesser extent, while the BA.2 variant again does not show any correlation between AOD and the COVID-19 mortality rate but does show a positive correlation for AOD vs. the COVID-19 case rate (Figure 4). It is not obvious why the Alpha variant in Illinois has a much higher slope than the Delta variant. Population density (population per unit area) is certainly an important factor; for example, Cook County in Illinois has the highest population density among all investigated counties, about five times higher than the most populated county in California (see Figure 1). Therefore, the Alpha variant had the highest impact in Illinois since it is the most populated, among other possible reasons. The AOD impacts on the Delta variant were less severe since lockdown measures were already in place.
As shown in Table 1, there is a good correlation (R2= 0.76 − 0.95) between the mortality rates and the AOD (<0.2) during the Alpha and Delta variants in all states except for the weak or no correlation during the Delta variant in California and the Omicron variant in all states. These positive correlations indicate that aerosols have exacerbated the COVID-19 death rates. The time intervals for each correlation between COVID-19 mortality and AOD for each variant [37,38] are also shown on the x-axis in Figure 5, Figure 6 and Figure 7 (right panels). The slope of the COVID-19 mortality rate per AOD was generally higher during the Delta variant compared to the Alpha variant in North and South Carolina. In Illinois, the slope is much higher for the Alpha variant compared to the Delta variant.

Table 1.
List of correlation parameters between death and AOD (<0.2) for various regions.
Therefore, the AOD anomaly, i.e., the decrease in aerosol levels in N&S Carolina, and the increase in California, during the COVID-19 lockdowns (see Section 3.2) does not have an impact on the correlation between AOD and the mortality rates, which is mainly driven by the ambient aerosol levels during the COVID-19 lockdowns. However, the impacts of the small anomaly in the aerosol concentration on the COVID-19 mortality rates during the COVID-19 lockdown periods might have been masked by other variables, such as different states taking different approaches to contain the spread of the virus.
3.3.2. AOD Dependency of COVID-19 Variants
The diurnal profiles of COVID-19 mortality rates and confirmed cases in North and South Carolina (Figure 5) are quite similar, with coinciding peaks implying the maximum occurrences in each variant. For the Alpha, there are two phases given by the two maxima (see Figure 2), with the second maxima of both the mortality rates and confirmed cases in the Alpha variant being about three times higher than the first one. In the first Alpha phase, the mortality rate reached only about 3 deaths per million population, while it reached up to 10 deaths per million population in January 2021 of the second phase. For the Delta variant, there is only one peak for both confirmed cases and mortality rates. However, the Delta peak is relatively stronger with a broad maximum of 10 deaths per million population. These results demonstrate the higher mortality rate of the Delta variant compared to the Alpha.
Seasonally, the first phase of the Alpha variant occurred during the summer and early fall (March to October), while the second was in the winter (November to February). The AOD profiles follow that of Alpha and Delta, especially during the first phase. In addition, despite the intermittent decrease in AOD compared to the reference period during the summer (mid-July–mid-August, see Figure 3), the AOD level was still significant enough to exacerbate the COVID-19 mortality rates (as in the Delta variant). There are not enough AOD data to cover the entire second phase, which might relate to the higher cloud cover during the winter. The AOD profile follows that of the Delta mortality and confirmed cases, especially for AOD < 0.2. For the Omicron variant, there are two apparent confirmed case peaks, with the first one higher than the second. No apparent variability can be seen in the mortality rate profiles, indicating no significant mortality in response to high infection rates in the first phase.
The correlation between the mortality rate and AOD shows that the split between AOD > 0.2 and AOD < 0.2 in North and South Carolina is not apparent in the Alpha variant as in the Delta variant (Figure 5), still with a positive correlation and a slope of 10.5 ± 0.3. The Delta variant shows a much higher slope (mortality rate/AOD < 0.2) of about 39.6 ± 1.5 (R2 = 0.87) compared to Alpha (slope = 10.5 ± 0.3, R2 = 0.85), while no significant correlation can be revealed for the Omicron BA.2 variant. The higher slope of the Delta variant is due to the higher mortality rate compared to the Alpha variant. The slope (mortality rate/AOD) represents the exacerbated effect of aerosol on COVID-19 mortality rates. These results are also consistent with previous reports showing a direct relation between atmospheric aerosols and COVID-19-related deaths [22,32,39].
The diurnal profiles of the mortality rates and confirmed cases for the Alpha variant are similar to those of North and South Carolina with two maxima during the summer and winter. For the Delta variant, the AOD profile follows that of fatality only for AOD < 0.2, while for AOD > 0.2, there is an inverse correlation. For the omicron variant, there is a very weak positive correlation between mortality rate and AOD.
In contrast to North and South Carolina, the Delta variant in California does not show a strong linear fit compared to Alpha, which as we mentioned earlier might be due to the higher variability in AOD caused by the California wildfires [40]. There is also a very weak correlation between Omicron’s mortality rate and AOD. For AOD > 0.2 in California, there is a negative correlation for the Alpha and Delta variants, which is not apparent in other states where no correlation could be observed for AOD > 0.2 (see Figure 6).
In Illinois, the Delta variant has a lower correlation slope of 28.3 ± 1 (R2 = 0.94) compared to the Alpha at 52.1 ± 1.8 (R2 = 0.78), reflecting a lower mortality rate in the Delta variant. In addition, the correlation between mortality rate and AOD in the Delta variant results in two different slopes, with the positive slope limited to mortality rates of >1.4 deaths per million population, while negative or no correlation was obtained at a mortality rate of <1.4 (see Figure 7). These results are also consistent with AOD correlations with the other variants, since the mortality rates in the Delta variant in North and South Carolina were much higher than in Illinois ranging from about 2 to 9 deaths per million population. Similarly, there was always no correlation in the Omicron variant where mortality rates were below 2 deaths per million population. These results also show that a positive correlation between COVID-19 mortality rates and AOD is limited to a mortality rate of more than ~2 deaths per million population and only for AOD < 0.2. These limitations are due to other factors such as underlying conditions or environmental factors that are beyond the scope of this study but are potential candidates for future research.
3.4. Uncertainties and Limitations
Our analysis is limited geographically to specific regions based on our previous study as outlined in Section 2.3. However, since the results of this study show that the anomaly in AOD is not an apparent factor determining the correlation between aerosol levels and mortality rates, we will consider expanding the study in the future to include more geographic regions. AOD data were missing during several periods, especially during winter and fall seasons due to the high cloud cover. For example, AOD data were missing almost from January to May 2021 and 2022, especially in North and South Carolina and California. AOD data were also missing during the entire BA.1 Omicron phase, for which we did not provide an estimate of the mortality and AOD correlations. Uncertainties in the CDC data include those related to the reported number of cases and deaths [41]. Since not all infections were reported to the CDC, especially in the latter phases of COVID-19 when people were able to do the test at home, this may affect the reported number of cases. However, this uncertainty parameter may not affect our results since we did not use the number of cases to drive our conclusion but rather the number of deaths per million population. The number of deaths is more credible since hospitals report it. However, uncertainties in the number of deaths may arise from the fact that many death cases were associated with other underlying conditions. This analysis shed light on an important aspect of the relation between atmospheric aerosols and public health and that a larger scale study would be recommended to further isolate the causalities of this relation.
4. Conclusions
We investigated the relationship between AOD and daily confirmed COVID-19 cases and death numbers, in three defined regions within the states of California, Illinois, and North and South Carolina, which revealed positive linear correlations for AOD < 0.2 in all regions. In North and South Carolina, the Delta variant was associated with not only a high mortality rate but also a steeper increase in mortality rate per AOD of 39.6 ± 1.5 (R2 = 0.87) compared to Alpha (slope = 10.5 ± 0.3, R2 = 0.85). However, due to the lower mortality rate of the Delta variant compared to the Alpha variant in Illinois, the Alpha variant had a higher slope of 52.1 ± 1.8 (R2 = 0.78) compared to that of 28.3 ± 1 (R2 = 0.94) for the Delta variant. Overall, positive correlation slopes were obtained for AOD < 0.2 and a mortality rate of about 2 deaths per million population or more. The Omicron variant BA.1 had a much higher case fatality rate compared to BA.2, which might be explained by the improved treatment, recovery rates, and safety measures during the BA.2-dominant period. No correlation between mortality rate and AOD was observed for the Omicron variant BA.2 in any of the investigated counties except in California where a weak positive correlation was evident. The results indicate a connection between aerosol particles and COVID-19 infection and death rates, which calls for better sustainable management of environmental mitigation of particulate matters, especially during pandemics.
Supplementary Materials
The following supporting information can be downloaded at: https://www.mdpi.com/article/10.3390/su16083381/s1, Table S1: List of counties in the state of California for which CDC deaths and cases were retrieved; Table S2: List of counties in the states of North and South Carolina for which CDC deaths and cases were retrieved; Table S3: List of counties in the state of Illinois for which CDC deaths and cases were retrieved; Table S4: List of correlation parameters for the case fatality ratio (deaths per number of confirmed cases) and mortality rate per AOD (<0.2) for various regions; Figure S1: Top panel: Mean AOD levels during the reference period (2010–2019); Middle panel: detrended interannual variability (IAV) of the reference period; Bottom panel: Significant relative change (sig Δ) during the lockdown period of the COVID-19 pandemic. Blank areas in the last row (sig Δ) refer to insignificant differences. Adopted from [6]; Figure S2: The selected regions used for the analysis in each state are marked. Adapted from US county maps, 2023. References [4,6,30] are cited in Supplementary Materials.
Author Contributions
Conceptualization, Y.E., S.M. and J.L.S.; methodology, Y.E., S.M. and J.L.S.; software, Y.E. and S.M.; validation, Y.E., S.M. and J.L.S.; formal analysis, Y.E., S.M., L.M. and J.L.S.; investigation, Y.E., S.M. and J.L.S.; resources, Y.E. and S.M.; data curation, Y.E., S.M., L.M. and J.L.S.; writing—original draft preparation, Y.E., S.M., L.M. and J.L.S.; writing—review and editing, Y.E. and J.L.S.; visualization, Y.E., S.M. and L.M.; supervision, Y.E.; project administration, Y.E.; funding acquisition, Y.E. All authors have read and agreed to the published version of the manuscript.
Funding
We acknowledge funding from the USF COVID-19 Rapid Response Grant Program, grant number 100431, the USF Creative Scholarship Grant 2022, and the NSF AGS, grant number 1900795.
Data Availability Statement
No new data were created in this study. Data sharing is not applicable to this article.
Acknowledgments
We thank Christiana Mihaila for her contribution to collecting and analyzing the AOD and COVID-19 data.
Conflicts of Interest
The authors declare no conflict of interest.
References
- CDC. SARS-CoV-2 Variant Classifications and Definitions. Centers for Disease Control and Prevention. 20 March 2023. Available online: https://www.cdc.gov/coronavirus/2019-ncov/variants/variant-classifications.html#anchor_1632158775384 (accessed on 2 February 2024).
- Port, J.; Yinda, C.K.; Avanzato, V.; Schulz, J.; Holbrook, M.; van Doremalen, N.; Shaia, C.; Fischer, R.; Munster, V. Increased aerosol transmission for B. 1.1. 7 (alpha variant) over lineage A variant of SARS-CoV-2. Res. Sq. 2021, 1, 753550. [Google Scholar]
- CDC. Available online: https://data.cdc.gov/ (accessed on 18 September 2023).
- US County Maps. Available online: https://www.mapchart.net/usa-counties.html (accessed on 28 August 2023).
- Zhang, Y.; Chabane, F.; Arif, A. Determining the environmental and atmospheric effects of coronavirus disease 2019 (COVID-19) quarantining by studying the total aerosol optical depth, black carbon, organic matter, and sulfate in Blid. Glob. Health J. 2021, 5, 37–43. [Google Scholar] [CrossRef] [PubMed]
- Elshorbany, Y.; Kapper, H.; Ziemke, J.; Parr, S. The Status of Air Quality in the US during the COVID-19 Pandemic. Remote Sens. 2021, 13, 369. [Google Scholar] [CrossRef]
- Acker, J.; Williams, R.; Chiu, L.; Ardanuy, P.; Miller, S.; Schueler, C.; Vachon, P.W.; Manore, M. Remote Sensing from Satellites; Elsevier: Amsterdam, The Netherlands, 2003; pp. 161–202. [Google Scholar] [CrossRef]
- Després, V.R.; Huffman, J.A.; Burrows, S.M.; Hoose, C.; Safatov, A.S.; Buryak, G.; Fröhlich-Nowoisky, J.; Elbert, W.; Andreae, M.O.; Pöschl, U.; et al. Primary biological aerosol particles in the atmosphere: A review. Tellus B Chem. Phys. Meteorol. 2011, 64, 15598. [Google Scholar] [CrossRef]
- Tellier, R.; Li, Y.; Cowling, B.J.; Tang, J.W. Recognition of aerosol transmission of infectious agents: A commentary. BMC Infect. Dis. 2019, 19, 101. [Google Scholar] [CrossRef] [PubMed]
- Várnai, T.; Marshak, A.; Eck, T.F. Observation-Based Study on Aerosol Optical Depth and Particle Size in Partly Cloudy Regions. J. Geophys. Res. Atmos. 2017, 122, 10013–10024. [Google Scholar] [CrossRef] [PubMed]
- Chang, K.-E.; Hsiao, T.-C.; Tsay, S.-C.; Lin, T.-H.; Griffith, S.M.; Liu, C.-Y.; Chou, C.C.-K. Embedded information of aerosol type, hygroscopicity and scattering enhancement factor revealed by the relationship between PM2.5 and aerosol optical depth. Sci. Total Environ. 2023, 867, 161471. [Google Scholar] [CrossRef]
- Wang, J.; Christopher, S.A. Intercomparison between satellite-derived aerosol optical thickness and PM2.5mass: Implications for air quality studies. Geophys. Res. Lett. 2003, 30, 2095. [Google Scholar] [CrossRef]
- Bai, K.; Li, K.; Sun, Y.; Wu, L.; Zhang, Y.; Chang, N.-B.; Li, Z. Global synthesis of two decades of research on improving PM2.5 estimation models from remote sensing and data science perspectives. Earth-Sci. Rev. 2023, 241, 104461. [Google Scholar] [CrossRef]
- Rudke, A.; Martins, J.; Hallak, R.; Martins, L.; de Almeida, D.; Beal, A.; Freitas, E.; Andrade, M.; Koutrakis, P.; Albuquerque, T. Evaluating TROPOMI and MODIS performance to capture the dynamic of air pollution in São Paulo state: A case study during the COVID-19 outbreak. Remote Sens. Environ. 2023, 289, 113514. [Google Scholar] [CrossRef]
- Venter, Z.S.; Aunan, K.; Chowdhury, S.; Lelieveld, J. COVID-19 lockdowns cause global air pollution declines. Proc. Natl. Acad. Sci. USA 2020, 117, 18984–18990. [Google Scholar] [CrossRef] [PubMed]
- Yu, W.; Thurston, G.D. An interrupted time series analysis of the cardiovascular health benefits of a coal coking operation closure. Environ. Res. Health 2023, 1, 045002. [Google Scholar] [CrossRef]
- Buseck, P.R.; Pósfai, M. Airborne minerals and related aerosol particles: Effects on climate and the environment. Proc. Natl. Acad. Sci. USA 1999, 96, 3372–3379. [Google Scholar] [CrossRef] [PubMed]
- Hassan, M.A.; Mehmood, T.; Lodhi, E.; Bilal, M.; Dar, A.A.; Liu, J. Lockdown Amid COVID-19 Ascendancy over Ambient Particulate Matter Pollution Anomaly. Int. J. Environ. Res. Public Health 2022, 19, 13540. [Google Scholar] [CrossRef] [PubMed]
- Sarmadi, M.; Rahimi, S.; Rezaei, M.; Sanaei, D.; Dianatinasab, M. Air quality index variation before and after the onset of COVID-19 pandemic: A comprehensive study on 87 capital, industrial and polluted cities of the world. Environ. Sci. Eur. 2021, 33, 134. [Google Scholar] [CrossRef] [PubMed]
- Vuorinen, V.; Aarnio, M.; Alava, M.; Alopaeus, V.; Atanasova, N.; Auvinen, M.; Balasubramanian, N.; Bordbar, H.; Erästö, P.; Osterberg, M.; et al. Modelling Aerosol Transport and Virus Exposure with Numerical Simulations in Relation to SARS-CoV-2 Transmission by Inhalation Indoors; Elsevier: Amsterdam, The Netherlands, 2020; p. 130. [Google Scholar] [CrossRef]
- Van Doremalen, N.; Bushmaker, T.; Morris, D.H.; Holbrook, M.G.; Gamble, A.; Williamson, B.N.; Munster, V.J. Aerosol and surface stability of SARS-CoV-2 as compared with SARS-CoV-1. N. Engl. J. Med. 2020, 382, 1564–1567. [Google Scholar] [CrossRef]
- Wu, X.; Nethery, R.C.; Sabath, M.B.; Braun, D.; Dominici, F. Air pollution and COVID-19 mortality in the United States: Strengths and limitations of an ecological regression analysis. Sci. Adv. 2020, 6, eabd4049. [Google Scholar] [CrossRef]
- Chen, L.-W.A.; Chien, L.-C.; Li, Y.; Lin, G. Nonuniform impacts of COVID-19 lockdown on air quality over the United States. Sci. Total Environ. 2020, 745, 141105. [Google Scholar] [CrossRef] [PubMed]
- Zhou, X.; Josey, K.; Kamareddine, L.; Caine, M.C.; Liu, T.; Mickley, L.J.; Cooper, M.; Dominici, F. Excess of COVID-19 cases and deaths due to fine particulate matter exposure during the 2020 wildfires in the United States. Sci. Adv. 2021, 7, eabi8789. [Google Scholar] [CrossRef]
- Ma, R.; Zhang, Y.; Zhang, Y.; Li, X.; Ji, Z. The Relationship between the Transmission of Different SARS-CoV-2 Strains and Air Quality: A Case Study in China. Int. J. Environ. Res. Public Health 2023, 20, 1943. [Google Scholar] [CrossRef]
- John Hopkins Database: US Death. Available online: https://github.com/CSSEGISandData/COVID-19/blob/master/csse_covid_19_data/csse_covid_19_time_series/time_series_covid19_deaths_US.csv (accessed on 11 November 2023).
- Wei, J.; Li, Z.; Peng, Y.; Sun, L. MODIS Collection 6.1 aerosol optical depth products over land and ocean: Validation and comparison. Atmos. Environ. 2019, 201, 428–440. [Google Scholar] [CrossRef]
- Sayer, A.M.; Hsu, N.C.; Lee, J.; Kim, W.V.; Dutcher, S.T. Validation, Stability, and Consistency of MODIS Collection 6.1 and VIIRS Version 1 Deep Blue Aerosol Data Over Land. J. Geophys. Res. Atmos. 2019, 124, 4658–4688. [Google Scholar] [CrossRef]
- Hsu, C.; Sayer, A.M.; Bettenhausen, C.; Carletta, N.; Jeong, M.J.; Lee, J.; Kleidman, R. Collection 6 e-Deep Blue/Dark Target Comparison and ‘Merged’ Aerosol Products; MODIS Atmospheres Webinar Series; Wiley: Hoboken, NJ, USA, 2019. [Google Scholar]
- Cantrell, C.A. Technical Note: Review of methods for linear least-squares fitting of data and application to atmospheric chemistry problems. Atmos. Meas. Tech. 2008, 8, 5477–5487. [Google Scholar] [CrossRef]
- Jin, J.; Henzing, B.; Segers, A. How aerosol size matters in aerosol optical depth (AOD) assimilation and the optimization using the Ångström exponent. Atmos. Meas. Tech. 2023, 23, 1641–1660. [Google Scholar] [CrossRef]
- Zhou, F.; Yu, T.; Du, R.; Fan, G.; Liu, Y.; Liu, Z.; Xiang, J.; Wang, Y.; Song, B.; Gu, X.; et al. Clinical course and risk factors for mortality of adult inpatients with COVID-19 in Wuhan, China: A retrospective cohort study. Lancet 2020, 28, 1054–1062. [Google Scholar] [CrossRef] [PubMed]
- Wu, N.; Joyal-Desmarais, K.; Ribeiro, P.A.B.; Vieira, A.M.; Stojanovic, J.; Sanuade, C.; Yip, D.; Bacon, S.L. Long-term effectiveness of COVID-19 vaccines against infections, hospitalisations, and mortality in adults: Findings from a rapid living systematic evidence synthesis and meta-analysis up to December, 2022. Lancet Respir. Med. 2023, 11, 439–452. [Google Scholar] [CrossRef] [PubMed]
- JHUM (John Hopkins University of Medicine). Available online: https://coronavirus.jhu.edu/data/mortality (accessed on 25 September 2023).
- Mathieu, E.; Ritchie, H.; Rodés-Guirao, L.; Appel, C.; Giattino, C.; Hasell, J.; Macdonald, B.; Dattani, S.; Beltekian, D.; Ortiz-Ospina, E. Max Roser—“Coronavirus Pandemic (COVID-19): Mortality Risk of COVID-19”. 2020. Available online: https://ourworldindata.org/coronavirus (accessed on 2 February 2024).
- Darquenne, C. Aerosol Deposition in Health and Disease. J. Aerosol Med. Pulm. Drug Deliv. 2012, 25, 140–147. [Google Scholar] [CrossRef]
- Lauring, A.S.; Tenforde, M.W.; Chappell, J.D.; Gaglani, M.; Ginde, A.A.; McNeal, T.; Ghamande, S.; Douin, D.J.; Talbot, H.K.; Casey, J.D.; et al. Clinical severity of, and effectiveness of mRNA vaccines against, covid-19 from omicron, delta, and alpha SARS-CoV-2 variants in the United States: Prospective observational study. BMJ 2022, 376, e069761. [Google Scholar] [CrossRef]
- Wang, L.; Kainulainen, M.H.; Jiang, N.; Di, H.; Bonenfant, G.; Mills, L.; Currier, M.; Shrivastava-Ranjan, P.; Calderon, B.M.; Sheth, M.; et al. Differential neutralization and inhibition of SARS-CoV-2 variants by antibodies elicited by COVID-19 mRNA vaccines. Nat. Commun. 2022, 13, 4350. [Google Scholar] [CrossRef]
- Damasceno, R.M.; Cicerelli, R.E.; de Almeida, T.; Requia, W.J. Air Pollution and COVID-19 Mortality in Brazil. Atmosphere 2022, 14, 5. [Google Scholar] [CrossRef]
- Darling, R.; Hansen, K.; Aguilera, R.; Basu, R.; Benmarhnia, T.; Letellier, N. The Burden of Wildfire Smoke on Respiratory Health in California at the Zip Code Level: Uncovering the Disproportionate Impacts of Differential Fine Particle Composition. GeoHealth 2023, 7, e2023GH000884. [Google Scholar] [CrossRef] [PubMed]
- Halpern, D.; Lin, Q.; Wang, R.; Yang, S.; Goldstein, S.; Kolak, M. Dimensions of uncertainty: A spatiotemporal review of five COVID-19 datasets. Cartogr. Geogr. Inf. Sci. 2021, 51, 200–221. [Google Scholar] [CrossRef]
Disclaimer/Publisher’s Note: The statements, opinions and data contained in all publications are solely those of the individual author(s) and contributor(s) and not of MDPI and/or the editor(s). MDPI and/or the editor(s) disclaim responsibility for any injury to people or property resulting from any ideas, methods, instructions or products referred to in the content. |
© 2024 by the authors. Licensee MDPI, Basel, Switzerland. This article is an open access article distributed under the terms and conditions of the Creative Commons Attribution (CC BY) license (https://creativecommons.org/licenses/by/4.0/).