Article

Repair and Reuse or Recycle: What Is Best for Small WEEE in Australia?

School of Engineering and Built Environment, Griffith University, Nathan Campus, Nathan, QLD 4111, Australia
*
Author to whom correspondence should be addressed.
Sustainability 2024, 16(7), 3035; https://doi.org/10.3390/su16073035
Submission received: 1 March 2024 / Revised: 28 March 2024 / Accepted: 3 April 2024 / Published: 5 April 2024
(This article belongs to the Collection Waste Management towards a Circular Economy Transition)

Abstract

:
The global and Australian trends indicate a steady increase in the generation of small waste electrical and electronic equipment (WEEE), constituting 30% of global WEEE in 2019 with an expected 90% increase in Australia over the next 25 years. Given this fact, identifying the most suitable circular economy strategy is vital in managing this waste stream. Hence, followed by a review of the literature, a model was developed to assess the suitability of repair, reuse, and recycling of small electrical and electronic equipment (EEE) by considering the lifespan and products put on the market (PoM) as critical variables. Findings indicate that solely repairing and reusing products, without reducing PoM small EEE, minimally affects short-term waste reduction. A synergistic approach, combining high product reuse with reduced PoM small EEE, is essential to decrease small WEEE generation significantly. Regardless of lifespan changes, the study indicates a proportional relationship between small WEEE generation rates and PoM small EEE changes, emphasising the need for a holistic strategy. Considering this, within stewardship schemes, the primary focus should initially lie on repairing and repurposing small EEE, with the potential for expansion into recycling once sufficient infrastructure and achievable recovery goals are established. Original equipment manufacturers (OEMs) must shoulder substantial accountability, with a firm commitment to extended producer responsibility (EPR) even for historical products. The initial rollout could target four specific categories: toys, food preparation equipment, vacuum cleaners, and household tools, with the scope widening to encompass all categories following successful implementation.

1. Background

The management of waste electrical and electronic equipment (WEEE) has been receiving more attention in recent years due to the global increase in devices powered by batteries and electrical supplies. Due to the wide variety of these products, concentrations of materials vary. Potential contaminants like Cd, Cu, Ni, and Pb pose a greater environmental risk even though they can be removed during waste management. Hazardous substances such as polybrominated diphenyl ethers (PBDEs), which serve as flame retardants, are commonly found in electrical and electronic equipment (EEE). When there are no chemical bonds between PBDEs, they can leach into the environment during long-term use and storage [1]. Hence, efficient waste management systems can keep the materials circular while satisfying consumer needs [2].
Global WEEE generation rates are rising, and they will grow to 74.7 Mt by 2030, around a 40% increase from 2019 [3]. Higher consumption rates and shorter lifespans are fuelling these values, and a smaller focus is on responsible consumption. Furthermore, recycling, at a lower stage of the waste management hierarchy, is also hindered due to the drawbacks of collection mechanisms and inefficient preprocessing techniques [4]. Hence, 64% of the total transboundary movements of WEEE are uncontrolled, which are usually mixed with other legal shipments, including used EEE. The flow is from high-income to middle- and low-income countries due to the commercial demand for used EEE in developing countries. In addition, the reduction in costs for domestic WEEE management and the location of original equipment manufacturers (OEMs) are two other driving factors of the exports [5]. However, up to one-third of EEE are broken upon arrival, and they usually end up in landfills due to the lack of proper WEEE management infrastructure [6,7,8]. A proactive approach is needed when managing WEEE to drive businesses towards sustainability by following a lifecycle approach focusing on the entire lifespan of electronic products, from their inception and production to their disposal and potential recycling or reuse. Manufacturers should design durable EEE so that consumers can opt for products with longer lifespans. Regulatory bodies can enact policies and regulations focusing on extended producer responsibility (EPR). End-of-life (EOL) management stakeholders can follow these standards, while environmental and advocacy groups can raise awareness and promote eco-friendly practices [9].
Given this, product circularity is essential, as global circularity has declined to 7.2% in 2022 from 9.1% in 2018 [10]. A closed loop can be created by applying circular economy (CE) principles and deviating from the traditional linear economy. CE represents a production and consumption mode that maximises repair, reuse, and recycling while leading to the lifecycle extension. The aim is to create a closed loop with an integrated system of industrial processes and natural systems. This approach extends over the usual damage reduction, harmonising the coexistence of economic growth and environmental protection [11]. The concept of CE was also contributed to by various design and economic concepts like spaceman economy, steady-state economy, industrial ecology, and cradle-to-cradle designs. Among these concepts, cradle-to-cradle design stands out as a way to address the issues of resource scarcity. However, despite the rapid technological developments, designing for repair and reuse has yet to be noticed [12]. In most developed nations, purchasing a new product is more feasible than repairing it due to high labour costs. In contrast, most developing economies tend to repair and reuse products, even sometimes neglecting safety impacts.
Repair and reuse often reduce EEE replacement rates, leading to a reduction in WEEE generation rates. Decisions on repairing and reusing a certain EEE depend on various factors, including energy efficiency [13], types of repair [14], aesthetic appearance of the repaired product [15], consumer perception of using repaired EEE [16,17], efficiency of reusing mechanisms [18], and the ease of disassembly of the original products [19]. In addition, several studies have investigated the environmental impact of repair and reuse of EEE by considering lifetime extension using lifecycle assessment [13,20,21,22]. These studies focused on products like washing machines, laptops, vacuum cleaners, and smartphones. However, articles that compared results among different categories were limited in the literature [23,24]. Even though repair and reuse delay waste generation, recycling is essential to diverting the WEEE from landfills, as it will extract raw materials required to manufacture new EEE. The quality of recycled materials, energy intensity for the treatment process, and transportation costs are the most common factors in the decision to opt for WEEE recycling [25]. In addition, the diversity of the products in terms of size and material composition has forced the recycling plants to focus on certain products, including most white goods, such as laptops, screens, and mobile phones.
Given the above facts, this study was designed to analyse the current status and feasibility of repair and reuse vs. recycling of small WEEE, a subcategory of WEEE, which accounted for more than 30% of WEEE generated globally during 2019 [3]. Furthermore, Australia was selected as the geographical location for this study as it is one of the largest WEEE generators in the world. In 2019, WEEE generation in the country was 21.7 kg per capita, three times higher than the global average of 7.3 kg per capita [3]. However, recycling and reusing are often used to lessen the guilt of this overconsumption [26], which the manufacturers usually promote to increase profits.

2. What Is Small EEE?

EEE consists of various equipment and appliances that require classification to maintain consistency in waste management mechanisms. Typically, products are sorted based on their comparable functions, material compositions, and potential end-of-life purposes. Moreover, uniform average weights and lifespans are also factors to consider. However, due to the high product diversity, analysis of various parameters during categorisation often needs to be more manageable. For example, microwave ovens can be considered a large EEE in some countries, and in other regions, they fall under small household appliances. These inconsistencies create issues when comparing WEEE data globally. Given this background, United Nations University (UNU) developed a classification known as UNU-keys linking harmonized statistical (HS) codes, which are used globally. This classification aligns with the European Union WEEE Directive 2012/19/EU, which was also amended by Directive 2018/849 [27]. Currently, there are six categories, namely,
  • Large equipment.
  • Temperature exchange equipment.
  • Small equipment.
  • Small IT and telecommunication equipment.
  • Screens, monitors, and equipment containing screens having a surface greater than 100 cm2.
  • Lamps.
However, in the Australian context, this was expanded into eight categories by the recent discussion paper published by the Department of Agriculture, Water and Environment (DAWE) (now known as the Department of Climate Change, Energy, the Environment and Water) [27]. This new categorisation was performed mainly to incorporate appliances with stewardship schemes such as the National Television and Computer Recycling Scheme (NTCRS) for Televisions and Computers and Mobilemuster for mobile phones. These categories are as follows:
  • Solar PV and battery storage.
  • TV and computing equipment.
  • Mobile phones.
  • Lighting equipment.
  • Large household appliances.
  • Temperature exchange equipment.
  • Other small equipment (considered as sWEEE in this study).
  • Other large equipment.
Even though small EEE was identified as a separate category both globally and locally, some of the UNU-keys considered were different in the above references. For instance, certain electronic products categorised as small IT equipment within the WEEE Directive were also classified as small EEE in Australian discussion papers. Luminaries, which are small EEE according to the WEEE Directive, are considered lighting equipment in Australia. Hence, the authors selected the following products as small EEE for this study to maintain a specific consistency, including 17 UNU-keys, as shown in Table 1.

3. Status of Repair and Reuse of Small WEEE

Repair and reuse are two interconnected concepts within the waste management hierarchy. Reuse is usually considered an act of using EEE to delay their disposal as waste [28]. It is associated with obsolete EEE, which can be functional or dysfunctional. Functional EEE becomes obsolete when consumers lose interest in and opt for a new product, primarily due to the advancement of technology [29]. If the other users are interested, these EEE can be reused after some refurbishment. However, dysfunctional EEE should be repaired before reuse, and some small EEEs with low economic value have higher reuse potential [30].
In the current global context, the promotion of repair and reuse of small EEE is hindered due to several barriers. Producer resistance is a significant barrier as OEMs design products to support recycling rather than reuse since recycling collection is much easier, quicker, and more profitable [31]. A recent study on vacuum cleaners has confirmed that most of them fail due to wearing carbon brushes in motors, which are not easily replaceable. However, using inverter motors instead of these traditional ones can create a longer motor lifespan even though it is rare, confirming that product designs are more recycling-intended, leading to early obsolescence of products [32]. In most European countries, around 30% of the disposed EEEs are reusable with or without a repair [33]. A study conducted in the UK showed that consumers often opt for newer microwave ovens due to the lack of manufacturer support. This study indicated that barriers to repair and reuse are associated with product design and undeveloped secondhand markets rather than the quality of discarded items or the cost of spare parts. It was also noted that the desire for new technology does not drive the WEEE generation, as most consumers were opting to buy a similar product [15]. In Sweden, around eight tons of small EEE are incinerated together with household waste annually; since most OEMs deliberately shorten the lifespan of EEE to drive profits from increased sales, consumers often prefer not to use old functioning EEE as new alternatives are readily available [34].
Consumer attitudes also play a significant role. If they were not adequately educated and supplied with repairability and reusability information, new products would be purchased without any concern about the old small EEE. Most consumers are willing to purchase secondhand EEEs because they are of good quality and usability, have minimal health and safety risks, and have appealing aesthetics. A recent study conducted in the EU indicated that around 45% of the citizens will buy EEE on a secondhand basis [35]. This was further confirmed by a study conducted in France where 85% of 1000 respondents indicated that a lifestyle change is needed due to environmental concerns, which resulted in a more significant commitment to reuse products [26]. In another study conducted in Spain, older consumers were more prone to purchase secondhand EEE [36]. Apart from willingness, the reusability of such products also drives these circular behaviours. A study conducted in the UK indicated that the reusability of stockpiled small EEE is high, which has a good economic potential in the market [37]. Hence, if the consumers are willing, plenty of reusable small EEEs are available in the market for them to use.
However, high repair costs, usually greater than the replacement costs, are often the most common barrier to promoting reuse for small EEE [38,39]. In most cases, the cost of spare parts is 40% of the total repair costs [40] and encouraging self-repair, which is more applicable for small EEE, will reduce the repair costs for the users. However, functional small EEEs are still disposed of, and it is recommended that WEEEs be transferred to testing and maintenance centres to check the possibility of secondhand use with or without repairing the product [41]. Direct transfer from collection to recycling centres would avoid this opportunity.
Similar to the global context, small EEE in Australia are often sent to recycling plants or landfills due to the lack of an established repair market [42]. Low-quality materials have reduced the life expectancy [39] of these products, encouraging consumers to dispose of them without even attempting to repair them. According to a CHOICE customer survey, 85% of Australians stated that they expect the products to be durable, and the repairability of the product has been a critical decider when selecting a product for most of these consumers [43].
Except in Queensland, other Australian states allow unlicensed individuals to repair low-voltage household EEE, which encourages consumers to self-repair products if feasible. The repairs can be performed in households, at the manufacturing plant, or an authorised repair shop. In Australia, small EEE like toasters and blenders are often replaced after their first fault, while vacuum cleaners and power tools have a higher tendency to be repaired [43]. However, for some small EEE-like watches, manufacturers refuse to supply repair equipment and spare parts, which hinders the repair process even if the consumers want it [42]. Further, the repair cost for a vacuum cleaner lies between AUD 50 and 100, and sometimes the same for a two-slice toaster [42], even though the replacement price for a vacuum cleaner is much higher than the toaster. [43]. However, a recent study indicated that even for a vacuum cleaner, repair is beneficial only for frequent users, while replacement is more suitable for occasional users [13]. In Australia, secondhand EEE in working order have some options, such as dropping them off at a charity shop, which has the capability of testing, private online sale via social media, or it even selling to companies who specialise in refurbishing and reselling [43].
Community interest in circularity initiatives like repair and reuse is also growing in the country, and the repair cafes and tool libraries support these by providing free to low-cost solutions to increase the lifespans of the products [43]. At present, the Internet of Things (IoT) is revolutionising the small EEE, which affects the buying patterns of consumers as they often want everything to be connected over the Internet [44]. However, with the planned obsolescence strategies like making software diminish product performance, repair and reuse of these products can cause a further downfall. In addition, structural weaknesses and component connectivity using glue, which makes the disassembly challenging, also hinder easy repair, especially for small EEE [42].

4. Status of Recycling Small WEEE

Recycling mechanisms strongly depend on the material composition of the waste [45]. In the case of small WEEE, metals and plastic are dominant materials in deciding the treatment techniques at the recycling plants [46]. While metals are present in most printed circuit boards, motors, and other electrical and electronic components, plastic is mostly used to house small appliances [47]. Types of plastics also vary, and, in general, small EEE has around 13 types of plastics, including flame retardants [48]. Since recycling efficiencies are usually assessed based on the mass of the recovered materials, which does not give broad attention to the quality of the material, these sub-material types are not much of a concern for plastic. It is usually the other way around for metals, where copper, silver, and gold tend to have higher recycling rates than ferrous metals [49]. However, to identify the exact material composition, strong communication between the OEMs and recycling plants needs to be improved for small WEEE. Some past studies have tried implementing radio frequency identification (RFID) mechanisms to address this issue. However, it has been ineffective due to the low reading ranges in small EEE [50].
Pretreatment and dismantling also play a significant role in achieving higher recycling rates. Following this, some Austrian pretreatment sites improved the separation processes to achieve higher recycling rates (more than 80%). However, it was noted that the costs of adding and improving better separation techniques tend to outweigh the extra revenues generated from the recycled materials. Even with these high recycling rates, the difference between the amount recycled and the actual material introduced to the market highlights that other waste reduction strategies should be prioritised alongside recycling efforts [47]. Another factor that hinders recycling efficiencies is the drawback in collection mechanisms, creating less input waste for the treatment processes of recycling plants [4]. This is common for small WEEE, and researchers have often suggested focusing more on this category in future reverse logistics [51]. Despite this, countries like Japan [52] and Canada [53] have achieved higher recycling rates (more than 90%) for small WEEE in recent years due to their efficient collection programmes. A recent study conducted in the EU indicated that information regarding the recycled material used in the product, parts which can be recycled, and recycling processes and centres should be indicated during sales as responsible consumers often look for this information [26].
In the Australian context, domestic recycling usually includes dismantling, shredding, and other pretreatment processes [54]. Due to the lower demands for recycled material and the higher expenditures that may occur due to full-scale recycling [55], most of the WEEE is exported to countries like China [56]. While large WEEE like televisions and computers have a higher recycling rate, small WEEE has a meagre rate as most end up in landfills. A study conducted in Western Australia confirmed this by indicating that only 3% of the small WEEE is currently sent to recycling plants [57]. However, due to the lower rate of the recoverable values of small WEEE, the existing recycling mechanisms are driven mainly by the base metals [54].

5. Materials and Methods

Given the above facts, this study is necessary to identify which circular economy aspect should focus more on small WEEE. According to the waste hierarchy, repair and reuse is always preferred over recycling. The impact of lifespan extension through repair and reuse on waste generation rates, which subsequently influence recycling behaviours, varies depending on the product type. However, reliable data concerning small EEE often need to be improved. As outlined in preceding sections, prevailing decision-making processes predominantly emphasize recycling, driven by behavioural and economic considerations. Nevertheless, these approaches do not offer direct insights into their effects on small WEEE generation rates. Hence, to address this issue, a small WEEE generation model was developed to identify the impact of repair and reuse on waste generation rates and recycling. The coming sections discuss in detail how this was performed, and, as far as the authors know, this is the first model developed for small WEEE in Australia. The Python programming language was used to develop the model. The Python code utilized a range of powerful libraries and methods for data analysis, visualization, and web application development. “Pandas” and “NumPy” were employed for efficient data manipulation and numerical computing, while SciPy’s gamma function aided in specialized mathematical calculations. Plotly’s graph objects facilitated the creation of interactive visualizations, and “Dash” was used to construct the web application framework. Dash’s components, including DCC for interactive elements and HTML for HTML elements, helped design the application layout. Callback functions were implemented to update the application’s content based on user interactions dynamically. Overall, the code elegantly integrated these tools to develop a user-friendly web application for exploring and analysing small WEEE generation rates with variable lifespan and PoM small EEE changes.

5.1. Modelling Technique

Estimating the future WEEE generation rates is vital to obtain information when deciding the suitable options for WEEE management. According to the referenced academic publications [58,59], only two studies were conducted for Australia, despite being one of the largest WEEE generation nations in the world [60]. In addition, the authors were able to refer to three additional models developed recently by private consultants for the Australian Government [46,57,61]. To the authors’ knowledge, no other models had been developed for the country, even though it was a widely researched area globally. Overall, material flow analysis (MFA) was the widely used method in modelling these figures, among other techniques like market supply, Stanford, Carnegie Mellon, and time step methods [59]. There are two types of MFA techniques in use: dynamic and static. The first method includes long time series data, while the second estimates a single year. Dynamic MFA provides more in-depth understanding, which is essential for policymakers. When considering WEEE generation estimation, there are two types: stock-based modelling and sales-stock-lifespan-based modelling. A stock-based model can be utilised when large-scale consumer surveys and national statistics are available. The second model utilizes actual EEE sales, which are later coupled with a lifespan distribution to predict future WEEE quantities. Hence, given the above, dynamic MFA based on the sales-stock-lifespan-based model was used in this study to estimate small WEEE generation rates for Australia [62].

5.2. Key Variables

Given the behavioural aspects, modelling WEEE generation rates is a sensitive task that depends heavily on two variables: lifespan and the number of products in the market. The lifespan of a product is considered as the period in which a particular product stays in use and the stock from the date it has been purchased until the date it has been disposed of [63]. This may include the repairing and reusing of the products as well. Usually, for large EEE like refrigerators and laptops, lifespan extension is preferred due to the high prices, even though the development of product lifespan extension strategies is still in progress. However, for a given product, lifespan varies due to consumption patterns, and reliable lifespan data are rarely available in the literature [64]. This is consistent with a study conducted in the European Union, as some consumers expect the lifespan of vacuum cleaners to be between 4 and 7 years while another group expect it to last between 7 and 10 years [26]. Hence, for most of the small EEE, this is often the case as they are disposed of as waste usually before the end of life.
When modelling WEEE generation rates, lifespan is defined in two main ways during modelling. Fixed average lifespans are utilized in most studies except MFA, which often overlooks EEE’s dynamic nature [of] obsolescence [65]. Studies utilising the Stanford, Carnegie Mellon, and time step methods have considered fixed average lifespans [1,66]. To avoid the possible confusion and inaccuracies, these methods were not considered in this study. This was also recommended by the current WEEE generation models for Australia [59]. The dynamic nature of the lifespan of small EEE can often be modelled by the Weibull distribution function, which considers the gradual failure rates based on the average lifespans. All the previous models for Australia have followed this method in their dynamic MFA models. However, these models utilised the lifespan distributions estimated by the United Nations University (UNU) for the non-European countries, which may not represent the actual discarding patterns [63]. UNU guidelines indicate that the average lifespan of a coffee machine and a microwave would be around 7.2 and 15.9 years, respectively.
In contrast, a commercial guide on the web indicates that these values are two (72% reduction) and nine years (44% reduction) for Australia [67]. However, due to the nonexistence of consumer surveys on small EEE usage patterns, the authors used the available data and the methodology published by UNU to develop lifespan profiles for small WEEE. Given the stability of the above products, it was assumed that the time-dependent lifetimes describe the actual behaviour with negligible variations for shape and scale parameters. Hence, the product lifetime function was simplified to the following equation:
L p t , n = α β α ( n t ) α 1 e ( n t β ) α
where
  • α —shape parameter.
  • β —scale parameter.
  • n —evolution year.
  • t —historical year.
  • L p t , n —lifespan of the small EEE.
To perform these operations in the mathematical model, the maximum lifespan of the products was assumed to be 30 years and the values were prorated to obtain the cumulative failure rate as 1 (Figure S1). This method was also confirmed by the E-Stewardship model developed for Australia [46].
The following critical variable affecting the WGR of small EEE is the weight of the electronic items on the market ( P o M t ). The apparent consumption method was used to calculate this figure for a particular year based on the UNU guidelines following Equation (2) [63], which considers domestic productions ( D o M t ), imports ( I t ), and exports ( E t ).
P o M t = D o M t + I t E t
Based on the literature, small EEEs usually require less innovation, which can be produced with low-skilled labour, which leads to lower wages [68]. Hence, Australian EEE manufacturers find it difficult to compete with their Asian competitors, which has led to a negligible domestic production of small EEE in Australia [61]. Hence, the equation was simplified to Equation (3).
P o M t = I t E t
The import data for the relevant HS codes were extracted by the UN Comtrade database from 1992–2022. The data were checked for inconsistencies and mismatches before using them for the model. This was mainly due to the discontinuation of some HS codes (851921, 851929) and the introduction of new ones (910299, 910519). However, only minor discrepancies were noticed, and they were corrected by considering the ratios between average monetary values and the average weights of the nearby years. This method was also followed by the recent E-Stewardship model developed for Australia [46]. In addition, to obtain the exact weight of the equipment, 38.10% was allocated for the packaging content, as recommended by the European Committee of Domestic Equipment Manufacturers [69]. Export data were also extracted following the same assumption even though they were not considered by recent academic publications [58,59]. Then, using Equation (3), PoM small EEE from 1992 to 2022 was calculated (Figure S2).
According to the UNU guideline [63], sales data ( P o M t ) are more sensitive than lifespan values. Hence, selecting an appropriate forecasting technique is crucial to obtain accurate estimations. According to the UNU guideline, sophisticated extrapolation methods were suggested to forecast data using PoM small EEE and purchasing power parity (PPP) ratios. Since an exact technique was not suggested, the literature was consulted to identify a suitable method. It was noted that in stock-based models, logistic regression was widely applied [70,71] to predict household EEE possession. Linear regression was applied in a sales-based study conducted in Denmark [72] and China [73], where another study predicted the future sales for Australia based on the per capita EEE possession [58]. In addition, Halt’s double exponential smoothing was also used to forecast WEEE generation rates [59], an underutilized method in the literature. Hence, none of these studies utilized the technique given by the UNU guideline.
Furthermore, these studies have yet to consider the effect of population growth on PoM small EEE. Since product sales depend on consumer behaviour, it can be assumed that they increase with population growth [59]. Hence, without directly forecasting the future PoM, authors used the existing PoM small EEE per capita to forecast the future ratios, which were then used to calculate the PoM small EEE in the coming years using the forecasted population data provided by the Australian Bureau of Statistics.
Before selecting the suitable forecasting technique, PoM’s small EEE per capita from 2010 to 2022 was checked for any linear relationship in the above 17 categories. However, none of the categories showed a linear relationship with a satisfactory R-squared value, which omitted the possibility of a linear regression model. Hence, as suggested in the literature, exponential smoothing techniques were applied to model the forecasts. Initially, time series decomposition was applied to observe the trend and seasonality patterns of the PoM small EEE. Since there was no seasonality present in any of the data, additive double exponential smoothing (DES additive) was used to forecast until 2050. This was proved to have good precision according to the literature [74], which has also been used to estimate the WGR of WEEE in the literature [59]. Following the DES additive method, PoM small EEE ( P o M f t + 1 ) for the year t + 1 was obtained using Equations (4)–(6), where L t , T t gives the level and trend component of the data, which are associated with parameters α ,   β , respectively.
P o M f t + 1 = L t + T t
L t = α P o M t + ( 1 α ) ( L t 1 + T t 1 ) ;   0 < α < 1 ;   t = 2022 , 2023 , 2050
T t = β ( L t L t 1 ) + ( 1 β )   T t 1 ;   0 < β < 1 ; t = 2022 , 2023 , 2050
Equation (5), which indicates the level component for the year t , follows simple exponential smoothing, while the trend component in Equation (6) considers the slope of the previous data point and the difference between two levels, which results in both level and slope linearly increasing data. Hence, it is expected to capture the forecast more accurately than simple linear regression. The Python code in this analysis comprised various libraries and methods for time series analysis, forecasting, evaluation, and visualization. It utilized the “ExponentialSmoothing” function from the “statsmodels.tsa.holtwinters” module to fit a Holt–Winters model to the data. This model was used to forecast future values of PoM small EEE in kilograms per capita. The “mean_absolute_error” and “mean_squared_error” functions from “sklearn.metrics” were used to calculate the mean absolute error (MAE) and mean squared error (MSE) for the fitted values, providing insights into the model’s accuracy. The “matplotlib.dates” module facilitated the customization of date-based plots, allowing for clear visualization of observed, fitted, and forecasted PoM values over time. Additionally, descriptive statistics were printed for the forecasted data, and the results of the evaluation metrics for the fitted values were displayed. The code seamlessly integrated these tools to perform time series forecasting and evaluation, providing valuable insights into PoM small EEE trends. This resulted in a dataset for PoM small EEE from 1992 till 2050. Some of the PoM small EEE forecasts are indicated in Figure S3.
Then, using the lifespan profiles and current and forecasted PoM small EEE (Figure S4), small WEEE generation rates were calculated using Equation (7).
W G R   s m a l l   W E E n = t = 1992 n P o M t × L ( p ) ( t , n )
After calculating the WGR rates of small EEE, the effect of repair and reuse on these rates was modelled by changing different parameters. According to the above equations, lifespan and PoM small EEE are the two main variables that affect the WGR. When the small EEE are being repaired and reused, their lifespan is extended, and, in this study, the average lifespan was increased by various percentages to model this effect. In addition, the average lifespan also decreased to model the early obsoletion. Since this lifespan variation cannot be applied to the model from the beginning, the year the change is applied was also changed. In addition, the authors also assumed that 100% repair and reuse is an improbable scenario, and the percentage EEE in which the lifespan changed was also varied.
In summary, the change in lifespan, the year in which the change was applied, and the percentage of small EEE affected by this change are the three primary parameters that were varied initially. Since the repair and reuse of early obsolescence should impact PoM small EEE, the percentage PoM was also varied while changing the applied year simultaneously. Hence, altogether, five parameters were varied to check the impact of repair and reuse on small EEE.
The material composition of different small EEE is also crucial in analysing the feasibility of recycling. As indicated in Figure 1, toys have a higher plastic content, while microwaves have the highest Fe content among these different products. Hence, due to the dynamic nature of small WEEE generation, effect of repair and reuse on recycling was also evaluated by using the material composition of the small EEE categories.

6. Results and Discussion

6.1. Baseline Model

Based on the estimation models, the small WEEE generation rates were projected until 2050, as shown in Figure 2 (percentage distribution is indicated in Figure S5). The current trend suggests that the rates of small WEEE generation will surge by 90% over 25 years, reaching 368 kt/yr in 2050 from 197 kt/yr in 2025. This increase is primarily attributed to the increased consumption rates of small EEE. However, the investigation of the 17 categories individually reveals a declining trend in WGR for UNU Keys 0201 (clocks, watches, irons, and fans), 0402 (portable AV), and 0404 (video players). This decline is mainly due to the anticipated reduced production of these specific types of small EEE in the future. This was further confirmed by another recent study conducted for Victoria [61]. This trend is substantiated by the observation that EEE falling under these UNU Keys, such as portable MP3 players and DVD and Blu-ray players, are already deviating from the prevailing trend and are being replaced by more advanced EEE belonging to different WEEE categories.
Conversely, toys (UNU Key 0701) consistently contribute the most significant proportion to WGR annually, accounting for over 30% annually. This matches the global data as a recent report published by UNU indicated that more than 30% of the invisible WEEE, which is a subcategory of small WEEE, comes from toys [75]. Following closely are food preparation EEE (UNU Key 0202) and household tools (UNU Key 0601), each constituting 10% of WGR. This pattern also aligns with the increasing production rates for these categories.
Furthermore, the Sankey diagram (Figure 3) for small WEEE reveals that plastics will be the primary contributor, followed by Fe, Cu, and Al, excluding other uncategorized materials. Due to the elevated waste generation rate (WGR) of toys, it emerges as the major contributor to plastic waste, while microwaves (UNU Key 0114), clocks, watches, irons, and fans (UNU Key 0201), as well as food preparation EEE (UNU Key 0202), account for the majority of Fe in small WEEE.
Valuing small WEEE based on material prices indicates that toys are expected to have the highest valuation, reaching approximately AUD 250 million by 2050, based on 2021 rates (Figure S6). The substantial plastic content primarily influences the valuation of these items. This was also confirmed in another study conducted for Australia showing that plastics are one of the significant resources which generate a higher amount of recycling content [59]. However, if we disregard the plastic content, the material prices of toys decrease to only AUD 50 million in 2050. Vacuum cleaners and food preparation EEE rank as the second and third highest contributors, with an estimated value ranging from AUD 60 to 75 million, inclusive of the price of plastics.
Directing attention toward the qualitative dimensions of repair and reuse, a prevailing notion is that small WEEE generation rates could be substantially reduced through product reuse. However, it is also anticipated to have repercussions on recycling processes, as the material input into recycling plants is expected to decrease. While in an ideal scenario, repair and reuse could prevent waste generation, potentially leading to the closure of recycling plants, this is an impractical trend unlikely to occur. Therefore, an equilibrium must be maintained between repair, reuse, and recycling to reduce the small WEEE generation rates without adversely impacting recycling economics.

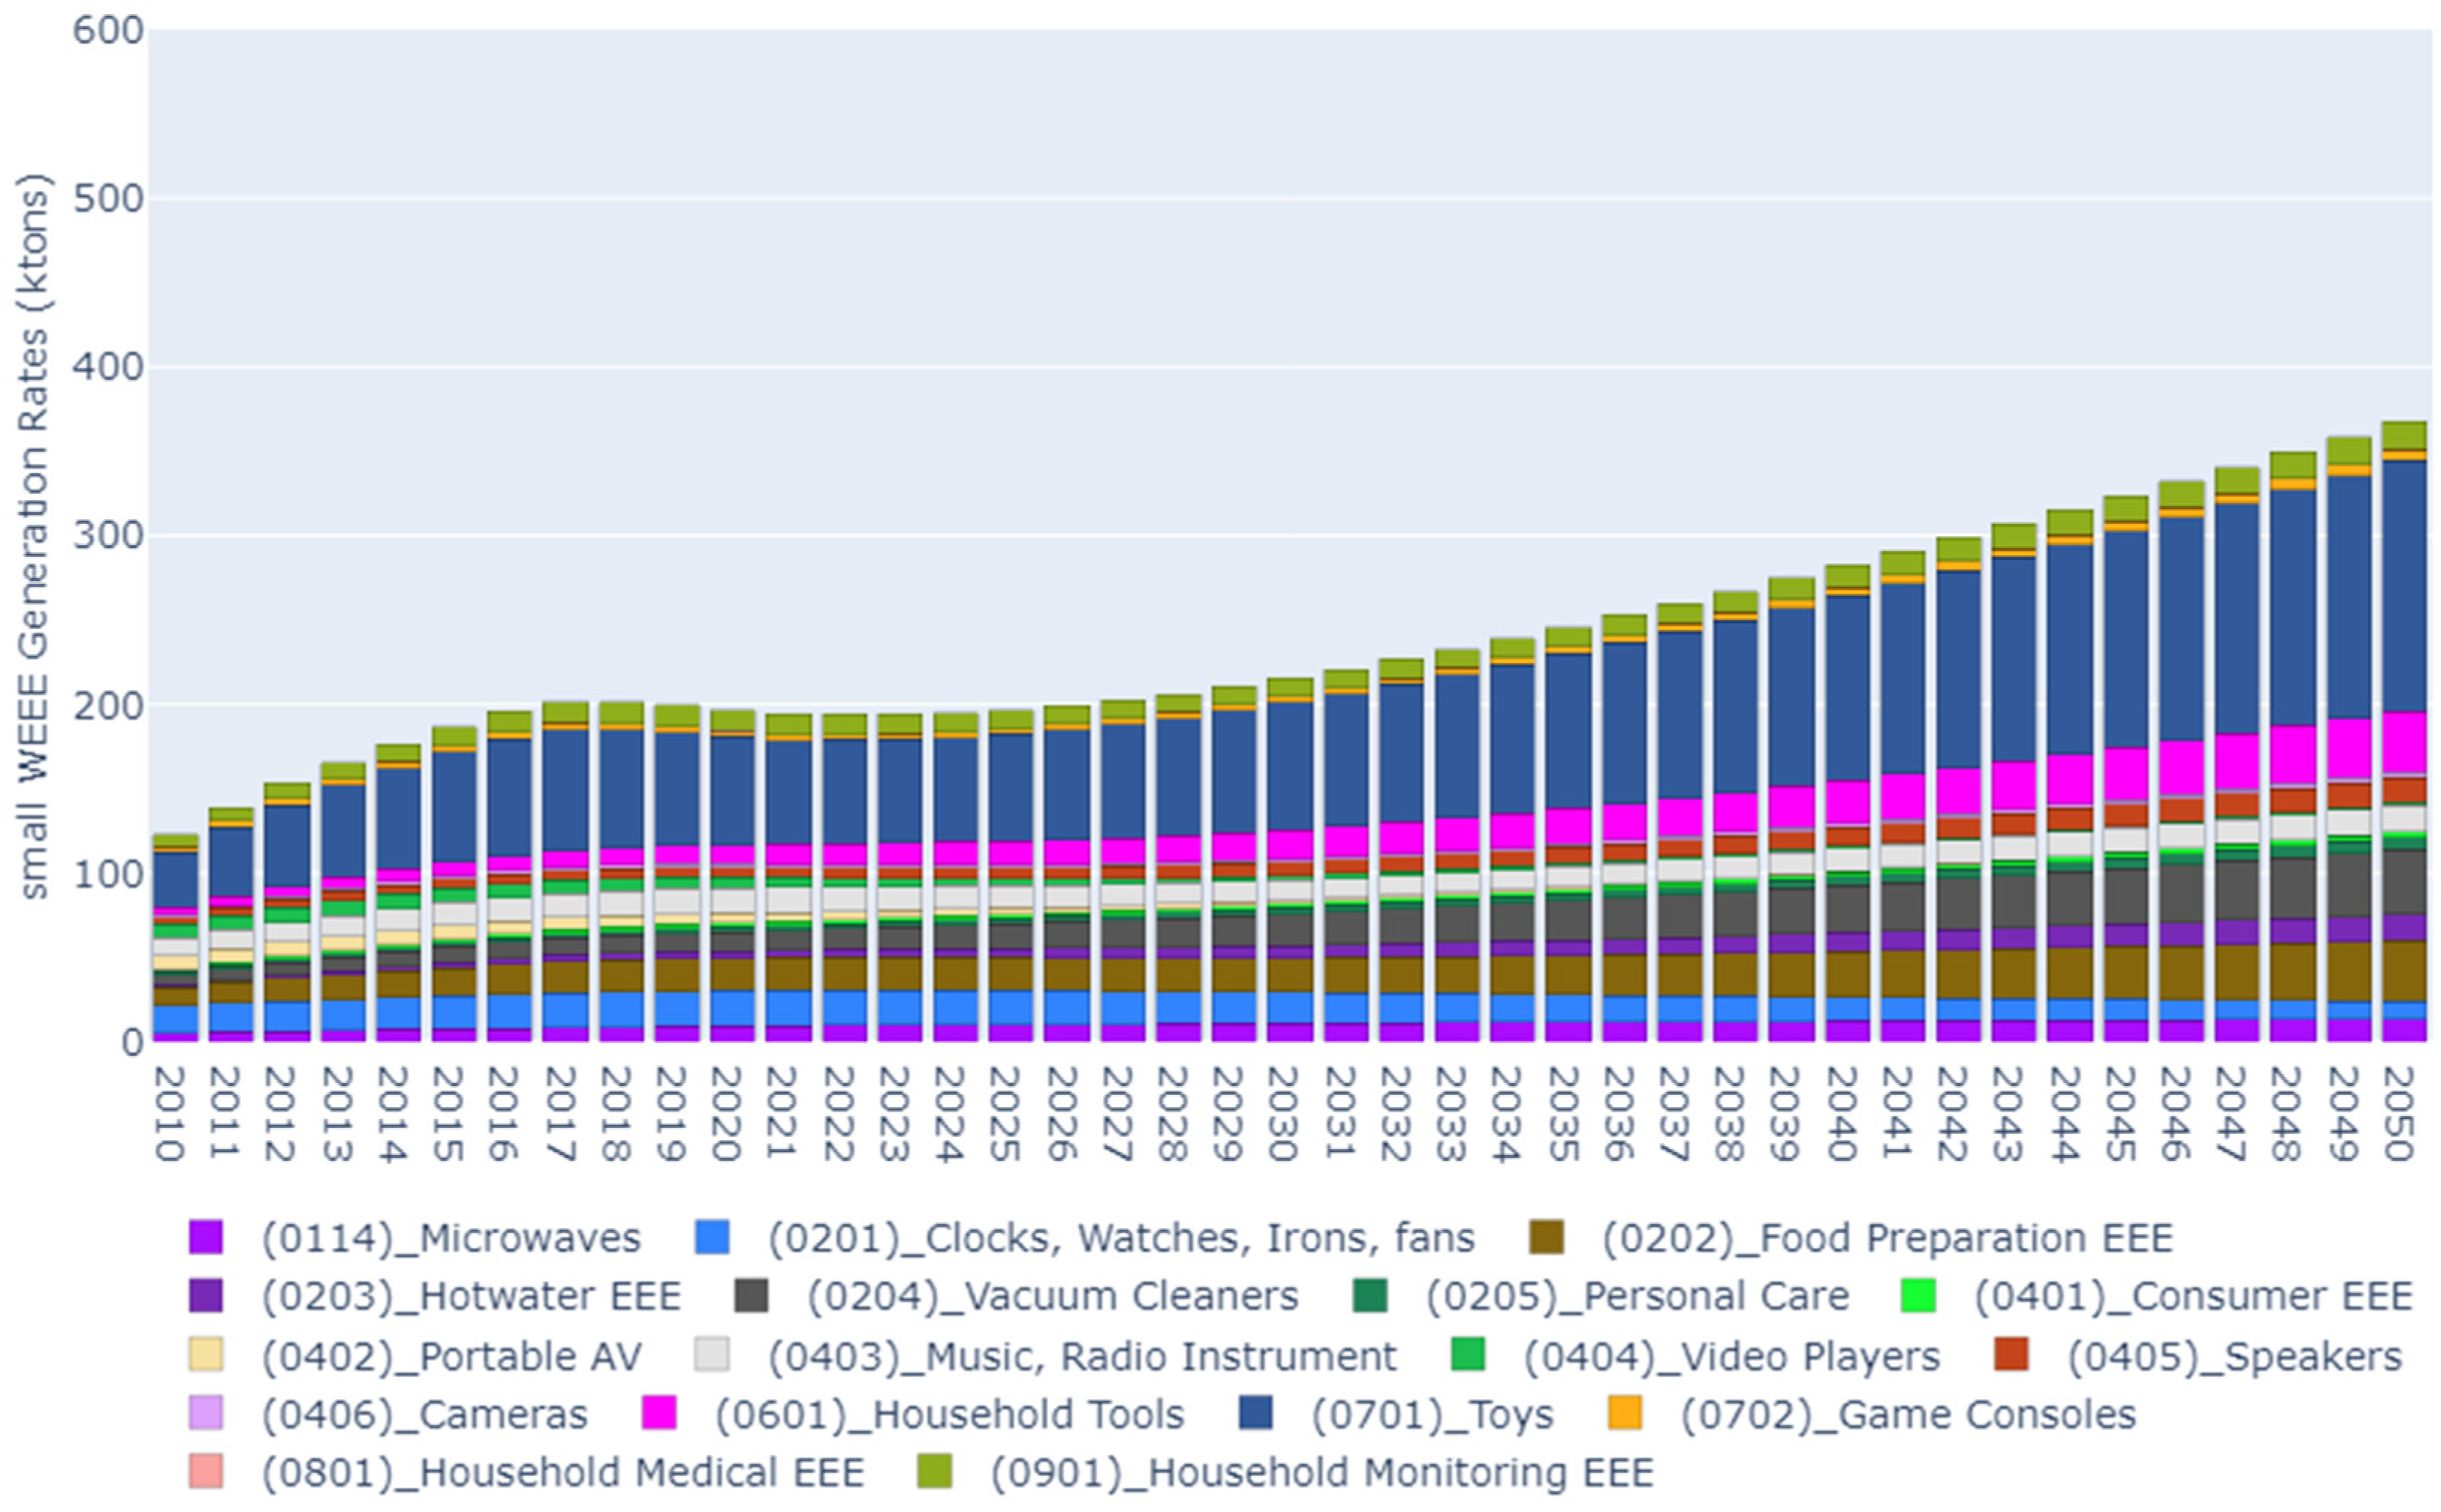
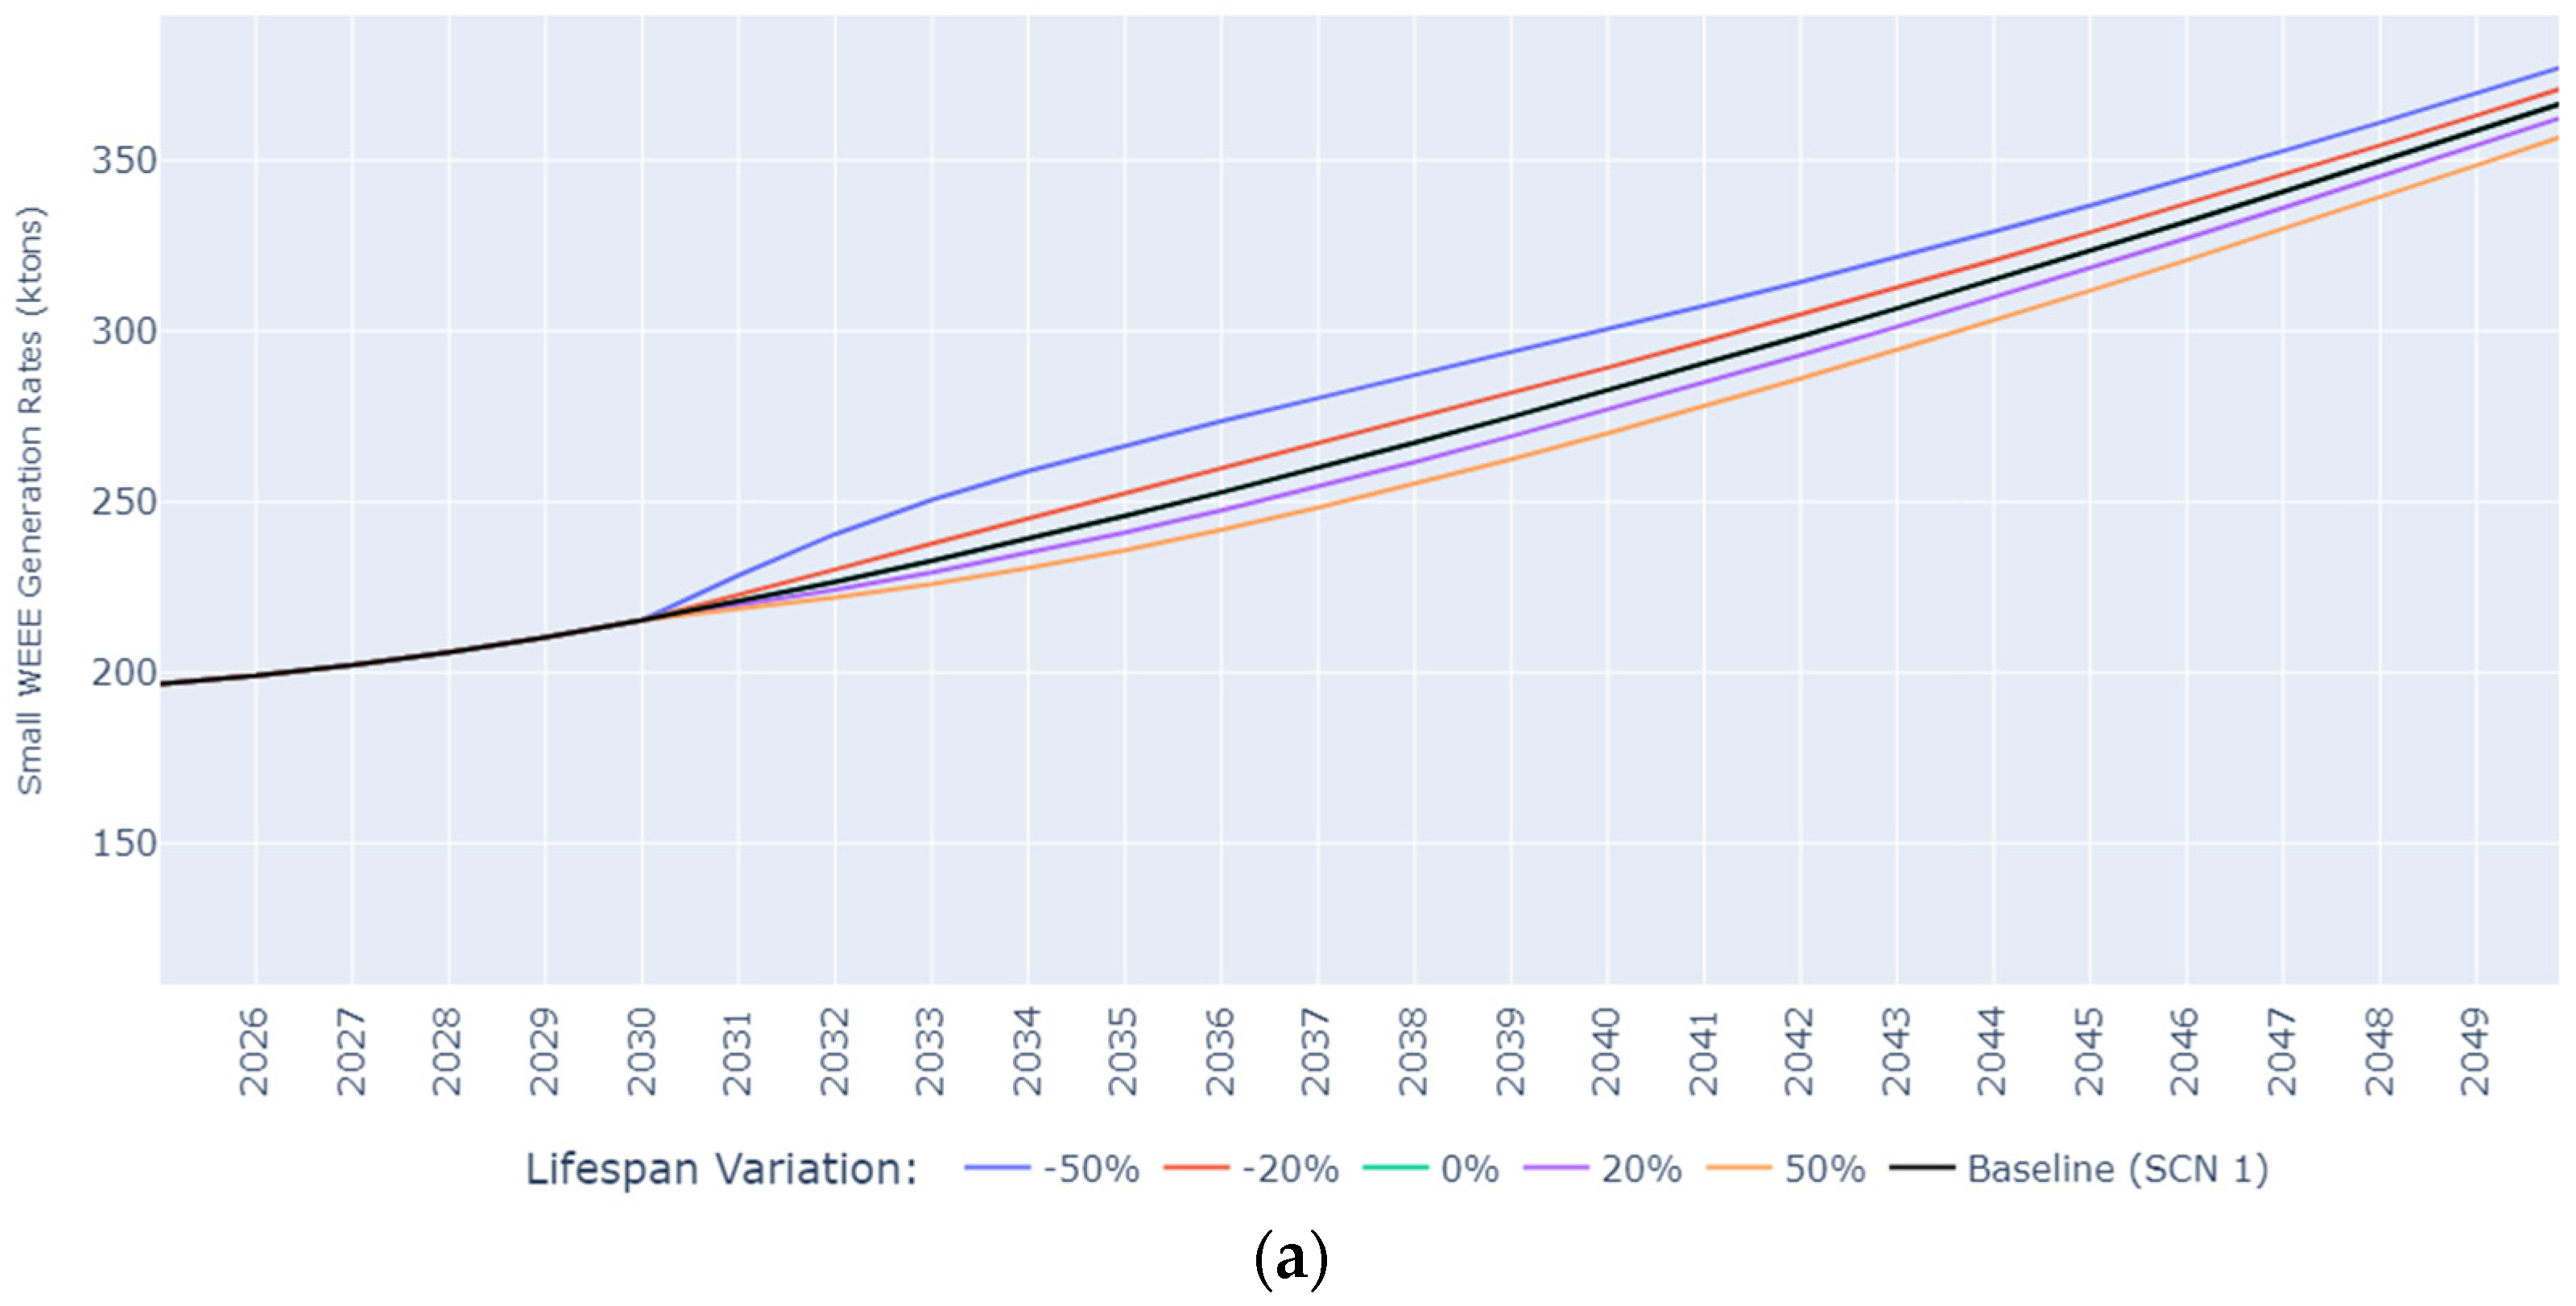
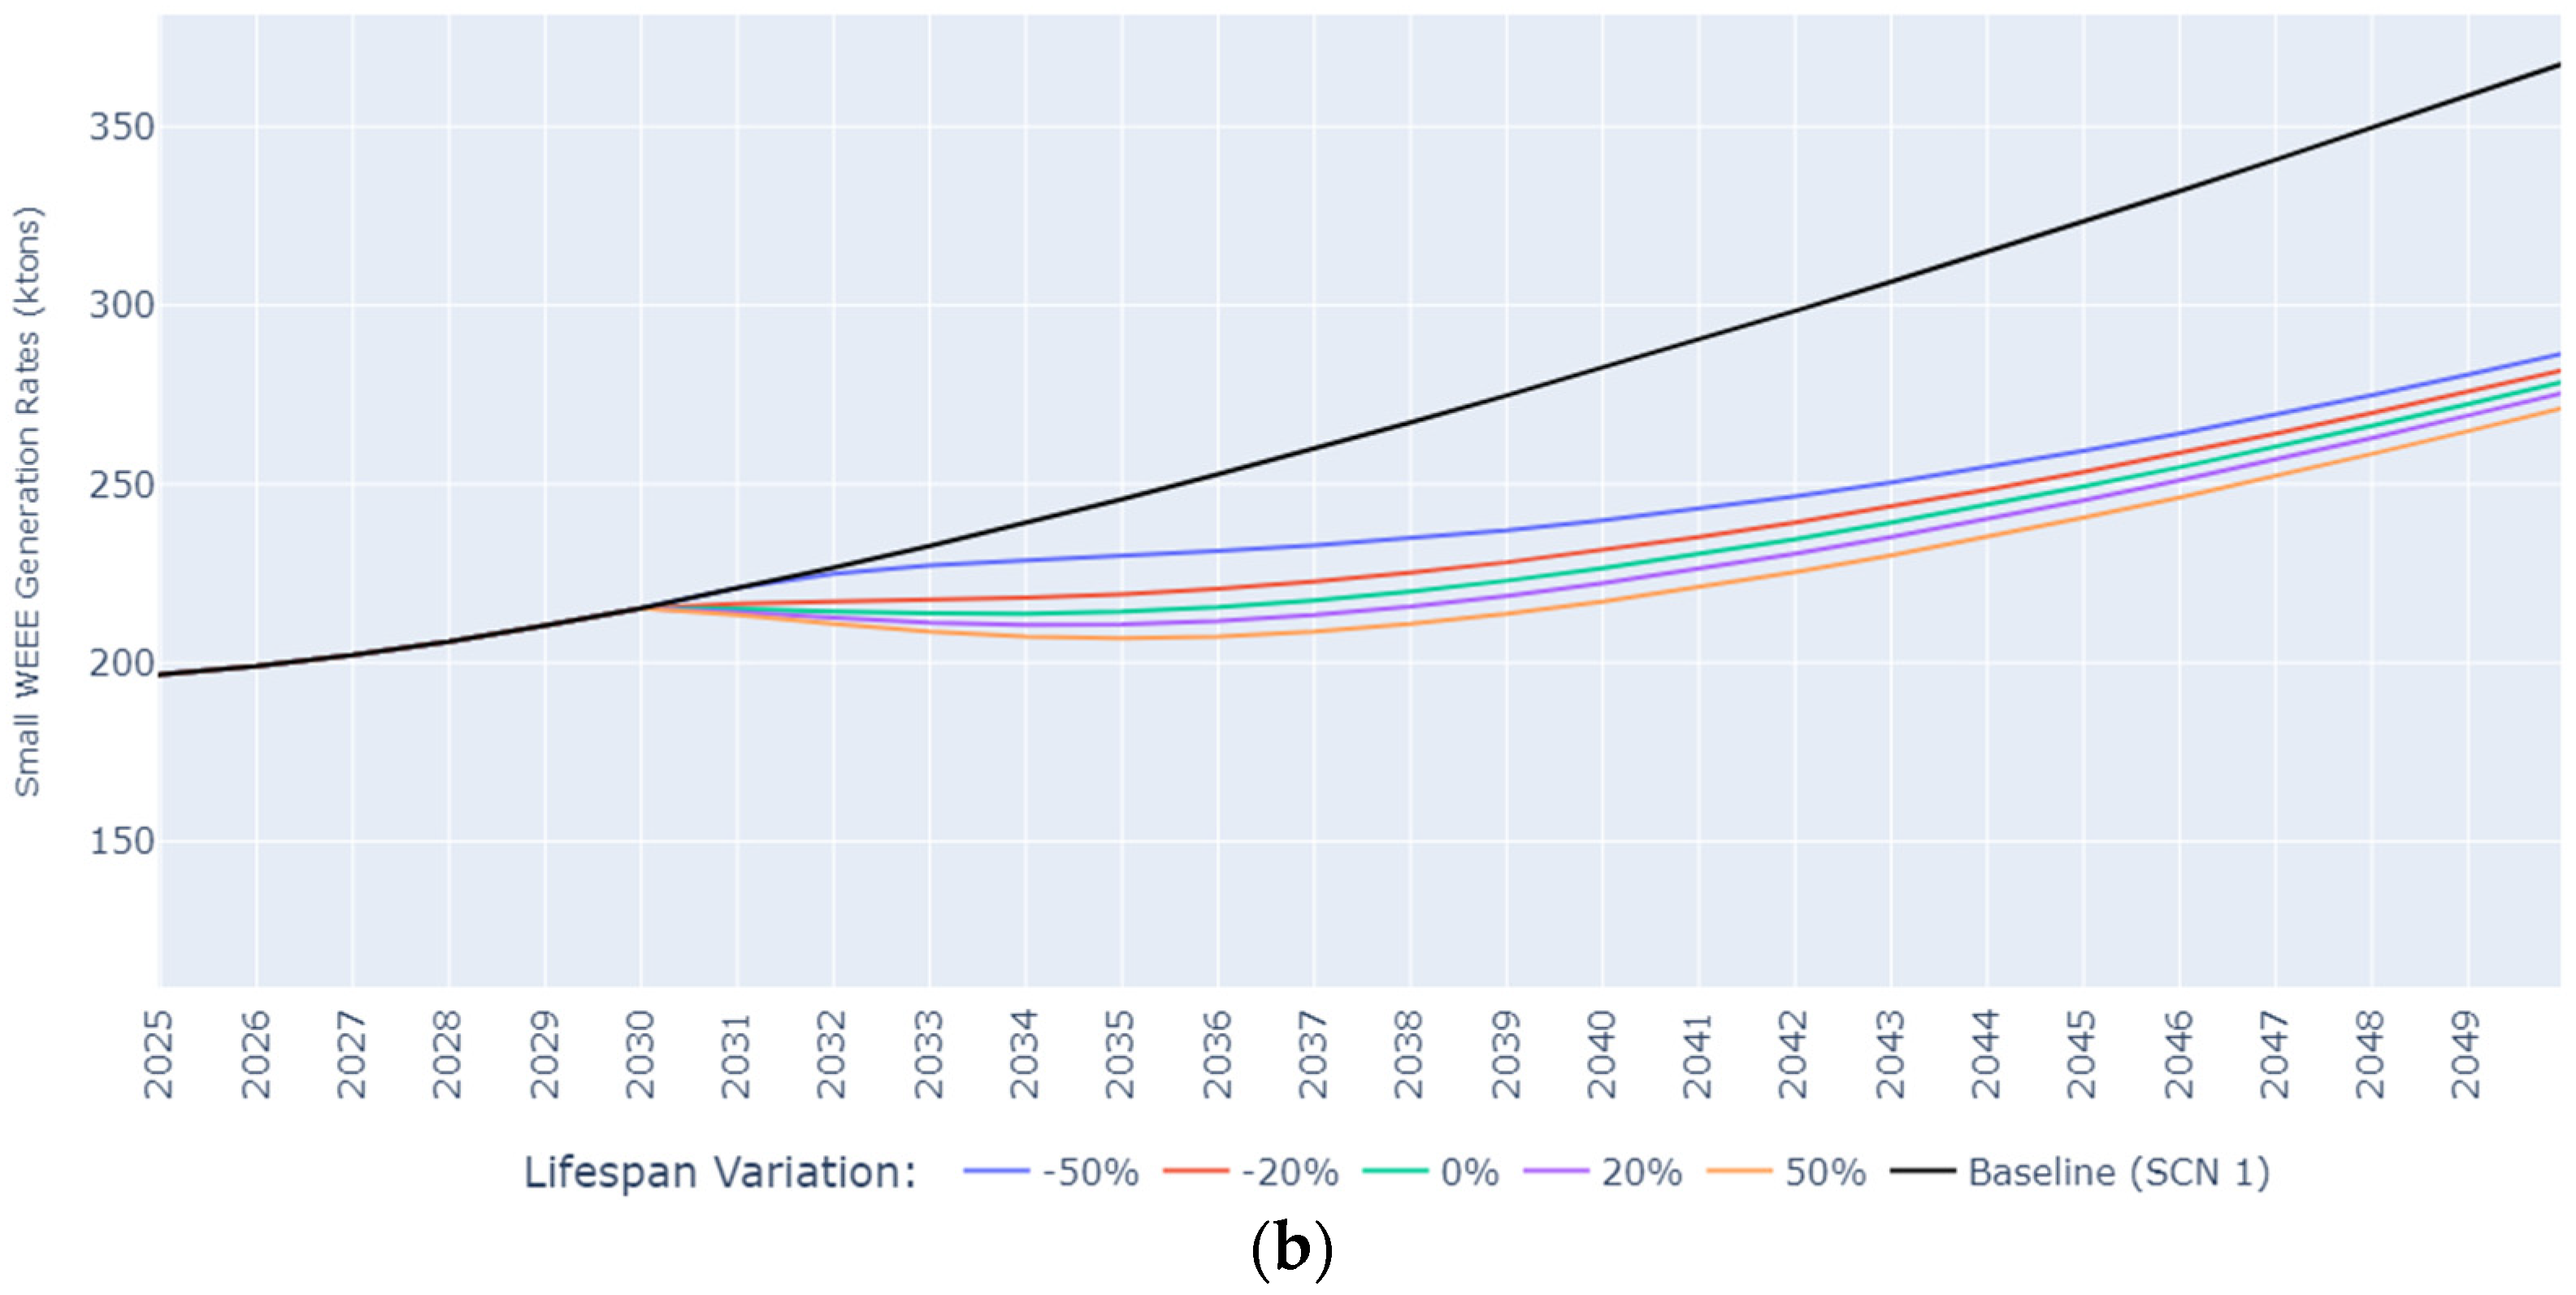
6.2. Small WEEE Generation Rate Variation

As discussed in earlier sections, the behavioural complexities associated with waste generation may doubt the precision of mathematical models in predicting outcomes related to repair and reuse. However, these models can still provide valuable insights to inform policymaking decisions. In this study, the impact of repair and reuse was quantitatively modelled by changing five key variables: the percentage of products subject to repair, the lifespan of the products, the year in which repair and reuse measures were implemented, the percentage reduction in PoM, and the corresponding applied year. Through systematic adjustments to these variables, various scenarios were created, and the resulting small WEEE generation rates were compared with the baseline scenario (Scenario 1), as shown in Table 2. Given the time taken to promote repair and reuse and the introduction of stewardship schemes for small EEE, variations were applied from 2030.
Initially, only the lifespans were altered (scenarios 2–17), independently of the percentage of repaired products, without considering their impact on the PoM small EEE. The primary motivation for this approach was to assess whether it significantly influences the WGR if consumer purchasing patterns persist as projected. Furthermore, another study indicated that product lifespan is the most significant factor in predicting small WEEE generation rates [65]. During this evaluation, the increase in PoM small EEE was maintained at zero, assuming that rapid technological advancements would continually introduce smaller EEE into the market and product reuse would transpire among different owners. This scenario appears plausible in the foreseeable future, given variations in income levels and population growth patterns.
The results from scenarios 2–9 (Figure S7—SCN2, Figure S8—SCN5) reveal that an increase in lifespan disproportionately reduces short-term WGR compared to long-term outcomes. For instance, with 50% of products repaired and reused, coupled with a 20% increase in lifespan starting from 2030, the 2035 WGR decreases by 3.9%, and the 2050 rates decline by 2.25%. A similar trend is observed for a 50% increase in lifespan. The optimal scenario where all products undergo repair and reuse, resulting in a 50% lifespan increase from 2030 onwards, leads to a substantial reduction in WGR by 16.2% during 2035 and 10.6% during 2050. Consequently, it can be inferred that among the lifespan variations across the 17 small EEE categories, the short-term impact of repair and reuse without reducing PoM is more pronounced than its long-term implications.
Additionally, the premature obsolescence of small EEE was simulated by decreasing the lifespan and modifying the percentage of EEE affected by the respective scenarios (scenarios 10–17, Figure S9—SCN10, Figure S10—SCN3). A parallel trend was noted, mirroring the earlier scenario, wherein an escalation in WGR was evident by a more significant percentage than the rise observed in 2050. These increases were nearly twice as substantial as the corresponding decrease percentages, as per the analysis.
In the subsequent model adjustment, the PoM small EEE was simultaneously varied alongside the lifespan modification. In these scenarios, PoM variation was implemented in the same year as the lifespan adjustment under the assumption that repair and reuse would promptly influence products in the market. Moreover, the values for PoM increase or decrease were adjusted, ensuring that the maximum value always remained less than or equal to the percentage of small EEE affected by the change. Under these assumptions, scenarios 18–25 (Figure S11—SCN18) saw a 20% increase in lifespan starting from 2030 and 2040, respectively.
Observations revealed that with an identical PoM reduction percentage, the increase in repaired and reused devices resulted in a modest reduction in the waste generation rate (WGR), ranging around one to two percent (Scenario 18 vs. 19, 22 vs. 23). However, small WEEE generation rates reduction was significantly higher than in scenarios without PoM reduction, as shown in Figure 4. This underscores that with consideration of PoM reduction, small EEE is more responsive, and without PoM reduction, the impact on WGR based solely on lifespan increase is minimal. This trend persisted in scenarios 26–33 (Figure S12—SCN26), where lifespan increased by 50%.
In scenarios 34–49 (Figure S13—SCN34, Figure S14—SCN49), the lifespan was intentionally reduced to simulate early obsolescence while concurrently increasing the PoM small EEE. This pattern closely reflected previous scenarios, in comparison with the influence of PoM increase. In these scenarios, the only variation is a 50% increase in the PoM small EEE. Overall, it can be deduced that regardless of whether the lifespan is increased or decreased, the reduction in WGR is approximately equivalent to the reduction or increase in PoM as long as the percentage of repaired products remains below 50%.
Notably, scenarios involving 100% repair were not considered due to the improbability of such an event. This further underscores the observation that a substantial reduction in small WEEE generation rates is achievable when high product reuse is combined with a reduction in PoM in small EEE. However, attaining these higher PoM reduction rates may be challenging, given the prevailing economic trends.

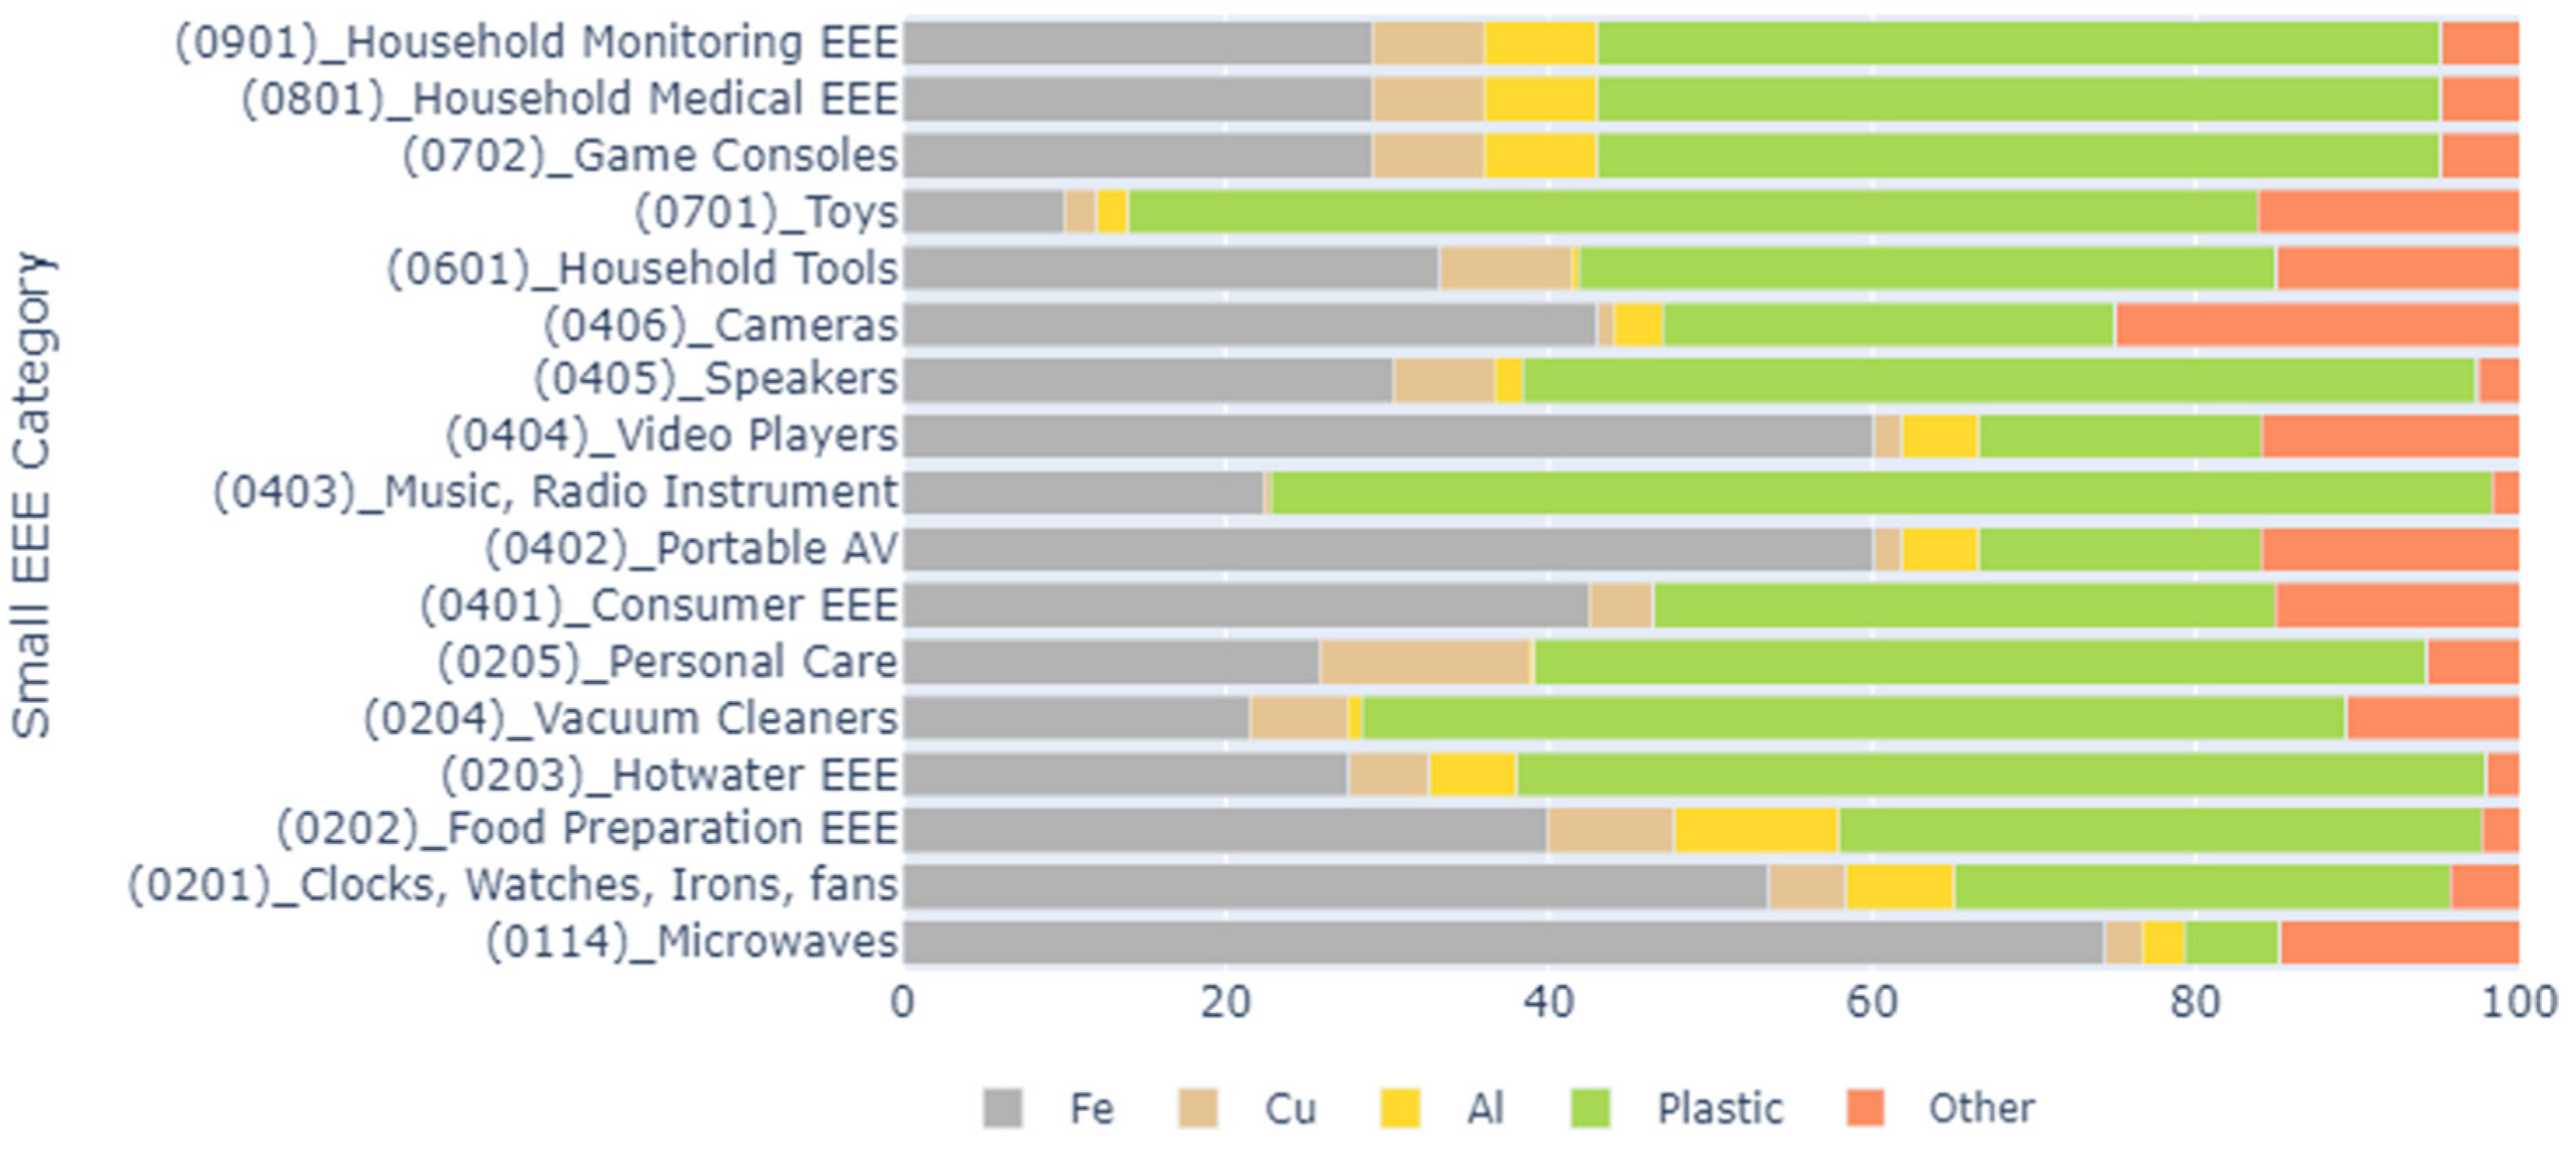
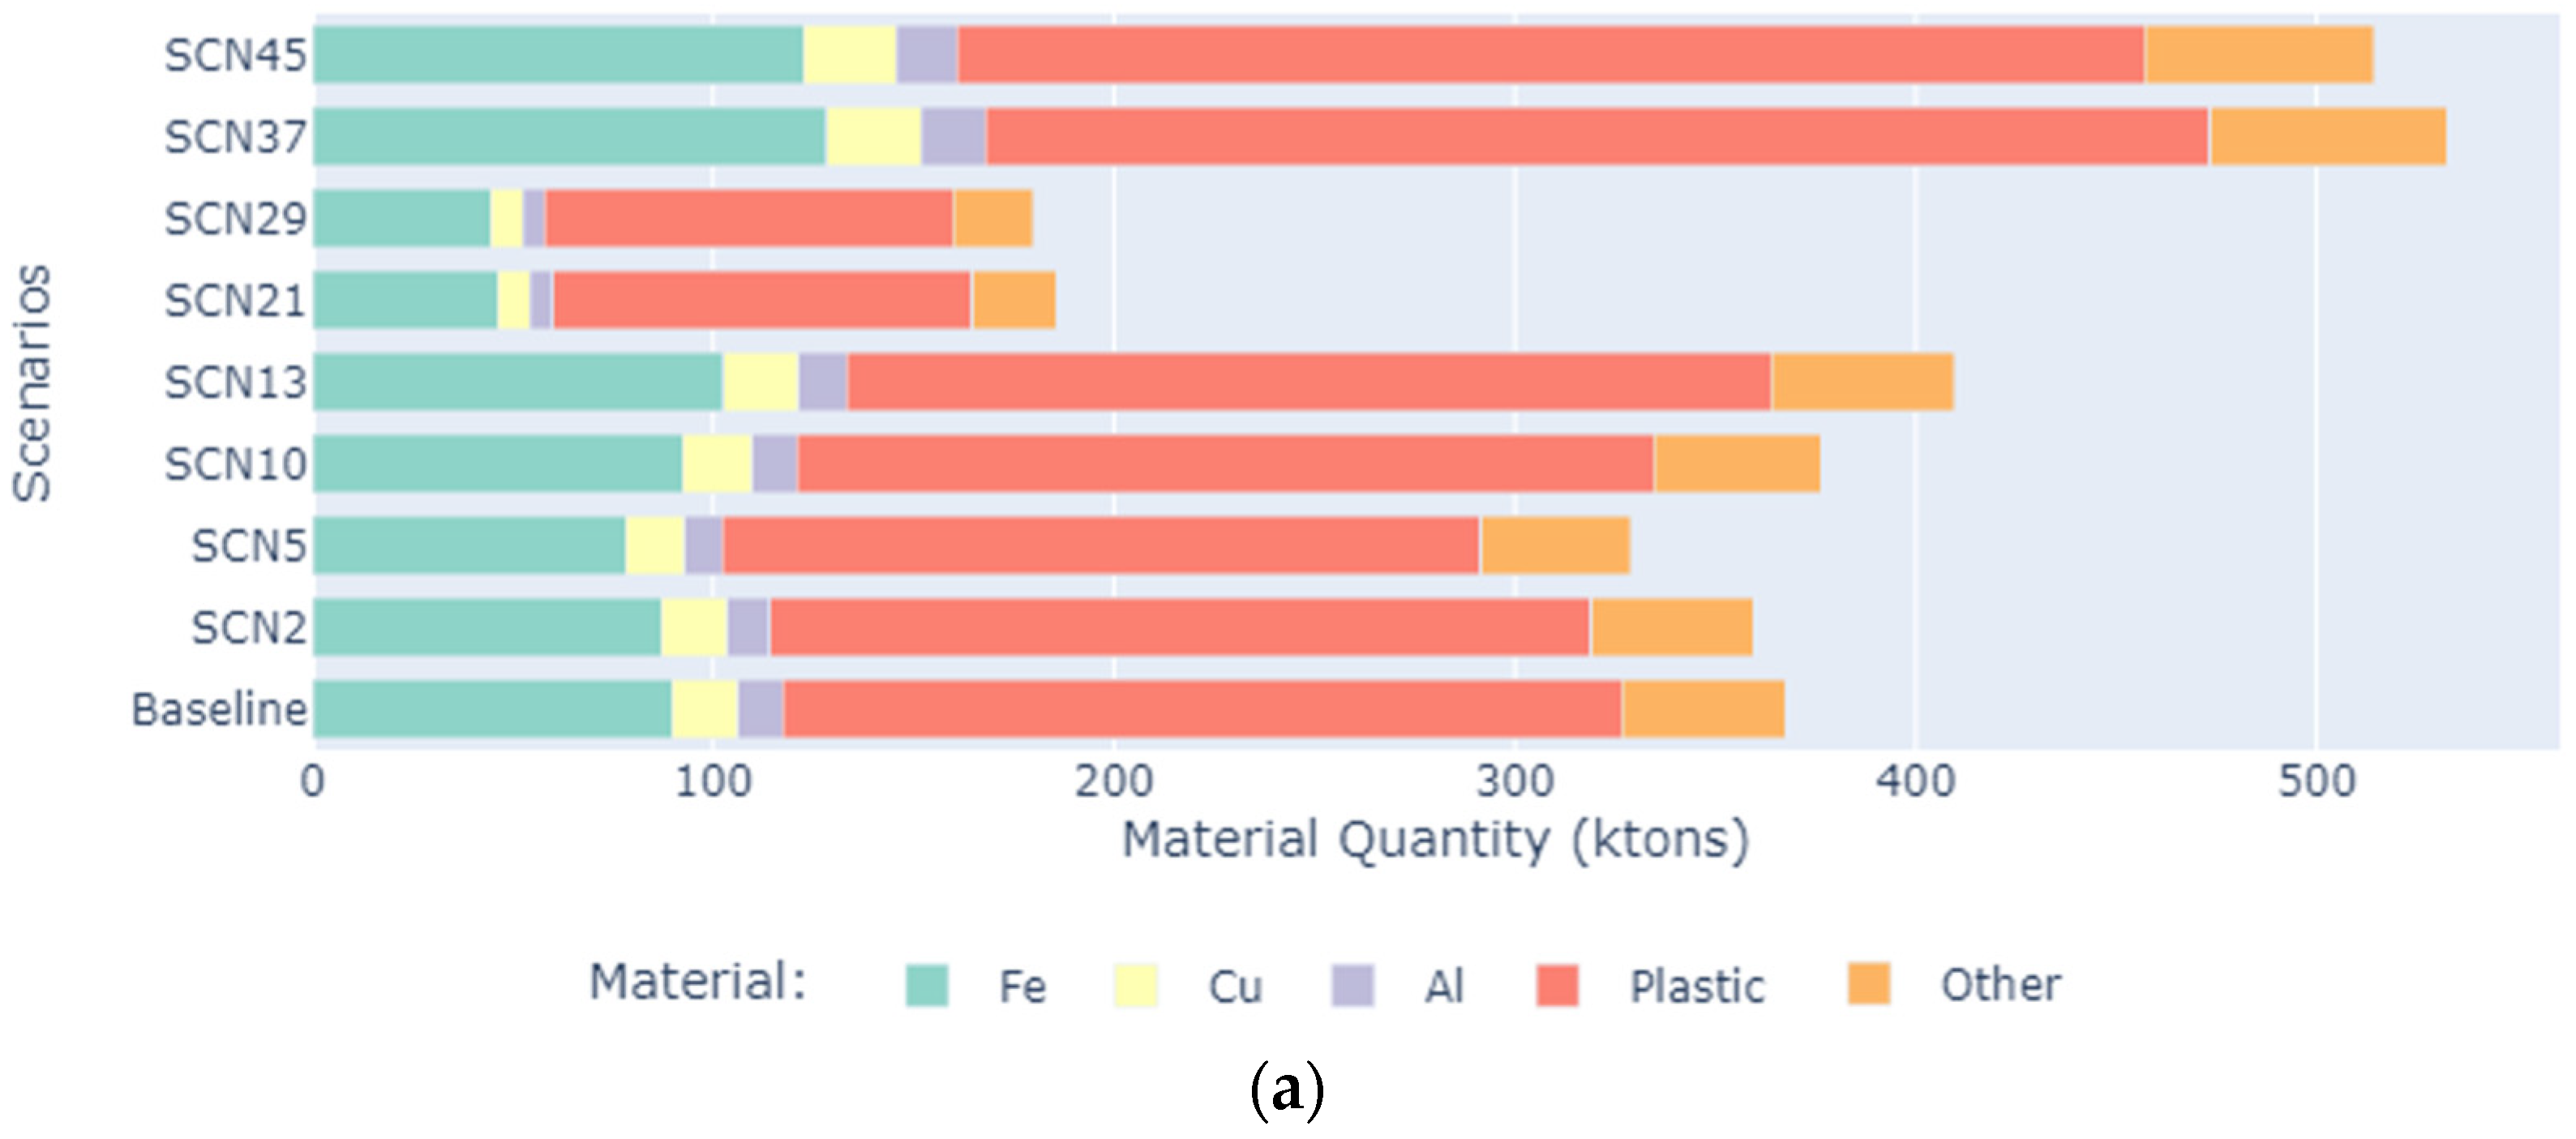
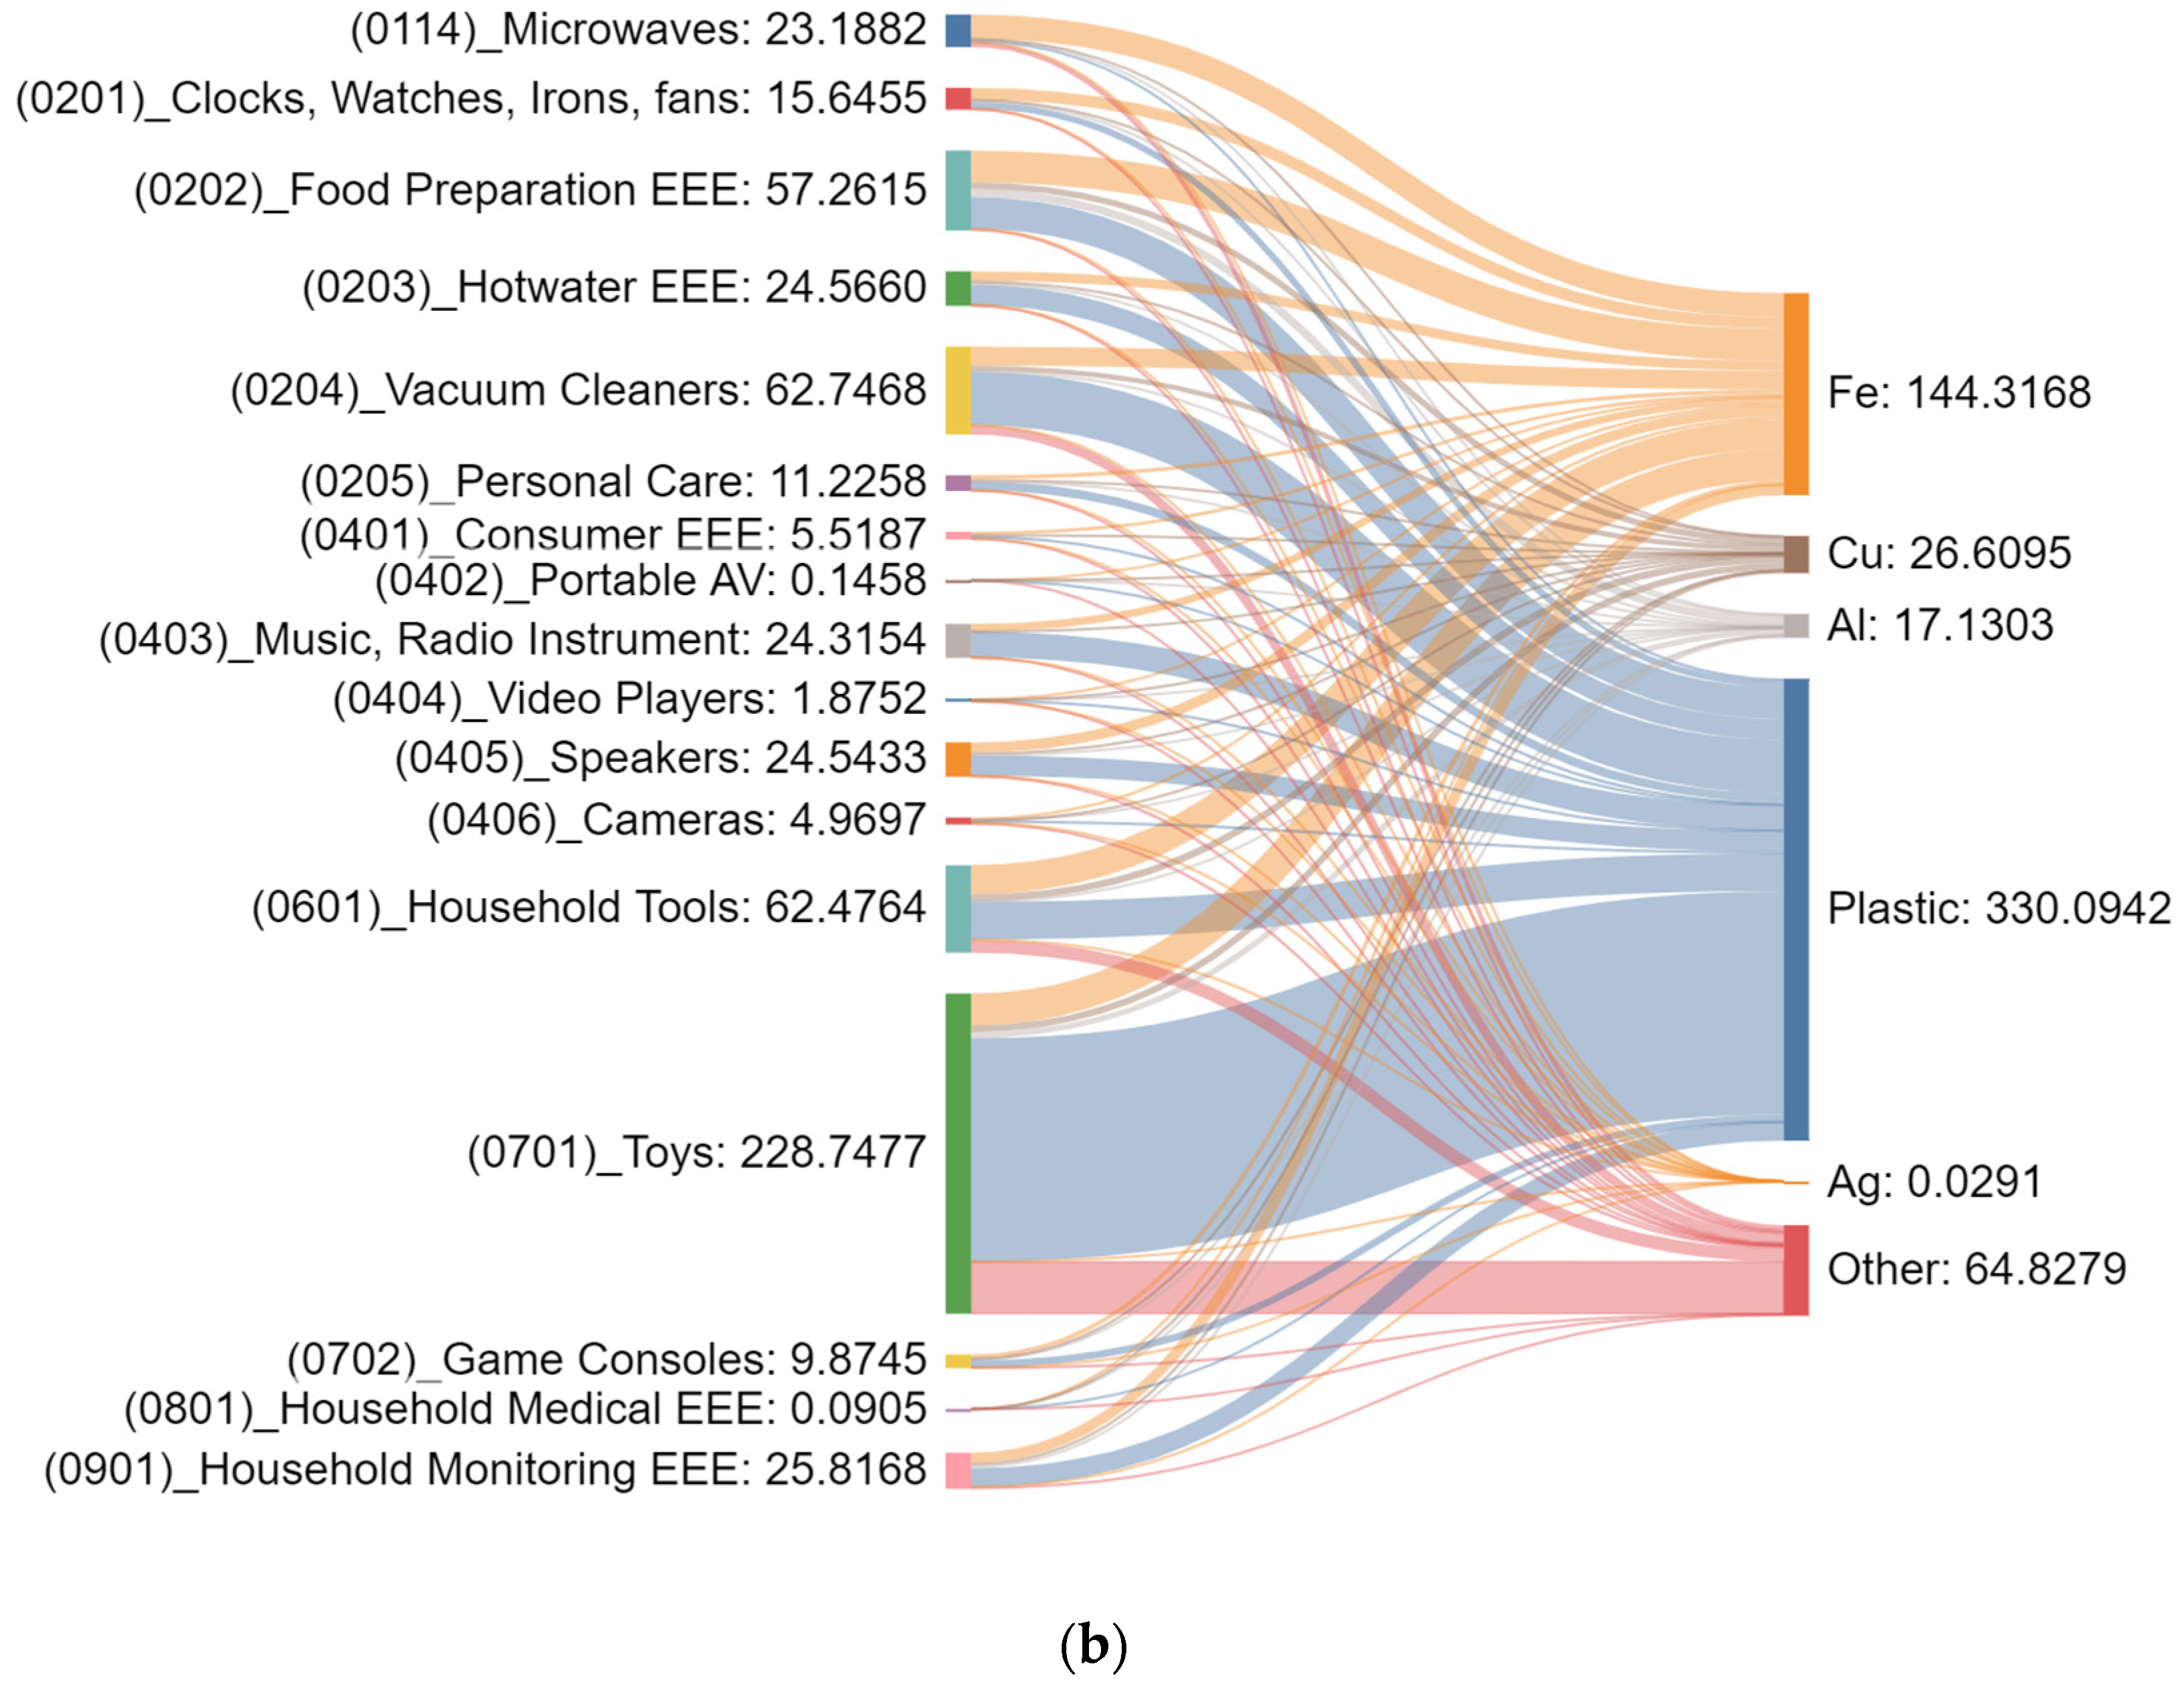
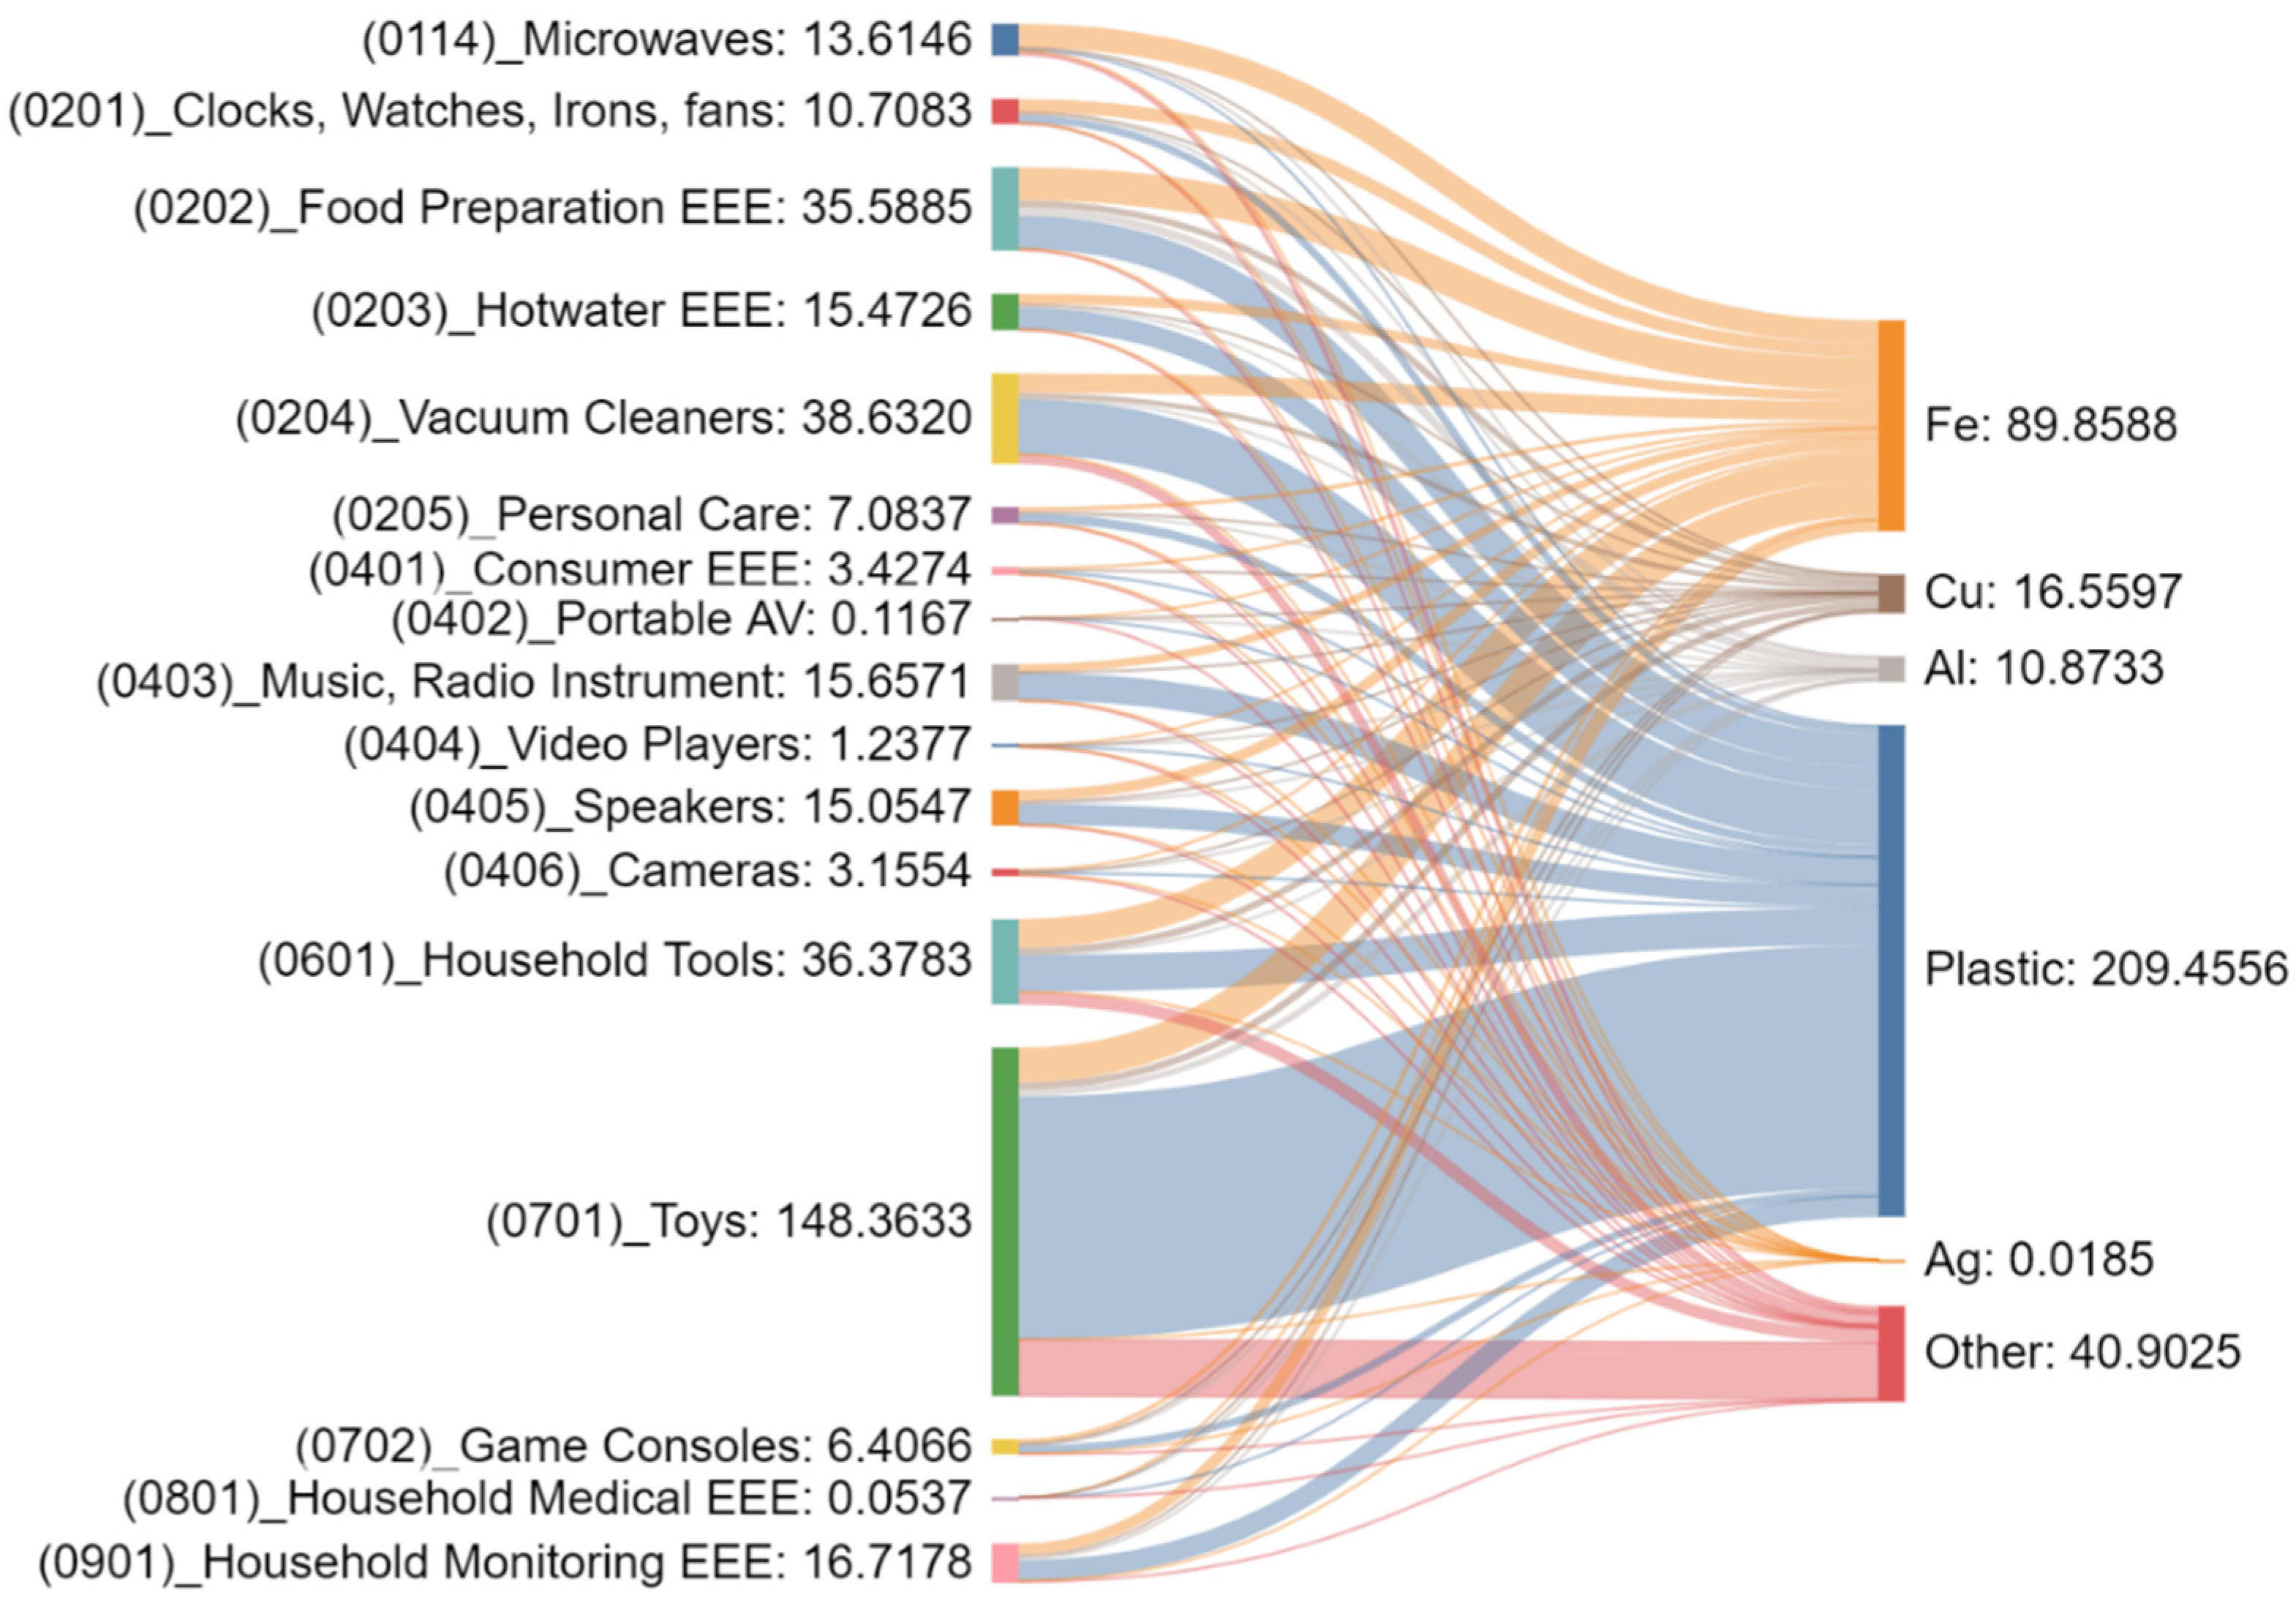
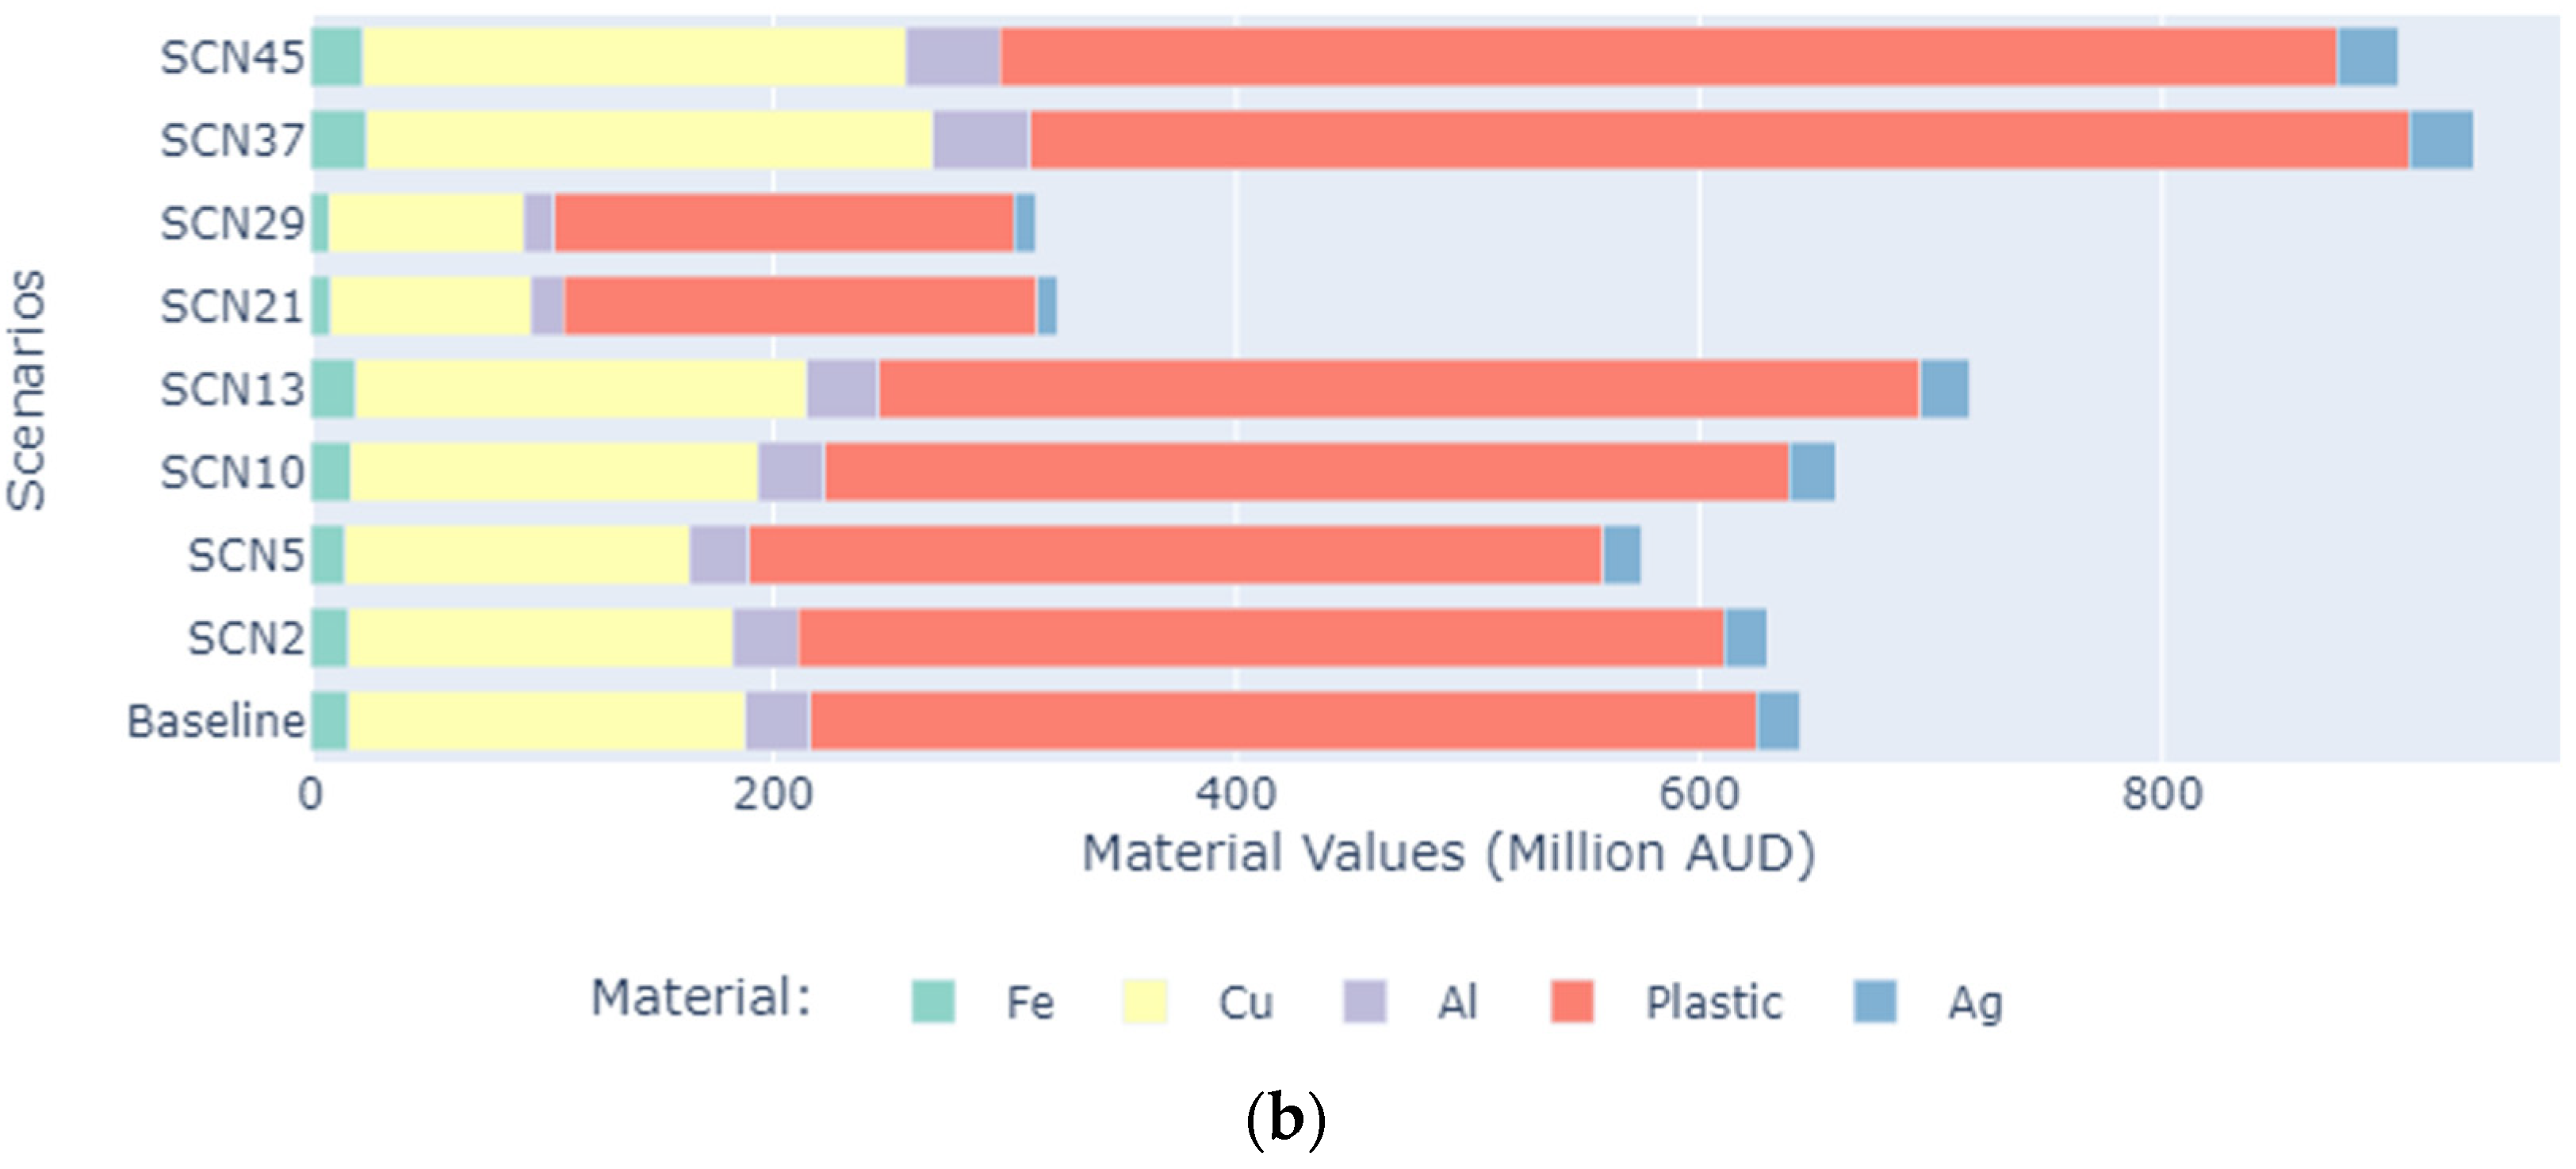
6.3. Material Variation

Material quantities (Table S1) and potential revenues resulting from material recovery were also analysed across various critical scenarios to assess the impact of repair and reuse on recycling. Notably, in the absence of PoM small EEE variation, the quantities and potential revenues exhibit minimal variation. However, results reveal a significant reduction when lifespan variations are combined with PoM adjustments, as illustrated in Figure 5.
As indicated in Figure 5 and Figure 6, Scenario 21 presents an environment highly conducive to the repair and reuse of small EEE, while Scenario 45 is more favourable for recycling. On the one hand, the delay in small WEEE generation caused by repair and reuse may reduce the supply to recycling facilities, potentially impacting their revenue streams. Conversely, if there is a high supply of small WEEE due to premature product obsolescence, recycling plants might receive an increased input, potentially impeding recycling efficiencies. Therefore, although there is the potential for material revenues to triple from Scenario 21 to 45, the actual impact may be mitigated by the capacity constraints of recycling plants. Consequently, while repair and reuse are prioritized in the circular economy over recycling, decision-making scenarios should not excessively favour either of these aspects to ensure balanced outcomes.

7. Conclusions and Recommendations

In conclusion, the findings of this study indicate the dynamics of small WEEE generation rates, providing valuable insights into future trends and potential interventions. The projected surge in small WEEE generation rates by 90% over the next 25 years is a cause for concern, especially considering the environmental impact and resource depletion associated with small WEEE. The declining trend in specific categories, such as UNU Keys 0201 (clocks, watches, and irons), 0402 (portable AV), and 0404 (video players), signifies a shift in consumer preferences and technological advancements, leading to the replacement of specific types of small EEE. Notably, toys (UNU Key 0701) consistently contribute the most significant proportion to small WEEE, emphasizing the need for targeted interventions in this category for Australia. A recent study has indicated that more than 50% of the toys in domestic waste are reusable, indicating that they reach early obsolescence rather than reaching EoL [2]. Therefore, with the National Toy Recycling Program established in Australia [27], the authors propose a proactive approach to enhance its effectiveness. This involves identifying reusable toys suitable for donation to charity, thus discouraging domestic hoarding. Expanding collection points to various retail stores across all states can ensure the inclusion of this valuable waste stream in recycling plants.
Moreover, material flow diagrams highlight plastics as the primary contributor to waste, with toys, given their substantial plastic content, anticipated to hold significant economic value. Alongside toys, consideration should be extended to food preparation electrical and electronic equipment (EEE), vacuum cleaners, and household tools, as substantial revenue can be generated from the recovery of iron (Fe) and copper (Cu). Given the broad spectrum of products categorized under small EEE, the authors advocate for regulatory bodies to concentrate waste management efforts on toys, food preparation EEE, vacuum cleaners, and household tools during the initial phases of the stewardship schemes. Simultaneously, it is recommended that the capacity and the number of recycling plants be enhanced to facilitate plastic, Fe, and Cu recovery.
Furthermore, it is essential to determine which aspect of CE warrants greater emphasis, considering the varying small WEEE generation rates across different scenarios. Analysis reveals that in the short term, the impact of repair and reuse, without reducing the PoM small EEE, is more significant than its long-term consequences. This observation gains significance due to WEEE landfill bans, which necessitate diverting WEEE from landfills while developing recycling infrastructure requires time. Therefore, to avoid dumping small WEEE in municipal bins or hoarding in households, the promotion of repair and reuse becomes imperative, particularly in the initial stages of implementing a small WEEE stewardship scheme supporting circular economy principles.
The study indicates that regardless of variations in lifespan, the fluctuations in small WEEE generation rates are noteworthy. By 2050, these rates will mirror the increases or decreases in PoM small EEE observed in 2030. Consequently, focusing on long-term strategies to reduce small WEEE necessitates the reduction in PoM small EEE. Since most OEMs operate outside Australia, regulating imports while implementing eco-modulation to promote EPR offers a viable solution. This approach encourages consumers to extend the lifespan of small EEE through repair and reuse and ensures environmental accountability. However, it is crucial to acknowledge that such measures may lead to reduced input to recycling plants, potentially affecting future revenue streams, as highlighted in the analysis.
However, with the long-term trend in waste management increasingly favouring recycling, driven by both public demand and government policy [76], a similar focus should be directed towards expanding recycling infrastructure specifically for small WEEE within Australia. As regulations on WEEE exports tighten, domestic recycling is poised to become more prominent, a shift that take-back programs initiated by OEMs should support. Nevertheless, to the best of the authors’ knowledge, no specific recovery target exists for small WEEE, aside from the National Waste Policy Action Plan’s overarching goal of achieving an 80% average recovery rate for all waste streams [77]. Nonetheless, the proposed stewardship scheme for small WEEE aims to utilize this figure in formulating the scheme’s respective target [78]. Utilizing Table 2 derived from this study alongside related material flow diagrams can serve as valuable tools in determining appropriate recovery targets while concurrently promoting repair and reuse.
In light of these considerations, the authors suggest emphasising repair and reuse more during the early implementation phases of a stewardship scheme. This entails addressing the barriers and challenges associated with repair and reuse as outlined in the literature while concurrently enforcing regulations on OEMs and retailers to bolster EPR for current and future products. Such a strategy allows for gradually establishing recycling infrastructure while maintaining controlled input, which can be progressively increased based on performance metrics. This approach ensures sufficient time for the recycling infrastructure to develop effectively, thus optimizing its capacity to handle increased input in the future.

8. Limitations of the Study

This study proposes recommendations based on the literature and a mathematical model for waste generation. The substantial amounts of the “other” category in the data suggest that a more detailed breakdown could potentially reveal additional insights regarding economic impacts. Due to the slight variation of methods, data, and variables used in previous WEEE estimation models for Australia, the model cannot be compared with them for variations in results. Furthermore, the model can be validated once such data become available, given the absence of any historical data on small WEEE generation rates. Additionally, the authors propose conducting a behavioural study to identify consumer willingness and enthusiasm for repair and reuse in Australia. Such a study is essential to strengthen the recommendations presented in this research, adding valuable insights into consumer attitudes and preferences.

Supplementary Materials

The following supporting information can be downloaded at: https://www.mdpi.com/article/10.3390/su16073035/s1, Figure S1: Failure Rates of small EEE; Figure S2: Imports and exports for small EEE; Figure S3: Sample PoM small EEE Forecasts; Figure S4: PoM small EEE (ktons); Table S1: Material Quantity and Prices; Figure S5: Percentage small WEEE (1992–2050); Figure S6: Forecasted revenue from recycling of small WEEE in 2050—SCN1; Figure S7: small WEEE Generation Rates in 2050—SCN2; Figure S8: small WEEE Generation Rates in 2050—SCN5; Figure S9: small WEEE Generation Rates in 2050—SCN10; Figure S10: small WEEE Generation Rates in 2050—SCN13; Figure S11: small WEEE Generation Rates in 2050—SCN18; Figure S12: small WEEE Generation Rates in 2050—SCN26; Figure S13: small WEEE Generation Rates in 2050—SCN34; Figure S14: small WEEE Generation Rates in 2050—SCN49. References [46,65,72,79] are cited in Supplementary Materials.

Author Contributions

Conceptualization, G.J.; methodology, G.J.; validation, S.H. and P.K.; formal analysis, G.J.; investigation, G.J.; resources, G.J., S.H. and P.K.; data curation, G.J.; writing—original draft preparation, G.J.; writing—review and editing, S.H. and P.K.; visualization, G.J.; supervision, S.H. and P.K. All authors have read and agreed to the published version of the manuscript.

Funding

This research is part of G.J.’s PhD and was funded by the Griffith University Postgraduate Research Scholarship (GUPRS) and Griffith University International Postgraduate Research Scholarship (GUIPRS), offered by Griffith University, Australia.

Institutional Review Board Statement

Not applicable.

Informed Consent Statement

Not applicable.

Data Availability Statement

Data are contained within the article.

Conflicts of Interest

The authors declare no conflicts of interest.

References

  1. Robinson, B.H. E-waste: An assessment of global production and environmental impacts. Sci. Total Environ. 2009, 408, 183–191. [Google Scholar] [CrossRef] [PubMed]
  2. Pérez-Belis, V.; Bovea, M.D.; Gómez, A. Waste electric and electronic toys: Management practices and characterisation. Resour. Conserv. Recycl. 2013, 77, 1–12. [Google Scholar] [CrossRef]
  3. Forti, V.; Baldé, C.P.; Kuehr, R.; Bel, G. The Global E-Waste Monitor 2020; United Nations Institute for Training and Research: Bonn, Germany, 2020. [Google Scholar]
  4. Lase, I.S.; Ragaert, K.; Dewulf, J.; De Meester, S. Multivariate input-output and material flow analysis of current and future plastic recycling rates from waste electrical and electronic equipment: The case of small household appliances. Resour. Conserv. Recycl. 2021, 174, 105772. [Google Scholar] [CrossRef]
  5. Baldé, C.P.; D’Angelo, E.; Luda, V.; Deubzer, O.; Kuehr, R. Global Transboundary E-Waste Flows Monitor 2022; United Nations Institute for Training and Research: Bonn, Germany, 2022. [Google Scholar]
  6. Baldé, C.P.; Wagner, M.; Iattoni, G.; Kuehr, R. In-Depth Review of the WEEE Collection Rates and Targets in the EU-28, Norway, Switzerland, and Iceland; United Nations University (UNU)/United Nations Institute for Training and Research (UNITAR)—Co-Hosting the SCYCLE Programme: Bonn, Germany, 2020. [Google Scholar]
  7. Sahota, S.; Poddar, M.K.; Narzari, R. Chapter 16—Transitions toward sustainable E-waste management plans. In Global E-Waste Management Strategies and Future Implications; Arya, S., Kumar, S., Eds.; Elsevier: Amsterdam, The Netherlands, 2023; pp. 333–356. [Google Scholar]
  8. Withanage, S.V.; Habib, K. Life Cycle Assessment and Material Flow Analysis: Two Under-Utilized Tools for Informing E-Waste Management. Sustainability 2021, 13, 7939. [Google Scholar] [CrossRef]
  9. Parajuly, K.; Kuehr, R.; Awasthi, A.K.; Fitzpatrick, C.; Lepawsky, J.; Smith, E.; Widmer, R.; Zeng, X. Future E-Waste Scenarios; StEP: Bonn, Germany; UNU ViE-SCYCLE: Bonn, Germany; UNEP IETC: Osaka, Japan, 2019. [Google Scholar]
  10. Circularity Gap Reporting Initiative. Circularity Gap Report; Circularity Gap Reporting Initiative: Westcourt, QLD, Australia, 2023. [Google Scholar]
  11. Sitnikov, C.S.; Vasilescu, L.; Bandoi, A.; Firoiu, D.; Tudor, S.; Tenea, L. Performance of EU Countries in Managing Electrical and Electronic Equipment Waste in the Context of the Circular Economy. Amfiteatru Econ. J. 2023, 25, 115. [Google Scholar] [CrossRef]
  12. Suppipat, S.; Hu, A.H. A scoping review of design for circularity in the electrical and electronics industry. Resour. Conserv. Recycl. Adv. 2022, 13, 200064. [Google Scholar] [CrossRef]
  13. Pérez-Belis, V.; Bakker, C.; Juan, P.; Bovea, M.D. Environmental performance of alternative end-of-life scenarios for electrical and electronic equipment: A case study for vacuum cleaners. J. Clean. Prod. 2017, 159, 158–170. [Google Scholar] [CrossRef]
  14. Bovea, M.D.; Ibáñez-Forés, V.; Pérez-Belis, V.; Quemades-Beltrán, P. Potential reuse of small household waste electrical and electronic equipment: Methodology and case study. Waste Manag. 2016, 53, 204–217. [Google Scholar] [CrossRef] [PubMed]
  15. Dindarian, A.; Gibson, A.A.P.; Quariguasi-Frota-Neto, J. Electronic product returns and potential reuse opportunities: A microwave case study in the United Kingdom. J. Clean. Prod. 2012, 32, 22–31. [Google Scholar] [CrossRef]
  16. Bovea, M.D.; Ibáñez-Forés, V.; Pérez-Belis, V.; Juan, P. A survey on consumers’ attitude towards storing and end of life strategies of small information and communication technology devices in Spain. Waste Manag. 2018, 71, 589–602. [Google Scholar] [CrossRef]
  17. Pérez-Belis, V.; Bovea, M.D.; Simó, A. Consumer behaviour and environmental education in the field of waste electrical and electronic toys: A Spanish case study. Waste Manag. 2015, 36, 277–288. [Google Scholar] [CrossRef] [PubMed]
  18. Devoldere, T.; Willems, B.; Duflou, J.R.; Dewulf, W. The eco-efficiency of reuse centres critically explored–the washing machine case. Int. J. Sustain. Manuf. 2009, 1, 265–285. [Google Scholar] [CrossRef]
  19. Li, J.; Barwood, M.; Rahimifard, S. A multi-criteria assessment of robotic disassembly to support recycling and recovery. Resour. Conserv. Recycl. 2019, 140, 158–165. [Google Scholar] [CrossRef]
  20. Schischke, K.; Kohlmeyer, R.; Griese, H.; Reichl, H. Life cycle energy analysis of PCs–Environmental consequences of lifetime extension through reuse. Power 2003, 4, 5-032. [Google Scholar]
  21. Lu, B.; Song, X.; Yang, J.; Yang, D. Comparison on End-of-Life strategies of WEEE in China based on LCA. Front. Environ. Sci. Eng. 2017, 11, 7. [Google Scholar] [CrossRef]
  22. Zink, T.; Maker, F.; Geyer, R.; Amirtharajah, R.; Akella, V. Comparative life cycle assessment of smartphone reuse: Repurposing vs. refurbishment. Int. J. Life Cycle Assess. 2014, 19, 1099–1109. [Google Scholar] [CrossRef]
  23. Pini, M.; Lolli, F.; Balugani, E.; Gamberini, R.; Neri, P.; Rimini, B.; Ferrari, A.M. Preparation for reuse activity of waste electrical and electronic equipment: Environmental performance, cost externality and job creation. J. Clean. Prod. 2019, 222, 77–89. [Google Scholar] [CrossRef]
  24. Bovea, M.D.; Ibáñez-Forés, V.; Pérez-Belis, V. Repair vs. replacement: Selection of the best end-of-life scenario for small household electric and electronic equipment based on life cycle assessment. J. Environ. Manag. 2020, 254, 109679. [Google Scholar] [CrossRef] [PubMed]
  25. European Commission Joint Research Centre. Supporting Environmentally Sound Decisions for Waste Management; Institute for Environment and Sustainability: Ispra, Italy, 2011. [Google Scholar]
  26. Duke, C.; Thorun, C.; Dekeulenaer, F.; Svatikova, K.; Smit, T.; Lucica, E.; Kettner, S.; Landzaat, W.; Suter, J.; Rodriguez Diaz, A.; et al. Behavioural Study on Consumers’ Engagement in the Circular Economy—Final Report; European Commission, Directorate-General for Justice and Consumers: Brussels, Belgium, 2018. [Google Scholar]
  27. Department of Agriculture. Water and Environment. Stewardship for Consumer and Other Electrical and Electronic Products (Discussion Paper); Department of Agriculture: Canberra, Australia, 2021.
  28. Wagner, M.; Balde, C.P.; Luda di Cortemiglia, V.; Nnorom, I.; Kuehr, R.; Iattoni, G. Regional E-Waste Monitor for Latin America: Results for the 13 Countries Participating in Project UNIDO-GEF 5554; UNU/UNITAR: Bonn, Germany, 2022. [Google Scholar]
  29. Bovea, M.D.; Pérez-Belis, V.; Quemades-Beltrán, P. Attitude of the stakeholders involved in the repair and second-hand sale of small household electrical and electronic equipment: Case study in Spain. J. Environ. Manag. 2017, 196, 91–99. [Google Scholar] [CrossRef]
  30. Jayasiri, G.; Herat, S.; Kaparaju, P. Management of Small WEEE: Future Directions for Australia. Sustainability 2023, 15, 13543. [Google Scholar] [CrossRef]
  31. Parajuly, K.; Wenzel, H. Potential for circular economy in household WEEE management. J. Clean. Prod. 2017, 151, 272–285. [Google Scholar] [CrossRef]
  32. Belén Ramos, S.F. Premature Obsolescence Multi-Stakeholder Product Testing Program; 2023. Available online: https://cordis.europa.eu/project/id/820331 (accessed on 17 December 2023).
  33. Agamuthu, P.; Cooper, J.; Herat, S. Dilemma in re-use and recycling of waste electrical and electronic equipment. Waste Manag. Res. 2012, 30, 1111–1112. [Google Scholar] [CrossRef] [PubMed]
  34. Miliute-Plepiene, J. Reusability and the Potential Environmental Impact of Small Electronics; IVL Svenska Miljöinstitutet AB: Stockholm, Sweden, 2021. [Google Scholar]
  35. Šimková, L.; Križan, P. Current Status of Re-Use in Central Europe. Holist. Approach Environ. 2014, 4, 49–55. [Google Scholar]
  36. Pérez-Belis, V.; Braulio-Gonzalo, M.; Juan, P.; Bovea, M.D. Consumer attitude towards the repair and the second-hand purchase of small household electrical and electronic equipment. A Spanish case study. J. Clean. Prod. 2017, 158, 261–275. [Google Scholar] [CrossRef]
  37. Shittu, O.S.; Williams, I.D.; Shaw, P.J. Prospecting reusable small electrical and electronic equipment (EEE) in distinct anthropogenic spaces. Resour. Conserv. Recycl. 2022, 176, 105908. [Google Scholar] [CrossRef]
  38. Casey, K.; Lichrou, M.; Fitzpatrick, C. Treasured trash? A consumer perspective on small Waste Electrical and Electronic Equipment (WEEE) divestment in Ireland. Resour. Conserv. Recycl. 2019, 145, 179–189. [Google Scholar] [CrossRef]
  39. Banaszkiewicz, K.; Pasiecznik, I.; Cieżak, W.; Boer, E.D. Household E-Waste Management: A Case Study of Wroclaw, Poland. Sustainability 2022, 14, 11753. [Google Scholar] [CrossRef]
  40. WEEE Forum. Eco-Modulation of Fees for ‘Greener’ Products—Concerns and Challenges; WEEE Forum: Brussels, Belgium, 2021. [Google Scholar]
  41. Fraige, F.Y.; Al-Khatib, L.A.; Alnawafleh, H.M.; Dweirj, M.K.; Langston, P.A. Waste electric and electronic equipment in Jordan: Willingness and generation rates. J. Environ. Plan. Manag. 2012, 55, 161–175. [Google Scholar] [CrossRef]
  42. Productivity Commission. Right to Repair—Productivity Commission Inquiry Report; Australian Government: Canberra, Australia, 2021.
  43. Office of Circular Economy; Department of Environment and Science. Queensland E-Products Action Plan 2023–2033 (Draft); Office of Circular Economy: Westcourt, Australia, 2023.
  44. IBISWorld. Online Small Electrical Appliance Sales in Australia; IBISWorld: California, CA, USA, 2023. [Google Scholar]
  45. Chancerel, P.; Rotter, S. Recycling-oriented characterization of small waste electrical and electronic equipment. Waste Manag. 2009, 29, 2336–2352. [Google Scholar] [CrossRef]
  46. Bontinck, P.A.; Bricout, J.; Grant, T.G.L. E-Product Stewardship in Australia: Evidence Report. A Report Prepared for the Commonwealth Department of Agriculture, Water and the Environment by Iceni Group and Lifecycles, Sydney, Australia; Australian Government: Canberra, Australia, 2021.
  47. Unger, N.; Beigl, P.; Höggerl, G.; Salhofer, S. The greenhouse gas benefit of recycling waste electrical and electronic equipment above the legal minimum requirement: An Austrian LCA case study. J. Clean. Prod. 2017, 164, 1635–1644. [Google Scholar] [CrossRef]
  48. Jadhao, P.R.; Ahmad, E.; Pant, K.; Nigam, K.D.P. Advancements in the field of electronic waste Recycling: Critical assessment of chemical route for generation of energy and valuable products coupled with metal recovery. Sep. Purif. Technol. 2022, 289, 120773. [Google Scholar] [CrossRef]
  49. Horta Arduin, R.; Mathieux, F.; Huisman, J.; Blengini, G.A.; Charbuillet, C.; Wagner, M.; Baldé, C.P.; Perry, N. Novel indicators to better monitor the collection and recovery of (critical) raw materials in WEEE: Focus on screens. Resour. Conserv. Recycl. 2020, 157, 104772. [Google Scholar] [CrossRef] [PubMed]
  50. Nowakowski, P. A novel, cost efficient identification method for disassembly planning of waste electrical and electronic equipment. J. Clean. Prod. 2018, 172, 2695–2707. [Google Scholar] [CrossRef]
  51. Islam, M.T.; Huda, N. Reverse logistics and closed-loop supply chain of Waste Electrical and Electronic Equipment (WEEE)/E-waste: A comprehensive literature review. Resour. Conserv. Recycl. 2018, 137, 48–75. [Google Scholar] [CrossRef]
  52. Ministry of Economy, Trade, and Industry. Results of Small Home Appliance Collection; Ministry of Economy, Trade, and Industry: Canberra, Australia, 2022.
  53. ElectroRecycle. What Happens to the Small Appliances and Power Tools I Drop off for Recycling? CESA: Calgary, AB, Canada, 2022. [Google Scholar]
  54. Golev, A.; Corder, G.D.; Rhamdhani, M.A. Estimating flows and metal recovery values of waste printed circuit boards in Australian e-waste. Miner. Eng. 2019, 137, 171–176. [Google Scholar] [CrossRef]
  55. Golev, A.; Corder, G.D. Quantifying metal values in e-waste in Australia: The value chain perspective. Miner. Eng. 2017, 107, 81–87. [Google Scholar] [CrossRef]
  56. Islam, M.T.; Huda, N. 23—E-waste management practices in Australia. In Handbook of Electronic Waste Management; Prasad, M.N.V., Vithanage, M., Borthakur, A., Eds.; Butterworth-Heinemann: Oxford, UK, 2020; pp. 553–576. [Google Scholar]
  57. Busby, G.; Bremner, A.M. Western Australia E-Waste Material Flow Analysis; Encycle Consulting: Canberra, Australia, 2021. [Google Scholar]
  58. Golev, A.; Schmeda-Lopez, D.R.; Smart, S.K.; Corder, G.D.; McFarland, E.W. Where next on e-waste in Australia? Waste Manag. 2016, 58, 348–358. [Google Scholar] [CrossRef] [PubMed]
  59. Islam, M.T.; Huda, N. E-waste in Australia: Generation estimation and untapped material recovery and revenue potential. J. Clean. Prod. 2019, 237, 117787. [Google Scholar] [CrossRef]
  60. Johnson, M.; Fitzpatrick, C.; Wagner, M.; Huisman, J. Modelling the levels of historic waste electrical and electronic equipment in Ireland. Resour. Conserv. Recycl. 2018, 131, 1–16. [Google Scholar] [CrossRef]
  61. Randell, P. Victorian E-Waste Material Flow Analysis 2021; Randell Environmental Consulting, Blue Environment: Woodend, Australia, 2022. [Google Scholar]
  62. Islam, M.T.; Huda, N. Material flow analysis (MFA) as a strategic tool in E-waste management: Applications, trends and future directions. J. Environ. Manag. 2019, 244, 344–361. [Google Scholar] [CrossRef]
  63. Forti, V.; Kuehr, R.; Balde, C.P. E-Waste Statistics: Guidelines on Classification, Reporting and Indicators; United Nations University, IAS-SCYCLE: Bonn, Germany, 2018. [Google Scholar]
  64. Bakker, C.; Wang, F.; Huisman, J.; den Hollander, M. Products that go round: Exploring product life extension through design. J. Clean. Prod. 2014, 69, 10–16. [Google Scholar] [CrossRef]
  65. Islam, M.T.; Huda, N. Assessing the recycling potential of “unregulated” e-waste in Australia. Resour. Conserv. Recycl. 2020, 152, 104526. [Google Scholar] [CrossRef]
  66. Ikhlayel, M. Differences of methods to estimate generation of waste electrical and electronic equipment for developing countries: Jordan as a case study. Resour. Conserv. Recycl. 2016, 108, 134–139. [Google Scholar] [CrossRef]
  67. Warranty, C.H. How Long Do Your Appliances Last? Available online: http://www.choicehomewarranty.com/blog/long-appliances-last/ (accessed on 11 October 2023).
  68. IBISWorld. Household Appliance Manufacturing in Australia; IBISWorld: California, CA, USA, 2023. [Google Scholar]
  69. European Committee of Domestic Equipment Manufacturers (CECED). Material Flows of the Home Appliance Industry; CECED: Brussels, Belgium, 2018. [Google Scholar]
  70. Tran, H.P.; Schaubroeck, T.; Nguyen, D.Q.; Ha, V.H.; Huynh, T.H.; Dewulf, J. Material flow analysis for management of waste TVs from households in urban areas of Vietnam. Resour. Conserv. Recycl. 2018, 139, 78–89. [Google Scholar] [CrossRef]
  71. Habuer; Nakatani, J.; Moriguchi, Y. Time-series product and substance flow analyses of end-of-life electrical and electronic equipment in China. Waste Manag. 2014, 34, 489–497. [Google Scholar] [CrossRef] [PubMed]
  72. Parajuly, K.; Habib, K.; Liu, G. Waste electrical and electronic equipment (WEEE) in Denmark: Flows, quantities and management. Resour. Conserv. Recycl. 2017, 123, 85–92. [Google Scholar] [CrossRef]
  73. Zeng, X.; Gong, R.; Chen, W.-Q.; Li, J. Uncovering the Recycling Potential of “New” WEEE in China. Environ. Sci. Technol. 2016, 50, 1347–1358. [Google Scholar] [CrossRef]
  74. Siregar, B.; Butar-Butar, I.; Rahmat, R.; Andayani, U.; Fahmi, F. Comparison of exponential smoothing methods in forecasting palm oil real production. Proc. J. Phys. Conf. Ser. 2017, 801, 012004. [Google Scholar] [CrossRef]
  75. Baldé, C.P.; Yamamoto, T.; Forti, V. Statistical Briefing on Invisible E-Waste for International E-Waste Day 2023; United Nations Institute for Training and Research: Bonn, Germany, 2023. [Google Scholar]
  76. Joe Pickin, P.R.; Trinh, J.; Grant, B. National Waste Report 2018; Blue Environment Pty Ltd.: Docklands, Australia, 2018. [Google Scholar]
  77. Australian Government. National Waste Policy Action Plan; Australian Government: Canberra, Australia, 2019.
  78. Department of Climate Change, Energy, the Environment and Water. Wired for Change: Regulation for Small Electrical Products and Solar Photovoltaic System Waste; Department of Climate Change, Energy, the Environment and Water: Canberra, Australia, 2023.
  79. Haig, S.; Morrish, L.; Morton, R.; Wilkinson, S. Electrical Product Material Composition. 2012. Available online: https://www.moew.government.bg/static/media/ups/tiny/filebase/Waste/EEO/Electrical_product_material_composition_overview.pdf (accessed on 17 December 2023).
Figure 1. Material composition of small EEE.
Sustainability 16 03035 g001
Figure 2. Small WEEE generation rates (2010–2050).
Sustainability 16 03035 g002
Figure 3. Material flow (ktons) of small WEEE in 2050.
Sustainability 16 03035 g003
Figure 4. Small WEEE generation rates (2025–2050): (a) 25% of small EEE from 2030 onwards with lifespan variation and without any PoM reduction; (b) 25% of small EEE from 2030 onwards with lifespan variation and with 25% PoM reduction from 2030 onwards.
Sustainability 16 03035 g004aSustainability 16 03035 g004b
Figure 5. Material recovery in 2050 for different scenarios: (a) material quantities; (b) potential revenues.
Sustainability 16 03035 g005aSustainability 16 03035 g005b
Figure 6. Material flow in 2050 for different scenarios: (a) SCN 21; (b) SCN 45.
Sustainability 16 03035 g006aSustainability 16 03035 g006b
Table 1. Small EEE considered in this study.
UNU KeyShortened Reference NameSamples of EEE in the Subcategory [27]Average Lifespan in Years [3]Average Weights in kg [3]
0114MicrowavesMicrowave ovens used for domestic purposes.15.921.5
0201Clocks, watches, irons, fansElectric blankets, roof fans, personal weighing machines, household sewing machines, domestic appliances with electric motor, electric irons, watches, clocks.7.51.06
0202Food preparation EEEDomestic food grinders, mixers, juice extractors, toasters.9.83.27
0203Hot water EEEElectric instantaneous heaters or storage water heaters, electric coffee or tea makers.7.21.89
0204Vacuum cleanersVacuum cleaners with and without self-contained motor.9.95.67
0205Personal careHair removing, dressing, and drying apparatus, electric shavers, hand drying apparatus.7.60.55
0401Consumer EEEMicrophones and stands, headphones and earphones, and combined microphone/speaker sets.9.10.39
0402Portable AVRadio broadcast receivers which can be operated without an external power source.9.00.27
0403Music, radio instrumentOffice machines (bank not dispensers, coin-sorting machines), stapling machines, amplifiers, sound recording apparatus, radio and broadcast receivers which require an external power source, musical instruments.8.93.82
0404Video playersVideo recorders, DVD, Blu-ray setup boxes, projectors.7.93.51
0405SpeakersSingle and multiple mounter loudspeakers.12.02.33
0406CamerasTelevision and digital cameras, video camera recorders.6.40.45
0601Household toolsDrills, saws, high-pressure cleaners, lawnmowers, soldering machines.13.32.52
0701ToysCar racing sets, electric trains, music toys, biking computers, drones.4.10.45
0702Game consolesVideo game consoles.4.60.48
0801Household medical EEEThermometers, BP meters, hearing aids.11.90.18
0901Household monitoring EEEAlarms, heat and smoke sensors, instruments to measure flow level, pressure voltage, current resistance.5.30.24
Table 2. Variation of small WEEE for different scenarios as a percentage of the baseline scenario.
Scenario no. (SCN)Lifespan VariationSmall EEE AppliedApplied YearPoM VariationApplied Year 2035204020452050
220%50%20300%N/A−4%−4%−3%−2%
320%100%20300%N/A−8%−8%−6%−4%
450%50%20300%N/A−8%−9%−7%−5%
550%100%20300%N/A−16%−18%−14%−11%
620%50%20400%N/A0%0%−4%−4%
720%100%20400%N/A0%0%−8%−8%
850%50%20400%N/A0%0%−8%−9%
950%100%20400%N/A0%0%−16%−17%
10−20%50%20300%N/A5%5%3%2%
11−20%100%20300%N/A11%9%7%5%
12−50%50%20300%N/A17%13%8%6%
13−50%100%20300%N/A34%25%16%11%
14−20%50%20400%N/A0%0%5%5%
15−20%100%20400%N/A0%0%11%9%
16−50%50%20400%N/A0%0%17%12%
17−50%100%20400%N/A0%0%33%24%
1820%25%2030−25%2030−14%−21%−24%−25%
1920%50%2030−25%2030−16%−23%−25%−26%
2020%25%2030−50%2030−27%−41%−47%−49%
2120%50%2030−50%2030−28%−42%−47%−50%
2220%25%2040−25%20400%0%−14%−21%
2320%50%2040−25%20400%0%−16%−23%
2420%25%2040−50%20400%0%−27%−41%
2520%50%2040−50%20400%0%−28%−42%
2650%25%2030−25%2030−16%−23%−26%−26%
2750%50%2030−25%2030−19%−26%−28%−28%
2850%25%2030−50%2030−28%−42%−48%−50%
2950%50%2030−50%2030−30%−44%−49%−51%
3050%25%2040−25%20400%0%−16%−23%
3150%50%2040−25%20400%0%−19%−26%
3250%25%2040−50%20400%0%−28%−42%
3350%50%2040−50%20400%0%−30%−44%
34−20%25%203025%203016%23%25%26%
35−20%50%203025%203019%26%27%27%
36−20%25%203050%203030%43%48%50%
37−20%50%203050%203034%47%51%52%
38−20%25%204025%20400%0%16%23%
39−20%50%204025%20400%0%19%26%
40−20%25%204050%20400%0%30%43%
41−20%50%204050%20400%0%34%47%
42−50%25%203025%203023%28%28%28%
43−50%50%203025%203034%36%33%31%
44−50%25%203050%203038%49%52%53%
45−50%50%203050%203051%59%58%57%
46−50%25%204025%20400%0%23%27%
47−50%50%204025%20400%0%34%35%
48−50%25%204050%20400%0%38%49%
49−50%50%204050%20400%0%51%58%
Disclaimer/Publisher’s Note: The statements, opinions and data contained in all publications are solely those of the individual author(s) and contributor(s) and not of MDPI and/or the editor(s). MDPI and/or the editor(s) disclaim responsibility for any injury to people or property resulting from any ideas, methods, instructions or products referred to in the content.

