Article

Study on the Spatiotemporal Evolution of Urban Land Use Efficiency in the Beijing–Tianjin–Hebei Region

1
College of Biochemical Engineering, Beijing Union University, Beijing 100023, China
2
College of Applied Arts and Sciences, Beijing Union University, Beijing 100191, China
*
Author to whom correspondence should be addressed.
Sustainability 2024, 16(7), 2962; https://doi.org/10.3390/su16072962
Submission received: 27 December 2023 / Revised: 22 February 2024 / Accepted: 1 March 2024 / Published: 2 April 2024

Abstract

:
The Beijing–Tianjin–Hebei region (BTH) is one of the crucial areas for economic development in China. However, rapid urban expansion and industrial development in this region have severely impacted the surrounding ecological environment. The air quality, water, and soil resources face significant pressure. Due to the close relationship between land utilization, population, investment, and industry, effective land use is a key factor in the coordinated development of the region. Therefore, clarifying the patterns of urban land use change and revealing its influencing factors can provide important scientific evidence for the coordinated development of the BTH region. This study aims to improve urban land use efficiency (ULUE) in the BTH region. Firstly, based on the input and output data of land elements for the 13 cities in the BTH region, the Data Envelopment Analysis (DEA) method is used to quantify the ULUE of the BTH urban agglomeration and analyze the spatiotemporal characteristics of ULUE. Input indicators includes capital, labor, and land. Output indicators includes economy, society, and environment. The results show that the overall ULUE in the BTH region has increased, albeit with notable fluctuations. Between 2000 and 2010, ULUE rose swiftly across all cities except Beijing and Tianjin, where changes were minimal. Post-2010, cities exhibited varied trends: steady growth, slow growth, sustained growth, step-wise growth, and initial growth followed by decline. Spatially, before 2010, the BTH showed a “high in the northeast and low in the southwest” pattern, transitioning post-2010 to a smoother “core-periphery” pattern. Mid-epidemic, high ULUE values reverted to the core area, shifting southward post-epidemic. Secondly, panel data analysis is conducted to explore the factors influencing ULUE. The results indicate that fiscal balance, the level of openness, the level of digitalization, industrial structure, and the level of green development are significant factors affecting ULUE. Finally, strategies are proposed to improve ULUE in the BTH region, including national spatial planning, industrial layout, existing land use, infrastructure construction, optimization of local fiscal revenue, and improvement in the business environment, aiming to enhance ULUE and promote the coordinated development of industries in the BTH region.

1. Introduction

The current global urbanization rate has exceeded 50%, and it is projected that by 2050 more than 70% of the world’s population will live in cities [1]. This rapid urbanization is driving significant changes in land use and land cover (LULC) patterns. Many natural and semi-natural ecosystems are being transformed into urban areas with impermeable surfaces. This transformation has profound impacts on regional landscape patterns, biogeochemical cycles, hydrological processes, and biodiversity [2]. Furthermore, the formation of urban clusters intensifies land use conflicts [3]. Population growth compounds these land use challenges. However, the concentrated development in cities might offer a way to mitigate excessive exploitation of land resources [4]. These trends in urbanization and the development of urban clusters highlight the urgent need for efficient and sustainable land resource management in contemporary society [5].
As urban agglomerations expand, blurring city boundaries, they foster complex land use interactions, both within and among urban areas. Luo’s research in the Yangtze River Delta illustrates how such expansions lead to environmental shifts, notably the Urban Dry Island (UDI) effect, marked by reduced atmospheric humidity and an increased water vapor pressure deficit [6]. Additionally, urban growth is linked to an increase in extreme climate events, such as intensified heat and milder cold extremes [7]. The effectiveness of climate adaptation policies in these areas is uncertain, especially as agglomerations might worsen climate vulnerability disparities [8]. Studies show that the spatial layout of urban agglomerations, particularly their multicenter nature and transport connectivity, profoundly impact carbon emissions [9]. Yan highlights the warming effects in developed agglomerations in China, exacerbated by urbanization and agricultural activities [10]. Changes in land use and cover significantly affect ecosystem health. Chen [11] and Gao [12] pinpoint urban expansion and land transfer as key influencers. Yu et al. found that urban expansion, along with farmland protection policies, can harm ecological quality [13], while Chen et al. identified the critical role of forests and hydrological systems in ecosystem services [14]. Different urban agglomerations exhibit varying impacts. Liu’s study on the Beijing–Tianjin–Hebei (BTH) area focuses on factors affecting water resources and the environment [15], and Wang links land use changes in the Chengdu-Chongqing region to demographic, economic, and policy factors [16]. Zhai’s simulations in the Pearl River Delta underscore the necessity of ecological protection [17]. Shurpali’s work points to the broader implications of urbanization on biogeochemical cycles, emphasizing the need for sustainable development [18]. These studies collectively reveal a complex interplay between urbanization, land use changes, and ecosystem health.
The BTH, a crucial hub for economic development in China, encompasses 13 cities, including two municipalities directly under the central government (Beijing and Tianjin) and 11 prefecture-level cities in Hebei Province. The BTH Economic Circle has seen substantial social and economic advancement in recent years, marked by a significant improvement in urbanization levels. However, the region’s long-standing development model, characterized by high energy consumption, low income, and high pollution, remains largely unchanged. Addressing how to enhance ULUE in the BTH region is a pertinent issue. The structure of this paper is as follows: Section 2 provides a comprehensive literature review, setting the stage for our study. In Section 3, we detail the methodological framework, elaborating on the specific methods employed and the data collection process. Section 4 is dedicated to presenting our analysis results, which include the temporal and spatial change characteristics, as well as the influencing factors of ULUE. In Section 5, we delve into the key findings of our research, discussing their practical implications and offering policy recommendations. Finally, Section 6 concludes the paper, summarizing the main points and suggesting directions for future research. This structure is designed to provide a clear and logical progression, facilitating a thorough understanding of our study’s contributions to the field of ULUE.

2. Literature Review

2.1. BTH Urban Agglomeration

The BTH region stands as a pivotal area for China’s economic development, witnessing one of the country’s fastest urbanization processes. Beijing, the China’s political capital, is not only a cultural and international communication center but also a hub for technological innovation, driving the region’s economy with its well-developed financial, technological, and cultural industries. Tianjin Port, the largest in northern China, plays a vital role in international trade, significantly contributing to the regional economy. Meanwhile, Hebei Province boasts rich natural resources and a robust agricultural sector. Over the past 15 years, urbanization rates in Beijing, Tianjin, and Hebei have markedly increased—from 83.62%, 75.11%, and 37.69% in 2005 to 86.6%, 83.5%, and 60.1% in 2020, respectively. This growth, fueled by rapid demographic and economic expansion, has led to an escalating demand for urban land and accelerated spatial expansion. Consequently, the tension between the sustainability of urban agglomerations’ resources and environment and the needs of socio-economic development has become increasingly pronounced [19,20].
The urban expansion and industrial evolution within the BTH region have significantly influenced its ecological surroundings. Between 2010 and 2020, the industrial structure of the BTH region shifted, with the primary, secondary, and tertiary sectors changing from 8%, 42%, and 50% to 7%, 37%, and 56%, respectively. This shift toward more secondary and tertiary industries has attracted a substantial population, including a highly mobile workforce and numerous urban dwellers, intensifying the demand for urban land. Concurrently, this period witnessed a 4.17% increase in the average area of construction land, while agricultural and ecological lands saw reductions of 1.57% and 0.77%, respectively. These changes underscore the ongoing acceleration of urban spatial expansion, reflecting the challenges of balancing development with ecological and agricultural land conservation.
Air quality and water–soil resources in the BTH region face immense pressure, with Beijing and Tianjin experiencing especially high levels of atmospheric pollution. Furthermore, water and soil resources are distributed unevenly across the region, leading to scarcity in certain cities. The high urbanization levels and dense populations of Beijing and Tianjin, contrasted with the varied development of urban and rural areas in Hebei Province, highlight a significant imbalance. This situation reflects the deep contradictions between the resource environment of urban clusters and the socio-economic development across the region, underscoring the need for nuanced approaches to manage these challenges.
Wang’s research demonstrates that urban administrative boundaries significantly influence urban land use, with land use distribution within urban clusters transitioning from equilibrium to disequilibrium. Specifically, in the BTH urban cluster, discrepancies between population aggregation and land distribution in certain cities highlight the need to dismantle administrative barriers to facilitate rational land utilization [21]. Tian’s findings indicate that the BTH region’s industrial land suffers from low utilization efficiency, with a notable lack of intensive distribution and significant disparities in ULUE across different industries. This suggests an imperative to elevate industry access quality standards in the area [22]. Ma and He have observed an incremental improvement in ULUE in recent years, albeit with regional variances. Efficiency is linked to industrial policies and urban scale, and the prevalence of non-agricultural use of substantial agricultural lands, along with a mixed low-density development pattern of residential and industrial areas in some BTH cities, leads to reduced ULUE in the region [23,24]. Bao and Liao identify the urban structure as a determinant of ULUE, which in turn is influenced by economic growth, social welfare, and environmental emissions. The BTH region, located at the transitional area between the Taihang Mountains, Yanshan, and the Bashang Plateau, faces topographical limitations and rapid urbanization challenges that significantly impact its ULUE. Thus, effective urban planning is essential for improving ULUE in the BTH region [3,25]. Despite some advancements within the BTH urban agglomeration, the issue of ULUE warrants further investigation. The 14th Five-Year Plan explicitly calls for urban agglomerations, including BTH, to enhance their urbanization spatial layout and establish a robust mechanism for the integrated and coordinated development of urban agglomerations. With the BTH coordinated development strategy and the Xiong’an New Area plan in Hebei underway, urban land use is poised for a new development trend and spatial pattern. Therefore, a thorough analysis of the spatiotemporal changes and determinants of ULUE in the BTH region is crucial for understanding urban land use dynamics and uncovering the ecological impacts of urbanization [26].

2.2. ULUE

Measuring land use efficiency is pivotal for guiding land use management decisions and promoting more effective and efficient land utilization strategies [27]. In the global context, various methods for assessing ULUE have been developed, including the Construction of Indicator System [28], Stochastic Frontier Analysis (SFA) [29], Data Envelopment Analysis (DEA) [19,30,31,32], Slacks-Based Measure (SBM) model [26,33,34], Super Epsilon-Based Measure (Super-EBM) Model [19], DID model, and Random Forest Algorithm [35]. Among these, DEA stands out as a non-parametric approach capable of evaluating multiple outputs and inputs simultaneously, gaining widespread recognition in academia for its ability to mitigate the impact of subjective bias in weight assignments, thus enhancing the precision of ULUE assessments [36,37]. However, as DEA analyzes technical efficiency through relative comparisons between units, the efficiency scores it generates represent relative rather than absolute efficiency. This method does not account for potential measurement errors in the data [2,38], presenting limitations that necessitate careful consideration when interpreting results.
Substantial advancements have been achieved in identifying factors that impact ULUE. Urban spatial form is recognized as a key determinant [19,34], with other factors like per capita grain possession [33] and population density [26] also drawing significant attention. The role of technology investment and pollution emissions in influencing ULUE is noted as critical [39]. In BTH region, fiscal balance, the foreign capital utilization, industrial structure and the green development level affect land use efficiency [40]. Chavunduka’s case study on Zimbabwe’s swift railway land reform suggests public infrastructure and service investments do not necessarily substantially improve ULUE, land governance, land tenure and macroeconomic policies are more effective [41]. These findings point to the multifaceted nature of the factors affecting ULUE, necessitating more nuanced and comprehensive investigations. The studies reveal regional disparities within China’s urban ULUE, spotlighting the importance of varying drivers, such as developmental stages and the presence of high-efficiency zones [31,34,39,42]. Explorations of regional cooperation in ULUE, especially within the Yangtze River Delta, and analyses of spatial disparities and convergence mechanisms, including environmental constraints, deepen the understanding of regional variations [19,43,44,45]. These insights highlight the imperative for customized policies that address regional differences and bolster ULUE overall.
In summary, this research aims to expand knowledge of ULUE in the BTH region. By introducing the S-DEA model, it aims to refine ULUE assessment techniques, offering a detailed view of efficiency dynamics across both time and geographical dimensions. This study’s exploration into the spatiotemporal fluctuations in ULUE sheds light on the shifting patterns of land use efficiency within the BTH urban agglomeration. It meticulously examines the myriad of factors that influence ULUE, aiming to enrich the academic discourse on the complex interactions among economic, environmental, and developmental elements in urban land utilization. Furthermore, this study seeks to deliver practical benefits by equipping policymakers with comprehensive insights and strategic recommendations, thereby enabling them to make well-informed decisions that foster sustainable economic development with a keen emphasis on ULUE optimization.

3. Methodology

3.1. Analytical Framework

This study focuses on enhancing the efficiency of land utilization in the BTH region. Figure 1 illustrates the research framework of this study. Firstly, we establish an indicator system for land utilization efficiency, incorporating factors such as labor input, capital input, land input, economic output, social output, and environmental output. Utilizing the DEA model, we measure the land utilization efficiency in the BTH region. Secondly, we analyze the temporal and spatial variations in land utilization efficiency within the region. Thirdly, employing economic, environmental, social factors and policy factors as frameworks, we analyze the primary influencing factors on land utilization efficiency in the BTH region. Finally, based on the aforementioned analyses, we propose policy recommendations aimed at enhancing land utilization efficiency in the region, encompassing urban planning, fiscal revenue, industrial layout, business environment, land investment, and infrastructure development.

3.2. DEA Model

The DEA model, also known as Data Envelopment Analysis, is a quantitative analysis method that evaluates the relative efficiency of comparable units by utilizing linear programming based on multiple input and output indicators. This study chooses the DEA model to analyze land utilization efficiency for the following reasons:
The first, it enables a comprehensive evaluation of multiple indicators. The DEA model can comprehensively consider multiple input and output indicators without the need to preset weights. In the study of land utilization efficiency, various factors such as land area, output, and input are involved, and the DEA model can effectively integrate these indicators for evaluation.
The second, it is an unbiased efficiency assessment. The DEA model does not require predefined standards for efficiency evaluation. Instead, it compares the actual performance of each unit in the dataset to determine relative effectiveness. This approach helps avoid inaccuracies that may arise from subjective preferences or artificially set land utilization standards.
The third, the DEA model is a non-parametric method that does not rely on specific function forms. It is suitable for various types and scales of units, making it more flexible in handling land utilization efficiency issues without excessive assumptions about the land use process.
The fourth, the DEA model identifies the “efficient frontier”, which represents units achieving the maximum output given certain inputs. This helps decision makers better understand factors influencing land utilization efficiency and provides directional strategies for improving efficiency.
The fifth, the DEA model is suitable for empirical research and can assess land utilization efficiency in different regions or units based on real data. This enables researchers to understand local land utilization efficiency issues based on the actual conditions of different regions.
In summary, this study chooses the DEA model to measure land utilization efficiency in the BTH region because of its comprehensiveness, flexibility, and adaptability to regional circumstances. The DEA model serves as an effective tool for evaluating and improving land utilization efficiency.

3.2.1. Basic Model

The DEA model comprises the following elements: The first, decision making unit (DMU). The entity or individual being evaluated is referred to as the decision-making unit. DMUs can be companies, organizations, production units, etc., depending on the context of the study. The second, inputs and outputs. Inputs in the DEA model refer to the resources consumed by the decision-making unit, while outputs represent the results or value generated by the unit. Inputs and outputs need to be measured using appropriate quantitative indicators. The third, efficiency evaluation. The primary objective of the DEA model is to evaluate the efficiency of decision-making units. Generally, units are considered more efficient when they consume fewer inputs and produce greater outputs. The forth, efficiency frontier. The efficiency frontier represents the theoretically highest level of efficiency achievable under given input and output conditions. Units on the efficiency frontier are considered 100% efficient, while those below the frontier are deemed to have room for improvement.
The initial DEA model is the CCR model (Charnes, Cooper, Rhodes model), which is based on constant returns to scale. However, in reality, the scale returns of decision-making units may vary. Therefore, Banker et al. improved the CCR model to form the BBC model (Banker, Charnes, Cooper model) to study the input–output efficiency under variable returns to scale [46].
The basic structure of the BBC model is as follows:
The initial model of DEA was the CCR model, which assumed that there were n decision-making units, each with m inputs and s outputs, with an output vector of Y j = Y 1 j , Y 2 j , , Y m j T and an input vector of X j = X 1 j , X 2 j , , X m j T ; Y r j represents that the jth decision unit has r outputs and X i j represents that the jth decision unit has i inputs. λ j is the weight vector of the input–output. The CCR mode for its investment planning is
m i n θ ε i = 1 m s i + r = 1 s s r + = V D , s . t . j = 1 n X i j λ j + s i = θ X 0 i 1 ,   2 , , m j = 1 n Y r j λ j s r + = Y 0 r 1 ,   2 , , s λ j 0 ,   j = 1 ,   2 , , n ,   s i 0 ,   s r + 0 .
The BBC model decomposes overall efficiency into technical efficiency and scale efficiency. Technical efficiency reflects the efficiency brought about by technical factors. A value equal to 1 indicates that the factors are reasonably utilized. If the value is less than 1, it indicates that there is room for improvement in technical efficiency. Scale efficiency reflects the efficiency brought about by the size of the scale. A value equal to 1 indicates constant scale efficiency (optimal state). A value less than 1 indicates increasing scale efficiency (expanding the scale may increase efficiency), while a value greater than 1 indicates decreasing scale efficiency (reducing the scale may increase efficiency). Overall efficiency reflects the efficiency of the decision-making unit’s factors. The value is calculated as the product of technical efficiency and scale efficiency and is less than or equal to 1. Slack Variable S− represents how much input can be reduced to achieve target efficiency. Slack Variable S+ represents how much output can be increased to achieve target efficiency. Combining the overall efficiency indicator, S−, and S+, there are three indicators that can judge the effectiveness of DEA. If the overall efficiency equals 1 and both S− and S+ are 0 it is termed “DEA strong efficiency”. If the overall efficiency is 1 but either S− or S+ is greater than 0 it is termed “DEA weak efficiency”. If the overall efficiency is less than 1 it is termed “non-DEA efficiency”.
The BBC model, derived from the CCR model, effectively addresses variations in scale returns caused by factors such as unfair competition and constraints on input resources. Therefore, this study initially adopts the BBC model to compute the comprehensive efficiency, pure technical efficiency, and scale efficiency of land utilization.

3.2.2. S-DEA Model

The Super-Efficiency DEA model (S-DEA) further addresses the limitation of the CCR model, which cannot provide further comparisons and evaluations among multiple decision-making units. It enables efficient decision-making units to be compared and ranked [19,47,48,49]. Super-efficiency refers to certain decision-making units being more effective relative to others, meaning they can achieve more output with the same input or consume less input for the same output. The S-DEA model captures this super-efficiency by allowing some decision-making units to have efficiency scores exceeding 1. While traditional DEA models assume all decision-making units are on the same efficiency frontier, the S-DEA model relaxes this assumption, allowing some units to surpass this frontier. This makes the S-DEA model more suitable for identifying decision-making units that perform optimally under given resource conditions, thus producing results that may better reflect real-world scenarios.
The difference between the S-DEA model and the CCR and BBC models lies in the model’s structure. When computing the efficiency of the jth decision-making unit, its inputs and outputs are replaced by a linear combination of inputs and outputs from all other decision-making units, excluding itself, as opposed to the CCR model where it includes itself. The S-DEA model is formulated as follows:
m i n θ ε i = 1 m s i + r = 1 s s r + = V D , s . t . j = 1 , j j 0 n X i j λ j + s i θ X 0 j = 1 , j j 0 n Y j λ j s r + = Y 0 λ j 0 ,   j = 1,2 , , n ,   s i 0 ,   s r + 0 .
Using the S-DEA model to study land utilization efficiency offers several advantages:
The first, land utilization involves numerous non-linear relationships, and the S-DEA model is more adept at capturing these non-linear relationships compared to traditional linear DEA models. This makes the model more suitable for describing the complex interactions that may exist in land utilization.
The second, land resources possess inherent rigidity. The S-DEA model allows for the identification of decision-making units that can achieve better benefits under the same land resource conditions, which is practically significant for optimizing land utilization efficiency.
The third, land utilization may involve various types of decision-making units, such as agriculture, industry, urban planning, etc. The S-DEA model permits different types of decision-making units to excel in some aspects while performing averagely in others.
The fourth, land utilization is closely related to environmental sustainability. The S-DEA model can handle environmental indicators more effectively, aiding in the assessment of the impact of land utilization on the environment and seeking more sustainable solutions.
These advantages make the S-DEA model a valuable tool for studying land utilization efficiency, particularly in addressing the complexities and nuances associated with land resource management and environmental sustainability.
However, the S-DEA model, relative to traditional DEA models, introduces increased computational complexity. It may also be more sensitive to noise and uncertainty in the data, requiring additional computational resources and time. Moreover, when dealing with cases where the efficiency scores of certain decision-making units exceed 1, further explanation and interpretation are necessary. Therefore, in studying land utilization efficiency, comparing the results of Super-Efficiency DEA with those of traditional DEA models can offer a more comprehensive understanding of the efficiency levels among different decision-making units, thus providing support for the rational utilization of land resources.

3.3. Data Source

When using DEA to analyze ULUE, objective and fair selection of input and output indicators is necessary to accurately achieve the evaluation purpose. Therefore, the following four principles must be followed. Firstly, representativeness is essential; the chosen indicators should reflect all aspects of ULUE in the BTH region. Therefore, for a comprehensive assessment of ULUE, the selected indicators must encompass and represent the various types of land use and related outputs across the 13 cities. Secondly, reliability and availability are crucial; the chosen indicators must be reliable and readily available data. This data should be verified and collected over the same period and within the same geographical area to ensure the accuracy of comparisons. Consequently, statistical data released by official bodies, such as the National Bureau of Statistics or local planning departments, should be selected. Thirdly, interconnectedness is important; the chosen indicators should be interrelated to form a comprehensive assessment system. Since ULUE may be associated with urban planning policies, economic development levels, and environmental protection measures, it is necessary to select indicators that reflect these connections. Fourthly, comparability is required; the selected indicators should be comparable across different cities or regions. This often involves standardization to ensure that data from different cities within the urban cluster can be compared on the same temporal and spatial scales, typically using some relative measures. Lastly, interpretability: the chosen indicators should help elucidate various aspects of ULUE. This aids decision-makers in understanding the results of the ULUE assessment and formulating corresponding policies or action plans based on the assessment outcomes.

3.3.1. Input Indicators

Based on the four principles of constructing an ULUE indicator system, i.e., comprehensiveness, importance independence, and comparability, as well as previous research, this study incorporates land elements into the production function model, with three specific indicators: capital, labor, and land (Table 1) [39,40,50].
First, capital investment represents the capital expenditures of a city, considering the financial inputs required for land use, including expenditures on land improvement, facility construction, and more. This can encompass spending on fixed assets, intangible assets, and other expenditures. Fixed asset investment often demands a substantial amount of land resources for the construction of various facilities and infrastructure. General public budget expenditures are typically allocated to the construction and operation of urban infrastructure, social welfare, environmental protection, and other public services and facilities. These expenditures directly impact ULUE; hence, this paper employs the total social fixed asset investment and general public budget expenditures of a city to represent capital input.
Second, labor input, in a broad sense, can refer to the entire population, but in a narrow sense, it denotes the number of people who have the capacity to engage in labor or can be involved in productive labor activities within a certain period. This paper primarily considers human resources in urban land use. As urban production activities are dominated by industry and commerce, this paper selects the number of employees in the secondary and tertiary sectors to represent labor input.
Third, land input, in some studies, is included within capital input. However, as land can serve as a spatial carrier for both capital and labor elements, this paper sets land input as a separate indicator within the ULUE system. The expansion and densification of urban built-up areas typically reflect the economic growth and population increase of a city. The area of land occupied by the built-up area can be one of the direct indicators affecting ULUE; therefore, this paper uses the urban built-up area to represent land input.

3.3.2. Output Indicators

Based on the above principles, output indicators are selected from three aspects: economy, society, and environment (Table 2) [9,28,39,40].
First, economic output, considering the economic benefits of urban land use, primarily focusing on the output from the secondary and tertiary industries utilizing industrial and commercial land. Additionally, city governments also derive income from land use, where an increase in general public budget revenue can indirectly reflect improvements in ULUE. Thus, the chosen indicators for economic output from land use in this paper are the general public budget revenue and the added value of the secondary and tertiary industries.
Second, social output, considering the benefits of land use to society, such as improving residents’ living conditions. The selected indicators for social output from land use are the per capita residential area within the jurisdiction’s construction land; taking into account the benefits of land use for social culture and health, the total collection volume of public libraries and the number of hospital and health center beds are also chosen as indicators.
Third, environmental output evaluates the benefits of land use on the environment, such as pollution reduction and ecosystem protection. Urban parks and green spaces not only provide places for leisure and entertainment but also improve urban air quality, regulate urban climate, and reduce urban noise. Therefore, the selected indicator for environmental output from land use in this paper is the area of urban parks and green spaces.
Data related to capital input and economic output, such as total social fixed asset investment, general public budget expenditures, general public budget revenue, added value of the secondary industry, added value of the tertiary industry, the total collection volume of public libraries and the number of hospital and health center beds are sourced from the “China Urban Statistics Yearbook”. Data concerning population and labor force inputs, such as the urban resident population, number of employees in the secondary industry, and number of employees in the tertiary industry, are primarily sourced from the “China Population and Employment Statistics Yearbook”. Data regarding land area, such as the urban built-up area, residential land area, and urban green space area, are sourced from the “China Urban Construction Statistics Yearbook”. Due to data availability and the significant impact of the global COVID-19 pandemic on urban economic input, output, and employment data since 2020, the study utilizes data from 2000 to 2022 for econometric analysis. Additionally, based on the “Beijing Yearbook”, “Tianjin Statistical Yearbook”, “Hebei Economic Yearbook”, and relevant materials published in some Hebei city statistical bulletins, as well as domestic and foreign publications, some missing data and abnormal fluctuation data were smoothed out.

4. Results

4.1. ULUE Results

4.1.1. Comprehensive Efficiency

Comprehensive efficiency, also known as total efficiency, refers to the scenario where a decision-making unit is deemed effective when both pure technical efficiency and scale efficiency are equal to 1. In this context, comprehensive efficiency evaluates urban land utilization efficiency. Table 3 illustrates the comprehensive efficiency of the 13 cities in the BTH region from 2000 to 2022, with the average increasing from 0.940 to 0.998. The number of cities with relatively effective land use comprehensive efficiency has gradually increased, rising from 3 cities in 2000 to 11 cities by 2022. Over these 23 years, Beijing, Tianjin, and Shijiazhuang have maintained relatively stable land use comprehensive efficiency, while Hengshui, Langfang, Handan, Tangshan, and Qinhuangdao have experienced relatively rapid growth in their land use comprehensive efficiency. Chengde, Xingtai, and Zhangjiakou have seen significant fluctuations in their land use comprehensive efficiency. From an average value perspective, Beijing, Tianjin, Langfang, Tangshan, and Cangzhou have relatively high land use comprehensive efficiency, whereas Baoding and Hengshui have comparatively lower efficiency. When considering variance, the disparity in land use comprehensive efficiency among the 13 cities in the BTH region has been decreasing.

4.1.2. Technical Efficiency

Technical efficiency reflects the most effective output capacity achieved by various cities through technological progress; to a certain extent, it embodies the level of urban development, land utilization management, and control capabilities. Table 4 reveals that from 2000 to 2022, the number of cities with relatively effective land use technical efficiency exhibited fluctuations. Beijing, Tianjin, Qinhuangdao, and Langfang maintained stable and effective land use technical efficiency throughout the years. Handan and Zhangjiakou saw relatively rapid growth in their land use technical efficiency, while Baoding and Chengde experienced decreases in technical efficiency, leading to an overall lower average land use technical efficiency in 2022 compared to 2000 for the 13 cities. Looking at the averages, Chengde and Zhangjiakou have the lowest average land use technical efficiency. Taking Chengde as an example, this is related to its industry characteristics dominated by coal, metallurgy, and manufacturing. The technological growth in these traditional industries tends to be slower.

4.1.3. Scale Efficiency

Scale efficiency represents the manifestation of the scale returns condition in urban land utilization. When scale efficiency equals 1 it indicates that the urban land is in the optimal scale state. Scale efficiency less than 1 implies the existence of increasing or decreasing returns to scale, suggesting that urban land scale can be optimized and improved. Thus, maintaining constant returns to scale forms the fundamental condition for sustainable operation in urban land development. From Table 5, it is observed that from 2000 to 2022, land use scale efficiency has shown an upward trend, with the average increasing from 0.940 to 0.999. The number of cities with relatively effective land use scale efficiency has increased annually, from 3 cities in 2000 to 11 cities by 2022. Beijing and Tianjin have maintained stable and effective land use scale efficiency, while Langfang and Hengshui have experienced relatively fast growth in scale efficiency. Chengde and Zhangjiakou have seen significant fluctuations in their scale efficiency. Taking Zhangjiakou as an example, in recent years, spurred by the Winter Olympics, the city has rapidly expanded in size, and its tourism industry has developed swiftly. However, traditional industries such as metallurgy, machinery processing, and agriculture and pastoralism remain dominant, characterized by high capital and land inputs but relatively lower output efficiency, leading to significant fluctuations and sluggish growth in scale efficiency. Additionally, the relatively low technical efficiency of land use in Zhangjiakou significantly contributes to its lower overall land use efficiency. Achieving effective total land use efficiency requires the dual efficiency of scale and pure technical efficiency.Therefore, to maintain relative effectiveness in land utilization comprehensive efficiency, cities in the BTH region should focus on improving scale efficiency. It is worth noting that the improvement in scale efficiency should not blindly pursue urban land scale expansion or rapidly reduce supply scale in response to land supply surplus. It needs to be aligned with various factors such as urban strategic planning, construction forms, and operational conditions.

4.1.4. Super Efficiency

The S-DEA model enables further segmentation of the land utilization efficiency of cities located at the production frontier, facilitating effective ranking of decision-making units and enabling urban comparisons. Table 6 shows the land use efficiency results of the 13 cities in the BTH region from 2000 to 2022, calculated by the S-DEA model. In 2000, there were 3 cities with a land use efficiency greater than 1, while in 2022, this number increased to 11. Looking at the average, the mean land use efficiency of the BTH urban agglomeration grew from 0.521 in 2000 to 1.002 in 2022, with minor fluctuations and an overall upward trend. Beijing and Tianjin have consistently ranked at the forefront of land use efficiency within the BTH urban agglomeration. This is attributed to their status as directly governed municipalities in China, with Beijing, as the capital, accumulating the best urban resources and economic construction bases. Moreover, the land utilization efficiency of the northeastern coastal cities in the BTH region is higher than that of the southwestern inland cities. The central cities of Beijing and Tianjin have a radiating effect on the surrounding cities. Tangshan and Qinhuangdao are not only the major port cities in the BTH region but also lead in industrial development in Hebei Province. Tangshan excels in high-quality steel, modern petrochemicals, and high-end equipment manufacturing, while Qinhuangdao excels in heavy equipment manufacturing and automotive components. Consequently, the land utilization efficiency of these two cities ranks relatively high in Hebei Province.

4.2. Spatiotemporal Pattern of ULUE

4.2.1. Temporal Evolution of ULUE

The temporal change in ULUE within the BTH urban agglomeration is analyzed in two stages, divided between 2000 to 2010 and post-2010. The analysis indicates differing trends in the region’s land use efficiency changes.
As the Figure 2 show, between 2000–2010, the BTH region underwent rapid urbanization. During this stage, the ULUE of Beijing and Tianjin remained high with little variation. Beyond these two cities, all other cities in the BTH region saw their construction land scale rapidly increase, with yearly growth in ULUE. Langfang, in particular, experienced significant growth between 2006 and 2007, reflecting the region’s active pursuit of economic development speed alongside urban expansion and land resource utilization.
After 2010, the growth of land ULUE in the BTH region began to slow. Following the Chinese government’s introduction of the new normal economic development concept in 2014, aiming to transform the economic development model, ULUE of the BTH region can be categorized into five types: Firstly, steady growth type, where Beijing and Tianjin’s ULUE maintained high levels with a stable growth trend, showcasing the effectiveness of these cities in optimizing land resource allocation and improving ULUE. Secondly, slow growth type, exhibited by cities such as Tangshan and Shijiazhuang. Thirdly, continuous growth type, seen in Qinhuangdao, Baoding, and Zhangjiakou. Fourthly, stepwise growth, where Langfang, as an important city linking Beijing and Tianjin, saw a slowdown in ULUE growth after 2016. Xingtai and Hengshui achieved stepwise growth in ULUE by 2017, followed by a deceleration. Lastly, initial growth followed by decline type, observed in Cangzhou, Chengde, and Handan, showcasing an N-shaped layout.

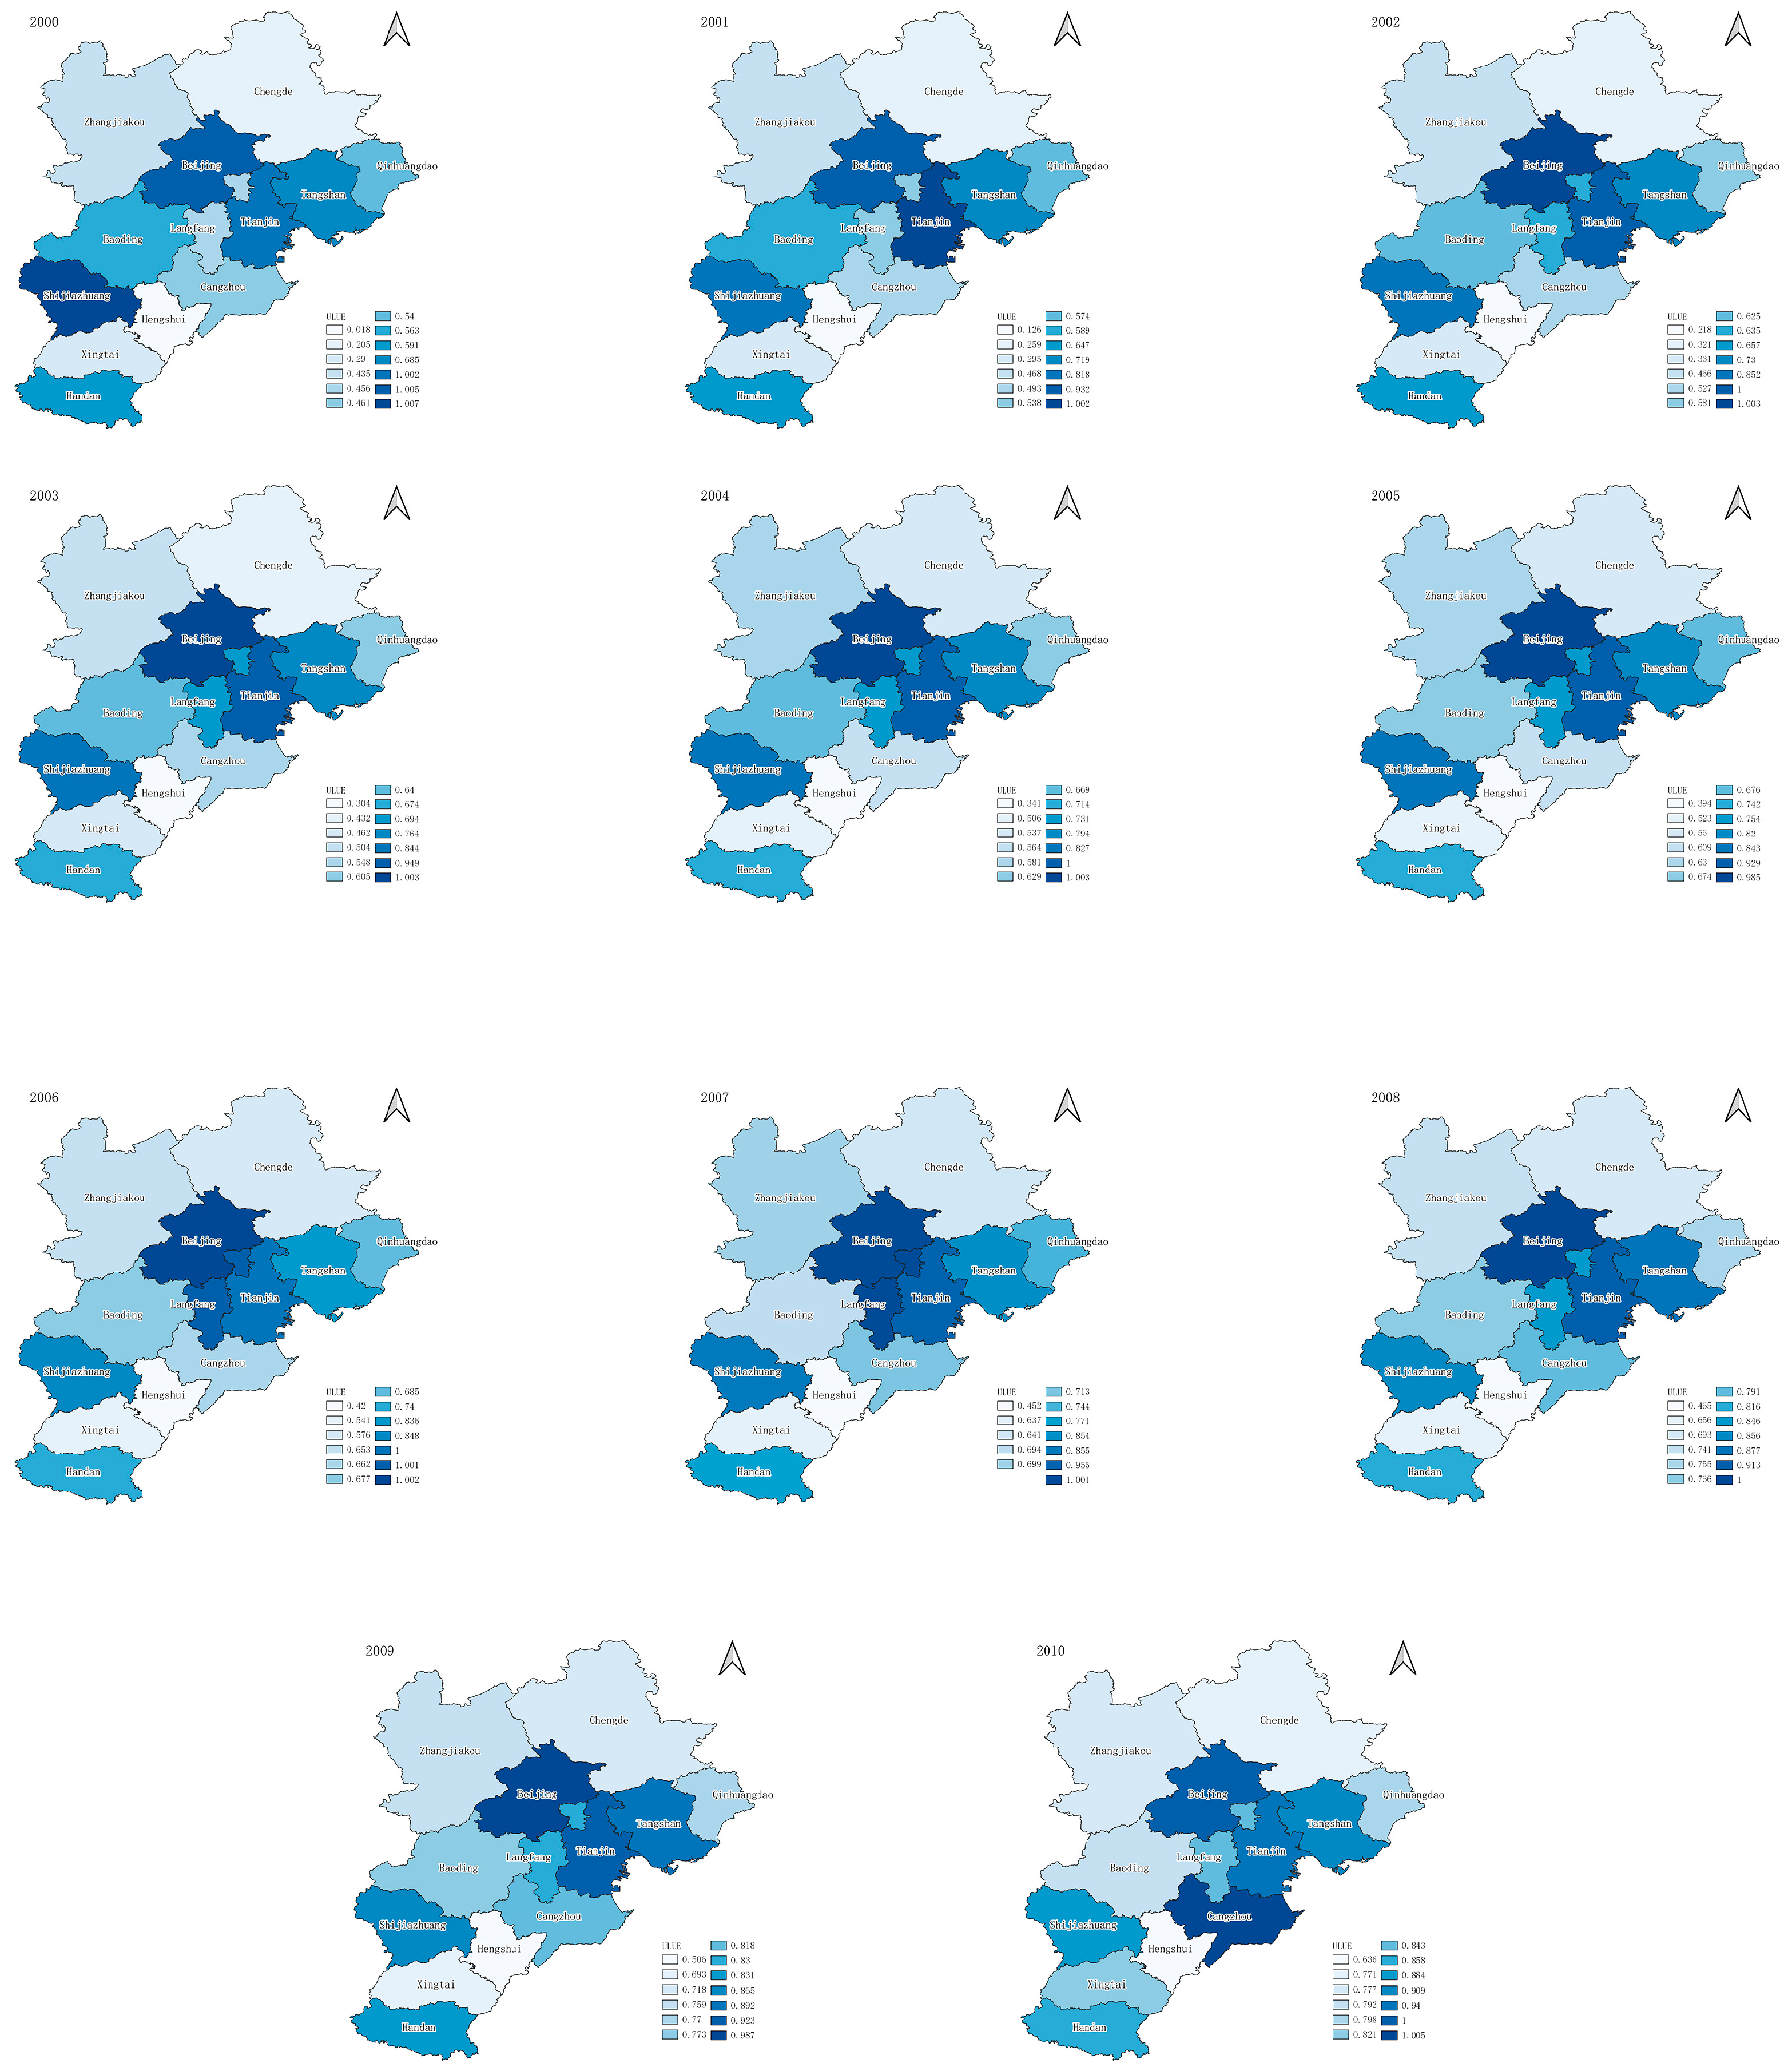
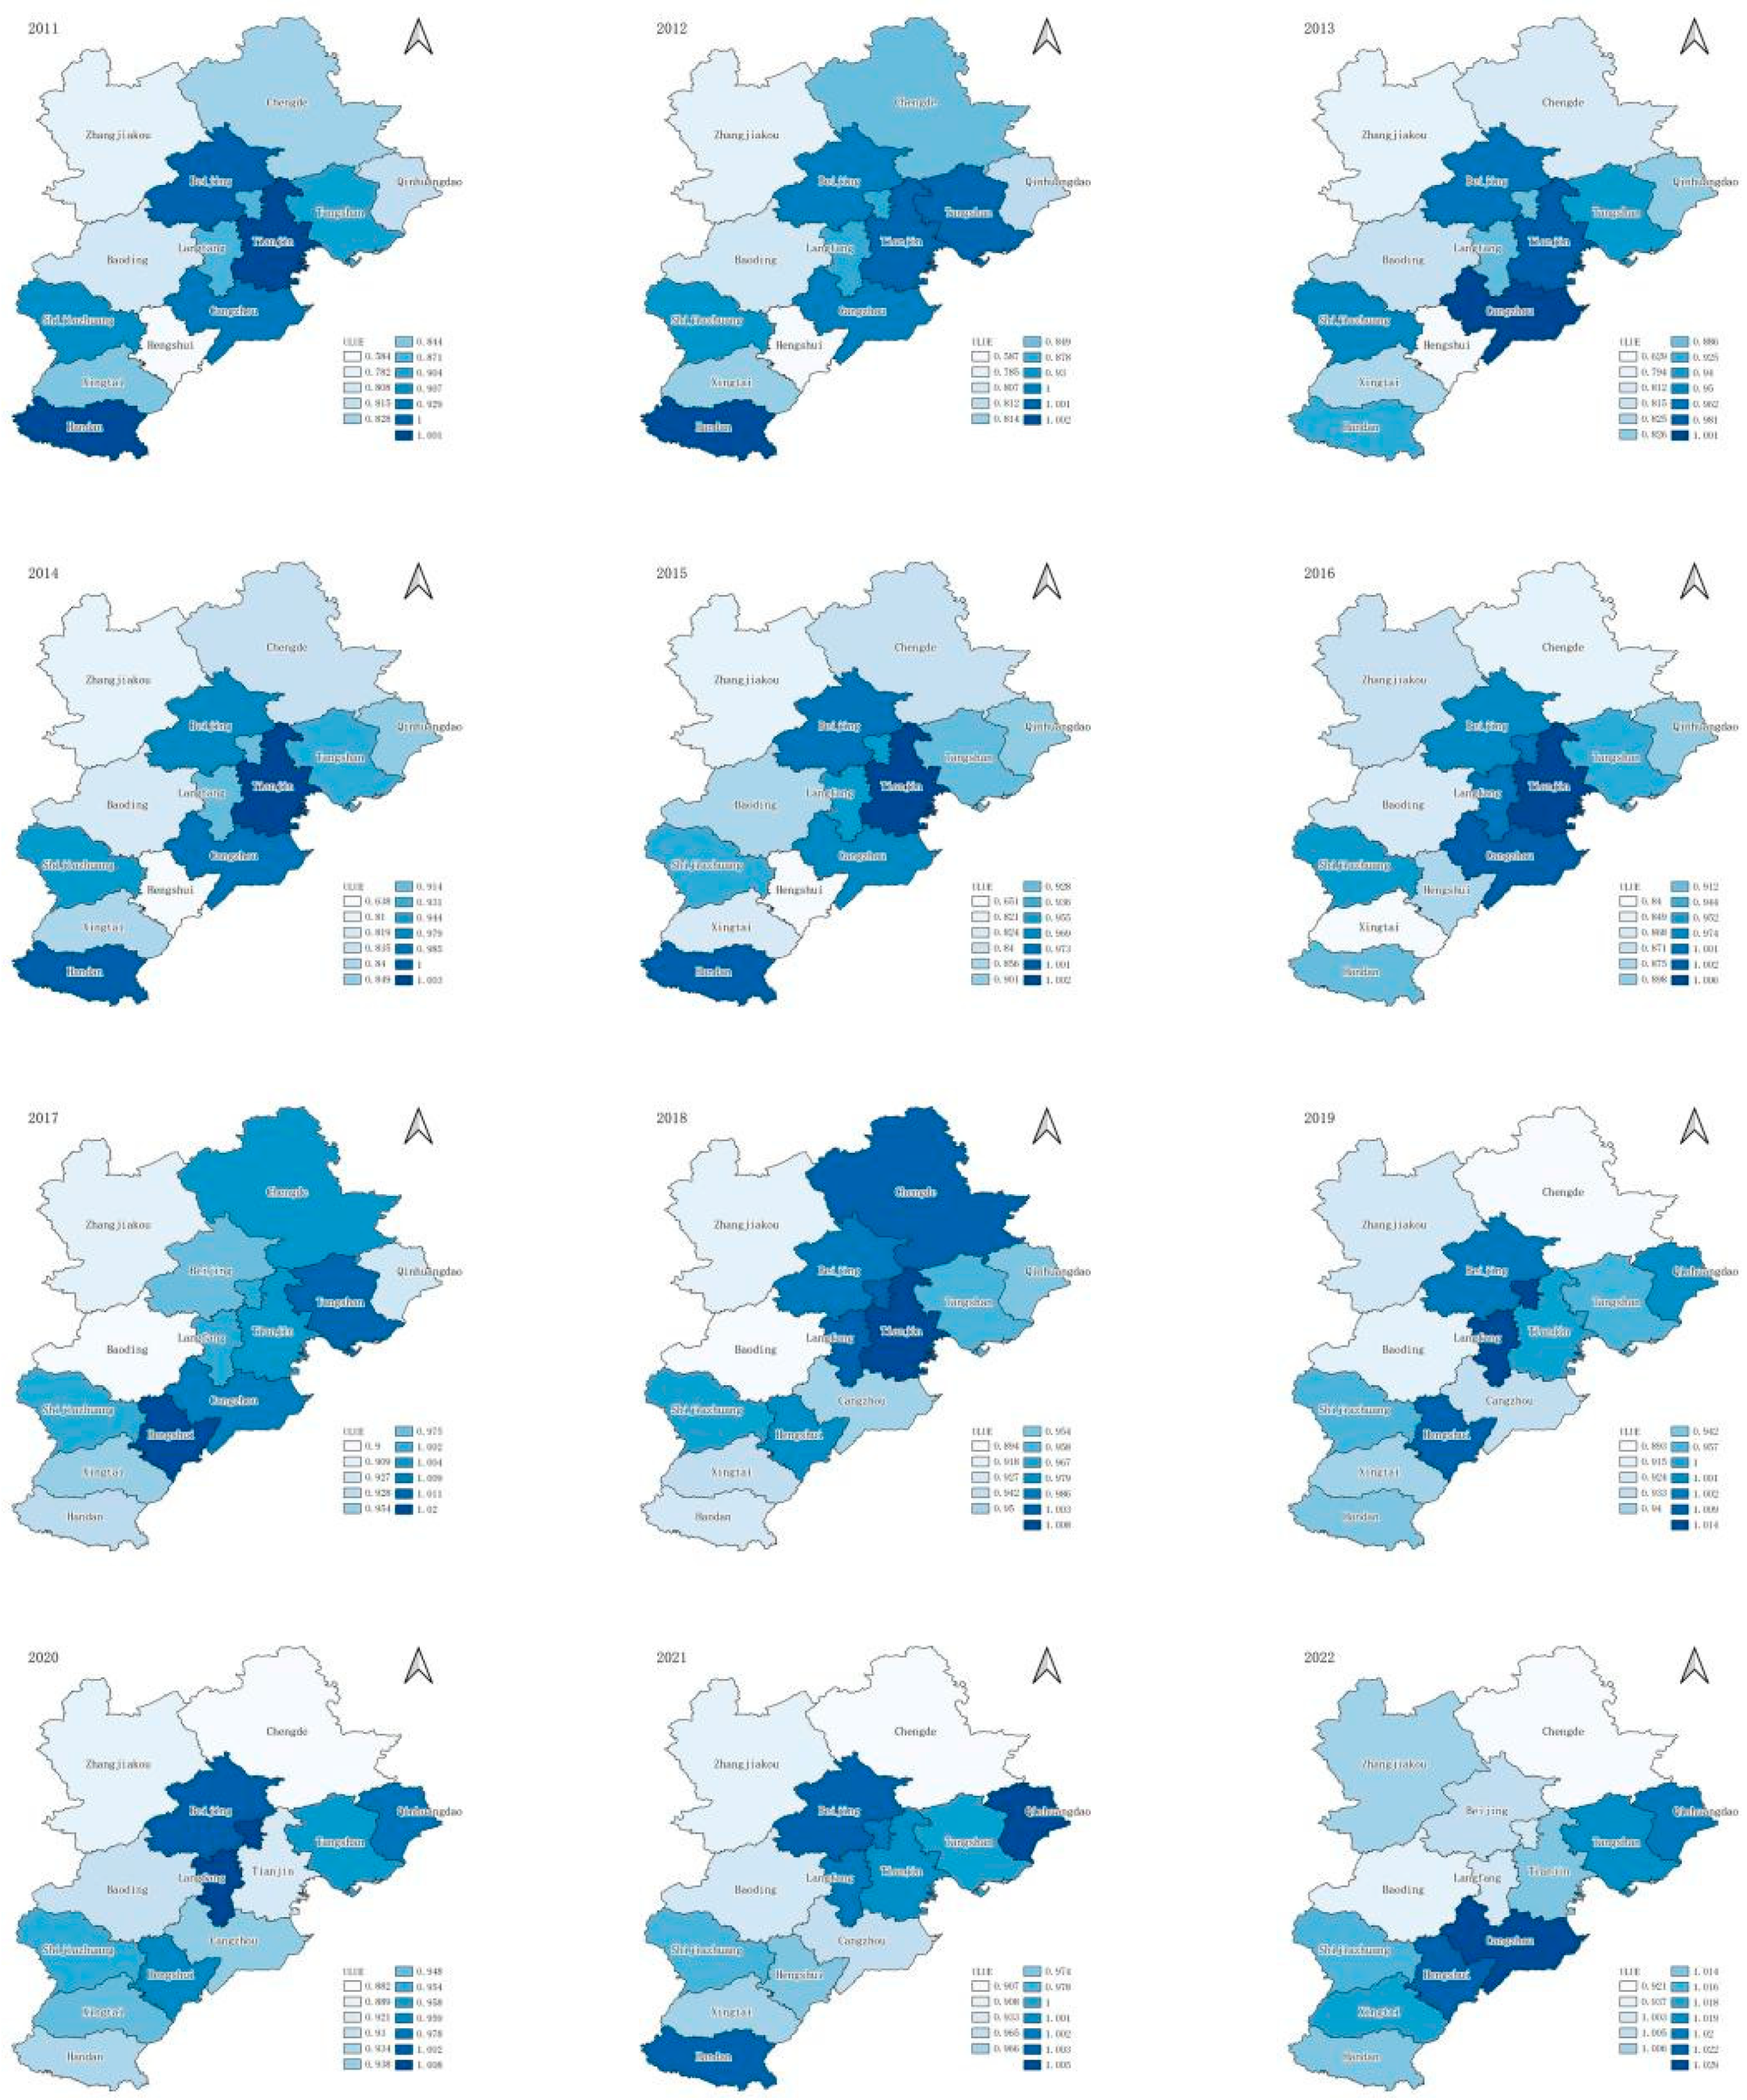
4.2.2. Spatial Evolution of ULUE

The spatial evolution of ULUE in the BTH region can be observed in two phases.
As the Figure 3 show, from 2000–2010, high values were predominantly located in Beijing, Tianjin, Shijiazhuang, and other cities. As regional economic engines, these cities demonstrated strong ULUE, with an overall pattern characterized by “high in the northeast, low in the southwest”.
As the Figure 4 show, from 2011–2022, especially after the release of the “Beijing Tianjin Hebei Coordinated Development Plan Outline” in 2015, the core city of Beijing’s ULUE began to rise trans-regionally, with surrounding cities also experiencing steady improvements. The spatial pattern of ULUE evolved from “high in the northeast, low in the southwest” to a “core-periphery” gradient. By 2017, significant improvements in ULUE of Hengshui, Tangshan, and other locations marked a shift under the coordinated development strategy, where regional internal development extended beyond traditional economic centers to previously less developed areas. In 2018, efficient land use expanded northward, indicating a further broadening of the coordinated development strategy’s impact, likely benefiting from investments and improvements in the northern region’s transportation and industry.
However, from 2019 to 2021, the COVID-19 pandemic significantly impacted global economic activities, with core cities like Beijing once again becoming high-value concentration areas. During this period, as the national political and economic center, Beijing’s land use and economic activities were relatively stable, reflecting the resilience of core cities amid economic fluctuations. In 2022, with the deepening of the Beijing Tianjin Hebei coordinated development strategy, efficient land use once again shifted southward, reflecting the strategy’s thorough implementation in the southern region and the progress made in attracting investment and improving infrastructure.
Throughout this process, Xingtai and Handan, peripheral cities in the southwest of the BTH urban agglomeration, consistently had ULUE below the regional average until 2021, particularly in Handan, where a significant improvement in ULUE was achieved. This likely relates to industrial upgrading and structural adjustments promoted by local governments, reflecting the positive outcomes of the BTH region coordinated development strategy. Through policy guidance, the strategy has facilitated the efficient utilization of land resources and the transformation of economic development models in cities including Handan.

4.3. Factors Influencing ULUE

4.3.1. Main Influencing Factors and Their Action Mechanisms

ULUE is measured using numerous indicators such as socio-economic inputs and outputs. When analyzing its influencing factors, it is necessary to analyze them from economic, environmental, policy and social. Descriptive statistics of variables are shown in Table 7.
The core variables include:
Fiscal balance: the level of fiscal balance influences land resource utilization and allocation indirectly through changes in tax policies affecting the production and consumption costs of enterprises and individuals. Additionally, fiscal balance impacts the formulation and implementation of land policies directly. Given the significant proportion of land concession income in local government revenues, local authorities guide and regulate land use through land planning, management, and concession strategies. A lower fiscal balance may lead local governments to rely on “land finance” to achieve fiscal equilibrium, adopting policies that concurrently involve high-priced concessions of residential and commercial land and low-cost, large-scale concessions of industrial land for development purposes, thereby compromising land use efficiency and land resource conservation [20,34,35].
Industrial structure: land use efficiency varies across different industries. The secondary industry, with its unique requirements for production space, typically has a lower plot ratio for industrial land. Conversely, the tertiary industry, being labor and capital-intensive, boasts higher plot ratios for commercial, office, and residential land. Furthermore, industrial agglomeration promotes efficient resource utilization and the formation of economic scale effects, enhancing ULUE [34,39].
Openness level: an open economy introduces external resources such as capital, technology, and talent, positively affecting ULUE. Additionally, economic openness expands and increases market demand. For example, growth in foreign trade might stimulate the development of related industries, thereby improving ULUE [24,39].
Green development level: initially dominated by resource-intensive primary processing industries, China’s rapid industrial development has transitioned towards advocating a low-carbon economic development model with the introduction of the “Dual Carbon” strategy, aimed at reducing carbon emissions and energy consumption. This shift minimizes land resource waste and overexploitation. Moreover, green development fosters the construction of green landscapes, ecological parks, and agriculture, optimizing urban green space layouts and protecting ecosystem integrity and stability, thus improving ULUE [9,20,39].
Digitalization level: The level of digitalization reflects a city’s technological advancement and degree of informatization, directly impacting productivity levels. Digital development enhances the rational allocation and planning use of land elements through simulation analysis and spatial optimization algorithms. Additionally, digital progress improves market efficiency and transparency, facilitating the effective operation of the land element market [62].
The control variables include per capita GDP, per capita land area, real estate investment and infrastructure construction. Capita per GDP typically reflects the local level of economic development. A higher per capita GDP indicates a higher quality of economic development. The level of infrastructure construction influences industrial layout and urban spatial structure. This indicator reflects the convenience of local transportation, logistics, and social life. Real estate investment can act as an important leading indicator of economic fluctuations, reflecting the city’s economic volatility. Per capita land area typically reflects a city’s population density and can also indicate the local level of urbanization.

4.3.2. Model Selection

The dataset selected in this study is panel data from 13 cities in the BTH region from 2000 to 2022. Choosing panel data models to analyze the factors influencing land use efficiency has the following advantages:
The first, panel data models combine time-series and cross-sectional data, enabling better capture of trends in land use efficiency over time and understanding the impact of long-term and short-term factors on land use efficiency.
The second, panel data models can control differences between individuals, such as variations between different regions or units, thereby more accurately assessing the factors influencing land use efficiency.
The third, panel data models can utilize more data information, improving the statistical efficiency of estimation and yielding more robust and accurate analysis results.
The fourth, panel data models can effectively control potential issues of autocorrelation and heteroscedasticity in panel data, enhancing model fit and stability.
The fifth, panel data models can better analyze the causal relationships between land use efficiency and its influencing factors, including economic, environmental, and policy factors, thereby providing a scientific basis for policy formulation.
The panel data model used in this study regressed and verified the relationship between ULUE and its influencing factors. Due to the large amount of independent variable data, we took logarithms one by one for model analysis. The specific expression of the panel data model is as follows:
Y(i,t) = β0 + β1 X1(i,t) + β2 X2(i,t) + …… + β8 X8(i,t) + β9 X9(i,t) + ε(i,t).
Among them, Y(i,t) represents the LUE of city i during the tth period. X1(i,t) to X5(i,t) are explanatory variables that affect the ULUE of city during the tth period, β0 is a constant term, and β1β9 represents the estimated parameters from X1 to X9, ε(i,t) are random error terms.
The study constructed six regression models. Models (1) through (5) estimated the regression relationships between the fiscal balance, industrial structure, openness level, green development level, digitalization Level and ULUE, respectively. Model (6) incorporated all five factors simultaneously into the regression analysis of land utilization efficiency. The regression results remained robust, with the parameters of these five factors and their relationships with land utilization efficiency unchanged. However, industrial structure became insignificant in Model (6). Model (7) included four control variables: per capita GDP, per capita land area, real estate investment and infrastructure. The regression results remained consistent, with no changes in the parameters or significance levels of the five factors concerning ULUE.

4.3.3. Result Analysis

This article selects panel data from 13 cities in BTH from 2000 to 2022 to conduct regression analysis on the influencing factors of ULUE in BTH. The results are shown in Table 8.
The fiscal balance, industrial structure, openness level, green development level, and digitalization level, five core factors, are significant in models (1) to (5). However, the robustness of the industrial structure is lacking in model (6).
The fiscal balance indicator is significantly negatively correlated with ULUE, and the coefficient change becomes insignificant after incorporating control variables. This suggests that a larger fiscal deficit relative to land concession income increases local government reliance on land finance. Whether due to infrastructure construction or other causes of fiscal deficits, this can lead to extensive land use. For instance, in cities like Handan, Zhangjiakou, and Chengde, recent fiscal deficits have been more than four times the income from land concessions, resulting in relatively lower ULUE.
The industrial structure is significantly positively correlated with ULUE, indicating that optimizing the industrial structure is beneficial for China’s economic growth and also for improving ULUE. However, this factor becomes insignificant after adding control variables, possibly due to recent improvements in the ULUE of the secondary industry following intensive land use inspections and rectifications across various regions.
The level of openness is significantly positively correlated with ULUE, with the coefficient significantly increasing after incorporating control variables. This implies that an increase in international trade not only benefits the economic growth of the BTH urban agglomeration but also enhances ULUE. Notably, coastal cities in the northeastern part of the BTH region, such as Tianjin, Qinhuangdao, and Tangshan, have relatively higher ULUE.
The green development level is significantly positively correlated with ULUE, suggesting that energy conservation and emission reduction have a positive effect on improving ULUE in the BTH region. Cities like Tangshan and Cangzhou, traditionally industrial, have increased their ULUE through the phasing out of old capacities and the introduction of new technologies and investments.
The digitalization level is significantly positively correlated with ULUE, indicating that the utilization of digital technologies positively affects the improvement of ULUE in the BTH region. For example, Beijing, by designating the information technology industry as one of the core industries for city development, has seen rapid growth in tertiary industry investment and industry, resulting in stable and effective ULUE.
All four control variables in model (7) are positively correlated with ULUE, yet per capita GDP and the level of infrastructure construction are not significant. This may be attributed to certain cities in the BTH region having high per capita GDP but experiencing significant urban expansion, and high levels of infrastructure construction that simultaneously increase the fiscal deficit.

5. Discussion

5.1. Key Findings

This study focuses on the BTH urban agglomeration and employs the S-DEA model to evaluate ULUE. It categorizes cities in the BTH urban agglomeration into two stages and five types based on the temporal evolution of ULUE. Additionally, the spatial evolution of ULUE in the BTH urban agglomeration is explored, highlighting specific cases. Finally, an analysis of the factors influencing ULUE is undertaken using the panel data model, discussing the relationships between various factors and ULUE in the BTH urban agglomeration and emphasizing their correlations and implications. Our key findings are as follows:
Firstly, the study employs the S-DEA model to effectively assess ULUE in the BTH region. The results, covering the period from 2000 to 2022, reveal a noteworthy increase in average ULUE from 0.521 to 1.002, indicating a significant improvement in land use within the region over the past fifteen years. This also reflects how urban clusters can alleviate the urgency of land demand due to population growth. The high concentration and interconnectivity of urban clusters facilitate more efficient land utilization [4]. However, challenges persist, particularly in land utilization practices in Hebei province. Opportunities for optimizing land use across the BTH region still exist [63]. Cities like Beijing consistently lead in ULUE, highlighting their ability to leverage superior urban resources and economic foundations. Simultaneously, this efficiency is also evident in urban sprawl [64]. The temporal evolution of ULUE across the 13 cities reveals diverse patterns including the steady growth type, the slow growth type, the sustained growth type, the step-demonstrated growth type and the first growth followed by decline type trends. These variations reflect differences in land use and development trajectories among cities in the BTH region, such as disparities in natural resources, socioeconomic factors, or policy influences [16,51,65].
Secondly, the spatial analysis of ULUE in the BTH urban agglomeration highlights significant regional disparities. Before 2010, the BTH was generally characterized by a pattern of “high in the northeast and low in the southwest”, but after 2010, it began to change and gradually shifted to a smooth transition of “core-periphery”. Scholars emphasize the impact of land policies on efficiency [66]. This transformation is attributed to the 2015 BTH Collaborative Development Plan Outline, contributing to increased ULUE not only in Beijing but also in surrounding cities. Notably, the ULUE of northeastern coastal cities surpasses that of southwestern inland cities, emphasizing the radiating effect of central cities like Beijing on their peripheries. Historical disparities in economic growth and industrial advancement between these regions could contribute to observed differences in ULUE [67]. What’s more, in the middle of the epidemic period, the high value of ULUE returned to the core area again, and the distribution of the high value of ULUE began to shift southward after the epidemic.
Thirdly, the research identifies crucial factors influencing ULUE, including fiscal balance, openness level, industrial structure, green development and digitalization level. Excessive fiscal expenditure negatively correlates with ULUE, indicating the risk of extensive land use when infrastructure construction outpaces revenue [68]. Therefore, maintaining fiscal balance and ensuring that expenditures match revenues are essential for rational land use [69]. Conversely, increased openness level and optimized industrial structures positively impact ULUE. Studies indicate a positive and significant correlation between FDI and economic growth [70]. Furthermore foreign direct investment can enhance stock prices, boost market liquidity, and reduce the cost of equity, thereby improving overall welfare [71]. However, the realization of these benefits depends crucially on complementary local conditions, often referred to as “absorptive capacities” [72]. The influx of foreign direct investment can act as a catalyst for economic development in the BTH region, fostering innovation, introducing advanced technologies, and creating high-value-added industries. Green development and digitalization are equally important for improving ULUE. This facilitates enhancing market transparency in the BTH region, implementing carbon reduction strategies, aligning with international standards, and consequently increasing output per unit of land.
This concise analysis provides a comprehensive understanding of the dynamics shaping urban ULUE in the BTH urban agglomeration.

5.2. Research Contributions

The primary contribution of this research is twofold. Firstly, from an academic perspective, it applies the S-DEA model to evaluate ULUE in the BTH urban agglomeration. By investigating the spatiotemporal dynamics of ULUE and analyzing the factors influencing it through a panel data model, the study provides a comprehensive methodological foundation. This approach enhances our understanding of ULUE and its determinants, offering significant insights into urban studies and sustainable development.
In practical terms, the findings of this study carry significant policy implications. Our research provides actionable insights for sustainable urban development within the BTH urban agglomeration and other regions. The factors identified as influencing ULUE, notably fiscal balance and the level of openness, can inform policymakers in devising strategies to improve ULUE in tandem with sustainable economic growth. Moreover, the methodological approach adopted in this study can be applied to different urban contexts, serving as a useful tool for evaluating and enhancing ULUE across various settings. Our recommendations are as follows:
The first, optimize regional urban spatial structures to enhance the BTH urban agglomeration’s overall planning; it is critical to refine the regional urban spatial structure. National land spatial planning should integrate the broader developmental vision for the BTH region, leveraging the “core-periphery” and “northeast high, southwest low” efficiency patterns to effectively manage urban land use. This requires a cohesive approach to planning and management across various administrative boundaries. By strategically defining the roles and developmental focuses of each city, urban spatial structures can be optimized to ensure efficient allocation of commercial, residential, industrial spaces, green areas, and public amenities. Such planning aims to maximize land resource use, boost land utilization efficiency, and curtail urban sprawl and the wastage of resources. Additionally, fostering inter-city collaboration to create cohesive cross-regional development strategies can mitigate redundant infrastructure projects and elevate resource use efficiency across the agglomeration. National planning should identify and designate key functional zones, positioning Beijing as the political and cultural hub, Tianjin as the economic and financial core, and earmarking cities in Hebei for their industrial support roles. This strategic delineation will promote a harmonious and efficient development framework for the entire BTH region.
The second, strengthen functional zoning and industry coordination to advance integrated industrial development in the BTH Region; it is essential to refine functional zoning and optimize the spatial layout, tailoring strategies to the unique strengths and characteristics of each city. Identifying and reinforcing the industrial focus of different areas will enable the strategic positioning of high-tech zones and science parks throughout the BTH region. Cities must adopt a strategic approach to their development, nurturing key industries that resonate with their specific industrial bases, geographic features, and resource availabilities. This approach includes eliminating outdated industries, capitalizing on the technological advancements of mid-to-high-end industrial sectors and advancing urban digitalization construction to forge sustainable and efficient industrial integration across the BTH region. For example, Beijing could prioritize the expansion of high-end services and innovation-driven sectors, Tianjin could enhance its modern manufacturing and logistics capabilities, and Hebei Province could focus on developing sustainable agriculture and tourism sectors. By implementing targeted functional zoning and layout optimization, the BTH region can significantly improve the efficacy and sustainability of its land use, driving forward a cohesive and dynamic regional development strategy.
The third, promote sustainable urbanization through efficient land use in the BTH region, despite its advanced urbanization, confronts issues like swift urban sprawl and inefficient land resource utilization. Addressing these challenges requires urban planning to judiciously define urban and rural development perimeters, guiding the trajectory of new urbanization processes. There is a pressing need to advocate for urban regeneration and modernization, emphasizing the construction of high-density structures and promoting intensive development in central urban locales to circumvent expansive, unproductive land development. Enhancing the quality and accessibility of public services, industry support facilities, and city infrastructure is vital. Particularly, the areas surrounding Beijing and Tianjin should leverage regional integration efforts to fast-track their development, absorbing industrial shifts from these megacities and, in turn, elevating land use efficiency across the entire BTH agglomeration. This strategic approach to urbanization not only aims to optimize land resource management but also strives to foster a balanced, high-quality regional growth paradigm.
The forth, improve infrastructure and the business environment for higher land use efficiency; inefficient transportation infrastructure significantly hampers land utilization efficiency. Urban planning initiatives must prioritize the enhancement of the transportation network by increasing its density and accessibility within the BTH region. This involves accelerating the development of intercity railways, expanding urban rail transit systems, optimizing expressway and major road networks, and elevating the quality of public transportation services. Moreover, fostering a conducive business environment through preferential international trade policies is essential. The northeast coastal cities of the BTH region, with their strategic geographical locations, should refine fiscal and tax policies to attract more foreign direct investment. Meanwhile, the southwest inland cities need to progressively advance financial marketization, support key industries, and nurture the development of small and medium-sized enterprises. Such measures will encourage industrial diversity and innovative organizational models, contributing to overall land utilization efficiency and sustainable economic growth of the BTH urban agglomeration.
The fifth, balance fiscal management and emphasizing green development; establishing ecological protection zones, implementing ecological restoration initiatives, and enhancing environmental oversight are crucial for preserving ecosystems and improving the sustainability of land use. Local governments must ensure fiscal health by balancing expenditures with revenues, tailoring strategies to the urban development phase, and fostering urban and industrial advancement. In addressing environmental challenges within the BTH region, urban planning should prioritize ecological protection and restoration, alongside increasing the intensity of land investment. This is especially critical for cities in the southwest inland areas of the BTH region, where land utilization efficiency is lower and ecosystems are more vulnerable. Strict control over urban expansion is necessary to prevent over-reliance on land sales and real estate investment as economic drivers. Promoting the strategic development of green spaces, wetlands, and water systems will not only enhance urban green coverage and ecological spaces but also improve environmental quality. These measures contribute to the long-term ecological benefits and sustainability of land use across the BTH region, aligning fiscal strategies with green development goals to foster a harmonious balance between economic growth and environmental preservation.

5.3. Research Limitations

Inevitably, this study has some limitations:
Firstly, the primary limitation of this research stems from the selection of indicators for ULUE, which warrants further refinement. Despite incorporating representative indicators from various input and output dimensions, the construction of the indicator system and data selection process may not be entirely scientific, constrained by the availability and accessibility of data. For instance, the choice to represent capital input with a city’s total fixed asset investment fails to consider intangible assets, possibly leading to an underestimation of capital input. While the S-DEA model primarily assesses the efficiency of land use across cities, excluding intangible assets from the capital input might not drastically alter the efficiency ranking of cities. However, it could cause the estimated ULUE to deviate from its actual value, risking overestimation. Future studies should aim for more sophisticated and realistic definitions of relevant indicators to enhance the precision of land use optimization and allocation results.
Secondly, the examination of factors affecting ULUE could benefit from a more detailed, micro-level analysis. While this study explores the influences on ULUE from broad areas like finance, investment, industry, and the environment, it predominantly operates at a macro scale. However, the efficiency of land use within urban clusters is determined using a myriad of elements including policy directives, technological advancements, locational benefits, and human capital. Thus, future studies, contingent upon data availability, should delve into meso- and micro-level investigations of ULUE. This approach would yield more targeted and practical policy recommendations.
Thirdly, the assessment of ULUE should adopt a more systematic approach. While this study employs the DEA model to analyze technical efficiency, scale efficiency, and super-efficiency, it overlooks critical dimensions such as allocation efficiency and ecological efficiency. These aspects account for the effects of price allocation and environmental constraints on the optimal mix of land inputs and outputs. Consequently, future investigations into land use efficiency ought to embrace a more comprehensive framework. Delving into the nuances of urban land use allocation efficiency or ecological efficiency could enrich our understanding of ULUE. Such a holistic evaluation would provide more effective guidance for land use decisions within the Beijing–Tianjin–Hebei urban agglomeration.

6. Conclusions

In the context of rapid urbanization, the land use patterns of cities have a significant impact on environmental health and climate vulnerability. As one of the important regions for economic development in China, the evolving ULUE of the BTH urban agglomeration is crucial for understanding the challenges and opportunities in balancing economic growth with ecological well-being. This study focuses on the BTH urban agglomeration, utilizes the S-DEA model to assess ULUE, and investigates the spatiotemporal variations in ULUE within the designated area. Additionally, an analysis of the factors influencing ULUE is conducted using the panel data model. Our results show that, based on land factor input and output data from 13 prefecture level cities in BTH, the Super-Efficiency DEA model shows that the overall ULUE of the BTH region has increased, but with significant fluctuations. Between 2000 and 2010, the ULUE of all cities in the BTH region increased rapidly, except for Beijing and Tianjin, where the changes were small. After 2010, different cities showed different forms of changes, including the steady growth type, the slow growth type, the sustained growth type, the step-demonstrated growth type and the first growth followed by decline type trends. Spatially, before 2010, the BTH was generally characterized by a pattern of “high in the northeast and low in the southwest”, but after 2010, it began to change and gradually shifted to a smooth transition of “core-periphery”. In the middle of the epidemic period, the high value of ULUE returned to the core area again, and the distribution of the high value of ULUE began to shift southward after the epidemic. Panel data shows five factors affect ULUE, i.e., the balance of fiscal revenue and expenditure, openness level, industrial structure, green development and digitalization level. In summary, our study provides actionable insights for the sustainable development of cities in the BTH region and other areas. It identifies factors influencing ULUE, offering strategic guidance for decisionmakers to foster sustainable economic growth. The research methodology is applicable elsewhere, providing a valuable tool for assessing and enhancing ULUE.

Author Contributions

Conceptualization, Z.Z. (Zhang Zhang) and S.L.; methodology, H.Z. and Y.Z.; software, Z.Z. (Zhang Zhang) and Z.Z. (Zhibin Zhao); validation, Z.Z. (Zhibin Zhao); formal analysis, J.X.; investigation, Z.Z. (Zhibin Zhao) and S.L.; resources, Y.Z.; writing—original draft preparation, Z.Z. (Zhang Zhang) and Z.Z. (Zhibin Zhao); writing—review and editing, H.Z. and J.X. All authors have read and agreed to the published version of the manuscript.

Funding

This research was funded by A Project of an Emerging Interdisciplinary Platform for Beijing Studies and The National Social Science Fund of China, grant number 18BJL053. Any opinions, findings, and conclusions or recommendations expressed in this material are those of the author(s) and do not necessarily reflect the views of The National Social Science Fund of China.

Institutional Review Board Statement

Not applicable.

Informed Consent Statement

Not applicable.

Data Availability Statement

Data are contained within the article.

Conflicts of Interest

The authors declare no conflicts of interest.

References

  1. Zhou, Y.; Chen, M.X.; Tang, Z.P.; Mei, Z. Urbanization, land use change, and carbon emissions: Quantitative assessments for city-level carbon emissions in BTH region. Sustain. Cities Soc. 2021, 66, 102701. [Google Scholar] [CrossRef]
  2. Cook, W.D.; Seiford, L.M. Data envelopment analysis (DEA)—Thirty years on. Eur. J. Oper. Res. 2009, 192, 1–17. [Google Scholar] [CrossRef]
  3. Bao, W.; Yang, Y.; Zou, L. How to Reconcile Land Use Conflicts in Mega Urban Agglomeration? A Scenario-Based Study in the Beijing-Tianjin-Hebei Region, China. J. Environ. Manag. 2021, 296, 113168. [Google Scholar] [CrossRef] [PubMed]
  4. Xu, F.; Wang, Z.; Chi, G.; Zhang, Z. The Impacts of Population and Agglomeration Development on Land Use Intensity: New Evidence behind Urbanization in China. Land Use Policy 2020, 95, 104639. [Google Scholar] [CrossRef]
  5. Chen, J.; Pellegrini, P.; Yang, Z.; Wang, H. Strategies for Sustainable Urban Renewal: Community-Scale GIS-Based Analysis for Densification Decision Making. Sustainability 2023, 15, 7901. [Google Scholar] [CrossRef]
  6. Luo, M.; Lau, N. Urban Expansion and Drying Climate in an Urban Agglomeration of East China. Geophys. Res. Lett. 2019, 46, 6868–6877. [Google Scholar] [CrossRef]
  7. Lin, L.; Gao, T.; Luo, M.; Ge, E.; Yang, Y.; Liu, Z.; Zhao, Y.; Ning, G. Contribution of Urbanization to the Changes in Extreme Climate Events in Urban Agglomerations across China. Sci. Total Environ. 2020, 744, 140264. [Google Scholar] [CrossRef] [PubMed]
  8. Kim, S.K.; Bennett, M.M.; Van Gevelt, T.; Joosse, P. Urban Agglomeration Worsens Spatial Disparities in Climate Adaptation. Sci. Rep. 2021, 11, 8446. [Google Scholar] [CrossRef] [PubMed]
  9. Liu, K.; Xue, M.; Peng, M.; Wang, C. Impact of Spatial Structure of Urban Agglomeration on Carbon Emissions: An Analysis of the Shandong Peninsula, China. Technol. Forecast. Soc. Chang. 2020, 161, 120313. [Google Scholar] [CrossRef]
  10. Yan, Z.; Zhou, D.; Li, Y.; Zhang, L. An Integrated Assessment on the Warming Effects of Urbanization and Agriculture in Highly Developed Urban Agglomerations of China. Sci. Total Environ. 2022, 804, 150119. [Google Scholar] [CrossRef]
  11. Chen, Y.; Wang, J.; Xiong, N.; Sun, L.; Xu, J. Impacts of Land Use Changes on Net Primary Productivity in Urban Ag-glomerations under Multi-Scenarios Simulation. Remote Sens. 2022, 14, 1755. [Google Scholar] [CrossRef]
  12. Gao, B.; Wu, Y.; Li, C.; Zheng, K.; Wu, Y. Ecosystem Health Responses of Urban Agglomerations in Central Yunnan Based on Land Use Change. Int. J. Environ. Res. Public Health 2022, 19, 12399. [Google Scholar] [CrossRef] [PubMed]
  13. Yu, G.; Liu, T.; Wang, Q.; Li, T.; Li, X.; Song, G.; Feng, Y. Impact of Land Use/Land Cover Change on Ecological Quality during Urbanization in the Lower Yellow River Basin: A Case Study of Jinan City. Remote Sens. 2022, 14, 6273. [Google Scholar] [CrossRef]
  14. Chen, W.; Chi, G.; Li, J. Ecosystem Services and Their Driving Forces in the Middle Reaches of the Yangtze River Urban Agglomerations, China. Int. J. Environ. Res. Public Health 2020, 17, 3717. [Google Scholar] [CrossRef] [PubMed]
  15. Liu, M.; Wang, Y. Study on Water Resources and Water Environment in Urban Agglomeration. E3S Web. Conf. 2021, 248, 01045. [Google Scholar] [CrossRef]
  16. Wang, M.; Wang, L. Study on Land Use Change and Driving Force in Chengdu-Chongqing Urban Agglomeration. ITM Web. Conf. 2022, 47, 03037. [Google Scholar] [CrossRef]
  17. Zhai, H.; Yao, J.; Wang, G.; Zhang, T.; Dai, H. Simulation and Prediction of Land-Use Change in Urban Agglomerations Under Different Scenarios. In Proceedings of the 2021 IEEE International Geoscience and Remote Sensing Symposium IGARSS, Brussels, Belgium, 11–16 July 2021; pp. 6657–6660. [Google Scholar] [CrossRef]
  18. Shurpali, N.J. Urbanization Associated Changes in Biogeochemical Cycles. Glob. Chang. Biol. 2023, 29, 3237–3239. [Google Scholar] [CrossRef] [PubMed]
  19. Xue, D.; Yue, L.I.; Ahmad, F.; Draz, M.U.; Chandio, A.A.; Ahmad, M.; Amin, W. Empirical investigation of ULUE and influencing factors of the Yellow River basin Chinese cities. Land Use Policy 2022, 117, 106117. [Google Scholar] [CrossRef]
  20. Ruan, L.L.; He, T.T.; Xiao, W.; Chen, W.Q.; Lu, D.B.; Liu, S.C. Measuring the coupling of built-up land intensity and use efficiency: An example of the Yangtze River Delta urban agglomeration. Sustain. Cities Soc. 2022, 87, 104224. [Google Scholar] [CrossRef]
  21. Wang, C.L.; Liu, H.; Zhang, M.T.; Wei, Z.C. The border effect on urban land expansion in China: The case of BTH region. Land Use Policy 2018, 78, 287–294. [Google Scholar] [CrossRef]
  22. Tian, Y.Y.; Zhou, D.Y.; Jiang, G.H. A new quality management system of admittance indicators to improve industrial LUE in the BTH region. Land Use Policy 2021, 107, 105456. [Google Scholar] [CrossRef]
  23. Ma, W.Q.; Jiang, G.H.; Chen, Y.H.; Qu, Y.B.; Zhou, T.; Li, W.Q. How feasible is regional integration for reconciling land use conflicts across the urban–rural interface? Evidence from BTH metropolitan region in China. Land Use Policy 2020, 92, 104433. [Google Scholar] [CrossRef]
  24. He, S.W.; Yu, S.; Li, G.D.; Zhang, J.F. Exploring the influence of urban form on land-use efficiency from a spatio-temporal heterogeneity perspective: Evidence from 336 Chinese cities. Land Use Policy 2020, 95, 104576. [Google Scholar] [CrossRef]
  25. Liao, X.; Fang, C.L.; Shu, T.H.; Ren, Y.T. Spatiotemporal impacts of urban structure upon urban land-use efficiency: Evidence from 280 cities in China. Habitat Int. 2023, 131, 102727. [Google Scholar] [CrossRef]
  26. Xiao, Y.; Zhong, J.L.; Zhang, Q.F.; Xiang, X.; Huang, H. Exploring the coupling coordination and key factors between urbanization and LUE in ecologically sensitive areas: A case study of the Loess Plateau, China. Sustain. Cities Soc. 2022, 86, 104148. [Google Scholar] [CrossRef]
  27. Auzins, A.; Geipele, I.; Stamure, I. Measuring Land-Use Efficiency in Land Management. AMR 2013, 804, 205–210. [Google Scholar] [CrossRef]
  28. Liu, J.; Jin, X.B.; Xu, W.Y.; Yang, F.; Wang, S.L.; Zhou, Y.K. Assessing trade-offs and synergies among multiple land use functional efficiencies: Integrating ideal reference and key indicators for sustainable landscape management. Appl. Geogr. 2023, 158, 103037. [Google Scholar] [CrossRef]
  29. Dong, Y.; Jin, G.; Deng, X.Z. Dynamic interactive effects of urban land-use efficiency, industrial transformation, and carbon emissions. J. Clean. Prod. 2020, 270, 122547. [Google Scholar] [CrossRef]
  30. Fei, R.L.; Lin, Z.Y.; Chunga, J. How land transfer affects agricultural LUE: Evidence from China’s agricultural sector. Land Use Policy 2021, 103, 105300. [Google Scholar] [CrossRef]
  31. Yu, J.; Zhou, K.; Yang, S. LUE and influencing factors of urban agglomerations in China. Land Use Policy 2019, 88, 104143. [Google Scholar] [CrossRef]
  32. Xie, H.; Chen, Q.; Lu, F.; Wu, Q.; Wang, W. Spatial-temporal disparities, saving potential and influential factors of industrial LUE: A case study in urban agglomeration in the middle reaches of the Yangtze River. Land Use Policy 2018, 75, 518–529. [Google Scholar] [CrossRef]
  33. Zhou, X.; Wu, D.; Li, J.F.; Liang, J.L.; Zhang, D.; Chen, W.X. Cultivated LUE and its driving factors in the Yellow River Basin, China. Ecol. Indic. 2022, 144, 109411. [Google Scholar] [CrossRef]
  34. Chen, Q.; Zheng, L.; Wang, Y.; Wu, D.; Li, J.F. A comparative study on urban land use eco-efficiency of Yangtze and Yellow rivers in China: From the perspective of spatiotemporal heterogeneity, spatial transition and driving factors. Ecol. Indic. 2023, 151, 110331. [Google Scholar] [CrossRef]
  35. Song, G.; Ren, G.F. Spatial response of cultivated LUE to the maize structural adjustment policy in the “Sickle Bend” region of China: An empirical study from the cold area of northeast. Land Use Policy 2022, 123, 106421. [Google Scholar] [CrossRef]
  36. Sinha, R.P.; Edalatpanah, S.A. Efficiency and Fiscal Performance of Indian States: An Empirical Analysis Using Network DEA. JOSA 2023, 1, 1–7. [Google Scholar] [CrossRef]
  37. Tajbakhsh, A.; Hassini, E. A Data Envelopment Analysis Approach to Evaluate Sustainability in Supply Chain Networks. J. Clean. Prod. 2015, 105, 74–85. [Google Scholar] [CrossRef]
  38. Liu, H.-H.; Chen, T.-Y.; Chiu, Y.-H.; Kuo, F.-H. A Comparison of Three-Stage DEA and Artificial Neural Network on the Operational Efficiency of Semi-Conductor Firms in Taiwan. Sci. Res. 2013, 4, 27494. [Google Scholar] [CrossRef]
  39. Li, Q.; Wei, J.F.; Gao, W. Spatial differentiation and influencing factors of land eco-efficiency based on low carbon perspective: A case of 287 prefecture-level cities in China. Environ. Chall. 2023, 10, 100681. [Google Scholar] [CrossRef]
  40. Zhang, Z.; Zhong, J.; Zhao, Z.; Fang, H. Measurement and Influencing Factors of Urban Land Use Efficiency in Beijing-Tianjin-Hebei Region. China Soft Sci. 2022, S1, 121–126. [Google Scholar]
  41. Chavunduka, C.; Dipura, R.; Vudzijena, V. Land, investment and production in agrarian transformation in Zimbabwe. Land Use Policy 2021, 105, 105371. [Google Scholar] [CrossRef]
  42. He, T.T.; Song, H.P. A novel approach to assess the urban land-use efficiency of 767 resource-based cities in China. Ecol. Indic. 2023, 151, 110298. [Google Scholar] [CrossRef]
  43. Ge, K.; Zou, S.; Chen, D.; Lu, X.; Ke, S. Research on the Spatial Differences and Convergence Mechanism of Urban Land Use Efficiency under the Background of Regional Integration: A Case Study of the Yangtze River Economic Zone, China. Land 2021, 10, 1100. [Google Scholar] [CrossRef]
  44. Lu, X.; Kuang, B.; Li, J. Regional Difference Decomposition and Policy Implications of China’s Urban Land Use Efficiency under the Environmental Restriction. Habitat Int. 2018, 77, 32–39. [Google Scholar] [CrossRef]
  45. Pan, L.; Hu, H.; Jing, X.; Chen, Y.; Li, G.; Xu, Z.; Zhuo, Y.; Wang, X. The Impacts of Regional Cooperation on Urban Land-Use Efficiency: Evidence from the Yangtze River Delta, China. Land 2022, 11, 915. [Google Scholar] [CrossRef]
  46. Banker, R.D.; Cooper, A.C.W. Some Models for Estimating Technical and Scale Inefficiencies in Data Envelopment Analysis. Manag. Sci. 1984, 30, 1078–1092. [Google Scholar] [CrossRef]
  47. Tone, K.; Toloo, M.; Izadikhah, M. A Slacks-Based Measure of Efficiency in Data Envelopment Analysis. Eur. J. Oper. Res. 2020, 287, 560–571. [Google Scholar] [CrossRef]
  48. Zhu, X.; Li, Y.; Zhang, P.; Wei, Y.; Zheng, X.; Xie, L. Temporal-spatial characteristics of ULUE of China’s 35 mega cities based on DEA: Decomposing technology and scale efficiency. Land Use Policy 2019, 88, 104083. [Google Scholar] [CrossRef]
  49. Liu, J.; Jin, X.; Xu, W.; Fan, Y.; Ren, J.; Zhang, X.; Zhou, Y. Spatial coupling differentiation and development zoning trade-off of land space utilization efficiency in eastern China. Land Use Policy 2019, 85, 310–327. [Google Scholar] [CrossRef]
  50. Tang, Y.; Wang, K.; Ji, X.; Xu, H.; Xiao, Y. Assessment and spatial-temporal evolution analysis of ULUE under green development orientation: Case of the Yangtze River Delta urban agglomerations. Land 2021, 10, 715. [Google Scholar] [CrossRef]
  51. Song, Y.; Yeung, G.; Zhu, D.; Xu, Y.; Zhang, L. Efficiency of Urban Land Use in China’s Resource-Based Cities, 2000–2018. Land Use Policy 2022, 115, 106009. [Google Scholar] [CrossRef]
  52. Lu, X.; Chen, D.; Kuang, B.; Zhang, C.; Cheng, C. Is High-Tech Zone a Policy Trap or a Growth Drive? Insights from the Perspective of Urban Land Use Efficiency. Land Use Policy 2020, 95, 104583. [Google Scholar] [CrossRef]
  53. Jingxin, G.; Jinbo, S.; Lufang, W. A New Methodology to Measure the Urban Construction Land-Use Efficiency Based on the Two-Stage DEA Model. Land Use Policy 2022, 112, 105799. [Google Scholar] [CrossRef]
  54. Estoque, R.C.; Ooba, M.; Togawa, T.; Hijioka, Y.; Murayama, Y. Monitoring Global Land-Use Efficiency in the Context of the UN 2030 Agenda for Sustainable Development. Habitat Int. 2021, 115, 102403. [Google Scholar] [CrossRef]
  55. Jiao, L.; Xu, Z.; Xu, G.; Zhao, R.; Liu, J.; Wang, W. Assessment of Urban Land Use Efficiency in China: A Perspective of Scaling Law. Habitat Int. 2020, 99, 102172. [Google Scholar] [CrossRef]
  56. Jin, Y.; Zhang, B.; Zhang, H.; Tan, L.; Ma, J. The Scale and Revenue of the Land-Use Balance Quota in Zhejiang Province: Based on the Inverted U-Shaped Curve. Land 2022, 11, 1743. [Google Scholar] [CrossRef]
  57. Zhu, X.; Zhang, P.; Wei, Y.; Li, Y.; Zhao, H. Measuring the Efficiency and Driving Factors of Urban Land Use Based on the DEA Method and the PLS-SEM Model—A Case Study of 35 Large and Medium-Sized Cities in China. Sustain. Cities Soc. 2019, 50, 101646. [Google Scholar] [CrossRef]
  58. Marshall, J.D. Urban Land Area and Population Growth: A New Scaling Relationship for Metropolitan Expansion. Urban Stud. 2007, 44, 1889–1904. [Google Scholar] [CrossRef]
  59. Schiavina, M.; Melchiorri, M.; Freire, S.; Florio, P.; Ehrlich, D.; Tommasi, P.; Pesaresi, M.; Kemper, T. Land Use Efficiency of Functional Urban Areas: Global Pattern and Evolution of Development Trajectories. Habitat Int. 2022, 123, 102543. [Google Scholar] [CrossRef] [PubMed]
  60. Dong, S.; Ren, G.; Xue, Y.; Liu, K. Urban Green Innovation’s Spatial Association Networks in China and Their Mechanisms. Sustain. Cities Soc. 2023, 93, 104536. [Google Scholar] [CrossRef]
  61. Tanihara, S.; Kobayashi, Y.; Une, H.; Kawachi, I. Urbanization and Physician Maldistribution: A Longitudinal Study in Japan. BMC Health Serv. Res. 2011, 11, 260. [Google Scholar] [CrossRef]
  62. Wang, K.-L.; Sun, T.-T.; Xu, R.-Y.; Miao, Z.; Cheng, Y.-H. How Does Internet Development Promote Urban Green Innovation Efficiency? Evidence from China. Technol. Forecast. Soc. Chang. 2022, 184, 122017. [Google Scholar] [CrossRef]
  63. Liu, H.; Liu, J.; Yang, W.; Chen, J.; Zhu, M. Analysis and Prediction of Land Use in Beijing-Tianjin-Hebei Region: A Study Based on the Improved Convolutional Neural Network Model. Sustainability 2020, 12, 3002. [Google Scholar] [CrossRef]
  64. Zeng, C.; Yang, L.; Dong, J. Management of Urban Land Expansion in China through Intensity Assessment: A Big Data Perspective. J. Clean. Prod. 2017, 153, 637–647. [Google Scholar] [CrossRef]
  65. Li, S.; Fu, M.; Tian, Y.; Xiong, Y.; Wei, C. Relationship between Urban Land Use Efficiency and Economic Development Level in the Beijing–Tianjin–Hebei Region. Land 2022, 11, 976. [Google Scholar] [CrossRef]
  66. Vejchodská, E.; Shahab, S.; Hartmann, T. Revisiting the Purpose of Land Policy: Efficiency and Equity. J. Plan. Lit. 2022, 37, 575–588. [Google Scholar] [CrossRef]
  67. Yang, Y.; Liu, Y.; Li, Y.; Li, J. Measure of Urban-Rural Transformation in Beijing-Tianjin-Hebei Region in the New Millen-nium: Population-Land-Industry Perspective. Land Use Policy 2018, 79, 595–608. [Google Scholar] [CrossRef]
  68. Hirsch, W.Z. The Efficiency of Restrictive Land Use Instruments. Land Econ. 1977, 53, 145. [Google Scholar] [CrossRef]
  69. Han, M.Y.; Chen, G.Q.; Dunford, M. Land Use Balance for Urban Economy: A Multi-Scale and Multi-Type Perspective. Land Use Policy 2019, 83, 323–333. [Google Scholar] [CrossRef]
  70. Okwu, A.T.; Oseni, I.O.; Obiakor, R.T. Does Foreign Direct Investment Enhance Economic Growth? Evidence from 30 Leading Global Economies. Glob. J. Emerg. Mark. Econ. 2020, 12, 217–230. [Google Scholar] [CrossRef]
  71. Kacperczyk, M.; Sundaresan, S.; Wang, T. Do Foreign Investors Improve Market Efficiency? National Bureau of Economic Research: Cambridge, MA, USA, 2018; Volume 34, pp. 1317–1367. [Google Scholar] [CrossRef]
  72. Alfaro, L. Multinational Activity in Emerging Markets: How and When Does Foreign Direct Investment Promote Growth? In Geography, Location, and Strategy; Advances in Strategic Management; Emerald Publishing Limited: Leeds, UK, 2017; Volume 36, pp. 429–462. ISBN 978-1-78714-276-3. [Google Scholar]
Figure 1. Analytical framework.
Sustainability 16 02962 g001
Figure 2. Temporal evolution of ULUE.
Sustainability 16 02962 g002
Figure 3. Spatial evolution of ULUE from 2000 to 2010.
Sustainability 16 02962 g003
Figure 4. Spatial evolution of ULUE from 2011 to 2022.
Sustainability 16 02962 g004
Table 1. Input Indicators.
Input IndicatorIndicator DescriptionReferences
CapitalSocial Fixed Assets InvestmentSong et al., 2022 [51]
Government ExpenditureGe et al., 2021; Lu et al., 2020 [43,52]
LaborSecondary and Tertiary Industry EmployeesTang et al., 2021; Song et al., 2022; Jingxin et al., 2022; [50,51,53]
LandArea of Urban Built-Up AreasEstoque et al., 2021; Jiao et al., 2020 [54,55]
Table 2. Output Indicators.
Output IndicatorIndicator DescriptionReferences
EconomyPublic Budget RevenueJin et al., 2022 [56]
Incremental Value of the Second and Third IndustrySong et al., 2022; Zhu et al., 2019 [51,57]
SocietyPer Capita Residential Land Area in the Municipal AreaMarshall et al., 2007; Schiavina et al., 2022 [58,59]
Total Collection Volume of Public LibrariesDong et al., 2023 [60]
Number of Hospital and Health Center BedsTanihara et al., 2011 [61]
EnvironmentArea of Urban Garden and Green SpaceEstoque et al., 2021 [54]
Table 3. Comprehensive Efficiency of Urban Land Utilization from 2000 to 2022.
Decision-Making Unit200020012002200320042005200620072008200920102011
Beijing10.9981110.9991110.99911
Tianjin1110.99810.999110.9990.9910.9931
Shijiazhuang10.9680.9770.9760.9730.9780.9790.980.9810.9810.9750.97
Tangshan0.930.9290.9270.9290.9270.9380.9490.9560.9770.9860.9930.995
Qinhuangdao0.9320.9330.9350.9360.9380.9420.9220.9220.9170.9120.9410.942
Handan0.9230.9060.8880.890.8920.8940.8860.8940.9390.9460.9771
Xingtai0.9390.9380.9250.9120.9090.9050.9070.8980.9050.9170.9370.948
Baoding0.9580.9460.9390.9290.9170.9070.9090.9070.9090.8990.9040.928
Zhangjiakou0.9720.9630.9670.9650.9550.9480.940.9380.9190.9040.8960.884
Chengde0.950.9440.9520.9460.950.9250.9140.9230.9220.9030.9160.959
Cangzhou0.940.9210.9440.9570.9550.9560.9690.9750.9850.9810.995
Langfang0.8750.8840.8880.9610.9760.987110.9950.9750.9660.983
Hengshui0.8620.8480.8530.8520.8680.8880.8780.8810.9080.9170.960.924
Mean value0.9400.9320.9330.9380.9380.9390.9380.9400.9460.9430.9550.961
Variance0.0420.0400.0410.0400.0380.0370.0420.0420.0380.0370.0360.037
Decision-Making Unit20122013201420152016201720182019202020212022Average
Beijing10.9990.9990.9970.9980.998111110.999
Tianjin10.9991111110.995110.999
Shijiazhuang0.9950.9990.9970.9830.99310.9880.980.9770.98910.984
Tangshan110.9970.9830.99510.9890.9840.985110.973
Qinhuangdao0.9530.9370.940.9740.9510.9720.98710.994110.951
Handan10.997110.9990.9820.9810.9890.979110.955
Xingtai0.9460.940.9390.9330.9540.9990.9780.980.9810.98510.942
Baoding0.9410.9410.9390.9450.9650.9560.9460.9510.9760.9750.9870.938
Zhangjiakou0.9070.890.9010.910.9230.9780.9870.9970.9730.98610.944
Chengde0.960.9260.9350.9340.944110.9580.9360.9570.9860.945
Cangzhou1110.995110.9980.9880.9880.99410.980
Langfang0.9860.9890.9920.99511111110.976
Hengshui0.9280.9330.9310.9350.94110.99510.9860.9910.925
Mean value0.9680.9630.9640.9660.9720.9910.9870.9860.9810.9900.9980.959
Variance0.0330.0390.0360.0320.0290.0150.0150.0170.0160.0130.0050.022
The table has been divided into upper and lower sections due to page limitations. The bold formatting indicates the title of the table. For clarity, the sections should be read together as a cohesive whole.
Table 4. Technical Efficiency of Urban Land Utilization from 2000 to 2022.
Decision-Making Unit200020012002200320042005200620072008200920102011
Beijing111111111111
Tianjin1111111110.99811
Shijiazhuang11111110.9991110.997
Tangshan111111111111
Qinhuangdao1111111110.99911
Handan11110.9980.9990.9870.99210.9990.9981
Xingtai111110.99610.9960.9990.99711
Baoding110.9980.9930.9910.9730.9750.9770.9810.9750.9750.988
Zhangjiakou111110.9990.9910.9940.990.9780.9720.972
Chengde1111111110.9940.9971
Cangzhou111111111111
Langfang1111111110.99711
Hengshui111.0000.9990.9990.9970.9960.9970.9980.9950.9950.996
Mean value111111111111
Variance0.0000.0000.0010.0020.0030.0080.0080.0070.0060.0090.0100.008
Decision-Making Unit20122013201420152016201720182019202020212022Average
Beijing1110.9980.9980.998111111.000
Tianjin111111110.995111.000
Shijiazhuang1111110.9950.9960.995110.999
Tangshan1110.996110.9980.9980.993110.999
Qinhuangdao10.996110.9991111111.000
Handan1111110.99910.988110.998
Xingtai110.9980.99211110.9910.99410.998
Baoding0.9920.9910.9840.9820.9930.9890.980.9860.9980.9980.9920.987
Zhangjiakou0.9720.9790.980.980.9850.9890.9950.9980.9920.99510.990
Chengde0.9990.9840.9820.9720.979110.9910.9850.9880.9960.994
Cangzhou11111110.9950.9940.99910.999
Langfang111111111111.000
Hengshui111111111111
Mean value0.9970.9960.9950.9940.9960.9980.9970.9970.9940.9980.9990.997
Variance0.0080.0070.0080.0100.0070.0040.0060.0040.0050.0040.0020.004
The table has been divided into upper and lower sections due to page limitations. The bold formatting indicates the title of the table. For clarity, the sections should be read together as a cohesive whole.
Table 5. Scale Efficiency of Urban Land Utilization from 2000 to 2022.
Decision-Making Unit200020012002200320042005200620072008200920102011
Beijing10.9981110.9991110.99911
Tianjin1110.99810.999110.9990.9930.9931
Shijiazhuang10.9680.9770.9760.9730.9780.9790.9810.9810.9810.9750.974
Tangshan0.930.9290.9270.9290.9270.9380.9490.9560.9770.9860.9930.995
Qinhuangdao0.9320.9330.9350.9360.9380.9420.9220.9220.9170.9130.9410.942
Handan0.9230.9060.8880.890.8940.8950.8980.9010.9390.9470.981
Xingtai0.9390.9380.9250.9120.9090.9090.9070.9020.9050.920.9370.948
Baoding0.9580.9460.9410.9360.9250.9330.9320.9280.9260.9220.9270.939
Zhangjiakou0.9720.9630.9670.9650.9550.9490.9490.9440.9270.9240.9220.91
Chengde0.950.9440.9520.9460.950.9250.9140.9230.9220.9090.9190.959
Cangzhou0.940.9210.9440.9570.9550.9560.9690.9750.9850.9810.995
Langfang0.8750.8840.8880.9610.9760.987110.9950.9780.9660.983
Hengshui0.8620.8480.8530.8520.8680.8880.8780.8810.9080.9170.960.924
Mean value0.9400.9320.9330.9380.9390.9420.9410.9430.9480.9480.9590.964
Variance0.0420.0400.0410.0400.0370.0350.0400.0400.0360.0330.0290.031
Decision-Making Unit20122013201420152016201720182019202020212022Average
Beijing10.9990.9990.99911111111.000
Tianjin10.9991111111110.999
Shijiazhuang0.9950.9990.9970.9830.99310.9930.9840.9820.98910.985
Tangshan110.9970.9870.99510.9910.9860.992110.973
Qinhuangdao0.9530.940.940.9740.9520.9720.98710.994110.952
Handan10.997110.9990.9820.9820.9890.991110.957
Xingtai0.9460.940.9420.9410.9540.9990.9780.980.990.99110.944
Baoding0.9490.950.9540.9620.9720.9670.9650.9650.9780.9770.9940.950
Zhangjiakou0.9340.910.9190.9280.9380.9880.9910.9990.9810.99110.953
Chengde0.9610.9410.9510.9610.965110.9670.950.9690.990.951
Cangzhou1110.996110.9980.9930.9940.99410.981
Langfang0.9860.9890.9920.99511111110.976
Hengshui0.9280.9330.9310.9350.94110.99510.9860.99110.925
Mean value0.9710.9670.9690.9720.9760.9920.9900.9890.9870.9920.9990.962
Variance0.0280.0340.0320.0260.0250.0120.0110.0130.0130.0100.0030.021
The table has been divided into upper and lower sections due to page limitations. The bold formatting indicates the title of the table. For clarity, the sections should be read together as a cohesive whole.
Table 6. Urban Land Utilization Efficiency from 2000 to 2022.
Decision-Making Unit200020012002200320042005200620072008200920102011
Beijing1.0050.9321.0031.0031.0030.9851.0021.0011.0000.9871.0001.000
Tianjin1.0021.0021.0000.9491.0000.9291.0000.9550.9130.9230.9401.001
Shijiazhuang1.0070.8180.8520.8440.8270.8430.8480.8550.8560.8650.8840.907
Tangshan0.6850.7190.7300.7640.7940.8200.8360.8540.8770.8920.9090.904
Qinhuangdao0.5400.5740.5810.6050.6290.6760.6850.7440.7550.7700.7980.815
Handan0.5910.6470.6570.6740.7140.7420.7400.7710.8160.8310.8581.001
Xingtai0.2900.2950.3310.4620.5060.5230.5410.6370.6560.6930.8210.844
Baoding0.5630.5890.6250.6400.6690.6740.6770.6940.7660.7730.7920.808
Zhangjiakou0.4350.4680.4660.5040.5810.6300.6530.6990.7410.7590.7770.782
Chengde0.2050.2590.3210.4320.5370.5600.5760.6410.6930.7180.7710.828
Cangzhou0.4610.4930.5270.5480.5640.6090.6620.7130.7910.8181.0050.929
Langfang0.4560.5380.6350.6940.7310.7541.0011.0010.8460.8300.8430.871
Hengshui0.0180.1260.2180.3040.3410.3940.4200.4520.4650.5060.6360.584
Mean value0.5210.5440.5780.6180.6580.6790.7200.7510.7640.7810.8360.856
Variance0.2900.2440.2260.1830.1720.1500.1760.1500.1210.1100.0950.111
Decision-Making Unit20122013201420152016201720182019202020212022Average
Beijing1.0000.9620.9790.9730.9740.9750.9861.0021.0021.0031.0050.991
Tianjin1.0010.9811.0031.0021.0061.0041.0081.0000.9211.0011.0140.981
Shijiazhuang0.9300.9500.9440.9360.9521.0020.9670.9570.9540.9781.0160.913
Tangshan1.0010.9400.9310.9280.9441.0110.9580.9570.9581.0001.0190.888
Qinhuangdao0.8120.8260.8490.9010.8980.9270.9541.0010.9781.0051.0200.797
Handan1.0020.9251.0001.0010.9120.9280.9270.9420.9341.0031.0140.853
Xingtai0.8140.8250.8400.8240.8400.9540.9420.9400.9480.9661.0180.718
Baoding0.8070.8150.8190.8560.8680.9000.8940.9150.9300.9330.9370.780
Zhangjiakou0.7850.7940.8100.8210.8710.9090.9180.9240.8890.9081.0060.745
Chengde0.8490.8120.8350.8400.8491.0041.0030.8930.8820.9070.9210.710
Cangzhou1.0001.0010.9850.9691.0021.0090.9500.9330.9380.9651.0290.822
Langfang0.8780.8860.9140.9551.0011.0021.0031.0141.0081.0021.0030.864
Hengshui0.5870.6290.6380.6510.8751.0200.9791.0090.9590.9741.0220.600
Mean value0.8720.8650.8810.8900.9180.9720.9590.9570.9410.9701.0020.806
Variance0.1240.1030.1050.0990.0610.0450.0360.0400.0350.0360.0350.104
The table has been divided into upper and lower sections due to page limitations. The bold formatting indicates the title of the table. For clarity, the sections should be read together as a cohesive whole.
Table 7. Descriptive Statistics of Variables.
VariableDefinitionUnitSample SizeMeanMaximumMinimumStandard Deviation
Fiscal balance(Government expenditure − Government revenue)/Land transfer income2992.59736.0680.1593.252
Industrial structurePer capita added value of the tertiary industry/Per capita added value of the secondary industry2991.1095.2980.4130.804
Openness
level
Total import and export volume/GDP2990.2461.8280.0080.362
Green development levelAdded value of the secondary industry/Industrial wastewater discharge volume10,000 CYN/Million tons29921.334150.3711.64223.552
Digitalization LevelInternational Internet users/Total populationHouseholds count/person2990.1841.1730.0010.165
Per capita GDPGDP/Total population 10,000 CYN/person2993.87919.0000.4613.150
Infrastructure constructionUrban road area/total populationSquare meter/person29914.73933.8705.1204.965
Real estate investmentReal estate investment/Fixed asset investment2990.1660.5830.0280.118
Per capita land areaUrban built-up area/Total populationSquare kilometers/10,000 people2990.2871.0890.0500.275
Table 8. Regression Results.
VariableModel (1)Model (2)Model (3)Model (4)Model (5)Model (6)Model (7)
Fiscal balance−0.017 ***
(−5.108)
−0.010 ***
(−3.920)
−0.005 **
(−2.083)
Industrial structure 0.257 ***
(4.578)
0.071
(1.491)
0.013
(0.294)
Openness level 0.113 **
(2.186)
0.270 ***
(4.755)
0.205 ***
(2.987)
Green development level 0.004 ***
(11.155)
0.002 ***
(4.660)
0.002 ***
(4.240)
Digitalization level 0.708 ***
(12.841)
0.478 ***
(6.616)
0.164 **
(2.100)
Per capita GDP 0.005
(0.788)
Infrastructure construction 0.014 ***
(6.498)
Real estate investment 0.611 ***
(3.873)
Per capita land area 0.020
(0.200)
_cons0.863 ***
(68.965)
0.663 ***
(18.670)
0.792 ***
(28.518)
0.731 ***
(64.642)
0.690 ***
(54.370)
0.603 ***
(18.563)
0.369 ***
(8.276)
Adjusted R20.3320.3510.3030.4930.5380.6150.720
f-statistics12.414
***
11.848
***
9.543
***
23.268
***
27.734
***
29.029
***
37.421
***
*** and ** are significant at the 1% and 5% levels, respectively.
Disclaimer/Publisher’s Note: The statements, opinions and data contained in all publications are solely those of the individual author(s) and contributor(s) and not of MDPI and/or the editor(s). MDPI and/or the editor(s) disclaim responsibility for any injury to people or property resulting from any ideas, methods, instructions or products referred to in the content.

