1. Introduction
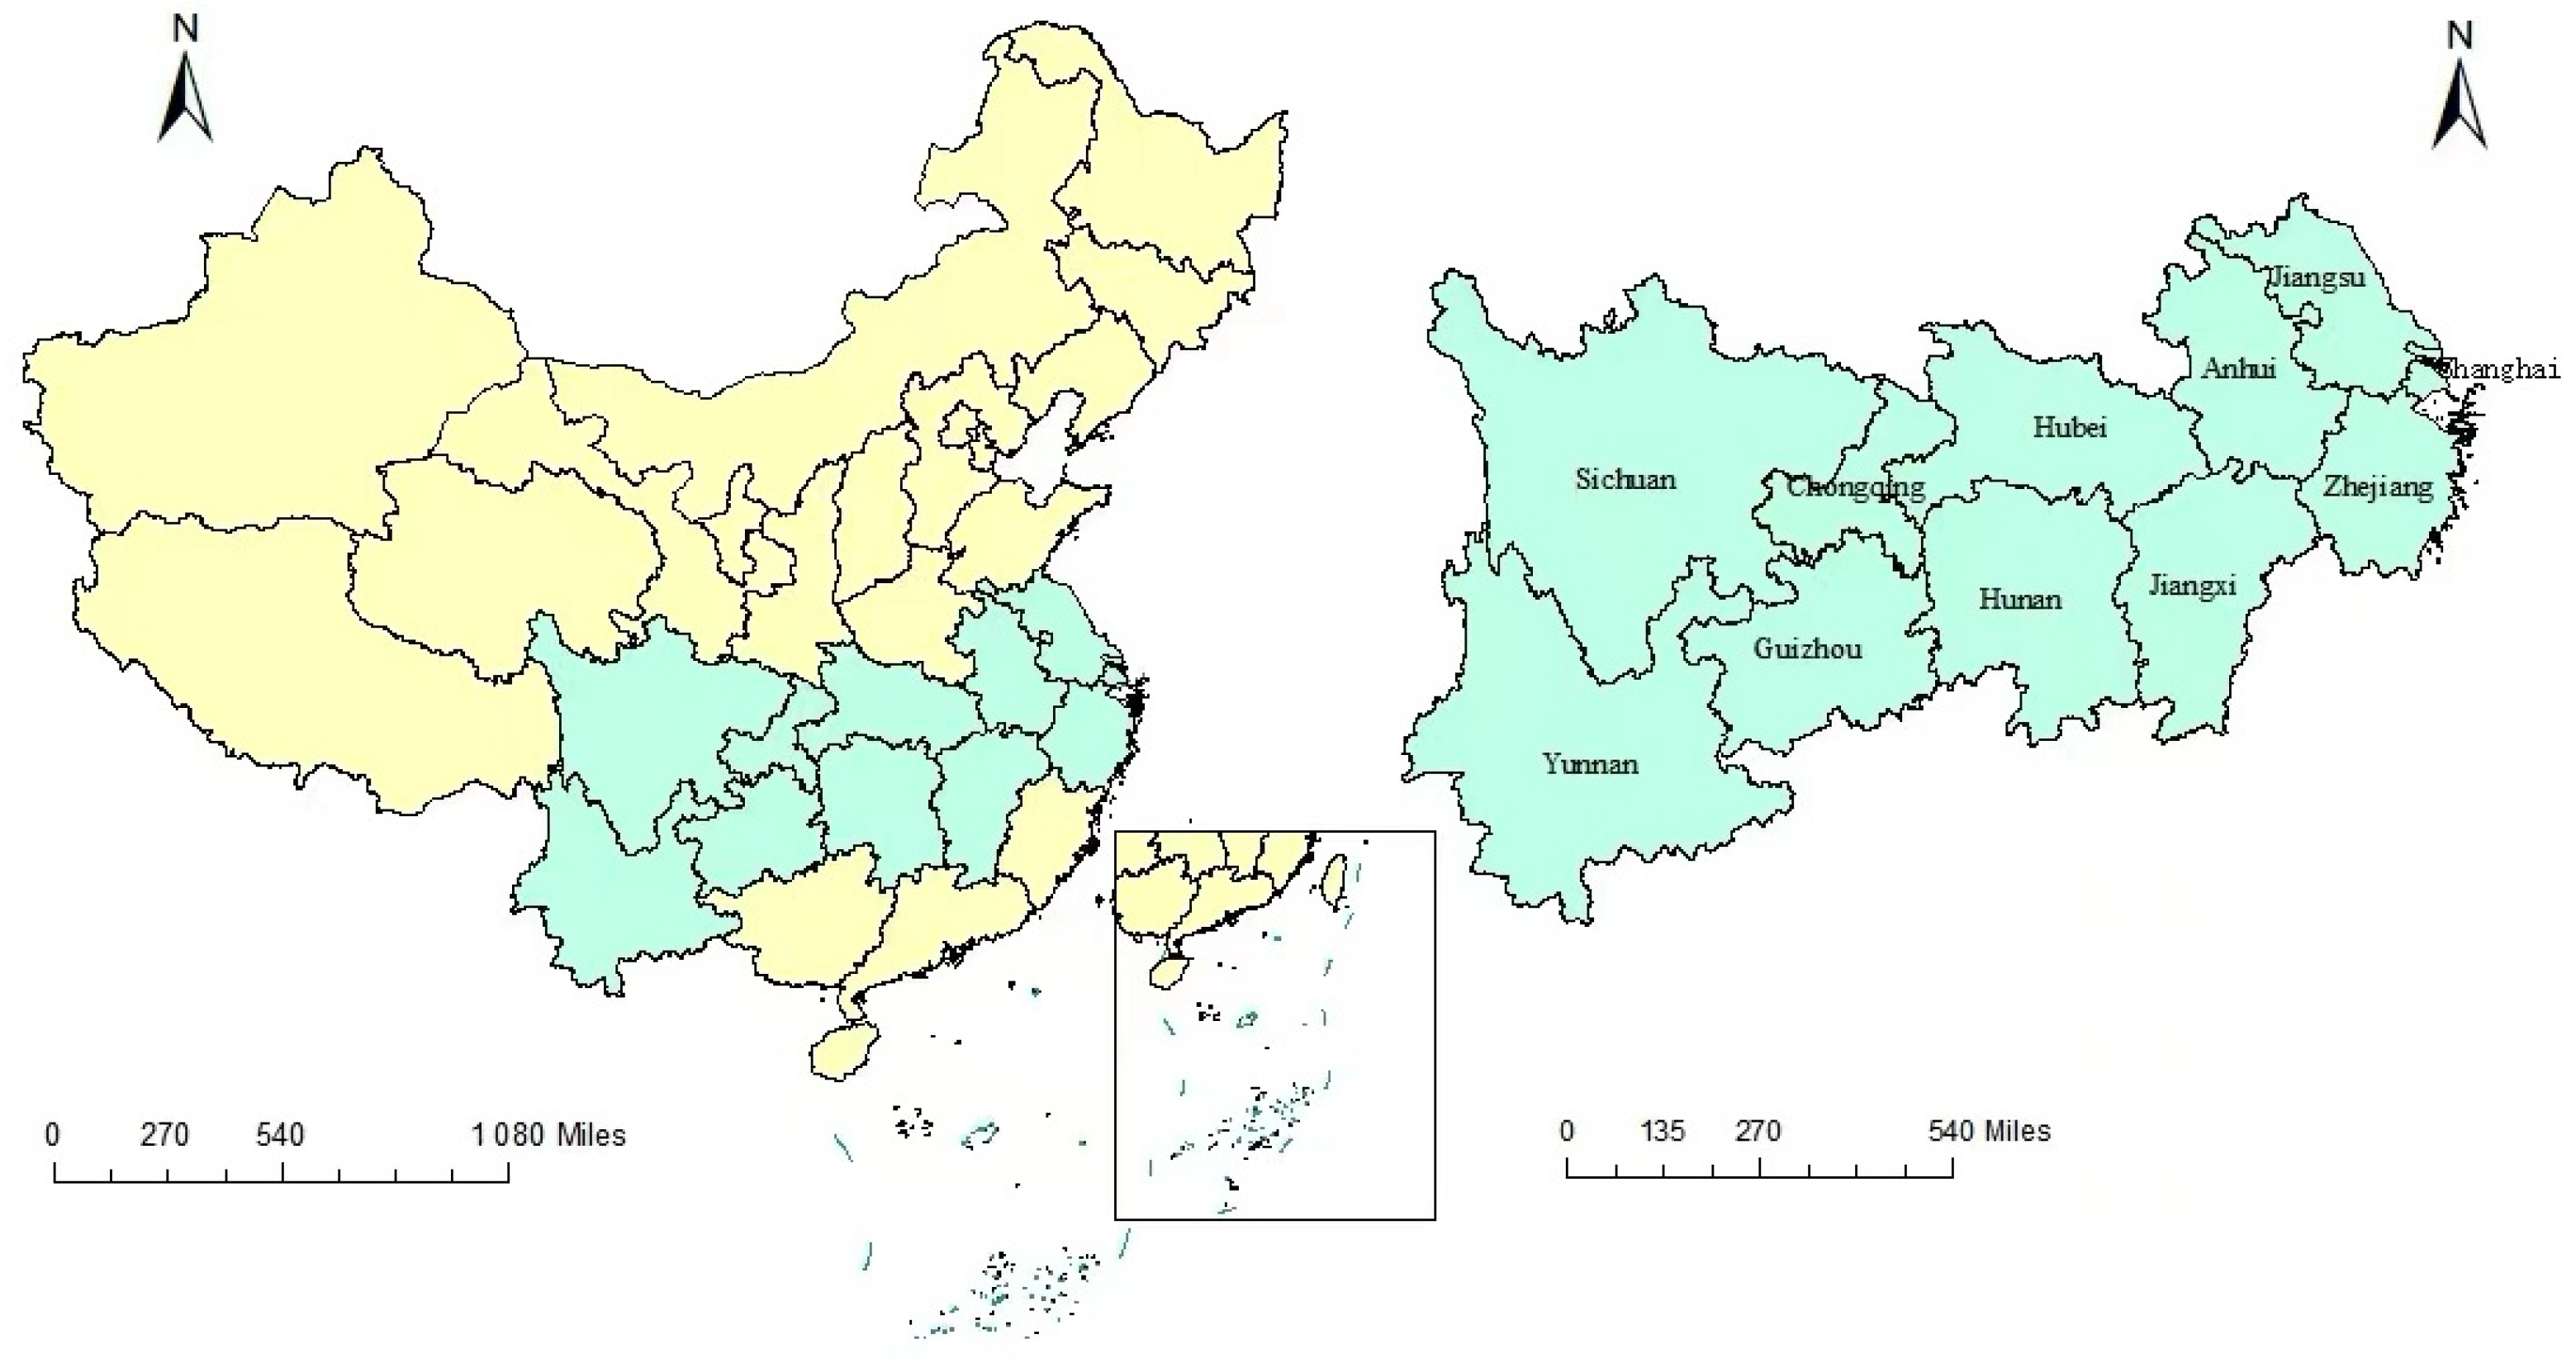
The Yangtze River Economic Belt, as one of the three important supporting belts in China, accounts for 21.4% of the country’s total area, covering 11 provinces and regions across the three major sectors of east, central, and west (see
Figure 1). In 2022, its economic aggregate accounted for 46.5% of the country’s total weight, making it a key battleground and economic center for ecological priority and green development. However, the long-term rough development mode has made the city’s ecological carrying capacity insufficient, facing problems such as a lack of resources, pollution of the environment, ecological devastation, and an unbalanced industrial layout, resulting in a lower overall ecological resilience and a trend of degradation of ecosystem service functions. According to The Annual Report on the Development of the Yangtze River Economic Belt (2019–2020) statistics, the Yangtze River Economic Belt emissions of sulfur dioxide, nitrogen oxides, soot, and dust accounted for 40% more than the national total and the relative inadequacy of the disposal of solid waste pollution, and in 2020, the direct economic losses due to flood disasters exceeded 200 billion yuan [
1]. As a result, the ecological and environmental risks are prominent. As an important cluster of high-pollution industries such as heavy chemicals, electronic messages, and equipment manufacturing in China, there is a huge space for industrial innovation synergy and ecological civilization construction in the Yangtze River Economic Belt.
Green finance is a general term for financial activities such as credit, securities, investment, and insurance in order to achieve economic growth and environmentally friendly and coordinated development [
2]. It is the implementation of the reality of high-quality development needs, but also China’s financial and international integration of the inevitable choice. Under the lead of the “Guidelines on building a green financial system”, green finance in the Yangtze River Economic Belt has shown a good development trend, and the China Development Bank has issued 10 billion yuan of “Development of the Yangtze River Economic Belt” thematic “Bond Pass” green financial bonds to coordinate the allocation of resources. By strengthening the incentive mechanism for green project investment and exploring new growth points, the economic value contained in ecological products can be transformed into economic benefits.
In recent years, China has continuously strengthened its policy support for ecological construction, and Chinese government has made a strategic plan for “promoting green development and harmonious coexistence between human beings and nature” and has continued to fight a deep battle to protect the blue sky, blue water, and clean soil, so as to enhance the diversity, stability, and sustainability of ecosystems. “The Action Plan for In-depth Protection and Restoration of the Yangtze River (2022)” points out that it is vital to promote green innovation, optimize the industrial structure and layout, and promote the development of high-quality economics through the protection of the high-quality ecological environment. The ecological protection of the Yangtze River in the whole basin insists on the guidance of “jointly grasping major protection, not engaging in major development”, and practices the concept of “Lucid waters and lush mountains are invaluable assets”. Objectively understanding the relationship between green finance and ecological resilience will further reveal the key path to improving ecological environment quality and promoting coordinated and sustainable development from the perspective of green development.
The marginal contribution of this article is as follows: Firstly, supported by resilience theory, a three-dimensional evaluation system for ecological resilience of “resistance-adaptability-resilience” is constructed, fully considering the spatiotemporal differences and evolutionary trends of ecological resilience levels among provinces in the Yangtze River Economic Belt. Secondly, a fixed-effect model is constructed to examine the impact of green finance development and its four major aspects on the level of ecological resilience in the research area, explore the internal driving force of the effective integration of green finance resources and the elastic role of the ecosystem, and achieve mutual growth and prosperity between economic development and ecological protection.
2. Literature Review
The concept of resilience was originally named engineering resilience and is often applied in the field of physics. It was later introduced into ecology by Holling, which refers to the adaptive ability of an ecosystem to restore itself to its stable state when subjected to different types of risks [
3], paying attention to coordinating the ecological environment and human habitat [
4]. The inherent attributes of an ecosystem include topography and geomorphology [
5], climate [
6], hydrology [
7], vegetation [
8], biodiversity [
9], etc. With the improvement of public awareness of ecological civilization construction, determining how to resist the impact of ecological risks, adjust to adapt to the real situation, and quickly recover has become a focus of attention in many interdisciplinary fields such as ecology, economics, and sociology. Martin [
10] explored the response of ecological resilience in the face of major downturns in regional economies. Based on the theory of resilience governance, Wang et al. [
11] analyzed the positive interaction between rural revitalization and ecological resilience from three dimensions: production resilience governance, life resilience governance, and environmental resilience governance. He believes that there is still significant room for improvement in the overall high-quality coordination. Wang et al. [
12] studied the impact of new urbanization on ecological resilience to address ecological risks, further exploring sustainable development and sharing socio-economic pathways, and it is not difficult to see the importance of ecological resilience.
Due to the conceptual ambiguity and plasticity of ecological resilience, there is no unified understanding of indicator selection and measurement methods for ecological resilience both domestically and internationally. Shi et al. [
13] constructed an ecological resilience index system from the aspects of sensitivity and adaptability and evaluated the spatiotemporal variability of this indicator in the Beijing–Tianjin–Hebei urban agglomeration through multiple linear regression. Baho et al. [
14] decomposed ecological resilience into four complementary attributes: scale, adaptive capacity, thresholds, and alternative systems, taking into account the balance between the ecological environment and the human settlement environment. Wang et al. [
15] established a physics coupling model and an ecological resilience indicator system of “scale-density-form” to calculate the coupling and coordination between urbanization level and ecological resilience in the Pearl River Delta region. They provided operational suggestions for solving urban problems at the level of national spatial planning. Some scholars have also used the ecological footprint method, the grey correlation degree model [
16], and STIRPAT-GTWR [
17] to quantify and evaluate ecological resilience, further deepening the depth and breadth of the understanding of ecological resilience.
With the development of theory and practice, the research scale of ecological resilience has expanded from a single ecosystem, mainly concerning marine ecosystems [
18] and forest ecosystems [
19], to multidimensional composite ecosystems such as macro-regions, meso cities or rural areas, typical ecological areas, urban agglomerations, and economic belts, covering the driving mechanisms of ecological resilience and the dynamic evolution of multi-level structural changes. Zhang et al. [
20] took the Yellow River Basin as an example and pointed out that the improvement of economic openness has shaped the advantages of high-quality development in the basin, effectively ensuring the risk resistance and post-disaster restoration ability of urban ecosystems. Zhao [
21] found that institutional safeguards, industrial transformation, and infrastructure have strong constraints on the ecological carrying capacity. Cheng et al. [
22] pointed out that information-based agriculture has improved agricultural production efficiency and resource utilization, and the precision and timeliness of fiscal support policies have significantly promoted the construction of rural ecological resilience. Therefore, the development of ecological resilience is deeply influenced by internal and external environmental factors such as biogeography and human activities.
Under the background of carbon peak and carbon neutrality, green innovation and sustainable development have become important issues of the times. The correlation between green finance development and ecological resilience has attracted great attention from many experts. A. I. Hunjra [
23] pointed out that in developing countries, green finance plays a key role in both ecological efficiency and environmental effects, promoting the organic combination of high-quality urban economic development and high-quality ecological protection. Chen et al. [
24] used cce-mg and D-H to discuss the impact mechanism of green economy development on the economic level and ecological footprint of industrialized countries in Asia, which is beneficial for the government to guide the flow of funds towards environmentally friendly projects to promote energy conservation and emission reduction. This deeply demonstrates that green finance is an important driving force and sustained driving force for ecological civilization construction.
In general, existing studies mostly consider the functional relationship between green finance and the ecological level of a certain region from a single perspective and focus on the evaluation of the level of development, without incorporating this concept into the evaluation model of both. Most of the research areas are nationwide or developed regions, and there is a lack of systematic research on the interaction between green finance and ecological resilience in the Yangtze River Economic Belt. Based on this, this paper constructs a three-dimensional index system of ecological resilience of “resistance-adaptability-resilience”, deeply analyzes the spatial and temporal evolution of ecological resilience in the study area and the convergence effect, and explores the optimization logic and realization path of the benign interaction between green finance and ecological resilience, intending to provide a reference to the synergistic promotion of the urban economy and ecologically sustainable development of the Yangtze River Economic Belt. It is believed that the development of green finance can enhance the level of regional ecological resilience in order to provide reference research for promoting the coordinated promotion of a high-quality urban economy and sustainable ecological development in the Yangtze River Economic Belt.
3. Model Introduction
3.1. Principal Component Analysis Method
Principal Component Analysis (PCA) [
25] recombines several comprehensive indicators unrelated to each indicator, extracts key information, and produces a linear combination superior to the original variables by reducing the spatial dimension of the research object. The following is the specific procedure of principal component analysis:
Suppose there are samples and indicators, which can form a sample matrix of size , where is the original variable.
First, we calculate the mean value , standard deviation , and , and the original matrix is varied to obtain the normalized matrix . Next, we calculate the correlation matrix , where denotes the correlation coefficient between and . Then, the eigenvalues and eigenvectors of the correlation matrix are computed to determine the principal component , and thus the principal component , with denoting the principal component. Finally, the number of principal components is determined by the contribution ratio and the cumulative variance contribution ratio . If the cumulative contribution of the first principal component reaches 80–95%, it is chosen to be set as a new variable. The composite score of principal components is further calculated.
Enhancing regional ecological resilience is an important way to eliminate the antagonistic relationship between man and nature, so as to realize green, low-carbon, and innovative development. In view of the completeness of the data and the timeliness of the article, this paper selects data from 11 provinces in the Yangtze River Economic Belt from 2009 to 2021 and constructs an evaluation index system of “resistance-adaptability-resilience”. Due to the correlation between the indicators contained in each dimension, all the indicators under each dimension are scientifically measured and their 12 sub-indicators are synthesized into a comprehensive single indicator of ecological resilience to summarize the representative factors affecting the ecological resilience of this study area in natural and socio-economic contexts so that the interpretive force of the comprehensive index is greater than that of a single index (See
Table 1). Therefore, the application of principal component analysis to the treatment and analysis of ecological resilience is conducive to the grasp of the green and high-quality development of cities in the Yangtze River Economic Belt, which also provides a scientific and rational basis for future plans.
Based on the essential connotation of ecological resilience, a system of ecological resilience indicators has been established, which takes into account the interaction between human activities and the ecological environment, as well as the response and recovery ability under resource exploitation and ecological pollution. Resilience is expressed as the ability to resist when the city faces shocks, and the synergistic management mechanism of environmental pollution and economic development will play an important role. Referring to the research of Liu and Guo, the economic development level is calculated by selecting per capita regional gross domestic product and per unit area GDP [
26]. The intensity of industrial wastewater discharge, industrial sulfur dioxide discharge, and industrial dust discharge are used to measure industrial pollution [
27]. Resilience is reflected in the city’s self-adjustment ability in response to the impact and improvement of the utilization efficiency of natural resources and the benefits of ecological environment protection. Referring to the research of Tang and Shen et al., the comprehensive utilization rate of industrial solids, the central treatment rate of urban sewage [
28], and the harmless treatment rate of domestic garbage [
29] are selected to reflect the adaptation level. Resilience is expressed as the recovery speed and innovation ability of the area after impacts and the increase in the protection of ecosystems during development and construction. Referring to the research of Fu and Lv et al., the urban green coverage rate [
30], per capita green space area of parks [
31], urbanization rate, and financial expenditure on environmental protection are selected to analyze the degree of effect.
3.2. Panel Regression Model
Panel data are a collection of observations on a specific set of units over multiple time periods, and its heterogeneity across time and sections makes empirical proof more effective. The fixed-effect model, random-effect model, and mixed-effect model are the three main models used in panel data analysis. In the mixed-effect model, we assume that there are no individual effects, and the average value is taken over the sample population, as shown in Formula (1). The estimation coefficient of the fixed-effect model is used as a random variable in the random-effect model, and the generalized least-square method is used to estimate, as shown in Formula (2). The fixed-effect model includes the individual fixed-effect model and the time fixed-effect model, as shown in Formula (3). If the estimated coefficient is significantly positive, it indicates that the development of green finance has a promotional effect on the level of ecological resilience. If the estimated coefficient is significantly negative, it indicates that the development of green finance has a restraining effect on the level of ecological resilience. Among them,
represents the level of ecological resilience of the dependent variable,
represents the level of green finance development of the explanatory variable,
is the same individual effect, and
is the estimated coefficient of regression and they all represent the fixed effects of provinces and years while
,
are interference terms that vary with individuals and time.
Unlike traditional finance, green finance is one of the key topics in contemporary times to grasp economic and environmental benefits according to the “Guiding Opinions on Building a Green Financial System” jointly issued by the People’s Bank of China, the Ministry of Finance, and seven other ministries and commissions. Concerning the research of Lee C C and Chen Yanhua et al. [
32,
33], this paper constructs an indicator system for the development level of green finance from the four perspectives of green credit, green bonds, green investment, and green insurance, i.e., the explanatory variables (See
Table 2). The definitions of the specific indicators are as follows: (1) Green credit is measured by the proportion of interest expenditure of high-energy-consuming industries in the total industrial interest expenditure, and the six high-energy-consuming industries refer to the petroleum-, coal,- and other fuel-processing industry, the chemical raw materials and chemical products manufacturing industry, the non-metallic mineral products industry, the black metal smelting and rolling processing industry, the non-ferrous metal smelting and rolling processing industry, and the electric power and heat production and supply industry, whose interest expenses constrain the industry’s green transformation, energy saving, and emission reductions [
34]. (2) Green bonds are measured by the proportion of the total output value of environmental protection enterprises in the total market capitalization of A-shares. The development of environmental protection enterprises requires a large amount of up-front capital and a long payback period, and the expansion of financing channels can provide a guarantee for sustainable development [
35]. (3) Green investment is measured by the proportion of fiscal expenditure on environmental protection in total fiscal expenditure, which reflects that local governments guide social capital to flow into green projects such as energy conservation, environmental protection, resource development, and pollution control based on a full evaluation of economic, social, and environmental benefits, playing an important role in improving environmental quality and promoting green innovation [
36]. (4) Green insurance is measured by the proportion of agricultural insurance income to the total agricultural output value. Agricultural insurance is policy insurance with strong public attributes, providing protection for the stability of farmers’ income in the event of major disasters, and is most relevant to ecological environmental protection [
37].
Building upon existing research, this paper chooses the following five control variables to join the regression analysis: FDI is measured by the proportion of actual utilization of foreign investment in GDP. Foreign-funded enterprises have set stricter standards to regulate production and emission processes, and the technology and efficiency advantages that they possess are favored by local governments [
38], which can promote the development of innovation in green environmental technologies and significantly improve environmental quality [
39]. The level of technological innovation (Technology) is measured by the proportion of science and education expenditure to general public budget expenditure. Green technological innovation improves the utilization efficiency of energy and natural resources, and ecological value is ensured. Population agglomeration (Population) is measured by the proportion of permanent population and land area at the end of the year. Population and ecology are two major issues facing today’s society, and the increase in the absolute amount of urban production, supply, and energy consumption has made the ecological pressure prominent, which is not conducive to the realization of a high level of ecological welfare performance. The intensity of environmental regulation (Regulation) is measured by the proportion of the total investment in urban pollution control to fiscal expenditure. Environmental regulations have strong dynamism, which is conducive to the continuity and stability of national policies for ecological environment protection [
40]. The level of water resources is measured by per capita water consumption and the continuous improvement of water resource development will crowd out the share of ecological water and threaten the ecological security of the basin.
3.3. Data Sources and Descriptive Statistics
Given the timeliness and reliability of the data, this article selects panel data from 11 provinces in the Yangtze River Economic Belt from 2009 to 2021 as the research sample. The relevant variables are sourced from the National Bureau of Statistics of China, the China Environmental Statistics Yearbook, the China Energy Statistics Yearbook, and statistical yearbooks and statistical bulletins of various provinces and cities. For individual missing data, interpolation or moving average methods are used to fill in. The descriptive statistical analysis results of each variable are shown in
Table 3.
4. Empirical Results and Analysis
4.1. The Ecological Protection of the Yangtze River about Ecological Resilience
Social and ecological systems have complexity and vulnerability and will continue to be impacted and disturbed by internal and external environmental risks. Therefore, it is an important issue in the current era to grasp the law of ecological development and establish a harmonious relationship of equality and coexistence between man and nature [
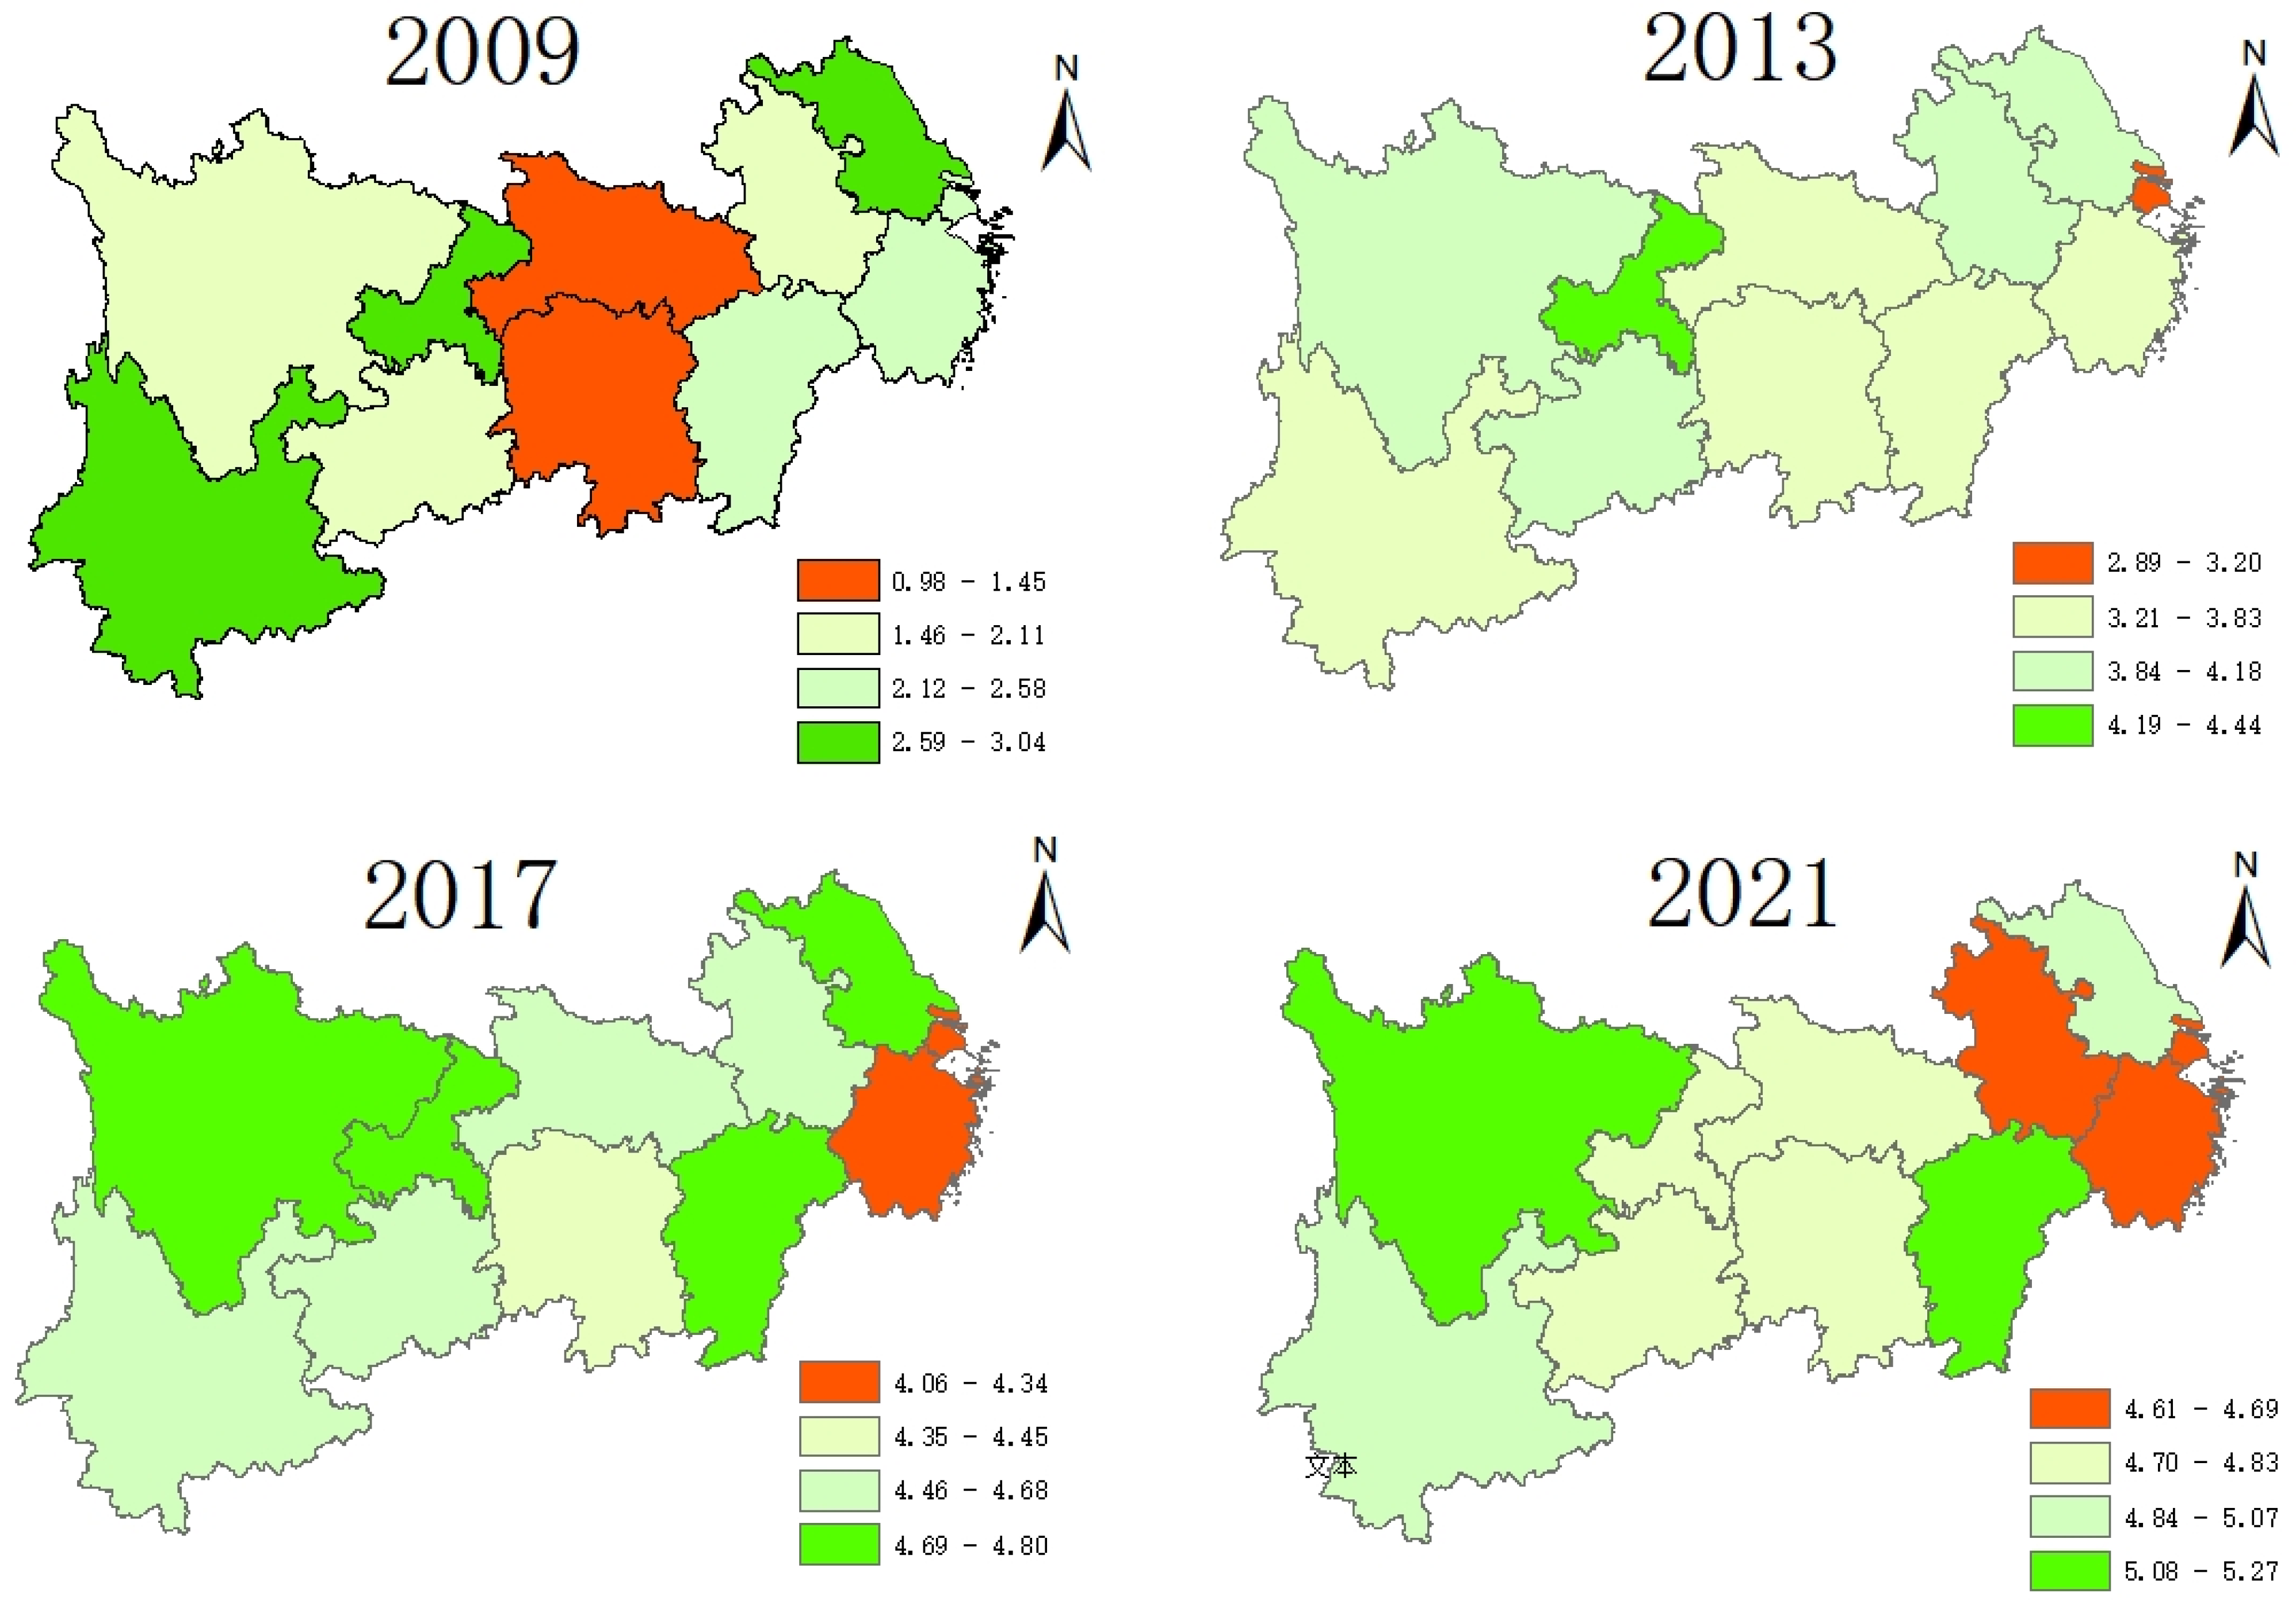
41], so as to satisfy the people’s growing needs for green development and a good ecological environment. Based on this, this paper selects a total of 12 indicators to measure the ecological resilience level of 11 provinces and cities along the Yangtze River Economic Belt from the three dimensions of “resistance-adaptability-resilience”, deeply considering both sides of the ecological elements to synergize with the ecological security and service demand, as shown in
Figure 2. At the same time, the ecological resilience level of the study area in four key years, 2009, 2013, 2017, and 2021, is mapped using Arc GIS with provincial units as the boundary, and the spatial visualization further supports the promotion of green finance on ecological resilience.
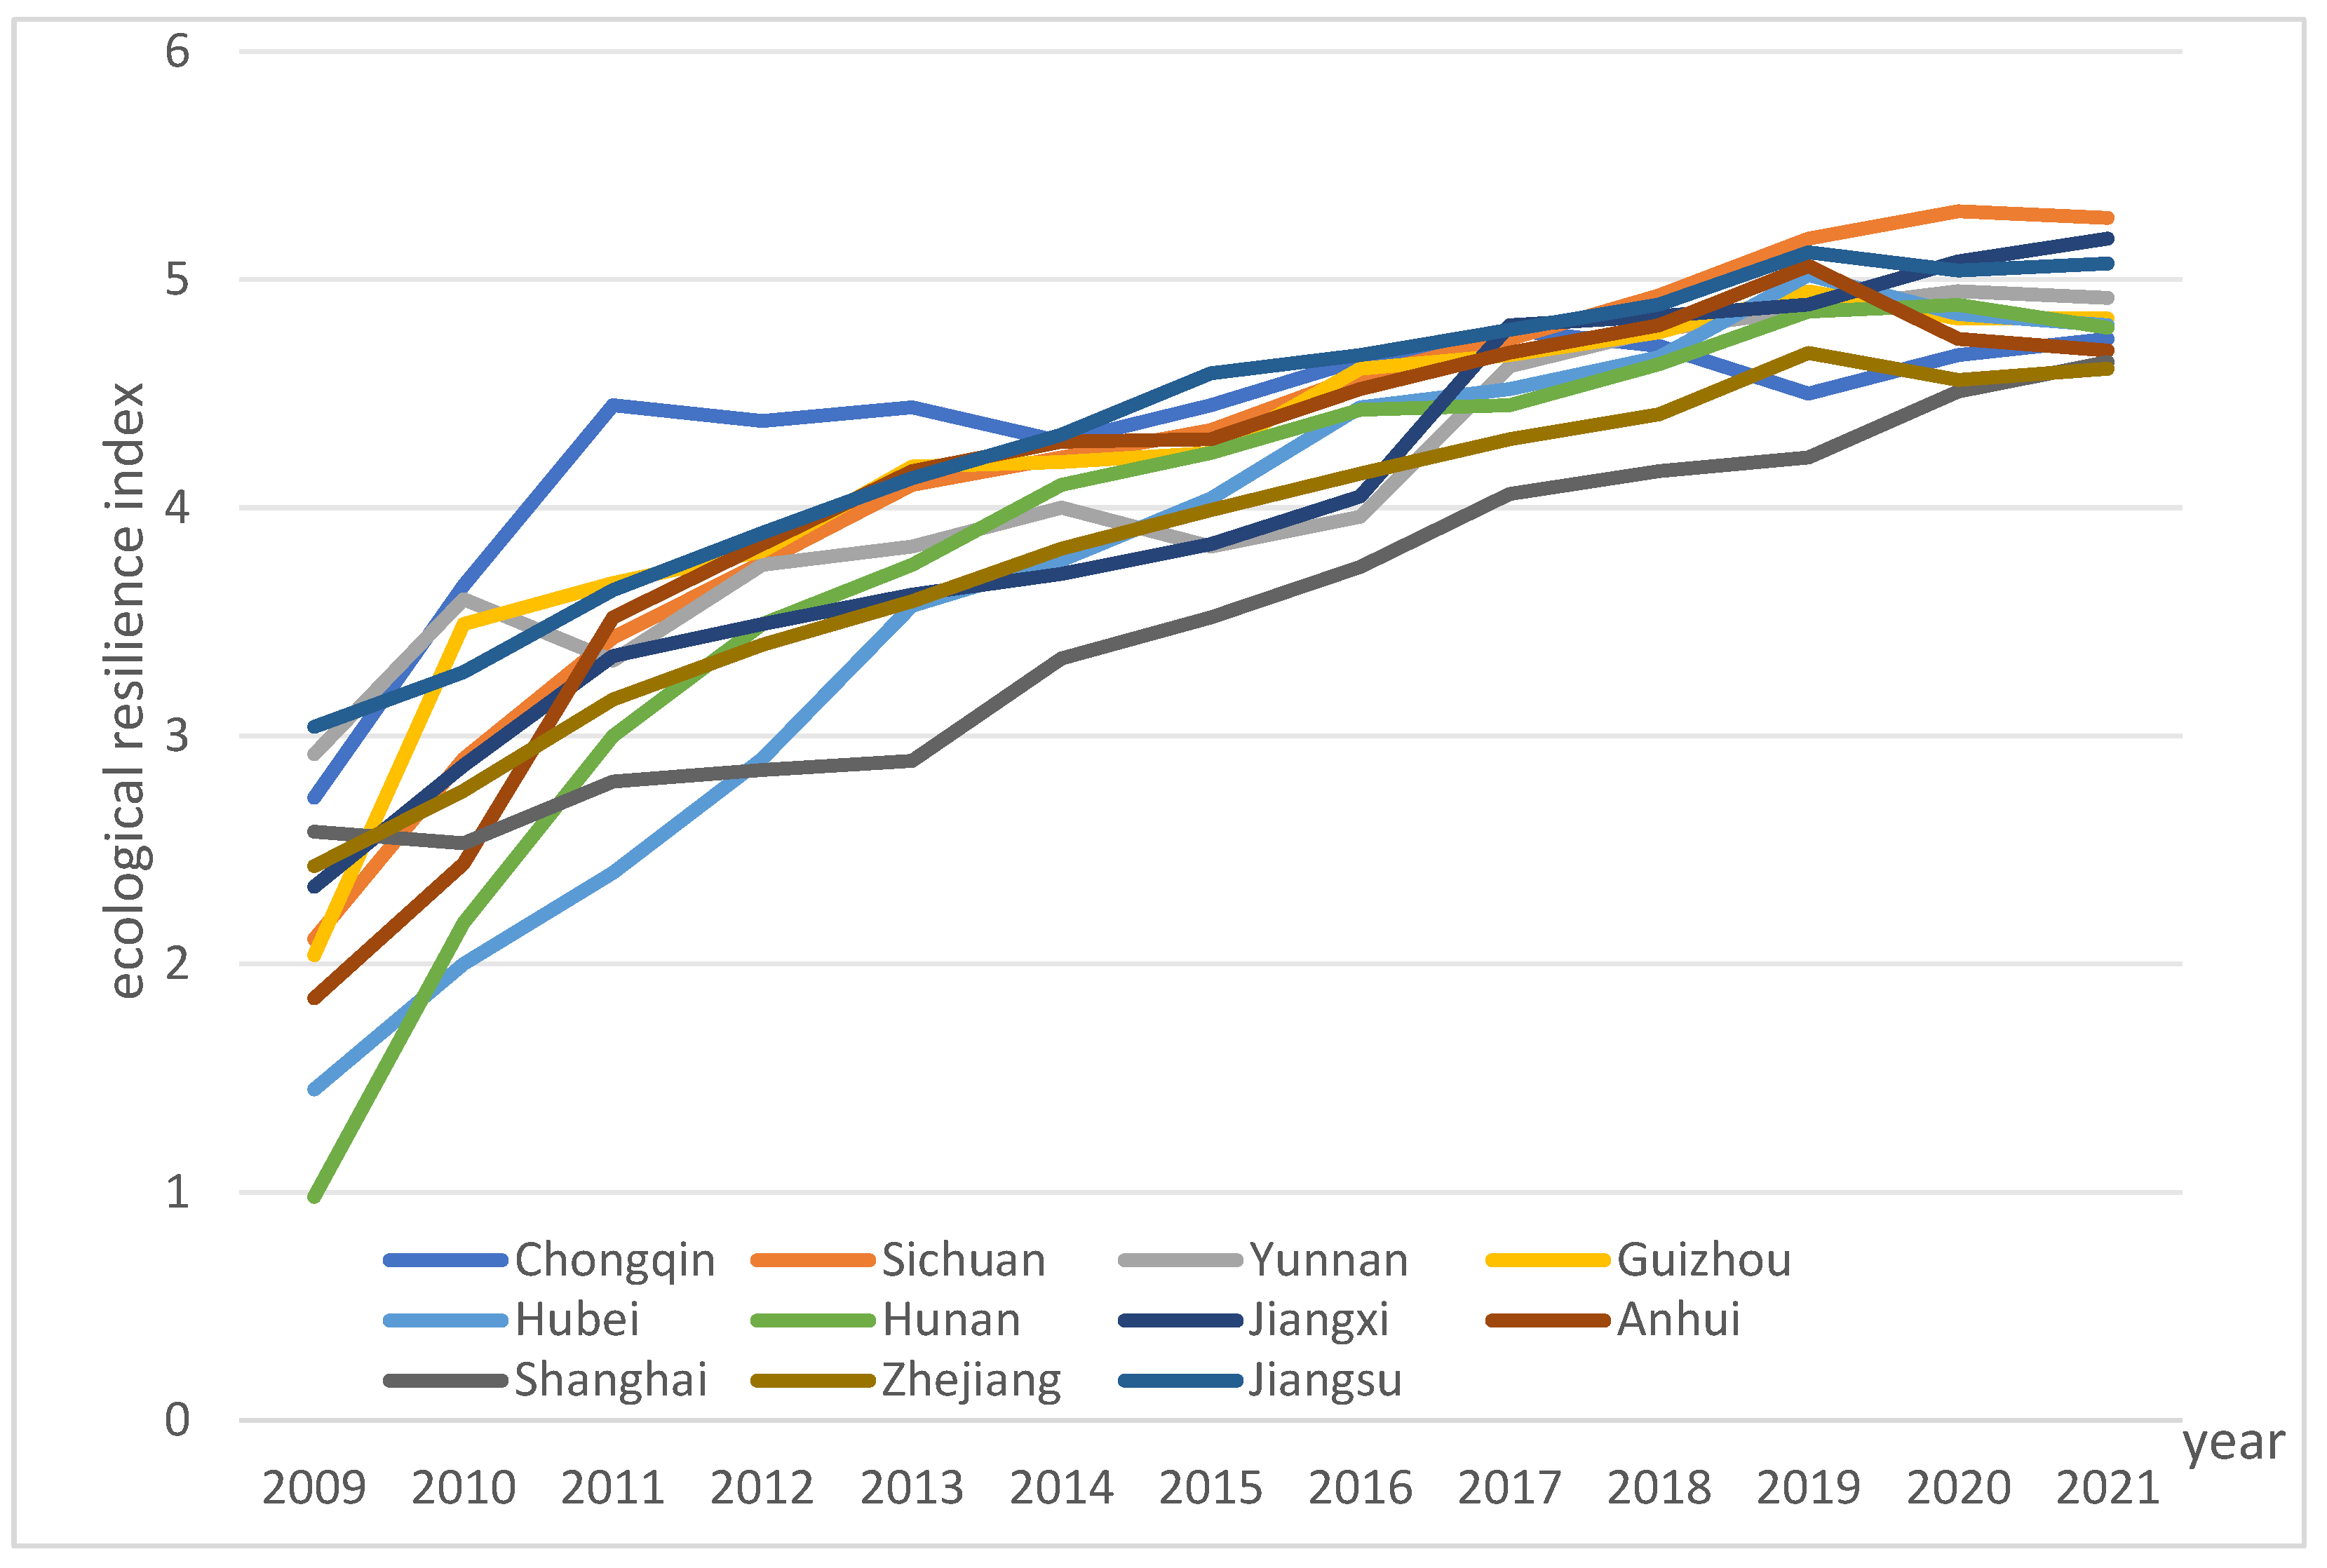
Figure 3 shows the dynamic evolution of time and space of the ecological resilience level of the study area.
- (1)
From the perspective of the time dimension, the level of ecological resilience of the Yangtze River Economic Belt from 2009 to 2021 shows a fluctuating upward trend in general, with some oscillations in a few years. From 2011 to 2018, the index first decreased and then increased, i.e., there was a “U-shaped trend”, in which the consumption rate of resources by human activities was faster than the regeneration capacity of resources, leading to a decrease in the carrying capacity of the ecological environment. Under the conditions of rapid economic development and the continuous optimization of industrial structure, people have put forward higher requirements for green development and an ecological environment. With the improvement of the green finance system and strong support from national finance, the level of ecological resilience of all the provinces reached the highest point in 2019 and crossed the inflection point of the environmental Kuznets curve downward, and the rate of increase leveled off after 2020. The ecological environmental quality has been improved and strengthened and the adaptive capacity to cope with uncertain risks has been strengthened.
- (2)
From the perspective of the spatial distribution pattern, the ecological resilience starting point of the upstream and middle reaches of the study area is low, and the management of ecological environmental resilience has achieved remarkable results. The importance of ecological barriers has been continuously exerted in the whole basin, resource conservation and environmental governance have been coordinated, and high-quality ecological resilience has been achieved under the guidance of industrial structure optimization and upgrading. The downstream area has a good economic foundation and location advantages, with a high starting point of ecological resilience, but due to the rapid urban expansion and industrial agglomeration, the natural substrate of the region has been fragmented [
42], and it is hard to keep a high level of ecological stability. Therefore, the ecological resilience changes are relatively stable, and there is a large elasticity space for enhancement in the long run (see
Figure 2). Core cities have a “siphon effect”, that is, when an area is closer to the core city, its ecological resilience level shows a weakening trend [
43], which is not beneficial to the optimization of the overall environment. Among them, Sichuan, as the province with the most prominent ecological resilience in the upstream region, has rich natural resources and advanced technology, and the government pays high attention to the construction of ecological civilization, issuing the “Implementation Plan for Strengthening the Prevention and Control of Pollution in Chemical Industry Along the Yangtze River Economic Belt in Sichuan Province”, etc., and vigorously promoting green and low-carbon development of the national major strategies. In contrast, Shanghai, as a typical city with a high population and economic density, has serious shortcomings and deficiencies in terms of natural endowment and natural environmental pressure. The utilization efficiency of the resources struggles to meet the demand for natural capital [
44], and the level of ecological resilience is relatively poor.
- (3)
From the perspective of overall convergence, since 2009, the concept of “ecological priority and green development” has gradually become the consensus of the provinces and municipalities in the study area, the gap in the level of ecological resilience among provinces and municipalities in the Yangtze River Economic Belt has been narrowing continuously, and the issue of ecological civilization construction has received special attention. The effectiveness of ecological governance is significant, laying the foundation for the green and sustainable development of the economic belt by practicing the concepts of respecting, conforming to, and protecting nature. In the prevention and treatment of water pollution, the water quality of assessment sections is regularly sorted out and statistically assessed, and the control of industrial pollution and agricultural surface pollution is strengthened; in the prevention and treatment of air pollution, source control, end-to-end treatment, monitoring and management, and prevention and control are jointly promoted; in the prevention and treatment of soil pollution, the soil pollution prevention and control project database is dynamically updated and financial investment is increased. Downstream of the Yangtze River Delta, the synergistic linkage between the middle reaches of the Yangtze River City Cluster and the upper reaches of the Chengdu-Chongqing region of the Twin Cities Economic Circle and high-quality ecological civilization leads to high-quality resilient development. The construction of Building a Beautiful China and ecological corridors has achieved remarkable results, providing environmental support for economic development.
4.2. Benchmark Regression of Green Finance on Ecological Resilience
Since the samples of this paper are long panel data with a time dimension greater than the cross-section dimension, the choice of regression model should be determined first before regression analysis, including three models: the fixed-effect (FE) model, the random-effect (RE) model, and mixed OLS. First of all, the basic assumption of the mixed OLS regression is that there is no individual effect, and the
p-value is 0.000 from the F-test, which rejects the null hypothesis that there is an individual effect, so the fixed-effect model is significantly better than the mixed OLS. Furthermore, the
p-value is 0.000 from the Hausman test result, which indicates that it is more suitable to choose the fixed-effect model for measurement. The results are shown in
Table 4.
Therefore, this paper will conduct regression through the fixed-effect model to test the green financial impact on the Yangtze River economic belt regarding ecological resilience level. In
Table 5, Model 1, Model 2, Model 3, and Model 4 examine the impact on ecological resilience from the perspectives of green credit, green bonds, green investment, and green insurance, respectively, while Model 5 considers the combined effect of these four factors on ecological resilience.
As shown in
Table 5, green credit plays a significant negative role in ecological resilience (see Model 1). At present, China’s green financial market is underdeveloped, capital constraints and strict credit approval conditions limit the green and low-carbon transformation of highly polluting enterprises, and minor enterprises are in a disadvantaged position in the absorption of green financial resources, making it difficult to provide a strong impetus for green innovation. Furthermore, the green industry struggles to bring considerable economic benefits to the main body of investment and issuance [
45], so there is still room for development in the breadth and depth of green credit. Green bonds play a significant negative role in ecological resilience (see Model 2). They have the characteristics of a long period of effectiveness and a slow withdrawal of funds, and the premium risk of green securities increases in the case of regulatory misalignment in financial institutions. Market information disclosure is relatively short in terms of comparability, comprehensiveness, and credibility [
46], leading to the phenomenon of “greenwashing”. There is an imbalanced input–output ratio in the issuance of securities by the government for green public utilities and public welfare, resulting in low overall incentive levels for enterprises, and non-green industries have crowded out a large number of financial securities resources, which will hinder the sustainable development of the Yangtze River Economic Belt.
Green investment plays a significant negative role in ecological resilience (see Model 3). On the basis of the environmental Kuznets curve, the relationship between economic growth and pollution of the environment shows an inverted U-shaped relationship, that is, with economic development, the ecological environment may be damaged. Currently, the main direction of green investment in China is industrial pollution control, and while the proportion of investment in industrial pollution control is less than 10%, the maturity of the green industry is low and the implementation of green policies fails to meet expectations, resulting in funding gaps. Especially in minor enterprises, green investment triggered by the friction of the capital market increases the external cost of capital [
47], and it is difficult to promote the efficiency of resource utilization. Providing optimization schemes for Carbon Asset Management Investment to enterprises with green technology innovation needs will be conducive to the generation and popularization of environmental returns. Green insurance plays a significant positive role in ecological resilience (see Model 4). Starting with environmental pollution liability insurance, green insurance provides effective protection for industries such as climate governance and green energy and mandates the participation of high-pollution industries, which is widely used in environmental governance and risk control around the world. By using the income protection function and financial advantages of insurance to establish a green image that meets the environmental expectations of stakeholders, it continues to deepen the eco-social benefits of “green” and helps to realize the strategy of revitalizing the countryside and the goal of “double carbon”.
As can be seen from the regression results of Model 5, in terms of control variables, the level of opening up to the outside world plays a significant negative role in ecological resilience. At present, the river basin mainly absorbs foreign direct investment from countries or regions with relatively low investment technology levels and a high pollution degree, resulting in prominent problems such as ecological and environmental pollution and excessive consumption of resources. The level of technological innovation plays a significant positive role in ecological resilience. Green technology is one of the important driving forces to promote green development, which can reduce the cost and price of green production and green consumption [
48] and guarantee the transformation of green achievements of scientific and technological innovation inputs in key areas and key links. Ecological governance is increasingly moving towards detailing, dynamization, and intelligence, which will fully grasp the economic and environmental benefits. The level of water resources has a significant negative effect on ecological resilience. The control boundaries of production and domestic and ecological water development are not clear and the water structure needs to be optimized. Domestic water consumption is on the rise and ecological water projects are seriously ignored, which is not conducive to improving the level of ecological resilience. At the same time, two control variables, namely environmental regulation and population agglomeration, did not pass the significance test, indicating that they did not play an important role in the mechanism of green finance on ecological resilience.
4.3. Estimation of the Impact of Green Finance on Ecological Resilience
As shown in
Table 6, in terms of the resistance dimension of ecological resilience, green credit and green bonds play a significant positive role in ecological resilience, and both can force enterprises with high pollution and energy consumption to transform into green production on their own [
49], integrate environmental protection-related indexes into the project audit and evaluation system, and prudently control environmental risks. At the same time, drawing on the advanced foreign green experience and introducing foreign investment into green projects, actively exploring and innovating in the fields of reducing industrial consumption, and improving the efficiency of pollution emissions exerts a positive influence on resisting environmental regulation, leading from point to point, linking up and down, rallying consensus, and systematically empowering the high-quality development of cities and the construction of an ecological civilization.
In terms of the adaptability dimension of ecological resilience, green credit and green investment play a significant negative role in ecological resilience. The green credit evaluation system still needs to be upgraded, the existing policy for the green transformation of traditional industrial enterprises is not enough to focus on the credit support and investment volume of traditional industrial enterprises in green transformation, and the high cost of financing has increased the debt burden of the enterprise. The ability to dissolve the outdated production capacity and green innovation is limited, and the efficiency of resource utilization is low. In addition, local administrative barriers and vertical management systems around the world are not conducive to the overall allocation of green credit funds, increasing the overall cost of pollution control and thus aggravating the investment crowding-out situation, and it is difficult to resist external shocks and ensure a high tone of ecological resilience under the dislocation of financial development.
In terms of the resilience dimension of ecological resilience, green bonds play a significant negative role in ecological resilience. Social capital has not been able to make contributions in the field of ecological compensation. In the procedure of developing green finance, banks lack cooperation and coordination among other financial institutions such as securities, insurance, and trusts. There is a certain conflict between the pursuit of commercial interests and the fulfillment of social responsibilities, and the public’s participation in the public is weak, so it is still necessary to exert the policy orientation to build a green development background. Also, green insurance has a significant positive effect on ecological resilience. In the process of developing green finance, the cooperation and coordination of financial institutions such as securities, insurance, banks, and trusts should be realized, the pursuit of commercial interests and the fulfillment of social responsibilities should be unified, efforts should be made from the product, service, investment, and operation perspectives, from initial environmental liability insurance to new energy vehicle insurance, carbon sink insurance, and ESG insurance. Green insurance has played a more important role in the field of ecological environment construction.
5. Robustness and Heterogeneity Test
5.1. Robustness Test
In order to further verify the reliability of the empirical results, this paper will test them by lagging one period, shortening the sample time window, and excluding municipalities in the study area. (1) Lag one period: there may be a time lag in the impact of green finance on the level of ecological resilience of cities, so this paper examines this model regression with a lag one period to judge the long-term effect of green finance development. As can be seen from the regression results (
Table 7, column (1)), the core explanatory variables’ coefficients and significance have not undergone significant changes, indicating that the model regression results are robust. (2) Shorten the time window: since The 18th National Congress of the Communist Party of China in 2012, China has included ecological progress in the overall “five-in-one” socialist cause with Chinese characteristics, vigorously developed green finance, promoted the work of carbon peaking and carbon neutrality to achieve remarkable results, and successively issued the “Guidelines for Green Credit”, “Guiding Opinions on the Construction of a Green Guidelines for Green Credit”, “Guiding Opinions on Building a Green Financial System”, “Overall Program for the Reform of the Ecological Civilization System”, and other policies to deepen green finance, which attaches great importance to green development. China has become one of the first countries in the world to build a comparatively complete green financial policy system. As can be seen from the regression results (
Table 7, column (2)), the significant increase in the level of core explanatory variables indicates that the development of green finance promotes the increase in the level of ecological resilience, and the model regression results are robust. (3) Excluding the sample of municipalities: Chongqing and Shanghai have special administrative status as municipalities, and both of them differ greatly from other provinces in this study area in terms of the level of green finance, economic development, and ecological civilization construction. So as to ensure the reasonableness of the city samples, this paper chooses to exclude the municipality samples and retains only the remaining nine provinces to re-examine the regression results as shown in
Table 7, column (3). The coefficients and significance of the core explanatory variables did not change greatly, and the conclusions obtained from the regression results were robust.
5.2. Heterogeneity Test
The provinces and cities in the Yangtze River Economic Belt differ greatly in geographic location, policy support, economic development, industrial structure, etc., and the degree of influence and mechanisms of green financial development on regional ecological resilience are different. Here, this study area is divided into the following three regions: upstream, midstream, and downstream to conduct the regression analysis again (see
Table 8). Green credit has no significant effect on ecological resilience in upstream and midstream regions but has a significant positive effect in downstream regions. The issuance of green financial bonds in China has always been limited by the different development levels of the region and the ability to undertake green credit projects. The downstream region is located in the eastern coastal area, with superior natural conditions and rapid regional economic development, and green credit strongly promotes the transformation of industrial structure and assumes the responsibility of green pollution management. The gradual development of high-tech industries in the upstream region provides financial and technical support, plays a radiation-driven role, stimulates the vitality of the green industry, and achieves sustainable development with the concept of “two mountains”. The inhibitory effect of green bonds for the middle reaches of this study area is stronger than that of the upstream and downstream areas, mainly because the middle reaches of the resource-based industries are concentrated and homogenized to a high degree, and it is difficult to bring the promotional role of green securities for ecological resilience fully into play due to the insufficiency of soft power and hard power. Due to the long-term ecological and economic development of the double pressure, the upstream areas of high-quality financing bodies are insufficient and have relatively limited development momentum, resulting in a large gap in the total amount of green investment and utilization efficiency compared with the downstream areas, and the market demand and the financial industry’s own green transformation drive is weak [
50]. Green insurance has a significant positive impact on the downstream area. The eco-green environmental relief liability insurance launched in 2023 is an important exploration of the eco-green integrated development of the Yangtze River Delta and an important breakthrough in the new model of green finance. However, the middle and upper reaches of the Yangtze River started late, and the overall volume is small, which has no significant impact on the ecological resilience level of the region.
6. Conclusions
In order to enhance the ecological risk-coping ability of the Yangtze River Economic Belt and empower high-quality development and ecological civilization construction, this paper introduces the concept of resilience into the field of regional ecological construction, constructs an ecological resilience evaluation system of the Yangtze River Economic Belt from three dimensions of “resistance-adaptability-resilience”, and measures the ecological resilience of this study area with principal component analysis. On this basis, the study fully considers different aspects of green finance, such as green credit, green bonds, green investment, and green insurance, to explore the dynamic changes in the ecological resilience of the Yangtze River Economic Belt. The results of the study show that (1) within the term of the study, the ecological resilience level of the Yangtze River Economic Belt generally shows a fluctuating upward trend, with slight oscillations across a few years, and the great ecological protection has achieved remarkable results. In terms of spatial differences, the ecological toughness of the downstream provinces and cities of this study area is better, and the ecological toughness of the upstream provinces and cities and the middle reaches of the Yangtze River Economic Belt is worse, but the differences in the ecological toughness of the Yangtze River Economic Belt provinces and cities show a constant state of convergence. (2) Green insurance has a significant positive effect on ecological resilience, but green credit, green securities, and green investment have a significant negative effect on ecological resilience, which verifies the hypotheses proposed in this paper that the development of green finance can improve the level of ecological resilience of the Yangtze River Economic Belt, and there is a lot of room for development. (3) The empirical results of various dimensions of ecological resilience show that green credit and green securities have a significant positive effect on the resistance to ecological resilience, green credit and green investment inhibit the adaptability of ecological resilience, and green insurance significantly improves the resilience of ecological resilience. (4) These conclusions are still valid after robustness tests such as one-stage delay, shortening the time window, and eliminating municipalities, while the heterogeneity test shows that green credit and green insurance have a positive effect in the downstream provinces and cities, green securities have a strong inhibitory effect in the middle provinces and cities, and green investment has a negative effect in the upstream provinces and cities.
Based on the previous analysis and relevant conclusions, this article makes the following recommendations: (1) It is necessary to regulate the green credit business of commercial banks and expand the main participants of green credit, innovate guarantee methods according to the characteristics of green projects, dissolve the backward production capacity of high-pollution and high-energy-consumption industries, rationally allocate social resources, and take the road of green transformation to empower ecological construction. (2) Furthermore, we must continue to strengthen information disclosure and environmental supervision to consolidate the foundation of risk management and control, improve the green credit evaluation system, enhance the eco-efficiency driving force of green securities with market incentives and policy incentives, and organically integrate the policy objectives of green development into financial instruments. (3) The green industrial chain should be taken as an entry point to expand green investment channels, pry diversified social capital, promote technological innovation to break the locking effect at the low end of the value chain, establish a trans-regional green financial trading market to stimulate the vitality of the green industry, and utilize the international cooperation mechanism to absorb international funds in green projects. (4) We must also guide the scientific pricing of green insurance, safeguard environmental governance and resource conservation from the perspective of green consumption demand, establish a good green image to deepen the social and ecological benefits of enterprises, and grow a team of composite talents to lead the way and ensure the concept of green insurance is deeply rooted in the hearts of the people. (5) The government should grasp the opportunity of green financial development, optimize the industrial structure and spatial layout according to its own resource endowment and location advantages, and expand the depth and breadth of the integration of green finance and ecological environmental protection in the upper, middle, and lower reaches of the Yangtze River Economic Belt. (6) They must also strengthen top-level design, implement industrial, financial, and ecological policies, solve the problems of “destocking” and “capacity reduction” in China’s supply-side structural reform, and organically combine the top-down green financial development strategy with the horizontal ecological civilization construction goals.
This article uses principal component analysis to measure the level of ecological resilience in the Yangtze River Economic Belt and establishes a fixed-effect model to examine whether the development of green finance in four dimensions—green credit, green securities, green investment, and green insurance—can improve the level of ecological resilience. Due to limitations in our own knowledge level and research data acquisition, this study has certain shortcomings. Firstly, when constructing an ecological resilience indicator system, human production and life activities were mainly included in the evaluation system, failing to take into account natural factors such as terrain, climate, hydrology, vegetation, and biodiversity. In the future, we will build a more comprehensive and universal ecological resilience indicator system, fully considering the interaction between human activities and the natural environment. Secondly, considering the availability and timeliness of data, the research period of this article is from 2009 to 2021, and macro-level data were used for analysis. In the future, we will update the existing data and conduct in-depth research on the mechanism of the coordinated development of green finance and ecological resilience at the micro level on regional high-quality development.
Author Contributions
Conceptualization, X.L.; methodology, X.D.; software, L.Z.; validation, L.Z. and X.D.; formal analysis, L.Z.; investigation, J.Z.; resources, J.Z. and L.Z.; data curation, X.L.; writing—original draft preparation, L.Z. and X.D.; writing—review and editing, J.Z.; visualization, L.Z. and X.L.; supervision, X.D.; project administration, X.D.; funding acquisition, X.D. All authors have read and agreed to the published version of the manuscript.
Funding
This research was funded by the National Natural Science Foundation of China (72204099), the Humanities and Social Sciences Foundation of the Ministry of Education (21YJC790021), and the Jiangsu Province University Philosophy and Social Sciences Excellent Innovation Team Building Project (SJSZ2020-20).
Institutional Review Board Statement
Not applicable.
Informed Consent Statement
Not applicable.
Data Availability Statement
The relevant variables are sourced from the National Bureau of Statistics of China, the China Environmental Statistics Yearbook, the China Energy Statistics Yearbook, and statistical yearbooks and statistical bulletins of various provinces and cities.
Conflicts of Interest
The authors declare no conflict of interest.
References
- He, L.; Chen, J.C.; Cheng, C.G.; Yuan, J.W. Assessment and Spatiotemporal Analysis of Flood Vulnerability in the Yangtze River Economic Belt. Water Resour. Hydropower Eng. 2023, 1–16. Available online: https://link.cnki.net/urlid/10.1746.TV.20231117.1700.004 (accessed on 23 September 2023).
- The Study Group of Development Research Institute of Southwestern University of Finance & Economics, Research Center for Environment and Economic Policy of the MEP. Green Finance and Sustainable Development. Financ. Forum 2015, 20, 30–40. [Google Scholar]
- Holling, C.S. Resilience and stability of ecological systems. Annu. Rev. Ecol. Syst. 1973, 4, 1–23. [Google Scholar] [CrossRef]
- Huang, C.; Zhou, Z.; Peng, C.; Teng, M.; Wang, P. How is biodiversity changing in response to ecological restoration in terrestrial ecosystems? A meta-analysis in China. Sci. Total Environ. 2019, 650, 1–9. [Google Scholar] [CrossRef] [PubMed]
- Fuller, I.C.; Gilvear, D.J.; Thoms, M.C.; Death, R.G. Framing resilience for river geomorphology: Reinventing the wheel? River Res. Appl. 2019, 35, 91–106. [Google Scholar] [CrossRef]
- Yin, J.; Wang, D.; Li, H. Spatial optimization of rural settlements in ecologically fragile regions: Insights from a social-ecological system. Habitat Int. 2023, 138, 102854. [Google Scholar] [CrossRef]
- Zhang, Z.Q.; Yao, M.Q.; Zhang, X.H. Research on the Impact of Pilot Cities for Water Ecological Civilization Construction on Water Ecological Resilience. Urban Probl. 2023, 10, 45–53. [Google Scholar] [CrossRef]
- Wang, T.Y.; Wang, P.; Wu, Z.N.; Yin, J.; Yu, J.J.; Wang, H.L.; Yu, Z.L.; Xu, H.S.; Yin, L.H.; Yan, D.H. Progress in the study of ecological resilience of vegetation under drought stress. Adv. Earth Sci. 2023, 38, 790–801. [Google Scholar] [CrossRef]
- Mori, A.S. Resilience in the Studies of Biodiversity-Ecosystem Functioning. Trends Ecol. Evol. 2016, 31, 87–89. [Google Scholar] [CrossRef]
- Martin, R. Regional economic resilience, hysteresis and recessionary shocks. J. Econ. Geogr. 2012, 12, 1–32. [Google Scholar] [CrossRef]
- Wang, X. Level Measurement and Integration Development of Rural Ecological Resilience Governance. Stat. Decis. 2023, 39, 45–50. [Google Scholar] [CrossRef]
- Wang, L.; Yuan, M.; Li, H.; Chen, X. Exploring the coupling coordination of urban ecological resilience and new-type urbanization: The case of China’s Chengdu–Chongqing Economic Circle. Environ. Technol. Innov. 2023, 32, 103372. [Google Scholar] [CrossRef]
- Shi, C.; Zhu, X.; Wu, H.; Li, Z. Assessment of Urban Ecological Resilience and Its Influencing Factors: A Case Study of the Beijing-Tianjin-Hebei Urban Agglomeration of China. Land 2022, 11, 921. [Google Scholar] [CrossRef]
- Baho, D.L.; Allen, C.R.; Garmestani, A.S.; Fried-Petersen, H.; Renes, S.E.; Gunderson, L.; Angeler, D.G. A quantitative framework for assessing ecological resilience. Ecol. Soc. 2017, 22, 17. [Google Scholar] [CrossRef] [PubMed]
- Wang, S.J.; Cui, Z.T.; Lin, J.J.; Xie, J.Y.; Su, K. Coupling relationship between urbanization and ecological resilience in the Pearl River Delta. Acta Geogr. Sin. 2021, 76, 973–991. [Google Scholar] [CrossRef]
- Li, Z.L. Coupling of Digital Economy and Ecological Efficiency in Urban Agglomerations in Middle Reaches of the Yangtze River. Henan Sci. 2023, 41, 1542–1553. [Google Scholar]
- Tao, J.Y.; Dong, P.; Lu, Y.Q. Spatial-temporal Analysis and Influencing Factors of Ecological Resilience in Yangtze River Delta. Resour. Environ. Yangtze Basin 2022, 31, 1975–1987. [Google Scholar]
- Rodriguez-Izquierdo, E.; Cid, A.; Garcia-Meneses, P.M.; Peña-Sanabria, K.A.; Lerner, A.M.; Matus-Kramer, A.; Escalante, A.E. From resilience attributes to city resilience. Landsc. Urban Plan. 2022, 226, 104485. [Google Scholar] [CrossRef]
- Seidl, R.; Spies, T.A.; Peterson, D.L.; Stephens, S.L.; Hicke, J.A. Searching for resilience: Addressing the impacts of changing disturbance regimes on forest ecosystem services. J. Appl. Ecol. 2016, 53, 120–129. [Google Scholar] [CrossRef]
- Zhang, M.D.; Ren, Y.T.; Zhou, L. Spatiotemporal evolution characteristics and influencing factors of urban ecological resilience in the Yellow River Basin. Arid Land Geogr. 2023, 1–12. Available online: http://kns.cnki.net/kcms/detail/65.1103.X.20231020.1808.002 (accessed on 23 October 2023).
- Zhao, R.; Fang, C.; Liu, J.; Zhang, L. The evaluation and obstacle analysis of urban resilience from the multidimensional perspective in Chinese cities. Sustain. Cities Soc. 2022, 86, 104160. [Google Scholar] [CrossRef]
- Cheng, L.; Huang, L.X.; Yan, Y.C.; Wen, C.H. Research on the Measurement and Influencing Factors of Rural Ecologial Resilience in the Yangtze River Economy BELT. Chin. J. Agric. Resour. Reg. Plan. 2023, 1–14. Available online: https://link.cnki.net/urlid/11.3513.S.20230922.1328.004 (accessed on 20 November 2023).
- Hunjra, A.I.; Hassan, M.K.; Ben Zaied, Y.; Managi, S. Nexus between green finance, environmental degradation, and sustainable development: Evidence from developing countries. Resour. Policy 2023, 81, 103371. [Google Scholar] [CrossRef]
- Chen, S.; Wang, F.; Haroon, M. The impact of green economic recovery on economic growth and ecological footprint: A case study in developing countries of Asia. Resour. Policy 2023, 85, 103955. [Google Scholar] [CrossRef]
- Liang, X.; Liu, C.; Li, Z. Measurement of scenic spots sustainable capacity based on PCA-entropy TOPSIS: A case study from 30 provinces, China. Int. J. Environ. Res. Public Health 2018, 15, 10. [Google Scholar] [CrossRef] [PubMed]
- Liu, Y.; Han, L.; Pei, Z.; Jiang, Y. Evolution of the coupling coordination between the marine economy and urban resilience of major coastal cities in China. Mar. Policy 2023, 148, 105456. [Google Scholar] [CrossRef]
- Guo, L.; Tang, L.; Cheng, X.; Li, H. Exploring the role of fintech development in reducing firm pollution discharges: Evidence from Chinese industrial firms. J. Clean. Prod. 2023, 425, 138833. [Google Scholar] [CrossRef]
- Tang, Y.; Liu, M.; Zhang, B. Can public-private partnerships (PPPs) improve the environmental performance of urban sewage treatment? J. Environ. Manag. 2021, 291, 112660. [Google Scholar] [CrossRef] [PubMed]
- Shen, J.; Li, Y.; Xia, C.H.; Li, R. Study on the Measure and Spatial Evolution of Urban Ecological Resilience in Yunnan. China Resour. Compr. Util. 2021, 39, 55–58. [Google Scholar] [CrossRef]
- Fu, J.; Fu, H.; Zhu, C.; Sun, Y.; Cao, H. Assessing the health risk impacts of urban green spaces on air pollution—Evidence from 31 China’s provinces. Ecol. Indic. 2024, 159, 111725. [Google Scholar] [CrossRef]
- Lv, T.; Hu, H.; Zhang, X.; Xie, H.; Wang, L.; Fu, S. Spatial spillover effects of urbanization on carbon emissions in the Yangtze River Delta urban agglomeration, China. Environ. Sci. Pollut. Res. 2022, 29, 33920–33934. [Google Scholar] [CrossRef]
- Lee, C.-C. How does green finance affect green total factor productivity? Evidence from China. Energy Econ. 2022, 107, 105863. [Google Scholar] [CrossRef]
- Chen, Y.H.; Guan, Y.Q. The impact of green finance on air pollution. Financ. Econ. 2023, 5, 27–35+45. [Google Scholar] [CrossRef]
- Sun, L.; Wang, Z.; Yang, L. Efficiency and Influencing Factors of Energy Conservation and Emission Reduction in High-Energy-Consuming Industries Driven by Technological Innovation. Pol. J. Environ. Stud. 2023, 32, 3769–3785. [Google Scholar] [CrossRef]
- Wang, Y.; Zhi, Q. The role of green finance in environmental protection: Two aspects of market mechanism and policies. Energy Procedia 2016, 104, 311–316. [Google Scholar] [CrossRef]
- Fan, W.; Yan, L.; Chen, B.; Ding, W.; Wang, P. Environmental governance effects of local environmental protection expenditure in China. Resour. Policy 2022, 77, 102760. [Google Scholar] [CrossRef] [PubMed]
- Wang, M.; Shi, P.; Ye, T.; Liu, M.; Zhou, M. Agriculture insurance in China: History, experience, and lessons learned. Int. J. Disaster Risk Sci. 2011, 2, 10–22. [Google Scholar] [CrossRef]
- Ghebrihiwet, N.; Motchenkova, E. Relationship between FDI, foreign ownership restrictions, and technology transfer in the resources sector: A derivation approach. Resour. Policy 2017, 52, 320–326. [Google Scholar] [CrossRef]
- Frankel, J.A. The Environment and Globalization; National Bureau of Economic Research: Cambridge, MA, USA, 2003. [Google Scholar]
- Yasmeen, H.; Tan, Q.; Zameer, H.; Tan, J.; Nawaz, K. Exploring the impact of technological innovation, environmental regulations and urbanization on ecological efficiency of China in the context of COP21. J. Environ. Manag. 2020, 274, 111210. [Google Scholar] [CrossRef]
- Pan, Y.; Chen, Y. Spatio-Temporal Evolution Measurement and Obstacle Factors of the Vulnerability of Water-Energy-Food-Ecology Nexus in the Yangtze River Economic Belt. Pol. J. Environ. Stud. 2022, 31, 4789–4805. [Google Scholar] [CrossRef]
- Jahanger, A.; Usman, M.; Murshed, M.; Mahmood, H.; Balsalobre-Lorente, D. The linkages between natural resources, human capital, globalization, economic growth, financial development, and ecological footprint: The moderating role of technological innovations. Resour. Policy 2022, 76, 102569. [Google Scholar] [CrossRef]
- Cai, L.P. The dilemma of Subjective Practice and the Exploration of China’s Experience from the Perspective of Ecological Marxism. J. Xinyang Norm. Univ. (Philos. Soc. Sci. Ed.) 2021, 41, 19–26. [Google Scholar] [CrossRef]
- Jiang, W.X.; Wu, J.; Xu, J.G. Study on the coupling coordination between urban ecological resilience and economic development level—Taking Jiangsu Province as an example. Resour. Dev. Mark. 2023, 39, 299–308. [Google Scholar] [CrossRef]
- Yang, H.; Chen, L.; Huang, H.; Tang, P. Measurement and Spatial-Temporal Evolution Characteristics of Low-Carbon Cities with High-Quality Development: The Case Study of the Yangtze River Economic Belt, China. Sustainability 2022, 14, 9686. [Google Scholar] [CrossRef]
- Liu, Y.; Lu, X.; Sun, H.P.; Chen, B.; Wang, L. Optimization of carbon performance evaluation and its application to strategy decision for investment of green technology innovation. J. Environ. Manag. 2023, 325A, 116593. [Google Scholar] [CrossRef]
- Wen, H.; Lee, C.-C.; Zhou, F. Green credit policy, credit allocation efficiency and upgrade of energy-intensive enterprises. Energy Econ. 2021, 94, 105099. [Google Scholar] [CrossRef]
- Falcone, P.M.; Sica, E. Assessing the opportunities and challenges of green finance in Italy: An analysis of the biomass production sector. Sustainability 2019, 11, 517. [Google Scholar] [CrossRef]
- Li, J.J.; Li, Y.T. The current situation and development of green government bonds in China. Financ. Account. Mon. 2023, 44, 154–160. [Google Scholar] [CrossRef]
- Wang, H.; Wei, W. Coordinating technological progress and environmental regulation in CO2 mitigation: The optimal levels for OECD countries & emerging economies. Energy Econ. 2020, 87, 104510. [Google Scholar] [CrossRef]
| Disclaimer/Publisher’s Note: The statements, opinions and data contained in all publications are solely those of the individual author(s) and contributor(s) and not of MDPI and/or the editor(s). MDPI and/or the editor(s) disclaim responsibility for any injury to people or property resulting from any ideas, methods, instructions or products referred to in the content. |
© 2024 by the authors. Licensee MDPI, Basel, Switzerland. This article is an open access article distributed under the terms and conditions of the Creative Commons Attribution (CC BY) license (https://creativecommons.org/licenses/by/4.0/).


