Article

Greening Service Capacity in Telecom Supply Chain under Environmental Regulation

1
China Telecom Research Institute, Guangzhou 510630, China
2
School of Modern Post (School of Automation), Beijing University of Posts and Telecommunications, Beijing 100876, China
3
School of Economics and Management, Beijing University of Posts and Telecommunications, Beijing 100876, China
4
Department of Electrical and Computer Engineering, University of California, Santa Cruz, CA 95064, USA
*
Author to whom correspondence should be addressed.
Sustainability 2024, 16(7), 2924; https://doi.org/10.3390/su16072924
Submission received: 21 February 2024 / Revised: 23 March 2024 / Accepted: 30 March 2024 / Published: 31 March 2024
(This article belongs to the Special Issue Industry 4.0, Digitization and Opportunities for Sustainability)

Abstract

:
Comprehensive understandings about how to realize service capability greenness in the telecom sector are still rare. In this paper, a non-serial telecom supply chain consisting of an infrastructure supplier, a content provider and a telecom operator is formulated under environmental regulation. The telecom operator aims to find the optimal green procurement ratio between traditional and green equipment. Some common real-life situations are assumed, and the service capacity greenness problems are solved by game theory regarding coordination and interaction among supply chain partners. The results show that the prevailing concern of managers’ “energy saving is not money saving” is the direct reason for a mixed purchase strategy. Further, when diseconomy of purchasing energy-saving equipment reaches a certain threshold, tightening environmental regulation may cause telecom companies to reduce the proportion of energy-saving equipment purchased. Finally, the telecom sector is characterized by its booming service capacity per equipment, which benefits green purchase ratio greatly. When the other six influencing factors are relatively stable, the driving force of telecommunication technology update will push the telecom sector to a greener future.

1. Introduction

Global climate change has become one of the most significant concerns of the international community [1,2]. Many world-leading telecom operators, e.g., British Telecom, Telecom Italy, Korea Telecom, etc., participate in the Carbon Disclosure Project [3]. According to the latest questionnaire and related disclosures, most telecom operators report monitoring their upstream supply chains, green purchases and green operation of their facilities. Telecom operators are typically very large enterprises. To provide ubiquitous and rich services, they purchase nearly all types of ICT facilities. For example, China Mobile’s annual capital expenditures spent on purchasing ICT facilities reached 200 billion RMB in 2015 [4]. They build ICT service capacity and then deliver communication, contents, applications, etc., to their subscribers via networks. Consequently, if major telecom operators in a country are implementing sustainable practices, it indicates that the country’s entire telecom infrastructure is becoming sustainable. The importance of this study just lies in this, which will accelerate the greening progress greatly.
Subscribers of telecom operators search and buy apps or contents through fixed or mobile broadband Internet connections, and accordingly, telecom operators purchase service capabilities from infrastructure suppliers on the basis of their user scale. Thus, the telecom service supply chain is actually made up of a content service supply chain and an infrastructure supply chain. With the advent of the Industry 4.0 era and the development of next-generation mobile communications and mobile networks, the service capabilities of telecom operators are also constantly expanding [5,6]. In the content service supply chain, customer sensitivity to subscription prices is paramount. Content providers, such as news anchors or YouTube commentary hosts, often offer programs for free or at very low membership fees, relying on platform monetary rewards to sustain their livelihoods. Conversely, in the infrastructure supply chain, telecom operators typically offer similar communication service quality due to comparable technologies and coverage. To gain a competitive edge, leading telecom operators often differentiate themselves by embracing green practices, aiming to impress customers and earn goodwill as environmentally conscious service providers. In fact, telecom operators provide some fairly low-carbon ICT solutions, such as remote meeting, e-reading, music or video streaming, online payments, cloud computer, etc. And all kinds of these ICT solutions can be based on a low-carbon concept in marketing promotions. Thus, marketing and strategy departments believe that becoming a green operator will really help them sell more business. In contrast, construction and maintenance departments often hold the view that energy-saving investment usually takes at least 3–5 years to achieve financial balance and face many risks. In fact, it saves electricity but not money.
We put forward four questions: How does a telecom supply chain manage to make its service capacity green? What factors drive improvement of green purchase ratio in a telecom service supply chain? How does the belief “Energy saving is not money saving” affect a telecom operator’s green purchase? Do policies promoting telecom green development always work? Answering these questions is key to realizing the greenness of telecom service supply chains, and it is the main goal of our research.
We contribute by building a telecom supply chain consisting of both a service delivery process and an infrastructure construction process, where customer environmental awareness, government regulation, order allocation of green and non-green facilities are considered. Based on game theory, the relationship between key factors of the telecom industry and greenness of telecom service supply chain is discussed.
The rest of the paper is organized as follows. Section 2 reviews the relevant literature. Section 3 and Section 4 formulate capacity greening decisions and solve equilibriums. Section 5 and Section 6 provide detailed discussions and numerical results. Finally, Section 7 concludes the paper.

2. Review of Relevant Literature

Studies relevant to this work can be categorized into three streams: green supply chain (GSC), order allocation and service capacity management.
GSC has attracted considerable attention over the past two decades. Swami and Shah [7] introduced customer environmental awareness and greening efforts of supply chain partners, and a two-part tariff contract was employed to coordinate the supply chain. Later, Hsueh [8] introduced corporate social responsibility costs and adopted a revenue-sharing contract for coordinating the supply chain. The green level of product was then introduced by Zhang and Liu [9] into a three-echelon supply chain. The coordination was realized with a revenue-sharing contract and the Shapley value method. Zhang et al. [10] studied a hybrid production mode whereby both green and non-green products existed with price competition. A wholesale price contract coordinated the two-item supply chain. In a similar two-item supply chain, two products competed in both price and environmental efforts or quality, and a return contract is applied to realize a Pareto improvement [11,12,13]. Li et al. [14] developed pricing and product-greening strategies and coordinated the dual-channel supply chain with a two-part tariff contract. Some of the literature incorporated environmental regulations into supply chain decisions. Du et al. [15] investigated the optimal production decisions of an emission-dependent supply chain under cap-and-trade regulation, and an interval of the cap was concluded in which supply chain coordination was feasible to obtain more profits. Similar works include: Cao and Yu [16], Raj et al. [17], Taleizadeh et al. [18] and Bai et al. [19]. Further, Wang et al. [20] and Wang and Choi [21] put forward a flexible cap-and-trade mechanism, which set a permitted unitary emission (PUE) level for each unit of products below the average unitary emission level of the industry. In this stream, the competition of green and non-green products is most similar to our model, where customers have environmental awareness and compare their utilities (payments) between green and non-green products to determine each product type’s demands. Supply chain partners may have green efforts and be imposed by environmental regulation. Different from the existing literature, the telecom supply chain is a product service system (PSS). The need for ICT infrastructures comes from the number of subscribers served. The existing literature does not consider the interactions between service value chain and product supply chain, either. Our paper fills this gap in this stream.
Order allocation (OA) is an essential part of purchasing and supply chain management. Recently, the problem of OA began to include such factors as emission cap and trade within an SC. Most of the literature studies on green OA are in fact about green supplier selection, and few independently consider OA alone [22]. The OA problem is a classic multiple-criteria decision-making problem that involves costs, quality, delivery, service and sustainability [23,24]. Most supplier selection and order allocation (SSOA) models concentrate on manufacturing background and use programming methods, such as mixed-integer programming (MIP) or stochastic programming (SP), etc. Other methods include analytic hierarchy process (AHP), similarity to ideal solution (TOPSIS), analytic network process (ANP) and fuzzy multi-criteria decision-making (FMCDM), etc. Few use game models with SC cooperation considered [25]. Theoretically, game theory is a bi-level or multi-level programming with the focus on interactions between partners in the supply chain. Thus, our contribution to this stream is that we discuss an OA problem independently with game theory in a sustainable product service (telecom) SC, which is different from the existing literature.
Most of the existing research on telecom service supply chains is about optimal pricing strategy in a telecom value-added service supply chain [26,27,28], and the studies do not involve service capacity and how to make them green. Similarly, few literature works discuss service capacity optimization. Demirkan et al. studied service capacity decision-making [29], and it is the most similar work to ours, where an application service provider (ASP) purchased equipment from an application infrastructure provider (AIP) and then provided some kind of service like software as a service (SaaS) to customers. Because the service demand was random and followed a uniform distribution, the ASP should decide on its optimal service capacity to maximize profits. On the other hand, because the AIP had a problem of production diseconomy, she also needed to decide on her optimal wholesale price to impact the ASP’s purchase behavior. The authors focused on impacts of power structure and coordination in an application service supply chain. Different from their research, we introduce green and non-green equipment competition, environmental regulation and discuss service greenness. Hasija et al. studied a call center’s outsourcing its capabilities under information asymmetry [30]. Chao et al. employed differential games to study a multi-period dynamic service capacity expanding with capacity deterioration and supply uncertainty [31]. Liu et al. studied service capability procurement decision-making under demand updating and quality guarantees [32]. It can be seen that few literature works discuss service greenness. Wang et al. [33] reviewed comprehensively operational models of service supply chain and claim that sustainability in relation to service supply chain systems have not yet been addressed [34,35]. Khan et al. [36] developed a framework of indicators to measure the extent of greenness in service industries by empirical methods, which indicated that greenness of a service supply chain had six underlying dimensions. It is clear that there are no quantitative models discussing the greenness of a service supply chain, and we fill this gap by building game models and discuss how to improve green purchase ratios in a telecom service chain context.

3. Notations and Assumptions

Figure 1 shows a telecom supply chain including a telecom operator (TO), a content provider (CP) and an infrastructure supplier (IS). The CP provides digital contents to end customers mediated by Internet connections provided by the TO, while the TO purchase service facilities from the IS, which can provide two alternative equipment types, i.e., traditional or energy-saving ones. Customers have environmental concerns, hope to see a sustainable telecom operator, and buy apps or contents then live ICT-based low-carbon lives.

3.1. Notations

(1)
Parameters
β : Energy cost cuts per equipment for using energy-saving type in contrast with the traditional one, β is proportional to e 1 e 2 .
e 1 , e 2 : Carbon emissions per set of traditional equipment and energy-saving peer, respectively ( e 1 e 0 e 2 ).
γ : Maximal number of users that each set of equipment can serve.
d : Purchase price gap between traditional type and energy-saving type.
e 0 : Government-set permitted unitary emission standards for each piece of equipment. Excessive emission results in costs (such as taxes), while less emission earns benefits (such as a subsidy from the government or carbon trade).
p : Revenue (or cost) per unit of reduced (or excessive) emission resulted from a regulation system when new purchased equipment meets (or does not) the emission intensity standard e 0 .
c 1 , c 2 : Manufacturing costs per traditional and energy-saving equipment, respectively ( c 2 c 1 ).
q : Subscriber quantity of the union of TO and its CP.
(2)
Decision variables
λ : Green purchase ratio (GPR) ( 0 λ 1 ), the percentage of energy-saving equipment purchased.
δ : The subscription price of ICT-based contents provided the by union of TO and CP.
w : Wholesale price for each set of energy-saving equipment.

3.2. Basic Assumptions

(1) When the green purchase ratio is zero, ICT-based content demand still exists.
a b δ > 0
(2) “The energy-saving type has more profits” (ESP): advanced green type is more profitable. The supplier begins to produce advanced green type at a higher cost c 2 and also demands a higher profit margin. In contrast, the traditional type is a low-price-quick-turnover one.
d c 2 c 1 > 0
(3) “Energy saving is not money saving” (ESNM): Revenues from the regulation system due to purchasing and using energy-saving equipment usually are limited. And benefiting from an energy cost cut depends on the long-term stable operation of energy-saving equipment, which is subjected to all risks. Dam and Petcova [37] investigated the relationship between shareholder value and firms’ announcement of participating in environmental supply chain sustainable programs (ESCSPs). Results showed that announcing participation in ESCSPs brought a negative stock price reaction. It confirmed an embarrassing fact that a considerable number of shareholders held the view that “energy saving is not money saving”. Thus, ESNM is assumed to reflect the common belief or concern.
c 2 c 1 > e 1 e 2 p + β
The number of subscribers for ICT-based contents is assumed as Equation (4) shows.
q = a b δ + ρ λ , ( 0 λ 1 )
The TO’s green purchase ratio affects the subscriber scale of the union of OT and its CP. Marketing actions of the TO usually show that the TO itself is a green operator and provides low-carbon ICT-based solutions, such as e-reading, remote meeting, etc., which will enable customers to live green lives or run green businesses. Thus, individual or business customers with environmental awareness are more likely to accept these ICT solutions.

4. Model and Analysis

Section 4.1 and Section 4.2 solve the content service chain model and infrastructure supply chain model, independently and separately. Then, Section 4.3 plugs the response function of service chain into the infrastructure chain model, and interactions of the two chains are solved.

4.1. Response Function of the Union of TO and Its CP

The union of TO and its CP decides its pricing policy to maximize its profits. Then, the optimal content service pricing strategy is specified as follows.
m a x δ Π u δ = a + ρ λ b δ δ
δ = a + λ ρ 2 b
δ determines subscriber scale of the content service, which in turn determines appropriate infrastrucure capacity. Section 4.3 shows interaction between the service and infrastructure supply chain.

4.2. Decision of Service Capacity Greening in the Infrastructure Supply Chain

4.2.1. Decentralized Mode

In a decentralized case, chain partners try to maximize their own profits. The decision sequence is as follows: the IP first declares wholesale prices of both equipment types, then the TO responds by declaring the GPR. The profit of the TO is related to service revenues, energy cost cuts, equipment purchase costs and carbon regulation revenues or costs, as Equation (7) shows. Superscript e denotes the infrastructure supply chain. Subscript D and t denote the decentralized case and TO, respectively.
m a x 0 λ 1 Π D t e λ = δ a b δ + ρ λ + λ β a b δ + ρ λ / γ w d ( 1 λ ) + w λ a b δ + ρ λ / γ p e 1 1 λ + e 2 λ e 0 a b δ + ρ λ / γ
When d e 1 e 2 p β > 0 (Assumptions (2) and (3)), Π D t e λ is strictly concave. Therefore, Proposition 1 holds.
Proposition 1. 
There is a piecewise-linear and non-increasing relationship between the optimal green purchase ratio and the energy-saving equipment price, as Equation (8) illustrates.
λ D = 1 A B + ρ e 1 p e 0 p + w δ γ d 2 ρ A 0 , w Θ L Θ L < w < Θ U w Θ U
where Θ L = A B ρ d + e 0 p + e 1 p 2 e 2 p + δ γ + 2 β , Θ U = Θ L + 2 A , A = d e 1 e 2 p β and B = a b δ .
The IS’s profit comes from the sale of two types of equipment as Equation (9) shows. Subscript s denotes the IS.
max w Π D s e w = w d c 1 1 λ a b δ + ρ λ γ + w c 2 λ a b δ + ρ λ γ
Plugging Equation (8) into (9), we can solve the IS problem, and Proposition 2 shows results.
Proposition 2. 
The IS optimal energy-saving equipment price w D and according GPR λ D are as shown in Equations (10) and (11). See Appendix A for the corresponding proof.
w D = A 2 B + ρ d 2 c 1 p e 0 e 2 + ( 2 d + γ δ ) p e 2 e 1 + p 2 e 0 e 1 e 2 e 1 + c 2 d e 1 p + e 0 p + ( c 2 c 1 ) ( γ δ ) + β c 1 + 2 d + e 0 p e 1 p + δ γ C ρ
λ D = a b δ c 1 + c 2 + 2 d 3 e 1 p + 3 e 2 p 3 β + ρ c 1 e 0 p + e 1 p δ γ 2 ρ c 1 c 2 d + 2 e 1 p 2 e 2 p + 2 β
where C = c 1 c 2 d + 2 p e 1 e 2 + 2 β . Please refer to Section 5 for extensive discussions. Finally, the profits of different partners in this supply chain can be calculated. See Appendix A.

4.2.2. Centralized Mode

The total profit of the infrastructure supply chain can be maximized in a centralized mode. And we find that GPR becomes conditionally higher than that in the decentralized mode. Adding right-side terms of equal signs of Equations (7) and (9), Equation (12) shows the profit-maximizing problem of the infrastructure supply chain. Superscript I denotes the centralized mode or the so-called integrated case.
m a x 0 λ 1 Π I e λ = δ a b δ + ρ λ + ( a b δ + ρ λ ) γ λ β ( a b δ + ρ λ ) γ c 1 1 λ + c 2 λ p ( a b δ + ρ λ ) γ e 1 ( 1 λ ) + e 2 λ e 0
When c 2 c 1 ( e 1 e 2 ) p β > 0 (Assumption (3)), function Π I e λ is concave and has a unique maximum value. Because λ is bounded by [ 0,1 ] , we have Propositions 3 and 4.
Proposition 3. 
In the centralized infrastructure sub-chain, the optimal green purchase ratio λ I is illustrated as shown in Equation (13). See Appendix A for the corresponding proof.
λ I = 1 ρ c 1 + e 1 p e 0 p δ γ B c 1 c 2 + e 1 p e 2 p + β 2 ρ c 1 c 2 + e 1 p e 2 p + β 0 , B c 1 c 2 + e 1 p e 2 p + β Ψ U Ψ L < B c 1 c 2 + e 1 p e 2 p + β < Ψ U B c 1 c 2 + e 1 p e 2 p + β Ψ L
where Ψ L = ρ c 1 + e 1 p e 0 p δ γ and Ψ U = Ψ L + 2 ρ c 2 c 1 e 1 p e 2 p β .
Proposition 4. 
δ γ > c 1 + p e 1 e 0 is a sufficient condition for λ I λ D . Further, a centralized infrastructure supply sub-chain is more profitable than a decentralized one, i.e., Π I e > Π D s e + Π D t e . See Appendix A for the corresponding proof.
The condition δ γ > c 1 + p e 1 e 0 means that potential revenues generated from equipment should exceed the sum of its production cost and regulation cost. Clearly, it is easy to be fulfilled in practice. Please refer to Section 5 for other insightful discussions. By plugging Equation (13) into Equation (12), the profit of the infrastructure sub-chain can be calculated from Equation (14):
Π I e = a b δ c 1 c 2 + e 1 p e 2 p + β + ρ c 1 e 0 p + e 1 p δ γ 2 4 ρ c 2 c 1 e 1 p + e 2 p β γ

4.2.3. Coordination Mode within the Infrastructure Supply Chain

Since the GPR and supply chain profit are usually higher in a centralized mode, a composite two-part tariff contract system are designed in this section to coordinate infrastructure SC. Suppose that the IS should sell energy-saving types at a coordinating price w c and thus obtain a lump-sum refund f from the TO as a reward. In fact, this kind of contract is common in the telecom sector. An IS initially bids a very low price to sell equipment to the TO. Accordingly, the IS also obtains a long-lasting service contract for the TO’s equipment maintenance.
The decision problems of the IS and TO are given by Equations (15) and (16), respectively, and subscript C denotes the coordinated case.
max 0 λ c 1 Π C t e λ c = δ a b δ + ρ λ c + a b δ + ρ λ c γ λ c β a b δ + ρ λ c γ w c d ( 1 λ c ) + w c λ c p a b δ + ρ λ c γ e 1 1 λ c + e 2 λ c e 0 f
max w c Π C s e w c = w c d c 1 1 λ c a b δ + ρ λ c γ + w c c 2 λ c a b δ + ρ λ c γ + f
Proposition 5. 
The following set of composite two-part tariff contracts can coordinate the infrastructure supply chain.
w c , f = Θ L , 0 w c , f Θ U , 0 , B c 1 c 2 + e 1 p e 2 p + β Ψ U Ψ L < B c 1 c 2 + e 1 p e 2 p + β < Ψ U B c 1 c 2 + e 1 p e 2 p + β Ψ L
where w c = c 1 + d e 2 p δ γ e 0 p β + c 2 d e 1 p + e 0 p + δ γ c 1 c 2 + e 1 e 2 p + β and constant f F 1 , F 2 . See Appendix A for the corresponding proof and for definitions of F 1 and F 2 .
The set of contracts ensures that the optimal GPR and supply chain profit of the coordinated case are equal to those of the centralized mode. When B c 1 c 2 + e 1 p e 2 p + β Ψ L or B c 1 c 2 + e 1 p e 2 p + β Ψ U , the coordinated and centralized mode have the same GPRs (0 or 1) as the decentralized mode has, and thus three modes are equivalent.

4.3. Integrating the Content Service Supply Chain and Infrastructure Supply Chain

According to the analysis shown above, the optimal decisions of both sub-supply chains are illustrated as Equations (6) and (13). By plugging Equation (6) into Equation (13), the optimal green purchase ratio λ N can be calculated as Equation (18), when 0 < λ N < 1. Subscript N denotes this final integration case.
λ N = a b c 1 c 2 + e 1 p e 2 p + β + γ ρ + b ρ 2 c 1 2 e 0 p + 2 e 1 p ρ 3 b c 1 c 2 + e 1 p e 2 p + β + γ ρ
It is noted that Equation (6) should also be plugged into condition parts of Equation (13) (i.e., B c 1 c 2 + e 1 p e 2 p + β Ψ U , Ψ L < B c 1 c 2 + e 1 p e 2 p + β < Ψ U and B c 1 c 2 + e 1 p e 2 p + β Ψ L ), and the optimal green purchase ratio should be further looked into under these revised conditions. By plugging Equation (6) into two separation points of the three intervals of Equation (13) conditions, that is, let B c 1 c 2 + e 1 p e 2 p + β = Ψ L , it yields λ = G 1 , and let B c 1 c 2 + e 1 p e 2 p + β = Ψ U , it yields λ = G 2 ( G 1 and G 2 are presented in the notes of Table 1).
When the infrastructure supply chain claims different GPRs, the content service chain responds by declaring δ based on Equation (6) accordingly. Due to the coupling interaction of the two supply chains, the curve of the total profit of infrastructure supply chain Π I e will also move horizontally with claimed GPRs changing. Figure 2, Figure 3, Figure 4, Figure 5 and Figure 6 illustrate movements of curve Π I e with respect to varying λ under the interaction of the two supply chains. According to these figures, the optimal GPRs can be speculated, as Table 1 shows in the case of G 2 G 1 > 1 . Similarly, Table 2 can be worked out in the same way when 0 < G 2 G 1 < 1 . This graphical method can derive the solution in our relatively simple case, but it may encounter difficulties in some more complex cases.
Finally, by plugging the values of Table 1 and Table 2 into Equation (6), we obtain δ N . Then, upon plugging δ N into Θ L , Θ U , w c and f of Equation (17), these values are updated to Θ L N , Θ U N , w N and f N , respectively. Thus, the composite two-part tariff contract system illustrated in Equation (17) can also be updated to a more complicated one, as shown in Table 3 and Table 4.

5. Discussion

5.1. Reasons for TOs to Adopt a Mixed Procurement Strategy

Corollary 1. 
(1) Assumptions ESP and ESNM jointly lead to a mixed purchase mode in the decentralized infrastructure supply sub-chain. (2) Assumption ESNM leads to a mixed purchase mode in the integrated infrastructure sub-chain.
From Equations (8) and (13), it is known that Θ U Θ L = 2 d e 1 e 2 p β and Ψ U Ψ L = 2 ρ c 2 c 1 e 1 p e 2 p β . If d e 1 e 2 p β = 0 or c 2 c 1 e 1 p e 2 p β = 0 , the optimal GPR is equal to either 0 or 1. This means that there is no mixed purchasing. Thus, mixed purchase is equivalent to ESP + ESNM (in a decentralized case) or ESNM (in a centralized case). Mixed purchase is in fact popular in the telecom industry [38], and it in turn proves that the belief “energy saving is not money saving” exists.

5.2. Ways to Enhance the Green Purchase Ratio

5.2.1. Enhance the GPR in a Decentralized Infrastructure Sub-Chain

As it is shown from Equation (8), λ D is continuous and piecewise-linear with respect to w . If Θ L or Θ U or both increase, λ D can be increased. Table 5 presents the monotonicity of Θ L and Θ U with respect to d , e 0 , p , ρ , δ , γ and β , respectively.
As is shown in Table 5, it is counterintuitive that a lower e 0 decreases the optimal green purchase ratio. Under the ESNM assumption, direct energy-saving revenues cannot afford the added costs involved in purchasing energy-saving equipment. Thus, the telecom operator may cope with the situation by purchasing cheaper traditional equipment. Thus, regulatory measures considered good to promote sustainable development may have the opposite effect in this case. As for the equipment price gap d , the revenue or cost rate p caused by regulation system, environmental awareness ρ and energy cost cuts β , their positive impacts on λ D are quite intuitive.
γ and δ have changed quickly in the telecom industry for decades. For example, service capacity per equipment γ increased quickly, and it doubled every several years [39]. According to Table 5, a fast-increasing γ is very helpful for improving green purchase ratios. For example, major international telecom operators are somewhat active practitioners of green purchasing. Korean Telecom continuously discloses its annual green purchase ratio, and it has been gradually increasing in recent years [40]. Contrary to γ , the telecom service price δ has dropped sharply in recent years, and the following Corollary 2 outlines how a fast-declining δ impacts the green purchase ratio.
Corollary 2. 
When d + ρ b γ > p e 1 e 2 + β holds, Θ L and Θ U are both monotonically increasing functions of δ . See Appendix A for the corresponding proof.
According to Assumptions (2) and (3), the above inequality is satisfied. This means that a rapidly decreasing telecom service price δ hinders the improvement of λ D . This makes intuitive sense, as shrinking incomes of telecom operators discourage them from investing in expensive energy-saving initiatives.

5.2.2. Enhance GPRs of Centralized and Coordinated Infrastructure Sub-Chains

Based on Equation (13), the monotonicity of λ I with respect to d , e 0 , p , ρ , δ , γ , and β is presented in Table 6.
As is shown in Table 6, a lower e 0 will also decrease the optimal green purchase ratio. Under the ESNM assumption, when the regulation tightens ( e 0 is lower), additional environmental costs are incurred. However, using green equipment other than traditional types incurs even higher production costs. Hence, the green purchase ratio is accordingly lowered to achieve purchase cost savings, resulting in hedging original regulation-related costs.
In contrast to those given in Section 5.2.1, p , δ and β are conditional in this case. Corollaries 3–5 present the conditional monotonicity of λ I with respect to p , δ and β , respectively.
Corollary 3. 
When δ γ > e 1 e 0 e 1 e 2 c 2 β + e 0 e 2 e 1 e 2 c 1 , λ I is a monotonically increasing function with respect to p . See Appendix A for the corresponding proof.
δ γ > e 1 e 0 e 1 e 2 c 2 + e 0 e 2 e 1 e 2 c 1 means that the telecom service revenue per set of equipment must cover the weighted average manufacturing cost. Because this is true for a profitable enterprise, increasing revenue or cost rate p will enhance the GPR of the integrated sub-chain.
Corollary 4. 
When c 2 c 1 + ρ b γ > p e 1 e 2 + β , λ I is a monotonically increasing function of δ . See Appendix A for the corresponding proof.
According to Assumption (3), the above inequality holds. Thus, a rapidly decreasing telecom service price δ lowers the optimal GPR λ I because shrinking business revenues make the operator unwilling to invest in green actions.
Corollary 5. 
When δ γ > c 1 + p e 1 e 0 , λ I is a monotonically increasing function of β . See Appendix A for the corresponding proof.
In Corollary 5, δ γ > c 1 + p e 1 e 0 means that maximal potential revenues generated per set of equipment should exceed the sum of its production and regulation costs, which is easy to hold in practice. Thus, generally speaking, an increasing β will increase the GPR.
Building on the aforementioned discussions, a coordinated infrastructure supply sub-chain operating under the ESNM assumption will also contribute to reducing the GPR when facing tightened regulation. Therefore, during challenging periods for enterprises, particularly when many managers perceive greening actions as economically unfeasible, governments’ hastily implemented and arbitrary measures aimed at promoting sustainable development may inadvertently yield counterproductive outcomes.

5.2.3. Improve the GPR under the Interaction of the Two Sub-Supply Chains

Enhancing GPRs becomes more complex when the two sub-supply chains’ interaction is considered. According to Table 1 and Table 2, when certain relations among G 1 , G 2 , G 2 G 1 , 0 and 1 are satisfied, the GPR is 100%. And when the optimal GPR belongs to (0, 1), Equation (18) leads to Corollary 6.
Corollary 6. 
When c 2 c 1 p e 1 e 2 β < γ ρ 3 b , λ N is a monotonically decreasing function of e 0 . When c 2 c 1 p e 1 e 2 β > γ ρ 3 b , λ N is a monotonically increasing function of e 0 . See Appendix A for the corresponding proof.
This suggests that when green purchasing falls below an economically viable threshold, reducing e 0 will improve the overall GPR, particularly within the context of interactions between the two sub-supply chains. However, when the uneconomical level of green purchasing becomes too high, lowering e 0 will lower GPR. We can call it the policy failure area (PFA). Thus, interaction between sub-supply chains can contribute to control the size of PFA. The threshold is related to both the infrastructure supply chain and the content service supply chain. When each piece of equipment has higher service capacity and telecom subscribers care more about TOs’ green purchase ratios, the size of PFA will be made smaller. But if telecom subscribers care more about service prices, the size of PFA will be larger.

6. Numerical Results

To further verify the proposed models and main findings, numerical examples are given in this section. We present insights into the effects of customer environmental awareness (CEA), equipment service capacity, and environmental regulation on GPR. System parameters are designed, as shown in Table 7, after we explore typical data from China Telecom on initial investment and average energy-saving revenues of its most popular energy-saving techniques [41].
To study how CEA affects optimal GPR, we also set the following parameter values: the government-set e 0 is 3, the service capacity per equipment is 1, the sale price of each energy-saving device is 15 and energy cost cut is β = 0 . According to this configuration and the game theory derivation results of Section 5, the following numerical outputs can be calculated.
Figure 7 shows the effects of CEA on the GPR for both the decentralized and centralized infrastructure supply chains. It can be observed that the GPR gradually increases with an enhancement in CEA. However, compared to the decentralized sub-chain, GPR in the centralized case increases more quickly. Overall, the centralized or coordinated infrastructure supply chain presents much better GPRs than the decentralized supply chain.
To demonstrate the effect of service capacity per equipment (SCE) on GPR, CEA is fixed at 50 with the government-set e 0 and the price of each set of green equipment unchanged. We plot changes in GRP with respect to SCE that varies from 0 to 1.2 in Figure 8. As expected, the GPR increases with an increase in SCE. In contrast with the decentralized sub-chain, the exclusive purchase of green equipment appears much easier in the centralized and coordinated settings.
Figure 9 illustrates how GPR is affected by the government-set e 0 , where γ = 1 , ρ = 50 and w = 15 . Since the “energy saving is not money saving” assumption holds, the more rigid the government-set e 0 is, the lower the procurement share of green equipment will be, regardless of the supply chain structure involved. However, the centralized infrastructure chain always achieves a higher GPR than the decentralized infrastructure.
Finally, we analyze how the infrastructure chain can be coordinated. Given that e 0 = 3 , γ = 1 , δ = 14.25 and ρ = 50 , the optimal GPR of λ I = 0.66 for the centralized infrastructure sub-chain can be calculated. As is shown in Figure 10, the optimal GPR of the coordinated case with a composite two-part tariff contract (CTT) will be equal to λ I when w c reaches roughly 18. This means that the coordination of the sub-chain has been achieved. Thus, we corroborate the effectiveness of the CTT.
The numerical results presented above demonstrate the fluctuations in GPR concerning key parameters, delineate a mixed purchase area, and elucidate the implementation of green coordination within the infrastructure supply chain. In addition, they illustrate how the impact of CEA on GPR adheres to the law of diminishing marginal utility, as depicted in Figure 7. Furthermore, the optimal GPR achieved by the centralized infrastructure supply sub-chain consistently surpasses that of its decentralized counterpart, underscoring the necessity for green coordination.
Finally, impacts of the interaction between two supply chains are verified. In this case, δ is not a constant from Table 7 but a variable determined by Equation (6). Given e 0 = 3 , γ = 1 , and ρ = 50 (other parameters refer to Table 7), G 1 and G 2 can be calculated from Table 1 to be −1.143 and −0.714, respectively. That is, G 1 < G 2 < 0 and 0 < G 2 G 1 < 1 . As shown in Table 2, the optimal GPR is 0, and the content service fee δ reaches 25 (according to Equation (6)). In contrast to numerical results of the coordinated case without the SC interaction, the infrastructure supply chain employs a mixed purchase mode when the content service fee δ is about 14.25 and employs pure purchase of green equipment when δ is 25. It means the GPR is at risk of being overestimated without the consideration of interactions between two supply chains. According to Corollary 6, the uneconomic level of green purchasing (i.e., c 2 c 1 p e 1 e 2 β ) is 3, which falls below the threshold (i.e., γ ρ 3 b = 8.3 ). Thus, the environmental regulation still can promote green purchase effectively in this case.

7. Conclusions and Future Research

This paper puts forward a service capacity greening problem in the telecom sector and introduces green purchase ratio as a decision variable. Content service pricing, green and non-green capacity purchasing, CEA, environmental regulation and coordination are jointly modeled in a non-serial telecom service supply chain. In view of managers’ decision-making habits in adopting energy-saving equipment, we discuss in a special case where “energy saving is not money saving”(ESNM) holds. An environmental regulation over telecom operators is considered. Finally, an infrastructure sub-chain coordination and inter-chain interaction are also considered. Some conclusions can be soundly drawn as follows:
(1)
The assumption “Energy saving equipment makes higher profits” (ESP) and the assumption “Energy saving is not money saving” (ESNM) jointly lead to a mixed purchasing mode (i.e., 0 < GPR < 1) in a decentralized infrastructure supply chain, while adherence solely to ESNM can lead to a mixed purchasing mode in the centralized infrastructure supply chain. The proof process shows that a mixed purchasing strategy is actually equivalent to ESNM or ESP + ESNM, it means any enterprises that have adopted a mixed purchase strategy actually do have concerns of “energy saving is not money saving” to some extent.
(2)
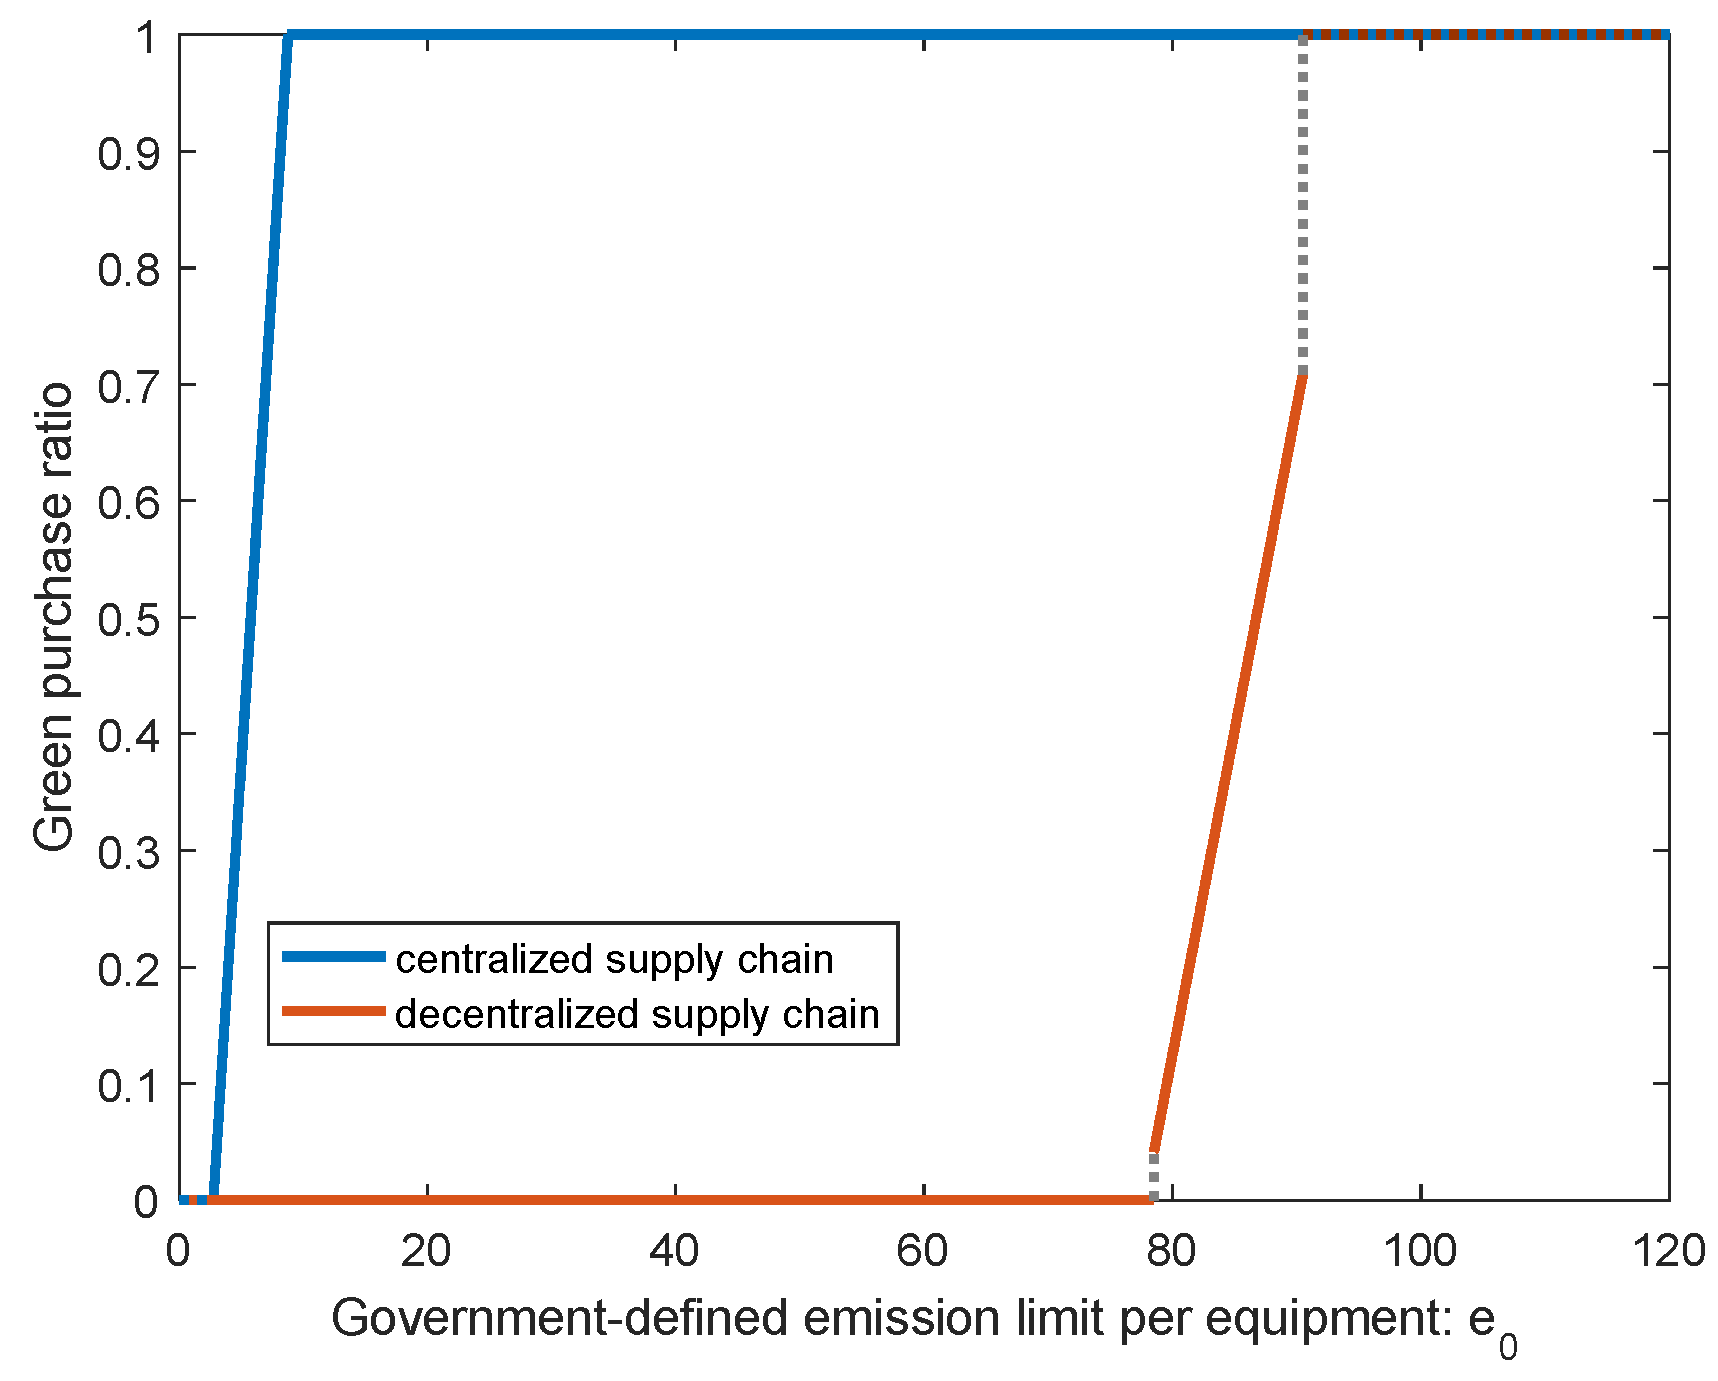
Under a concern of “energy saving is not money saving”, and when the diseconomy of purchasing energy-saving equipment exceeds a certain threshold, the government’s tightening of emission standards will instead lower the green purchase ratio. That is, a conditional policy failure area exists.
(3)
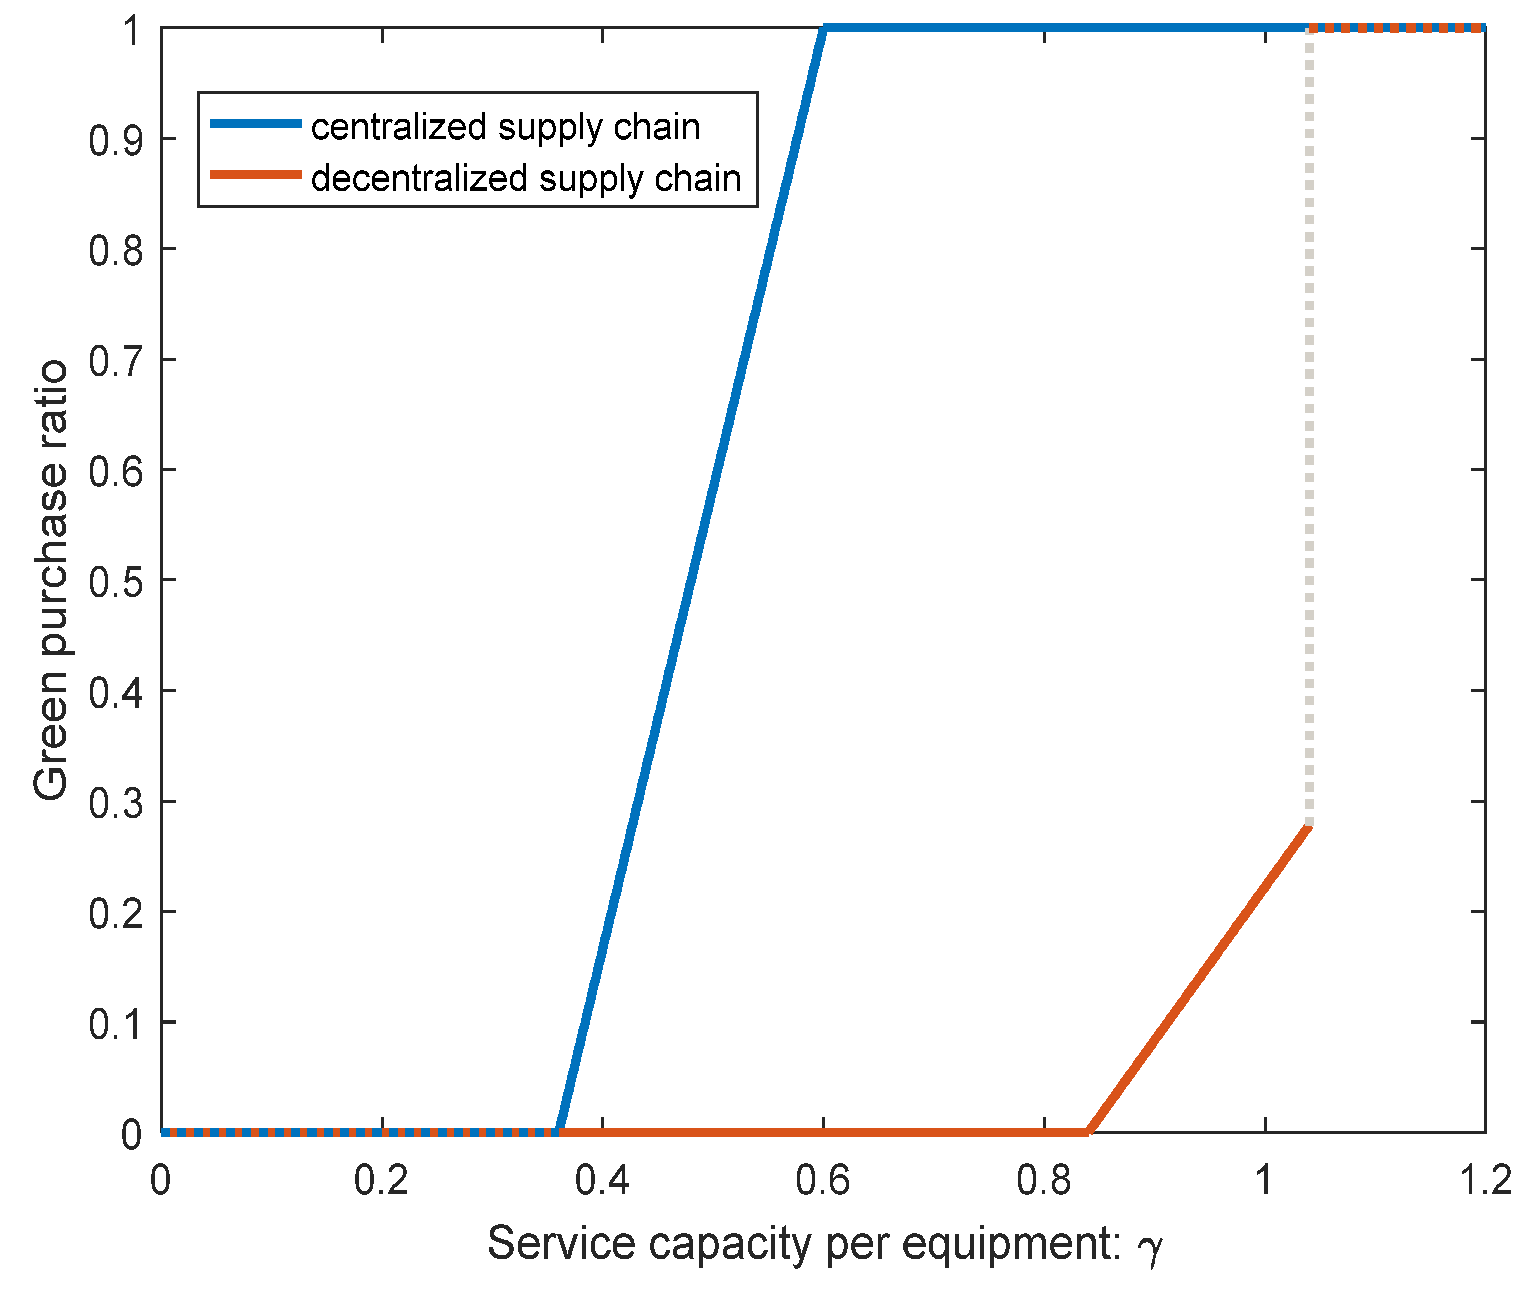
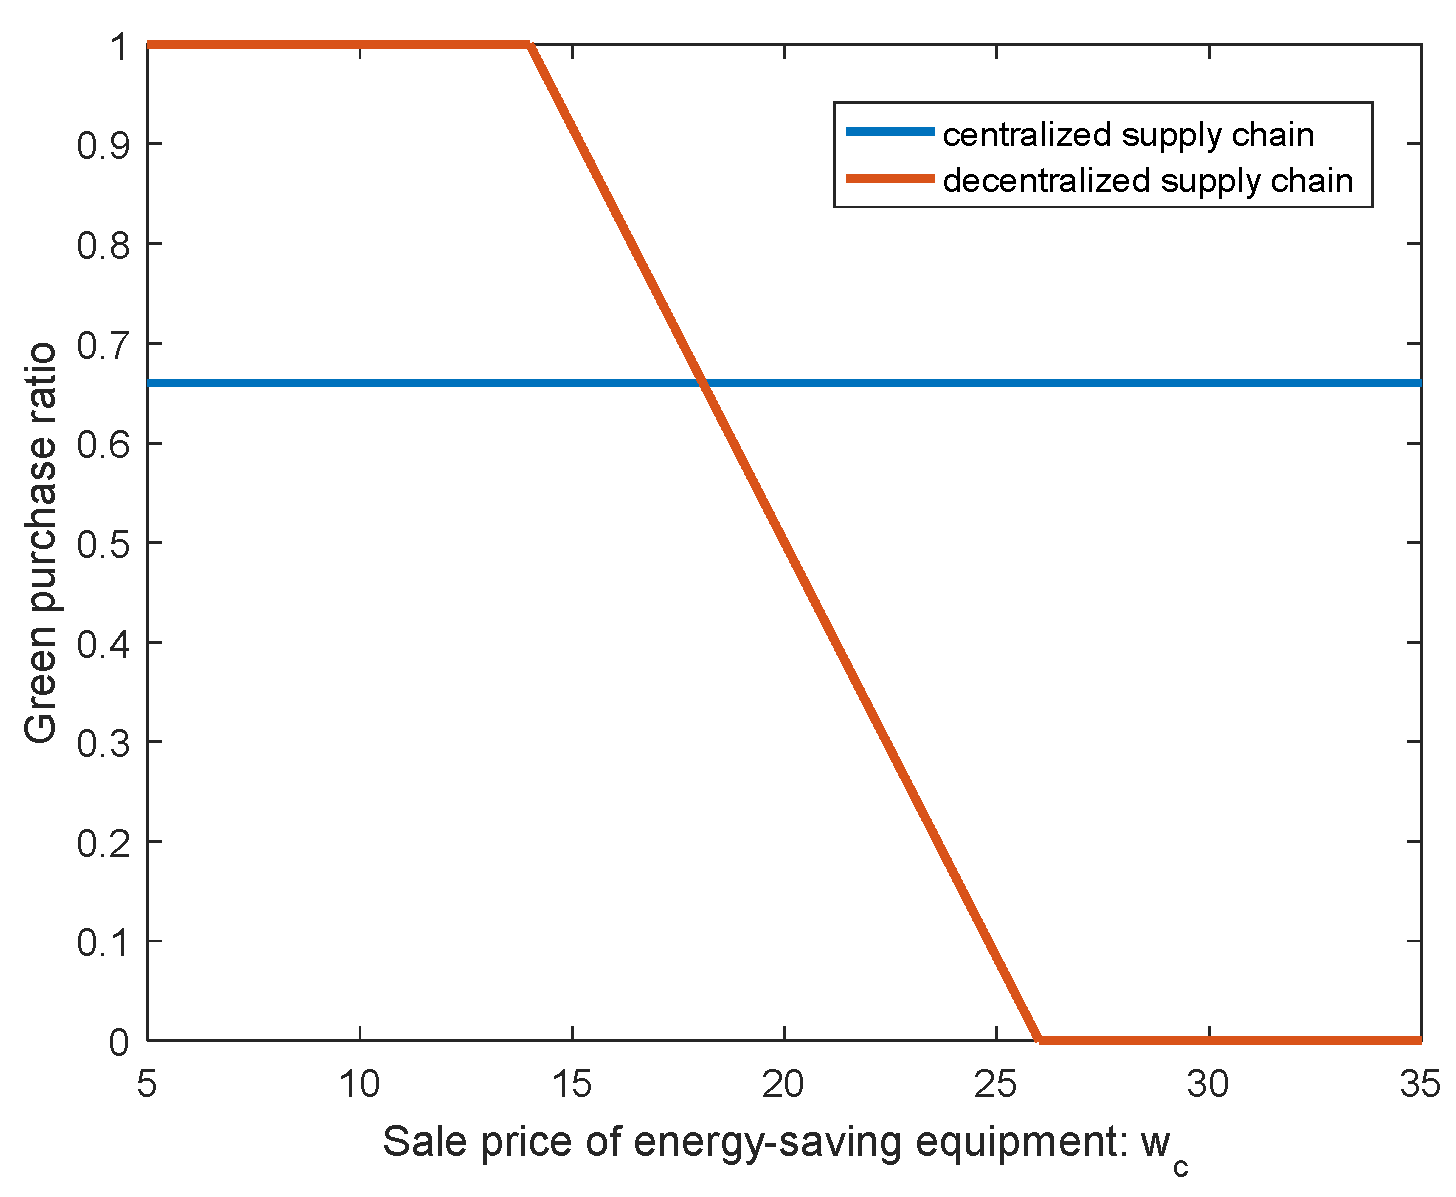
Most of the 7 influencing factors (1. price gap between green and non-green equipment, 2. emission standard per equipment, 3. the revenue or cost caused by the environmental regulation, 4. customer eco-friendly awareness, 5. energy cost cuts of green equipment, 6. service capacity per equipment and 7. telecom service price) have monotonic effects on improving the green purchase ratio, but some may have conditional monotonic effects (i.e., certain thresholds exist), which is related to specific supply chain cooperation patterns. These patterns and thresholds make the greening a scalable process, and groups of scenarios can be further defined.
(4)
The “service capacity per equipment” grew 10–100 times every ten years in the telecom sector, which theoretically means that telecom carriers can set up much less equipment to meet much more service demand and earn more revenues. This situation of booming potential income makes telecom carriers more capable of purchasing more expensive green equipment under the assumption of ESNMS. Thus, the rapid technical upgrade in the telecom sector will improve greenness of telecom service greatly.
When content service prices decrease, further improvement of the GPR is significantly hindered. When telecom subscribers complain about high service fees, they probably do not expect that it will hinder the greening of the telecommunications industry.
Based on the conclusions above, we also present several important management insights. First, since so many companies are adopting a moderate mixed purchasing strategy in practice, it can be inferred that “added purchase costs may outperform carbon reduction returns” is a very common concern. Second, the government should make appropriate use of regulating tools in a telecom service chain, trying to avoid the existence of a policy failure area. For example, in the more practical situation where an interaction between telecom sub-supply chains exists, regulators have to check if the diseconomy degree of purchasing green equipment exceeds the threshold. Finally, with the rapid development of telecommunication technologies and with the gradual stabilization of telecom service prices, the telecom sector will become a green industry in the positive pursuit of green procurements, and this will accelerate the green development of the entire ICT industry in turn.
Several intriguing directions for future research, which build upon our proposed framework, are worth exploring. Firstly, there should be more empirical studies to validate the findings of the theoretical model, using real-world data from the telecom industry. Employing data-driven models could serve to validate and enhance the robustness of our results. Secondly, investigating the existence of contracts aimed at coordinating the entire non-serial telecom supply chain presents another compelling area of study. Thirdly, while we have determined optimal green purchase ratios through the observation of profit curve movements within the infrastructure sub-supply chain, it is worth noting that addressing more complex scenarios may present feasibility challenges in this approach. Fourthly, it is also worth studying the potential impact of different environmental regulations on the greening of service capacity in the telecom sector, considering variations in stringency and enforcement mechanisms. Lastly, there should be more green aspects to be included in the model, such as green efforts, etc.

Author Contributions

Conceptualization, Y.S. and T.Y.; methodology, Y.S. and T.Y.; software, Y.S.; formal analysis, Y.S. and T.Y.; investigation, Y.S. and Y.Z.; writing—original draft preparation, Y.S. and R.M.; writing—review and editing, T.Y. and Y.Z.; supervision, T.Y. and Y.Z. All authors have read and agreed to the published version of the manuscript.

Funding

This research received no external funding.

Institutional Review Board Statement

Not applicable.

Informed Consent Statement

Not applicable.

Data Availability Statement

The data presented in this study are available on request from the corresponding author.

Conflicts of Interest

The authors declare no conflicts of interest.

Appendix A

Proof of Proposition 1. 
 
Based on the assumption that d e 1 e 2 p β > 0 , Π D t e λ (i.e., Equation (7)) is concave and has a unique maximum. Take the first-order derivative of Equation (7), and, in turn, we have Equation (A1):
Π D t e λ = H λ = a b δ d e 1 e 2 p β ρ e 1 p e 0 p + w δ γ d + 2 d λ 2 e 1 p λ + 2 e 2 p λ 2 β λ γ
When w Θ L , H λ = 0 > 0 and H λ = 1 0 hold, which implies that λ D = 1 . When Θ L < w < Θ U = Θ L + d e 1 e 2 p β , we have H λ = 0 > 0 , H λ = 1 < 0 , and thus λ D 0,1 . When we apply Π D t e λ = 0 , we obtain λ D = a b δ d e 1 e 2 p β + ρ e 1 p e 0 p + w δ γ d 2 ρ d e 1 e 2 p β . When w Θ U , H λ = 0 0 and H λ = 1 < 0 hold, λ D = 0 . □
Proof of Proposition 2. 
 
Plug Equation (8) into Equation (9) first.
(1) When w Θ L , Π D s e w is a linear and increasing function with respect to w , w D 1 = Θ L and accordingly λ D 1 = 1 . According to Equation (9), the supplier’s profit is written as follows:
Π D s e | w Θ L = a + ρ b δ a b δ d e 1 p + e 2 p β + ρ c 2 d + e 0 p + e 1 p 2 e 2 p + 2 β + δ γ ρ γ
(2) When Θ L < w < Θ U , the two cubic items in the expression of Π D s e w cancel each other out, which leaves Π D s e w as a concave parabola. Thus, we use the first-order condition to calculate w D and λ D , as Equations (10) and (11) show. By plugging w D and λ D into Equation (9), the supplier’s profit is written as follows:
Π D s | Θ L < w < Θ U = a b δ c 1 c 2 + e 1 p e 2 p + β + c c 1 e 0 p + e 1 p δ γ 2 4 ρ c 1 c 2 d + 2 e 1 p 2 e 2 p + 2 β γ
(3) When w Θ U , no energy-saving equipment is purchased, which means that any adjusting of the energy-saving equipment price w cannot occur in the model. Thus, w remains as Θ U in this sub-case and, accordingly, λ D = 0 . By plugging these values into Equation (9), the supplier’s profit is written as follows:
Π D s e | w Θ U = a b δ a b δ d e 1 p + e 2 p β + ρ c 1 + e 0 p e 1 p + δ γ ρ γ
Then Π D s | Θ L < w < Θ U Π D s | w Θ L = a b δ c 1 c 2 2 d + 3 e 1 p 3 e 2 p + 3 β + c c 1 2 c 2 2 d + e 0 p + 3 e 1 p 4 e 2 p + 4 β + δ γ 2 4 ρ c 2 c 1 + d 2 e 1 e 2 p 2 β γ , Π D s | Θ L < w < Θ U Π D s | w Θ U = a b δ c 1 c 2 2 d + 3 e 1 p 3 e 2 p + 3 β + c c 1 + e 0 p e 1 p + δ γ 2 4 ρ c 2 c 1 + d 2 e 1 e 2 p 2 β γ . From Assumptions (2) and (3), we have Π D s | Θ L < w < Θ U Π D s | w Θ L > 0 and Π D s | Θ L < w < Θ U Π D s | w Θ U > 0 , and then the profits of sub-chain partners can be calculated as:
  • Π D t = d e 1 p + e 2 p β a b δ c 1 c 2 + e 1 p e 2 p + β + ρ c 1 e 0 p + e 1 p δ γ 2 4 ρ c 2 c 1 + d 2 e 1 p + 2 e 2 p 2 β 2 γ , and Π D s = a b δ c 1 + c 2 + 2 d e 1 p + e 2 p β + ρ c 1 + e 0 p e 1 p + δ γ 2 4 ρ c 1 c 2 d + 2 e 1 p 2 e 2 p + 2 β γ . □
Proof of Proposition 3. 
 
According to Assumption c 1 c 2 + ( e 1 e 2 ) p + β < 0 , it is easy to conclude that the function in Equation (12) is concave. Then, we obtain its first-order derivative as Equation (A5):
Π I e λ = K λ = a b δ c 1 c 2 + e 1 p e 2 p + β + ρ e 0 p + δ γ c 1 e 1 p + 2 c 1 λ 2 c 2 λ + 2 e 1 p λ 2 e 2 p λ + 2 β λ γ
When B c 1 c 2 + e 1 p e 2 p + β Ψ U , then K λ = 0 > 0 , K λ = 1 0 ; therefore, λ I = 1 ; When Ψ L < B c 1 c 2 + e 1 p e 2 p + β < Ψ U , then K λ = 0 > 0 , K λ = 1 < 0 ; therefore, λ I 0,1 . When we let Π I e λ = 0 we have λ I = ρ c 1 + e 1 p e 0 p δ γ a b δ c 1 c 2 + e 1 p e 2 p + β 2 ρ c 1 c 2 + e 1 p e 2 p + β . When B c 1 c 2 + e 1 p e 2 p + β Ψ L , K λ = 0 0 , K λ = 1 < 0 ; therefore, λ I = 0 . □
Proof of Proposition 4. 
 
λ I λ D = d e 1 p + e 2 p β a b δ c 2 c 1 + e 2 p e 1 p β + ρ δ γ c 1 + e 0 p e 1 p 2 ρ c 2 c 1 + e 2 p e 1 p β c 2 c 1 + d + 2 e 2 p 2 e 1 p 2 β
According to Assumptions (1), (2) and (3) and δ γ > c 1 + e 1 e 0 p , both the numerator and denominator are greater than zero. Thus, λ I > λ D .
Π I Π D s + Π D t = d e 1 p + e 2 p β 2 a b δ c 1 c 2 + e 1 p e 2 p + β + ρ c 1 e 0 p + e 1 p δ γ 2 4 ρ c 2 c 1 + d 2 e 1 p + 2 e 2 p 2 β 2 c 2 c 1 e 1 p + e 2 p β γ > 0
Proof of Proposition 5. 
 
(1) When B c 1 c 2 + e 1 p e 2 p + β Ψ U , it is known that λ I = 1 under the centralized setting. Let w c , f = Θ L , 0 , which yields λ c = λ D = λ I = 1 , and then the coordinated case is equivalent to the decentralized case.
(2) When Ψ L < B c 1 c 2 + e 1 p e 2 p + β < Ψ U , according to the first-order condition we have
λ c = a b δ d e 1 e 2 p β + ρ e 1 p e 0 p + w c δ γ d 2 ρ d e 1 e 2 p β
To coordinate the service supply chain, we apply λ c = λ I and obtain
w c = c 1 + d e 2 p δ γ e 0 p β + c 2 d e 1 p + e 0 p + δ γ c 1 c 2 + e 1 e 2 p + β
To ensure that the infrastructure provider and telecom operator accept the contract, both parties’ profits should be no less than profits retained after implementing the contract. Both parties’ retained profits are those obtained under the decentralized case, i.e., Π D s and Π D t . Therefore, Π C t Π D t and Π C s Π D s . By solving the above inequality group, we have F 1 f F 2 .
F 1 = d + e 2 e 1 p β 2 a b δ c 1 c 2 + e 1 e 2 p + β + ρ c 1 e 0 p + e 1 p δ γ 2 4 ρ c 1 c 2 + e 1 e 2 p 2 c 1 c 2 d + 2 e 1 e 2 p γ
F 2 = 2 c 1 2 c 2 d + 3 e 1 e 2 p + 3 β d + e 2 e 1 p β 2 a b δ c 1 c 2 + e 1 e 2 p + β + ρ c 1 e 0 p + e 1 p δ γ 2 4 ρ c 1 c 2 + e 1 e 2 p + β 2 c 1 c 2 d + 2 e 1 e 2 p + 2 β 2 γ
(3) When B c 1 c 2 + e 1 p e 2 p + β Ψ L , λ I = 0 holds in the centralized case. Let w c , f = Θ U , 0 , which yields λ c = λ D = λ I = 0 ; then, the coordinated case is again equivalent to the decentralized case. □
Proof of Corollary 2. 
 
Rewrite Θ L as Θ L = b δ ρ d p e 1 e 2 β a d ρ + e 1 e 2 ρ p a + a β ρ d + e 0 p + e 1 p 2 e 2 p + 2 β + δ γ and let Θ L δ = b d e 1 e 2 p β + ρ γ ρ > 0 ; as a result, Corollary 2 holds. Similarly, because we find that Θ U δ = Θ L δ , the condition also applies to the case of Θ U . □
Proof of Corollary 3. 
 
When λ I of Equation (13) is not 0 or 1, we derive its derivative with respect to p and obtain λ I p = c 1 c 2 + β e 1 e 0 e 1 e 2 c 1 δ γ 2 c 1 c 2 + e 1 p e 2 p + β 2 . Thus, when δ γ > e 1 e 0 e 1 e 2 c 2 β + e 0 e 2 e 1 e 2 c 1 , we have λ I p > 0 . □
Proof of Corollary 4. 
 
When λ I of Equation (13) is not 0 or 1, we derive its derivative with respect to δ and obtain λ I δ = ρ γ + b c 1 c 2 + e 1 p e 2 p + β 2 ρ c 1 c 2 + e 1 p e 2 p + β . According to Assumption (3), we know that 2 ρ c 1 c 2 + e 1 p e 2 p + β < 0 . Thus, when c 2 c 1 + ρ b γ > p e 1 e 2 + β , we have λ I δ > 0 . □
Proof of Corollary 5. 
 
When λ I of Equation (13) is not 0 or 1, we derive its derivative with respect to β and obtain λ I β = c 1 + e 0 p e 1 p + δ γ 2 c 1 c 2 + e 1 p e 2 p + β 2 . Thus, when δ γ > c 1 + p e 1 e 0 , we have λ I δ > 0 . □
Proof of Corollary 6. 
 
Based on Equation (18), λ N e 0 = 2 b p 3 b c 1 c 2 + e 1 p e 2 p + β + γ ρ . Thus, Corollary 6 holds. □

References

  1. Yuan, X.-C.; Wei, Y.-M.; Wang, B.; Mi, Z. Risk management of extreme events under climate change. J. Clean. Prod. 2017, 166, 1169–1174. [Google Scholar] [CrossRef]
  2. Wang, Q.; Hang, Y.; Zhou, P.; Wang, Y. Decoupling and attribution analysis of industrial carbon emissions in Taiwan. Energy 2016, 113, 728–738. [Google Scholar] [CrossRef]
  3. Wang, W.-K.; Lu, W.-M.; Kweh, Q.L.; Lai, H.-W. Does corporate social responsibility influence the corporate performance of the U.S. telecommunications industry? Telecommun. Policy 2014, 38, 580–591. [Google Scholar] [CrossRef]
  4. China Mobile Communications Corporation. The Annual Report of 2015. Available online: http://www.chinamobileltd.com/en/ir/reports/ar2015.pdf (accessed on 28 April 2020).
  5. Lu, Y. The Current Status and Developing Trends of Industry 4.0: A Review. Inf. Syst. Front. 2021. [Google Scholar] [CrossRef]
  6. Lu, Y.; Ning, X. A vision of 6G–5G’s successor. J. Manag. Anal. 2020, 7, 301–320. [Google Scholar] [CrossRef]
  7. Swami, S.; Shah, J. Channel coordination in green supply chain management. J. Oper. Res. Soc. 2013, 64, 336–351. [Google Scholar] [CrossRef]
  8. Hsueh, C.F. Improving corporate social responsibility in a supply chain through a new revenue sharing contract. Int. J. Prod. Econ. 2014, 151, 214–222. [Google Scholar] [CrossRef]
  9. Zhang, C.-T.; Liu, L.-P. Research on coordination mechanism in three-level green supply chain under non-cooperative game. Appl. Math. Model. 2013, 37, 3369–3379. [Google Scholar] [CrossRef]
  10. Zhang, C.T.; Wang, H.X.; Ren, M.L. Research on pricing and coordination strategy of green supply chain under hybrid production mode. Comput. Ind. Eng. 2014, 72, 24–31. [Google Scholar] [CrossRef]
  11. Basiri, Z.; Heydari, J. A mathematical model for green supply chain coordination with substitutable products. J. Clean. Prod. 2017, 145, 232–249. [Google Scholar] [CrossRef]
  12. Lu, Y.; Zheng, X.R.; Li, L.; Xu, L.D. Pricing the cloud: A QoS-based auction approach. Enterp. Inf. Syst. 2020, 14, 334–351. [Google Scholar] [CrossRef]
  13. Zhang, L.; Wang, J.; You, J. Consumer environmental awareness and channel coordination with two substitutable products. Eur. J. Oper. Res. 2015, 241, 63–73. [Google Scholar] [CrossRef]
  14. Li, B.; Zhu, M.; Jiang, Y.; Li, Z. Pricing policies of a competitive dual-channel green supply chain. J. Clean. Prod. 2016, 112, 2029–2042. [Google Scholar] [CrossRef]
  15. Du, S.; Zhu, L.; Liang, L.; Ma, F. Emission-dependent supply chain and environment-policy-making in the ‘cap-and-trade’ system. Energy Policy 2013, 57, 61–67. [Google Scholar] [CrossRef]
  16. Cao, E.; Yu, M. Trade credit financing and coordination for an emission-dependent supply chain. Comput. Ind. Eng. 2018, 119, 50–62. [Google Scholar] [CrossRef]
  17. Raj, A.; Biswas, I.; Srivastava, S.K. Designing supply contracts for the sustainable supply chain using game theory. J. Clean. Prod. 2018, 185, 275–284. [Google Scholar] [CrossRef]
  18. Taleizadeh, A.A.; Alizadeh-Basban, N.; Sarker, B.R. Coordinated contracts in a two-echelon green supply chain considering pricing strategy. Comput. Ind. Eng. 2018, 124, 249–275. [Google Scholar] [CrossRef]
  19. Bai, Q.; Xu, J.; Zhang, Y. Emission reduction decision and coordination of a make-to-order supply chain with two products under cap-and-trade regulation. Comput. Ind. Eng. 2018, 119, 131–145. [Google Scholar] [CrossRef]
  20. Wang, S.; Wu, Z.; Yang, B. Decision and Performance Analysis of a Price-Setting Manufacturer with Options under a Flexible-Cap Emission Trading Scheme (ETS). Sustainability 2018, 10, 3681. [Google Scholar] [CrossRef]
  21. Wang, S.Y.; Choi, S.H. Pareto-efficient coordination of the contract-based MTO supply chain under flexible cap-and-trade emission constraint. J. Clean. Prod. 2020, 250, 119571. [Google Scholar] [CrossRef]
  22. Di Pasquale, V.; Nenni, M.E.; Riemma, S. Order allocation in purchasing management: A review of state-of-the-art studies from a supply chain perspective. Int. J. Prod. Res. 2020, 58, 4741–4766. [Google Scholar] [CrossRef]
  23. Di Pasquale, V.; Iannone, R.; Nenni, M.E.; Riemma, S. A model for green order quantity allocation in a collaborative supply chain. J. Clean. Prod. 2023, 396, 136476. [Google Scholar] [CrossRef]
  24. Lu, Y. Implementing blockchain in information systems: A review. Enterp. Inf. Syst. 2022, 16, 2008513. [Google Scholar] [CrossRef]
  25. Naqvi, M.A.; Amin, S.H. Supplier selection and order allocation: A literature review. J. Data Inf. Manag. 2021, 3, 125–139. [Google Scholar] [CrossRef]
  26. Bai, X.; Yang, H.; Shu, H. Research on the Application of Multi-followers Stackelberg Model to the Telecom Value-added Service Supply Chain. China Commun. 2010, 7, 147–152. [Google Scholar]
  27. Çanakoglu, E.; Bilgic, T. Analysis of a two-stage telecommunication supply chain with technology dependent demand. Eur. J. Oper. Res. 2007, 177, 995–1012. [Google Scholar] [CrossRef]
  28. Lu, Y.; Sigov, A.; Ratkin, L.; Ivanov, L.A.; Zuo, M. Quantum computing and industrial information integration: A review. J. Ind. Inf. Integr. 2023, 35, 100511. [Google Scholar] [CrossRef]
  29. Dernirkan, H.; Cheng, H.K. The risk and information sharing of application services supply chain. Eur. J. Oper. Res. 2008, 187, 765–784. [Google Scholar] [CrossRef]
  30. Hasija, S.; Pinker, E.J.; Shumsky, R.A. Call center Outsourcing contracts under information asymmetry. Manag. Sci. 2008, 54, 793–807. [Google Scholar] [CrossRef]
  31. Chao, X.; Chen, H.; Zheng, S. Dynamic capacity expansion for a service firm with capacity deterioration and supply uncertainty. Oper. Res. 2009, 57, 82–93. [Google Scholar] [CrossRef]
  32. Liu, W.; Xie, D.; Liu, Y.; Liu, X. Service capability procurement decision in logistics service supply chain: A research under demand updating and quality guarantee. Int. J. Prod. Res. 2015, 53, 488–510. [Google Scholar] [CrossRef]
  33. Wang, Y.; Wallace, S.W.; Shen, B.; Choi, T.M. Service supply chain management: A review of operational models. Eur. J. Oper. Res. 2015, 247, 685–698. [Google Scholar] [CrossRef]
  34. Lu, Y.; Williams, T.L. Modeling analytics in COVID-19: Prediction, prevention, control, and evaluation. J. Manag. Anal. 2021, 8, 424–442. [Google Scholar] [CrossRef]
  35. Ye, Z.; Lu, Y. Quantum science: A review and current research trends. J. Manag. Anal. 2022, 9, 383–402. [Google Scholar] [CrossRef]
  36. Khan, M.; Ajmal, M.M.; Gunasekaran, A.; AlMarzouqi, A.H.; AlNuaimi, B.K. Measures of greenness: An empirical study in service supply chains in the UAE. Int. J. Prod. Econ. 2021, 241, 108257. [Google Scholar] [CrossRef]
  37. Dam, L.; Petkova, B.N. The impact of environmental supply chain sustainability programs on shareholder wealth. Int. J. Oper. Prod. Manag. 2011, 130, 586–609. [Google Scholar] [CrossRef]
  38. Korea Telecom. KT Integrated Report 2018. Available online: https://corp.kt.com/eng/archive/ipgrpt/attach/2018/2018_ENG_Archive.pdf (accessed on 28 April 2020).
  39. Yang, T.J.; Zhang, Y.J.; Huang, J.; Peng, R.H. Estimating the energy saving potential of telecom operators in China. Energy Policy 2013, 61, 448–459. [Google Scholar] [CrossRef]
  40. Amutha, W.M.; Rajini, V. Techno-economic evaluation of various hybrid power systems for rural telecom. Renew. Sustain. Energy Rev. 2015, 43, 553–561. [Google Scholar] [CrossRef]
  41. Chen, Y.; Zhang, Y.; Meng, Q. Study of ventilation cooling technology for telecommunication base stations: Control strategy and application strategy. Energy Build. 2012, 50, 212–218. [Google Scholar] [CrossRef]
Figure 1. Service capacity greenness in a telecom supply chain.
Sustainability 16 02924 g001
Figure 2. Optimal GPR when G 1 < G 2 < 0 .
Sustainability 16 02924 g002
Figure 3. Optimal GPR when G 1 < 0 < G 2 < 1 .
Sustainability 16 02924 g003
Figure 4. Optimal GPR when G 1 < 0 < 1 < G 2 .
Sustainability 16 02924 g004
Figure 5. Optimal GPR when 0 < G 1 < 1 < G 2 .
Sustainability 16 02924 g005
Figure 6. Optimal GPR when 1 < G 1 < G 2 .
Sustainability 16 02924 g006
Figure 7. The impact of CEA on the GPR.
Sustainability 16 02924 g007
Figure 8. The impact of SCE on the GPR.
Sustainability 16 02924 g008
Figure 9. The impact of PUE* on the GPR.
Sustainability 16 02924 g009
Figure 10. Coordinating the service supply chain with a CTT.
Sustainability 16 02924 g010
Table 1. The optimal GPRs of an integrated infrastructure sub-chain under interaction of SCs when G 2 G 1 > 1 .
G 1 < G 2 < 0 G 1 < 0 < G 2 < 1 G 1 < 0 < 1 < G 2 0 < G 1 < 1 < G 2 1 < G 1 < G 2
Figure 2Figure 3Figure 4Figure 5Figure 6
1 1 λ N 0 0
Note: G 1 = a b c 1 c 2 + e 1 p e 2 p + β + γ ρ + b 2 c 1 2 e 0 p + 2 e 1 p ρ ρ b c 1 c 2 + e 1 p e 2 p + β + γ ρ , G 2 = G 1 + 4 b c 1 c 2 + e 1 p e 2 p + β b c 1 c 2 + e 1 p e 2 p + β ρ γ .
Table 2. The optimal GPRs for an integrated infrastructure sub-chain under interaction of SCs when 0 < G 2 G 1 < 1 .
G 1 < G 2 < 0 G 1 < 0 < G 2 < 1 0 < G 1 < G 2 < 1 0 < G 1 < 1 < G 2 1 < G 1 < G 2
0 0 λ N 1 1
Table 3. Coordination scheme of the infrastructure supply chain when G 2 G 1 > 1 .
G 1 < G 2 < 0 G 1 < 0 < G 2 < 1 G 1 < 0 < 1 < G 2 0 < G 1 < 1 < G 2 1 < G 1 < G 2
Θ L N , 0 Θ L N , 0 w N , f N Θ U N , 0 Θ U N , 0
Table 4. Coordination scheme of the infrastructure supply chain when 0 < G 2 G 1 < 1 .
G 1 < G 2 < 0 G 1 < 0 < G 2 < 1 0 < G 1 < G 2 < 1 0 < G 1 < 1 < G 2 1 < G 1 < G 2
Θ U N , 0 Θ U N , 0 w N , f N Θ L N , 0 Θ L N , 0
Table 5. The monotonicity of Θ L and Θ U with respect to main factors.
d e 0 p ρ δ γ β
Θ L +++conditional++
Θ U +++conditional++
Table 6. The monotonicity of λ I with respect to main factors.
d e 0 p ρ δ γ β
λ I N.A.+conditional+conditional+conditional
Table 7. Parameters used for the numerical examples.
a b p c 1 c 2 e 1 e 2 d δ
1002151042825
Disclaimer/Publisher’s Note: The statements, opinions and data contained in all publications are solely those of the individual author(s) and contributor(s) and not of MDPI and/or the editor(s). MDPI and/or the editor(s) disclaim responsibility for any injury to people or property resulting from any ideas, methods, instructions or products referred to in the content.

