Abstract
The consideration of environmental factors is common in current product design. For the purpose of the assessment of recycling properties of a product, quantitative measures have been defined in the literature. The main obstacle in using these measures in practical design is lack of data in typical product models. In this article, a Recycling Product Model (RPM) is presented. The RPM enables calculations of quantitative assessment measures defined in the literature directly from a CAD 3D product model. The term RPM and elements of the RPM are described. The functionality of the software dedicated for the RPM is presented. The use of the RPM is demonstrated based on a case study of an actual CAD 3D product model. The article concludes by outlining the potential use of the RPM for other purposes; the limitations of the RPM are elucidated in the conclusions of the article.
1. Introduction
Increasing environmental requirements play an increasingly important role in product design. This is reflected in the consideration of environmental factors in product design [1]. The catalyst for this change has been the emergence of the circular economy, which can be defined as “an economic system aimed at minimizing waste and making the most of resources” [2], which has resulted in a shift away from the traditional linear production model to a circular economy model [3]. A key role in a circular economy is played by the product design stage [4,5]. Decisions made at the product design stage determine a product’s sustainability potential, recyclability and overall environmental footprint. The most important elements related to the closed-loop economy include design for durability, material selection, design for disassembly and reuse and remanufacturing:
- Design for durability. According to the European Union standard EN 45552 [6], the durability for a part or a product can be defined as the ability to function as “required, under defined conditions of use, maintenance and repair, until a limiting state is reached” [6]. Design for durability is an approach in product design that is followed to enhance the resilience and durability of products throughout their life cycle [7,8]. The approach requires detailed consideration of factors such as material selection, manufacturing processes and structural integrity, with the overarching goal of reducing wear, degradation and potential aging [7,8]. This contrasts with planned obsolescence, a practice whereby products are deliberately designed to have a short lifespan to encourage more frequent consumption [9].
- Material selection. Material selection in the closed-loop economy is a key aspect of the design process, involving the deliberate selection of environmentally friendly materials to minimize the environmental impact of a product. The process is characterized by the deliberate identification and incorporation of materials compatible with the principles of the closed-loop economy, including factors such as resource availability, recyclability and life cycle assessment [10,11,12,13]. With an emphasis on environmentally friendly materials, the selection of materials aims to improve the overall environmental performance of products by considering the efficient use of resources, reduction of emissions, and promotion of the use of closed-loop materials [13].
- Design for disassembly. Design for disassembly is a key strategy within the closed-loop economy paradigm that aims to facilitate the efficient and systematic disassembly of products at the end of their life cycle. The approach follows the principles of the closed-loop economy, emphasizing the recovery and reuse of materials to minimize waste and promote resource sustainability. Designers using design for disassembly strategies focus on creating products that can be easily disassembled, allowing components and materials to be separated and recovered for later use or recycling [14,15,16,17].
- Reuse and remanufacturing. Reuse and remanufacturing is another strategy within the closed-loop economy supporting resource efficiency and sustainability patterns. This approach involves extending the life of products by putting them back on the market in their original form or after refurbishment, thereby minimizing waste and contributing to the overarching principles of the closed loop [18,19,20].
Central to the concept of reuse is the reintroduction of products into the market for their original purpose or by repurposing them [21]. This approach is consistent with the closed-loop economy’s emphasis on preserving the value and utility of a product after its initial use [3,5,22]. An essential aspect of reuse is reducing premature disposal, contributing to waste reduction and promoting responsible consumption [20]. Remanufacturing, on the other hand, involves the systematic renovation and restoration of used products to like-new condition, often surpassing their original properties [23,24]. The process typically involves disassembly, the replacement of worn components and rigorous quality control measures. Remanufacturing not only extends the life cycle of a product, but also reduces the need for new materials, minimizing the environmental footprint associated with manufacturing processes [25].
Another important problem is gas emission into the environment. Gas emissions, particularly greenhouse gases (GHGs), contribute to numerous negative implications on climate change, including rising global temperatures, extreme weather events and ecosystem disruptions [26,27]. It also has a negative influence on humans, causing numerous serious health problems [28]. To counteract these negative trends, the world’s leading economies are developing initiatives to reduce such emissions. India has committed to reducing CO2 emissions by 30–35% by 2030 [29]. The European Union outlined a transformative strategy in the European Green Deal to address climate and environmental challenges [30]. It commits to achieving a fair and prosperous society with a resource-efficient economy, aiming for net-zero greenhouse gas emissions by 2050 [30].
This rest of this article is organized as follows. Section 2 is a literature review on the quantitative assessment of the design for disassembly of a product. Section 3 defines a Recycling Product Model (RPM), provides example models and describes the computer-aided RPM modeling. Section 4 presents the application of the RPM based on the example models and an actual product case study. Section 5 contains the discussion of the results. Finally, Section 6 summarizes the main findings of the article and highlights future lines of research.
2. Quantitative Assessment of the Design for Disassembly of a Product
2.1. Quantitative Measures of the Disassembly of a Product
A problem that emerges from the elements and problems presented above is the quantitative assessment of a product from the point of view of design for disassembly. Numerous quantitative measures for assessment of products can be found in the literature.
Sodhi et al. [31] defined the Unfastening Effort Index (UFI):
with i—code for a fastener type; —lower bound on the unfastening effort; Ai, Bi, Ci and Di—unfastening complexity scores; and —significance coefficients for each attribute. Sodhi et al. [31] distinguished 10 fastener types and represented their properties as complexity scores. The complexity scores are derived based on a series of physical experiments on the disconnection of a particular type of fastener. Thus, the UFI represents the overall effort to disconnect a given fastener type. From the Unfastening Effort Index, the disconnection time can be estimated as follows [31]:
An application of the UFI is illustrated with the example of a portable cassette player.
Vanegas et al. [32] decomposed the disassembly operation into six disassembly task categories (tool change, identifying, manipulation, positioning, disconnection, removing) and, based on it, developed the “ease of Disassembly Metric” (eDiM):
with eDiM—total time needed to disassemble the product, and n—number of connections in the product.
The use of the eDiM was demonstrated based on the disassembly time measurements and analysis of 28 LCD monitors conducted by an experienced disassembly worker at a recycling facility [32].
Another evaluation method, proposed by Desai and Mital [33], distinguishes design attributes subdivided into design features and design parameters and assigns them scores that reflect the influence of a given factor on product disassembly. Each component is evaluated during the design process from the points of view of defined attributes. A weak score indicates the necessity for a redesign of the component being evaluated. Desai and Mital [33] did not define any equation in their method—the evaluation is conducted with the help of an algorithm for systematic design improvement. This approach is illustrated by Desai and Mital [33] with the example of a hand-held electric drill set analysis.
Martínez Leal et al. [34] proposed a product’s recyclability index as follows:
with Rp—recyclability of the product; Cm—compatibility of materials; Dm—diversity of materials; Rm—recyclability of materials; and nal—number of aggregated action levers.
The compatibility of material is defined as follows (Martínez Leal et al. [34]):
with Cm—compatibility of , which is the compatibility of the ith material; and u—number of materials.
The compatibility of the ith material is defined as follows (Martínez Leal et al. [34]):
with —compatibility of the ith material; —compatibility between the ith and the jth material; and u—number of materials.
The diversity of materials Dm was defined by Martínez Leal et al. [34] after Rzeźnik et al. [35]:
with Dm—diversity of materials; ci—concentration of the ith material; and u—number of materials.
The recyclability of materials Rm was defined by Martínez Leal et al. [34] as follows:
with Rm—recyclability of materials; —recyclability of the ith material; and u—number of materials.
The recyclability of the material was defined by Martínez Leal et al. [34] as follows:
with rm—recyclability of material; —material recycling rate; and —material purity rate.
The use of the approach proposed by Martines Leal et al. [34] was shown based on the Fairphone 2, which was the first modular smartphone available to consumers [34].
Dostatni [36] developed a product recycling assessment measures based on the total recycling rate (CWR):
with WRM—material diversity; WRP—connection diversity; and WPR—recycling target. The WRM is calculated based on the following formula [36]:
with M1—number of occurrences of the material most frequently used in the product; and Mw—number of occurrences of other materials. The WRP is calculated based on the following formula [36]:
with P1—number of occurrences of the connection type most frequently used in the product; and Pw—number of occurrences of other connection types. The WRP is calculated based on the following formula [36]:
with MR—mass of the product’s parts being recycled; and Mw—total mass of the product. The WRM, WRP and WPR are calculated based on WRM, WRP and WPR using the conversion tables defined by Dostatni [36] for this method, obtaining final values in the range between 0.5 and 5. The application of the method was demonstrated on an electric mixer [37].
de Aguiar et al. [38] defined a set of measures belonging to two groups: product disassembly and material recycling indexes. The product disassembly indexes consist of five measures: a Quantity of Fasteners Index (QFI), Percentage of Fasteners Index (%FI), Type of Fastener Index (TFI), Quantity of Types of Fasteners Index (QFTI) and Accessibility Index (AI). Material recycling indexes encompass four measures: an Infrastructure Index (II), Material Compatibility Index (MCI), Material Group Index (MGI) and End-of-Life Contamination Index (EoLCI).
There is no definition of the QFI in the paper by de Aguiar et al. [38], but from the content of the article, it stems that it equals the overall number of fasteners that connect each part (this definition of the Quantity of Fasteners Index (QFI) is the conclusion of the author). The Percentage of Fasteners Index (%FI) is defined as follows [38]:
In the above original definition of the %FI, the fraction is multiplied by 4 in order to normalize this measure to a range of 1 to 4 [38]; however, in the example presented by de Aguiar et al. [38], this multiplication was not applied.
Another measure defined by de Aguiar et al. [38]—the Type of Fastener Index (TFI)—is the number between 1 and 4 that represents the ease of executing the disassembly of the evaluated fastener. A lower TFI value represents fasteners that are easier to disassemble; a higher TFI value reflects fasteners that are more difficult to disassemble. The sum of the TFI (Total TFI) for all the fasteners represents the overall difficulty of the disassembly of the whole product. The TFI values were evaluated by de Aguiar et al. [38] during an experiment that evaluated distinct types of fasteners from the points of view of disassembly time, disassembly force, types of tools needed for disassembly and viability of part reuse after disassembly. The final TFI values obtained this way were reported by de Aguiar et al. [38] in the form of a table.
The last two measures from the product disassembly index are the Quantity of Types of Fasteners Index (QFTI) and Accessibility Index (AI). The QFTI is the number of different types of fasteners limited to 4. The number of different types of fasteners greater than 4 are represented by 4, which indicates poor design. The Accessibility Index (AI) is also a number in the range of 1 to 4, with 1 representing full accessibility and 4 representing no accessibility of the part.
The first of the material recycling indexes is the Material Compatibility Index (MCI), defined as a discrete four-value measure (1—same material; 2—compatible materials; 3—low compatibility materials; 4—non-compatible materials) [38]. The second material index—the Material Group Index (MGI)—is also a discrete four-value measure (1—inert materials and not dangerous; 2—not inert materials but not dangerous; 3—dangerous materials; 4—controlled-use materials) [38]. The third material index—the End-of-Life Contamination Index (EoLCI)—is a discrete two-value measure (1—not contaminated; 4—contaminated) [38]. The last of the material recycling indexes, the Infrastructure Index (II), is also a discrete four-value measure (1—local/regional; 2—national; 3—international; 4—inexistent/unknown) [38].
de Aguiar et al. [38] illustrated their method using example evaluations of a portable cassette and CD player.
Kroll and Hanft [39] developed a method for evaluating the ease-of-disassembly of products, based on a spreadsheet-like Disassembly Evaluation Chart and a catalogue of task difficulty scores. Based on these data, the measure of Design Effectiveness was drawn up:
with column 3 and column 13 as the Theoretical Minimum Number of Parts and the product of the number of task repetitions and sum of individual difficulty ratings, respectively. The use of this approach was presented as an example evaluation of a computer’s Central Processing Unit (CPU).
2.2. Conclusions on the Quantitative Measures of the Disassembly of a Product
Most of the researchers that proposed the measures presented above concentrated on the formal shape of their methods and assumed that all the data required for the calculation of the measure are available or can be manually derived from various types of product models. For example, in the set of measures proposed by de Aguiar et al. [38], all the data necessary for the calculation of the measures were taken from the analysis of a product’s BOM. Such an approach would be inconvenient for the designer during design activities because it requires additional effort. This is the first main obstacle in using the measures during the actual design process. Every change in a product’s design requires further updating of the input data, which makes these methods difficult to use. Another problem is a lack of necessary input data, especially in measures based on connection types. Such data are not directly represented in typical product models, like BOM or 3D assembly models, especially in cases of making connections without connecting parts (fasteners). This obstacle also makes use of assessment measures difficult.
Both of the obstacles mentioned above indicate the lack of necessary data in product models in order to calculate the recycling quantitative assessment measures directly and effectively from the product model. This lack of necessary data constitutes a knowledge gap.
The best situation for the designer would be to calculate the measures directly and automatically from a product model during the design process. This can be achieved by adding the necessary data to the product model so that the calculations of measures could be conducted automatically. The aim of this article was to propose such a set of data necessary for conducting the calculations of assessment measures automatically. This set of data constitutes a model named the Recycling Product Model (RPM).
3. Materials and Methods
3.1. Recycling Product Model (RPM)
The Recycling Product Model consists of the following elements [40]:
- A CAD 3D assembly model;
- Extended connection attributes with disassembly attributes (connection constraints);
- Material recycling attributes;
- A product category.
The RPM is a CAD 3D model with additional data defined in order to calculate recycling assessment measures directly (Figure 1), which makes the RPM the input data for calculating the quantitative assessment measures of the recycling properties of a product (Figure 2).
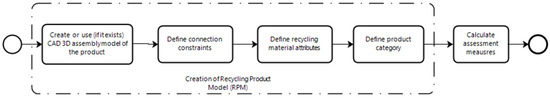
Figure 1.
Recycling Product Model creation steps.

Figure 2.
Recycling Product Model as the input data for the calculation of quantitative assessment measure.
The use of the RPM in the design process of a product assumes an iterative approach to the final version of the product design through the creation of design variants and assessment of their quantitative recycling properties. This design process is presented in Figure 3. Thus, the RPM shows the influence of decisions concerning the product design made at the design phase of the product’s life cycle on recycling (as an activity that can be conducted at the last phase of the product’s life cycle). The use of the RPM within a product’s life cycle is presented in Figure 4.
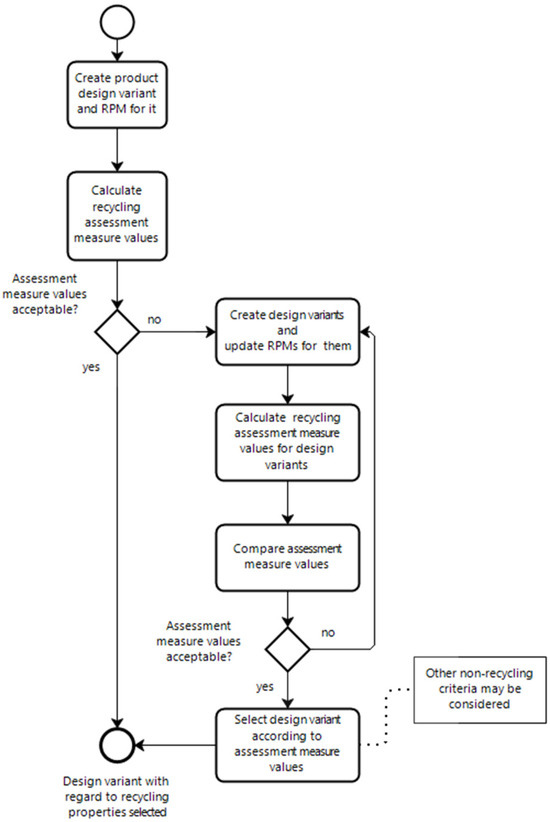
Figure 3.
The use of the RPM for selecting the design variant with regard to recycling properties.

Figure 4.
Use of RPM within product life cycle.
The remainder of this chapter is organized as follows. Section 3.2 presents the theoretical model of connection constraints with examples. Section 3.3 characterizes the material recycling attributes and product category. Section 3.4 describes computer-aided RPM modeling. Section 3.5 shows an actual product case study.
It has to be clearly stated what this article is not about. This article is not dedicated to defining new assessment measures. This article is dedicated to defining the necessary set of data that enable the calculations of the assessment measures defined in the literature during the daily routines of design. These measures are used in their original form, provided by their authors or are slightly adjusted for the purposes of the RPM. These adjustments do not change these measures in any significant way.
3.2. Connection Constraints
Due to a lack of the comprehensive and exact representation of connection types in CAD 3D systems, such a representation has been proposed in the form of new types of constraints in CAD 3D systems—connection constraints. The main purpose of connection constraints is the comprehensive representation of connection types in CAD 3D models.
The theoretical model of a connection constraint [40] is based on a weighted hypergraph [41]. A hypergraph is the graph where the edge (called a hyperedge) joins any number of vertices [41]. In the theoretical model, vertices of the hypergraph represent connected parts, hyperedges represent connections, and connection attributes are represented by the hyperedges’ weights. The use of a hypergraph allows for a simple approach to a situation in which more than two elements of the model are connected. A connections model based on a hypergraph allows for easy implementation using data structures in a computer program.
It has been assumed that a set of all model parts P is the sum of sets M, L and ML:
where the sets are defined as follows:
is the set of connected parts;
is the set of connecting parts;
is the set of connected-connecting parts.
The connections in the product are defined as hypergraph G:
where the vertices K, hyperedges C and weights w are defined as follows:
;
is the set of hyperedges representing connections (1 hyperedge = 1 connection);
is the set of the hyperedges’ weights, representing the attributes of the connection.
A weight wj is a 5-tuple:
where the elements are defined as follows:
;
is the element representing the connection nature;
u is the set representing the connection type (see the following paragraph);
r {yes, no} describes the disassembly of the connection during the recycling process;
t R+ is the disassembly time in seconds.
For the purposes of the calculation of the measures (especially the TFI measure) defined by de Aguiar et al. [38], the connection types (u set) in the version of the RPM presented in this article are defined based on connection types proposed by de Aguiar et al. [38] with two modifications. The modifications relied on adding new types of connections: free (temporary connection), welded and soldered (permanent connection) and the integration of screw, nut and bolt connection types into the threaded connection type. The free type of connection is the connection type where the effort required to disconnect parts is negligible. The connection types (u set) defined in this way for the RPM are presented in Table 1.

Table 1.
Connection types defined for the RPM.
The example connections and their formal representation by connection constraints are presented below.
Example 1.
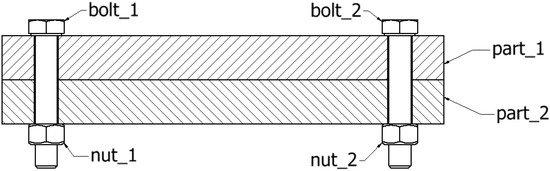
Two parts, connected temporarily by two bolts and two nuts (Figure 5).
Figure 5.
Example 1 model.
The connection constraints’ formal representation for Example 1 are defined as follows:
;
;
, describes two hyperedges representing two connections;
;
;
;
.
Example 2.

Two parts, connected temporarily by two snap-fits (Figure 6).
Figure 6.
Example 2 model.
The connection constraints’ formal representation for Example 2 are defined as follows:
;
, describes two hyperedges representing two connections;
;
;
;
.
Example 3.

Two parts, connected temporarily by two pins (Figure 7).
Figure 7.
Example 3 model.
The connection constraints’ formal representation for Example 3 are defined as follows:
;
, describes two hyperedges representing two connections;
;
;
;
.
3.3. Material Recycling Attributes and Product Category
The last two elements of the RPM are the material recycling attributes and product category.
The material recycling attributes consist of two elements: material recycling profit Mrp R [c.u./kg] and material hazardousness Mh {yes,no}. The material recycling profit Mrp is the unit profit amount from the recycling of 1 kg of the given material in a currency unit (c.u.). A positive value of Mrp means profit from recycling the given material; a negative value of Mrp means a necessity to pay for the recycling of the given material (negative cashflow). The material recycling profit may be used in the estimation of the recycling profit from the whole product. The material hazardousness Mh is the logical value indicating whether the given material is hazardous. These attributes are used to establish the materials in the product that are difficult to recycle.
The product category enables the classification of a product to a group according to the waste and recycling regulations. In the RPM, the categories are defined according to the Directive of the European Parliament on waste electrical and electronic equipment (WEEE) [42]. These categories are presented in Table 2.
Table 2.
Product categories according to the Directive of the European Parliament on waste electrical and electronic equipment (WEEE) [42].
3.4. Computer-Aided RPM Modeling
The practical use of the RPM is possible using the software aiding creation of an RPM model in a CAD 3D system. Unlike in previous computer-aided RPM modeling, running in a Catia CAD 3D system as a set of Visual Basic scripts [43] with measures calculated by an external computer programs based on agent technology [44], the software presented in this article runs within the CAD 3D system Autodesk Inventor 2021 as an add-in (Figure 8) and has the following main functionalities:

Figure 8.
Recycling Product Model Autodesk Inventor add-in ribbon view.
- Defines connection constraints;
- Defines material recycling attributes;
- Defines the product category;
- Calculates the disassembly time, cost and recycling assessment measures.
The calculation of recycling measures in the RPM add-in was implemented based on the selected measures defined by de Aguiar et al. [38] and encompasses the following measures: the Quantity of Fasteners Index (QFI), Percentage of Fasteners Index (%FI), Type of Fastener Index (TFI) and Quantity of Types of Fasteners Index (QFTI). The Quantity of Fasteners Index (QFI) is the number of connection constraints defined in the Recycling Product Model (RPM) for a given part; the Percentage of Fasteners Index (%FI) equation was transformed in the following manner:
with the total QFI denoting the sum of all QFI.
These measures will be compared with the connection diversity (WRP) measure (Dostatni [36])—one of the measures for which the Recycling Product Model was originally developed [36]. Because of the various natures of the measures describing the material properties of the product between the measures defined by de Aguiar et al. [38] and Dostatni [36], other measures will not be discussed in this article.
The CAD 3D models for Examples 1–3 with their connection constraints definitions created using the RPM add-in are presented in Figure 8, Figure 9, Figure 10 and Figure 11.
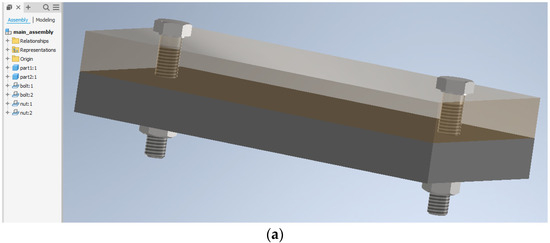
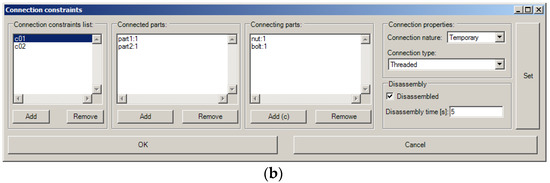
Figure 9.
CAD 3D model (a) and connection constraints definition window (b) using the RPM add-in for Example 1.

Figure 10.
CAD 3D model (a) and connection constraints definition window (b) using the RPM add-in for Example 2.

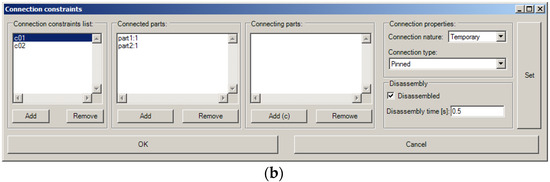
Figure 11.
CAD 3D model (a) and connection constraints definition window (b) using the RPM add-in for Example 3.
3.5. Actual Product Case Study
The subject of the actual product case study was a portable gas cooker. For the purposes of the recycling profit analysis, the product was modeled in the 3D CAD Inventor system (Figure 12). Next, the RPM elements necessary for the calculation of the assessment measures were defined using the RPM add-in: connection constraints (Figure 13) and product category (Figure 14). The list of connection constraints is presented in Table A1. This model will be referred to as Variant 1 henceforth.

Figure 12.
Portable gas cooker CAD 3D model.

Figure 13.
Connection constraints of the portable gas cooker (Variant 1) defined using the RPM add-in.

Figure 14.
Product name and category for the portable gas cooker defined in the RPM add-in.
The results obtained from the Recycling Product Model were calculated using the RPM add-in and are presented in the next chapter.
4. Results
For the purpose of the RPM creation using the RPM add-in for Examples 1–3, the calculation of the product disassembly cost for the minimum salary per hour in Poland [45] was assumed. All the monetary amounts are in Polish currency units (c.u.)—Polish zloty (PLN). To determine the disassembly times, a collection of measures was performed on original or highly-similar-to-the-original connection types. The disassembly times finally used are the averages of the collection of measures for each connection type.
The example results from the RPM add-in are presented in Figure 15. The results of Examples 1–3 are presented in Table 3, Table 4, Table 5, Table 6, Table 7, Table 8, Table 9, Table 10 and Table 11, compared in Table 12 and shown in Figure 16, Figure 17, Figure 18 and Figure 19.

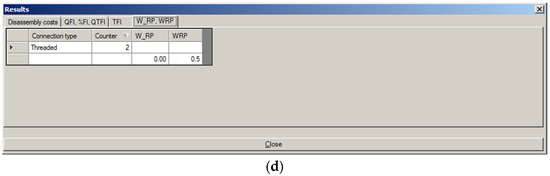
Figure 15.
Results of Example 1 model analysis using RPM add-in: (a) disassembly times and costs, (b) QFI, %FI and QTFI, (c) TFI and (d) WRP and WRP.
Table 3.
Disassembly costs of Example 1 model.
Table 4.
Disassembly costs of Example 2 model.
Table 5.
Disassembly costs of Example 3 model.
Table 6.
Disassembly measures of Example 1 model.
Table 7.
Disassembly measures of Example 2 model.
Table 8.
Disassembly measures of Example 3 model.
Table 9.
TFI measure values of Example 1 model.
Table 10.
TFI measure values of Example 2 model.
Table 11.
TFI measure values of Example 3 model.
Table 12.
Disassembly times, costs and TFI and WRP measures for Examples 1–3.

Figure 16.
Total disassembly times for Examples 1–3.

Figure 17.
Total disassembly costs for Examples 1–3.
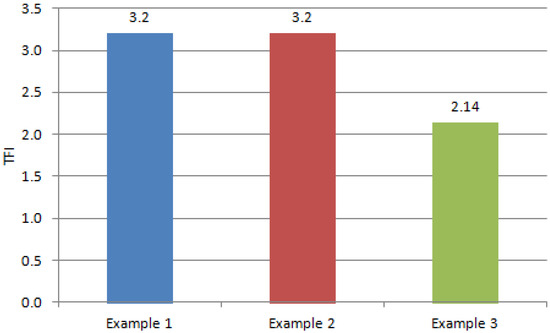
Figure 18.
Sum of TFI (Total TFI) for Examples 1–3.

Figure 19.
Connection diversity (WRP) for Examples 1–3.
To improve the recycling properties of the portable gas cooker, four other design variants were investigated:
- Variant 2: applies one threaded and one riveted connection between valves and a case and valves and pipes, respectively;
- Variant 3: same as Variant 1 with the replacement of all riveted connections with threaded connections;
- Variant 4: reduces the number of existing connections in the base variant (Variant 1) between valves and a case and valves and pipes;
- Variant 5: same as in Variant 4 and replaces all riveted connections with threaded connections.
For the purposes of Variants 4 and 5, the pipes were redesigned in order to save the materials for the parts. The variants are presented in Figure 20. The same design solutions were applied for connections between the case and valves. The list of connection constraints for Variants 2–5 are presented in Tables S1–S4.

Figure 20.
Variants of portable gas cooker connections between case and pipe (connection types marked by the ellipses): (a) Variant 1—two rivets, (b) Variant 2—one rivet and one bolt and nut, (c) Variant 3—two bolts and nuts, (d) Variant 4—one rivet and (e) Variant 5—one bolt and nut.
The results of Variants 1–5 of the portable gas cooker are compared in Table 13, Table A2 and Table A3 and presented in Figure 21, Figure 22, Figure 23, Figure 24, Figure 25 and Figure 26.
Table 13.
Disassembly times, costs and TFI and WRP measures for Variants 1–5 of the portable gas cooker.

Figure 21.
Total disassembly times for Variants 1–5 of the portable gas cooker.
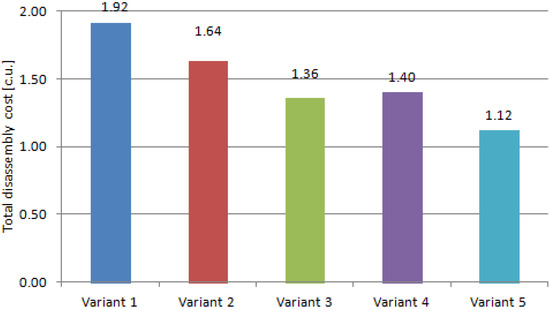
Figure 22.
Total disassembly costs for Variants 1–5 of the portable gas cooker.
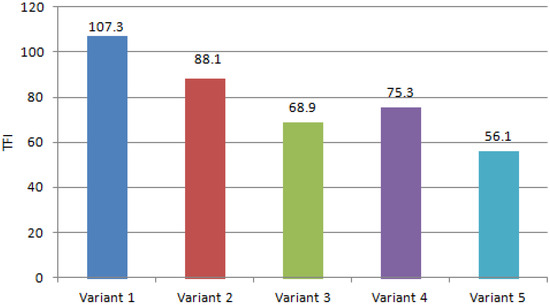
Figure 23.
Sum of the TFI (Total TFI) for Variants 1–5 of the portable gas cooker.

Figure 24.
Connection diversity (WRP) for Variants 1–5 of the portable gas cooker.
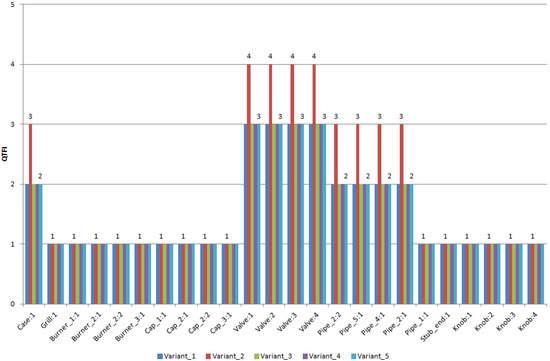
Figure 25.
QTFI for Variants 1–5 of the portable gas cooker.

Figure 26.
%FI [%] for Variants 1–5 of the portable gas cooker.
5. Discussion
From all of the measures investigated in this article, the most useful is the Type of Fastener Index (TFI). It provides direct and readable information about the difficulty of disassembly of a particular type of connection, which can be an indication for design change for the designer. On the other hand, the sum of the TFI (Total TFI) enables a direct comparison of design variants and supports choosing the best variant from the recycling point of view. This is especially evident in the comparison of Variants 3 and 4 of the portable gas cooker (Table 13, Figure 23), where Variant 3 outranked Variant 4, indicating that is a better variant regardless of number of connections being used. The connection diversity (WRP) (these two measures can be compared because they consider only the structure of connections used in the product’s design and both are the overall aggregation of design solutions from the point of view of the connection structure) provides less, in comparison to the Total TFI, precise information about the product design and should be treated as an overall direction of the design changes being investigated. This is evident both in the WRP values of Examples 1–3 (Table 12, Figure 19) or the WRP values of Variants 1–5 (Table 13, Figure 24), where the WRP turned out to be less “sensitive” for design changes being conducted in comparison to the Total TFI.
The purpose of the measures of the Quantity of Fasteners Index (QFI), Percentage of Fasteners Index (%FI) and Quantity of Types of Fasteners Index (QFTI) is to indicate the problematic parts from the recycling point of view (higher values of these measures indicate a worse design solution). From this group of measures, the QFTI is the most useful and can be treated as an indication for the most problematic parts in the product design. The QFTI properly indicated the worst variant in the case of Variant 2 (Table A2, Figure 25) and the difference between Variant 2 and the other variants. The other measures for this group (QFI and %FI) present values (Table A3, Figure 26) that are more difficult to compare and can be treated as auxiliary only.
Generally speaking, the improvement of the recycling properties of a product would rely on minimizing the number of connections of a particular part. However, in practice, this is often difficult to implement due to design constraints. The most problematic part of the portable gas cooker are the valves—this is indicated by the values of the QFTI (Table A2, Figure 25). The minimizing of these measures for the valves would require reducing the number of connections, which is impossible because of the destination of these parts and the requirements of their connection properties. This is why the values of the QFTI are the same for all of the variants except Variant 2.
Regarding recycling in the design process, other criteria may be considered and taken into account (Figure 3). Variant 2 of the portable gas cooker causes unnecessary complications during the assembly of the product and constitutes another reason (except for the worse assessment measures than most of other variants) against this variant.
The design variants being investigated should be technically justified. Because of this, other potential variants of the portable gas cooker were not investigated. This concerns soldered connections between pipes, valves and stub ends—they should be left “as is” because of the requirement of gas tightness between these parts. The use of a temporary connection between these parts (i.e., a threaded connection between the pipe and valve with additional seal) would risk a gas leak during the use of the portable gas cooker.
6. Conclusions
In this article, the proposed Recycling Product Model (RPM) focused on conducting a quantitative assessment of the recycling properties of products directly from a CAD 3D model. The elements of the RPM were defined with a theoretical model of connection constraints—a new kind of constraints in CAD 3D systems dedicated to the representation of connections in CAD 3D models. The place of the RPM within the product life cycle was also demonstrated. The use of the RPM is possible with dedicated software, running as an add-in within the CAD 3D Autodesk Inventor 2021 system that enables the practical utilization of this model.
The attempt to use the Recycling Product Model for the calculation of measures not intended originally for cooperation with the RPM was successful, which demonstrates its universality and reveals the potential of this model.
The Recycling Product Model defines a set of data necessary to deal with the end-of-life phase of a product’s life cycle. The presented RPM add-in can be implemented in other CAD 3D systems, delivering the common functionality regardless of the CAD 3D software being used for product modeling. Such RPM add-ins would also have the same user interface in other CAD 3D systems, which is convenient from a user’s point of view.
The use of the Recycling Product Model at the design stage of the product life cycle was demonstrated. At the design phase, the Recycling Product Model incorporates end-of-life issues into product design and supports making decisions that consider recycling issues, which indicates the potential use of the RPM at the utilization stage. At the utilization stage, the RPM could be used by recycling companies to assess and compare the various disassembly strategies of a product.
Another use of the Recycling Product Model is the possibility of comparisons of other measures based on the same product model, which was shown in this article and will be continued in future research. Such activity requires the implementation of other measures being investigated, which is possibly based on the current version of the RPM or simply requires adding new attributes to those currently in the RPM. For example, in order to implement the “ease of Disassembly Metric” (eDiM) only the extension of a set of time attributes of weight wj (Equation (18)) is necessary (on the other hand, this indicates that disassembly time in the current version of the RPM is the simplified variant of the eDiM measure).
The main disadvantage of this proposed solution is the additional effort required for the designer to define the Recycling Product Model for the product being designed. This is also connected to a paradigm shift that exists from the connection constraints from a geometrical-oriented approach typical for CAD 3D systems into a connection-oriented approach, where the functions of the parts are defined from the points of view of their roles in the structure of the connection of the product.
The recycling process presented in this article reflects a manual disassembly process—it stems from the data entered by a user during the definition of the connection constraints. One of the future research directions is the implementation of a disassembly method to find the optimal or suboptimal disassembly path.
Three limitations of the study are worth considering. The first limitation concerns the location of a connection without a connecting element. If the connection is made using connecting parts, the location of the connection in the product is easy to determine. If the connection is made without connecting parts (i.e., a snap-fit connection), the location of the connection is not strictly available. The second limitation concerns the calculation model of the recycling cost. The actual model does not consider factors such as the cost of the tools necessary for the recycling process and their energy consumption. During the recycling process, the emission of liquids and gases may occur, which is not included in the presented version of the RPM and constitutes the third limitation of this model. These limitations present future paths of research.
Supplementary Materials
The following supporting information can be downloaded at: https://www.mdpi.com/article/10.3390/su16072880/s1, Table S1: connection constraints defined for Variant 2 of the portable gas cooker; Table S2: connection constraints defined for Variant 3 of the portable gas cooker; Table S3: connection constraints defined for Variant 4 of the portable gas cooker; Table S4: connection constraints defined for Variant 5 of the portable gas cooker.
Funding
This study was conducted with support from statutory activity financed by the Polish Ministry of Science and Higher Education (0613/SBAD/4821).
Institutional Review Board Statement
Not applicable.
Informed Consent Statement
Not applicable.
Data Availability Statement
Data are contained within the article and Supplementary Materials.
Conflicts of Interest
The author declares no conflict of interest.
Appendix A
Table A1.
Connection constraints defined for Variant 1 of the portable gas cooker.
Table A1.
Connection constraints defined for Variant 1 of the portable gas cooker.
| Conn. Constr. ID | Connected Parts | Connecting Parts | Connection Nature | Connection Type | Disassembled | Disassembly Time [s] | Disassembly Cost [c.u.] |
|---|---|---|---|---|---|---|---|
| C01 | Case:1 Grill:1 | Temporary | Free | Yes | 0.5 | 0.00292 | |
| C02 | Case:1 Burner_1:1 | Temporary | Free | Yes | 0.5 | 0.00292 | |
| C03 | Case:1 Burner_2:1 | Temporary | Free | Yes | 0.5 | 0.00292 | |
| C04 | Case:1 Burner_2:2 | Temporary | Free | Yes | 0.5 | 0.00292 | |
| C05 | Case:1 Burner_3:1 | Temporary | Free | Yes | 0.5 | 0.00292 | |
| C06 | Burner_1:1 Cap_1:1 | Temporary | Free | Yes | 0.5 | 0.00292 | |
| C07 | Burner_2:1 Cap_2:1 | Temporary | Free | Yes | 0.5 | 0.00292 | |
| C08 | Burner_2:2 Cap_2:2 | Temporary | Free | Yes | 0.5 | 0.00292 | |
| C09 | Burner_3:1 Cap_3:1 | Temporary | Free | Yes | 0.5 | 0.00292 | |
| C10 | Case:1 Valve:1 | ISO_R 1051 - 2.5 × 6 × 2.00:1 | Permanent | Riveted | Yes | 11 | 0.06417 |
| C11 | Case:1 Valve:1 | ISO_R 1051 - 2.5 × 6 × 2.00:2 | Permanent | Riveted | Yes | 11 | 0.06417 |
| C12 | Case:1 Valve:2 | ISO_R 1051 - 2.5 × 6 × 2.00:3 | Permanent | Riveted | Yes | 11 | 0.06417 |
| C13 | Case:1 Valve:2 | ISO_R 1051 - 2.5 × 6 × 2.00:4 | Permanent | Riveted | Yes | 11 | 0.06417 |
| C14 | Case:1 Valve:3 | ISO_R 1051 - 2.5 × 6 × 2.00:5 | Permanent | Riveted | Yes | 11 | 0.06417 |
| C15 | Case:1 Valve:3 | ISO_R 1051 - 2.5 × 6 × 2.00:6 | Permanent | Riveted | Yes | 11 | 0.06417 |
| C16 | Case:1 Valve:4 | ISO_R 1051 - 2.5 × 6 × 2.00:7 | Permanent | Riveted | Yes | 11 | 0.06417 |
| C17 | Case:1 Valve:4 | ISO_R 1051 - 2.5 × 6 × 2.00:8 | Permanent | Riveted | Yes | 11 | 0.06417 |
| C18 | Case:1 Pipe_2:2 | ISO_R 1051 - 2.5 × 6 × 2.00:11 | Permanent | Riveted | Yes | 11 | 0.06417 |
| C19 | Case:1 Pipe_2:2 | ISO_R 1051 - 2.5 × 6 × 2.00:12 | Permanent | Riveted | Yes | 11 | 0.06417 |
| C20 | Case:1 Pipe_5:1 | ISO_R 1051 - 2.5 × 6 × 2.00:9 | Permanent | Riveted | Yes | 11 | 0.06417 |
| C21 | Case:1 Pipe_5:1 | ISO_R 1051 - 2.5 × 6 × 2.00:10 | Permanent | Riveted | Yes | 11 | 0.06417 |
| C22 | Case:1 Pipe_4:1 | ISO_R 1051 - 2.5 × 6 × 2.00:15 | Permanent | Riveted | Yes | 11 | 0.06417 |
| C23 | Case:1 Pipe_4:1 | ISO_R 1051 - 2.5 × 6 × 2.00:16 | Permanent | Riveted | Yes | 11 | 0.06417 |
| C24 | Case:1 Pipe_2:1 | ISO_R 1051 - 2.5 × 6 × 2.00:13 | Permanent | Riveted | Yes | 11 | 0.06417 |
| C25 | Case:1 Pipe_2:1 | ISO_R 1051 - 2.5 × 6 × 2.00:14 | Permanent | Riveted | Yes | 11 | 0.06417 |
| C26 | Pipe_1:1 Stub_end:1 | Pipe_1:1 Stub_end:1 | Permanent | Soldered | Yes | 16 | 0.09333 |
| C27 | Valve:1 Pipe_2:1 | Valve:1 Pipe_2:1 | Permanent | Soldered | Yes | 16 | 0.09333 |
| C28 | Valve:2 Pipe_4:1 | Valve:2 Pipe_4:1 | Permanent | Soldered | Yes | 16 | 0.09333 |
| C29 | Valve:3 Pipe_5:1 | Valve:3 Pipe_5:1 | Permanent | Soldered | Yes | 16 | 0.09333 |
| C30 | Valve:4 Pipe_2:2 | Valve:4 Pipe_2:2 | Permanent | Soldered | Yes | 16 | 0.09333 |
| C31 | Valve:1 Pipe_1:1 | Valve:1 Pipe_1:1 | Permanent | Soldered | Yes | 16 | 0.09333 |
| C32 | Valve:2 Pipe_1:1 | Valve:2 Pipe_1:1 | Permanent | Soldered | Yes | 16 | 0.09333 |
| C33 | Valve:3 Pipe_1:1 | Valve:3 Pipe_1:1 | Permanent | Soldered | Yes | 16 | 0.09333 |
| C34 | Valve:4 Pipe_1:1 | Valve:4 Pipe_1:1 | Permanent | Soldered | Yes | 16 | 0.09333 |
| C35 | Valve:1 Knob:1 | Valve:1 Knob:1 | Temporary | Pinned | Yes | 1 | 0.00583 |
| C36 | Valve:2 Knob:2 | Valve:2 Knob:2 | Temporary | Pinned | Yes | 1 | 0.00583 |
| C37 | Valve:3 Knob:3 | Valve:3 Knob:3 | Temporary | Pinned | Yes | 1 | 0.00583 |
| C38 | Valve:4 Knob:4 | Valve:4 Knob:4 | Temporary | Pinned | Yes | 1 | 0.00583 |
| Total: | 328.5 | 1.91629 | |||||
Table A2.
QTFI values for Variants 1–5 of the portable gas cooker.
Table A2.
QTFI values for Variants 1–5 of the portable gas cooker.
| Part Name | Variant 1 | Variant 2 | Variant 3 | Variant 4 | Variant 5 |
|---|---|---|---|---|---|
| Case:1 | 2 | 3 | 2 | 2 | 2 |
| Grill:1 | 1 | 1 | 1 | 1 | 1 |
| Burner_1:1 | 1 | 1 | 1 | 1 | 1 |
| Burner_2:1 | 1 | 1 | 1 | 1 | 1 |
| Burner_2:2 | 1 | 1 | 1 | 1 | 1 |
| Burner_3:1 | 1 | 1 | 1 | 1 | 1 |
| Cap_1:1 | 1 | 1 | 1 | 1 | 1 |
| Cap_2:1 | 1 | 1 | 1 | 1 | 1 |
| Cap_2:2 | 1 | 1 | 1 | 1 | 1 |
| Cap_3:1 | 1 | 1 | 1 | 1 | 1 |
| Valve:1 | 3 | 4 | 3 | 3 | 3 |
| Valve:2 | 3 | 4 | 3 | 3 | 3 |
| Valve:3 | 3 | 4 | 3 | 3 | 3 |
| Valve:4 | 3 | 4 | 3 | 3 | 3 |
| Pipe_2:2 | 2 | 3 | 2 | 2 | 2 |
| Pipe_5:1 | 2 | 3 | 2 | 2 | 2 |
| Pipe_4:1 | 2 | 3 | 2 | 2 | 2 |
| Pipe_2:1 | 2 | 3 | 2 | 2 | 2 |
| Pipe_1:1 | 1 | 1 | 1 | 1 | 1 |
| Stub_end:1 | 1 | 1 | 1 | 1 | 1 |
| Knob:1 | 1 | 1 | 1 | 1 | 1 |
| Knob:2 | 1 | 1 | 1 | 1 | 1 |
| Knob:3 | 1 | 1 | 1 | 1 | 1 |
| Knob:4 | 1 | 1 | 1 | 1 | 1 |
Table A3.
%FI [%] values for Variants 1–5 of the portable gas cooker.
Table A3.
%FI [%] values for Variants 1–5 of the portable gas cooker.
| Part Name | Variant 1 | Variant 2 | Variant 3 | Variant 4 | Variant 5 |
|---|---|---|---|---|---|
| Case:1 | 27.63 | 27.63 | 27.63 | 21.67 | 21.67 |
| Grill:1 | 1.32 | 1.32 | 1.32 | 1.67 | 1.67 |
| Burner_1:1 | 2.63 | 2.63 | 2.63 | 3.33 | 3.33 |
| Burner_2:1 | 2.63 | 2.63 | 2.63 | 3.33 | 3.33 |
| Burner_2:2 | 2.63 | 2.63 | 2.63 | 3.33 | 3.33 |
| Burner_3:1 | 2.63 | 2.63 | 2.63 | 3.33 | 3.33 |
| Cap_1:1 | 1.32 | 1.32 | 1.32 | 1.67 | 1.67 |
| Cap_2:1 | 1.32 | 1.32 | 1.32 | 1.67 | 1.67 |
| Cap_2:2 | 1.32 | 1.32 | 1.32 | 1.67 | 1.67 |
| Cap_3:1 | 1.32 | 1.32 | 1.32 | 1.67 | 1.67 |
| Valve:1 | 6.58 | 6.58 | 6.58 | 6.67 | 6.67 |
| Valve:2 | 6.58 | 6.58 | 6.58 | 6.67 | 6.67 |
| Valve:3 | 6.58 | 6.58 | 6.58 | 6.67 | 6.67 |
| Valve:4 | 6.58 | 6.58 | 6.58 | 6.67 | 6.67 |
| Pipe_2:2 | 3.95 | 3.95 | 3.95 | 3.33 | 3.33 |
| Pipe_5:1 | 3.95 | 3.95 | 3.95 | 3.33 | 3.33 |
| Pipe_4:1 | 3.95 | 3.95 | 3.95 | 3.33 | 3.33 |
| Pipe_2:1 | 3.95 | 3.95 | 3.95 | 3.33 | 3.33 |
| Pipe_1:1 | 6.58 | 6.58 | 6.58 | 8.33 | 8.33 |
| Stub_end:1 | 1.32 | 1.32 | 1.32 | 1.67 | 1.67 |
| Knob:1 | 1.32 | 1.32 | 1.32 | 1.67 | 1.67 |
| Knob:2 | 1.32 | 1.32 | 1.32 | 1.67 | 1.67 |
| Knob:3 | 1.32 | 1.32 | 1.32 | 1.67 | 1.67 |
| Knob:4 | 1.32 | 1.32 | 1.32 | 1.67 | 1.67 |
References
- McDonough, W.; Braungart, M. Cradle to Cradle: Remaking the Way We Make Things; North Point Press: Berkeley, CA, USA, 2002. [Google Scholar]
- MacArthur, E. Towards the Circular Economy: Economic and Business Rationale for an Accelerated Transition; Ellen MacArthur Foundation: Isle of Wight, UK, 2015. [Google Scholar]
- Kirchherr, J.; Reike, D.; Hekkert, M. Conceptualizing the circular economy: An analysis of 114 definitions. Resour. Conserv. Recycl. 2017, 127, 221–232. [Google Scholar] [CrossRef]
- Stahel, W.R. The circular economy. Nat. News 2016, 531, 435. [Google Scholar] [CrossRef]
- Bocken, N.M.P.; Pauw, I.d.; Bakker, C.; Grinten, B.v.d. Product design and business model strategies for a circular economy. J. Ind. Prod. Eng. 2016, 33, 308–320. [Google Scholar] [CrossRef]
- EN 45552:2020; General Method for the Assessment of the Durability of Energy-Related Products. European Committee for Standardization: Luxembourg, 2020. Available online: https://standards.iteh.ai/catalog/standards/cen/ed936aa8-4368-4a13-bae1-93ec80357a95/en-45552-2020 (accessed on 15 December 2023).
- Mesa, J.A.; Gonzalez-Quiroga, A.; Aguiar, M.F.; Jugend, D. Linking product design and durability: A review and research agenda. Heliyon 2022, 8, e10734. [Google Scholar] [CrossRef]
- Mesa, J.A. Design for circularity and durability: An integrated approach from DFX guidelines. Res. Eng. Des. 2023, 34, 443–460. [Google Scholar] [CrossRef]
- Wieser, H. Beyond Planned Obsolescence: Product Lifespans and the Challenges to a Circular Economy. GAIA-Ecol. Perspect. Sci. Soc. 2016, 25, 156–160. [Google Scholar] [CrossRef]
- Graedel, T.E.; Allenby, B.R. Industrial Ecology and Sustainable Engineering; Prentice Hall: Hoboken, NJ, USA, 2010. [Google Scholar]
- Ashby, M.F. Materials and the Environment: Eco-Informed Material Choice; Elsevier: Amsterdam, The Netherlands, 2013. [Google Scholar]
- Charter, M. Greener Marketing: A Responsible Approach to Business; Gower Publishing Ltd.: Aldershot, UK, 2009. [Google Scholar]
- Klöpffer, W. The Hitch Hiker’s Guide to LCA—An orientation in LCA methodology and application. Int. J. Life Cycle Assess. 2006, 11, 142. [Google Scholar] [CrossRef]
- Favi, C.; Germani, M. A Design for Disassembly approach: A case study on end-of-life strategies for household appliances. In Technology and Manufacturing Process Selection; Springer Series in Advanced Manufacturing; Henriques, E., Pecas, P., Silva, A., Eds.; Springer: London, UK, 2014. [Google Scholar] [CrossRef]
- Bressanelli, G.; Saccani, N.; Perona, M.; Baccanelli, I. Towards Circular Economy in the Household Appliance Industry: An Overview of Cases. Resources 2020, 9, 128. [Google Scholar] [CrossRef]
- Bressanelli, G.; Saccani, N.; Pigosso, D.C.A.; Perona, M. Circular Economy in the WEEE industry: A systematic literature review and a research agenda. Sustain. Prod. Consum. 2020, 23, 174–188. [Google Scholar] [CrossRef]
- Hernandez, R.J. Sustainable Product-Service Systems and Circular Economies. Sustainability 2019, 11, 5383. [Google Scholar] [CrossRef]
- Bakker, C.; Wang, F.; Huisman, J.; Hollander, M.d. Products that go round: Exploring product life extension through design. J. Clean. Prod. 2014, 69, 10–16. [Google Scholar] [CrossRef]
- Fofou, R.F.; Jiang, Z.; Wang, Y. A Review on the Lifecycle Strategies Enhancing Remanufacturing. Appl. Sci. 2021, 11, 5937. [Google Scholar] [CrossRef]
- Henriques, R.; Figueiredo, F.; Nunes, J. Product-Services for a Resource-Efficient and Circular Economy: An Updated Review. Sustainability 2023, 15, 12077. [Google Scholar] [CrossRef]
- Geyer, R.; Jambeck, J.R.; Law, K.L. Production, use, and fate of all plastics ever made. Sci. Adv. 2017, 3, e1700782. [Google Scholar] [CrossRef]
- Stahel, W.R. The Circular Economy: A User’s Guide, 1st ed.; Routledge: London, UK, 2019. [Google Scholar] [CrossRef]
- Mang, P.; Haggard, B. Regenerative Development: A Framework for Evolving Sustainability; John Wiley & Sons: Hoboken, NJ, USA, 2016. [Google Scholar] [CrossRef]
- Ghisellini, P.; Cialani, C.; Ulgiati, S. A review on circular economy: The expected transition to a balanced interplay of environmental and economic systems. J. Clean. Prod. 2016, 114, 11–32. [Google Scholar] [CrossRef]
- Morseletto, P. Restorative and regenerative: Exploring the concepts in the circular economy. J. Ind. Ecol. 2020, 24, 763–773. [Google Scholar] [CrossRef]
- Yusuf, M.; Ibrahim, H. A comprehensive review on recent trends in carbon capture, utilization, and storage techniques. J. Environ. Chem. Eng. 2023, 11, 111393. [Google Scholar] [CrossRef]
- Hanifa, M.; Agarwal, R.; Sharma, U.; Thapliyal, P.C.; Singh, L.P. A review on CO2 capture and sequestration in the construction industry: Emerging approaches and commercialised technologies. J. CO2 Util. 2023, 67, 102292. [Google Scholar] [CrossRef]
- Yaashikaa, P.R.; Senthil Kumar, P.; Saravanan, A.; Dai-Viet, N.V. Advances in biosorbents for removal of environmental pollutants: A review on pretreatment, removal mechanism and future outlook. J. Hazard. Mater. 2021, 420, 126596. [Google Scholar] [CrossRef]
- Ray, S.; Chaturvedi, V.; Ganesan, K.; Ghosh, A. India’s Intended Nationally Determined Contributions: Renewable Energy and the Pathway to Paris, CEEW Policy Brief 2015; Thapar House: New Delhi, India, 2015. [Google Scholar]
- Communication from the Commission to the European Parliament, The European Council, The Council, The European Economic and Social Committee and The Committee of The Regions The European Green Deal. 2019. Available online: https://eur-lex.europa.eu/legal-content/EN/TXT/?uri=CELEX:52019DC0640 (accessed on 8 January 2024).
- Sodhi, R.; Sonnenberg, M.; Das, S. Evaluating the unfastening effort in design for disassembly and serviceability. J. Eng. Des. 2004, 15, 69–90. [Google Scholar] [CrossRef]
- Vanegas, P.; Peeters, J.R.; Cattrysse, D.; Tecchio, P.; Ardente, F.; Mathieux, F.; Dewulf, W.; Duflou, J.R. Ease of disassembly of products to support circular economy strategies. Resour. Conserv. Recycl. 2018, 135, 323–334. [Google Scholar] [CrossRef]
- Desai, A.; Mital, A. Evaluation of disassemblability to enable design for disassembly in mass production. Int. J. Ind. Ergon. 2003, 32, 265–281. [Google Scholar] [CrossRef]
- Martínez Leal, J.; Pompidou, S.; Charbuillet, C.; Perry, N. Design for and from Recycling: A Circular Ecodesign Approach to Improve the Circular Economy. Sustainability 2020, 12, 9861. [Google Scholar] [CrossRef]
- Rzeźnik, C.; Rybacki, P.; Molińska, A. Assessment of the effect of the material diversity of agricultural machines on their recyclability. J. Res. Appl. Agric. Eng. 2008, 53, 12–15. [Google Scholar]
- Dostatni, E. Recycling assessment measures implemented in the system (in Polish: Miary oceny recyklingowej zaimplementowane w systemie). In Ecodesign of Products in CAD 3D Environment with the Use of Agent Technology; Dostatni, E., Ed.; PUT Publishing House: Poznań, Poland, 2014; pp. 89–93. [Google Scholar]
- Grajewski, D. Assessment example based on recycling product model (in Polish: Przykład oceny opartej na recyklingowym modelu wyrobu). In Ecodesign of Products in CAD 3D Environment with the Use of Agent Technology; Dostatni, E., Ed.; PUT Publishing House: Poznań, Poland, 2014; pp. 127–155. [Google Scholar]
- Aguiar, J.d.; Oliveira, L.d.; Silva, J.O.d.; Bond, D.; Scalice, R.K.; Becker, D. A design tool to diagnose product recyclability during product design phase. J. Clean. Prod. 2017, 141, 219–229. [Google Scholar] [CrossRef]
- Kroll, E.ł.; Hanft, T.A. Quantitative evaluation of product disassembly for recycling. Res. Eng. Des. 1998, 10, 1–14. [Google Scholar] [CrossRef]
- Diakun, J. Recycling product model (in Polish: Recyklingowy model wyrobu). In Ecodesign of Products in CAD 3D Environment with the Use of Agent Technology; Dostatni, E., Ed.; PUT Publishing House: Poznań, Poland, 2014; pp. 57–66. [Google Scholar]
- Berge, C. Graphs and Hypergraphs; Springer: North-Holland, The Netherlands, 1973. [Google Scholar]
- Directive 2012/19/EU of the European Parliament and of the Council of 4 July 2012 on Waste Electrical and Electronic Equipment (WEEE). Available online: https://eur-lex.europa.eu/legal-content/EN/ALL/?uri=CELEX%3A32012L0019 (accessed on 23 August 2023).
- Wichniarek, W. Implementation of recycling product model in CAD 3D system (in Polish: Implementacja recyklingowego modelu wyrobu w systemie CAD 3D). In Ecodesign of Products in CAD 3D Environment with the Use of Agent Technology; Dostatni, E., Ed.; PUT Publishing House: Poznań, Poland, 2014; pp. 67–88. [Google Scholar]
- Dostatni, E. Agent system aiding recycling assessment of product (in Polish: System agentowy wspomagający recyklingową ocenę wyrobu). In Ecodesign of Products in CAD 3D Environment with the Use of Agent Technology; Dostatni, E., Ed.; PUT Publishing House: Poznań, Poland, 2014; pp. 99–126. [Google Scholar]
- Ordinance of the Council of Ministers Regarding the Amount of the Minimum Remuneration and the Minimum Hourly Rate in 2023. Available online: https://isap.sejm.gov.pl/isap.nsf/DocDetails.xsp?id=WDU20220001952 (accessed on 23 August 2023).
Disclaimer/Publisher’s Note: The statements, opinions and data contained in all publications are solely those of the individual author(s) and contributor(s) and not of MDPI and/or the editor(s). MDPI and/or the editor(s) disclaim responsibility for any injury to people or property resulting from any ideas, methods, instructions or products referred to in the content. |
© 2024 by the author. Licensee MDPI, Basel, Switzerland. This article is an open access article distributed under the terms and conditions of the Creative Commons Attribution (CC BY) license (https://creativecommons.org/licenses/by/4.0/).