Article

Can Environmental, Social, and Governance Ratings Promote Green Innovation in Chinese Heavy Polluters? Perspectives from “Greening” Behaviors

College of Economics and Management, Zhengzhou University of Light Industry, Zhengzhou 450001, China
*
Author to whom correspondence should be addressed.
Sustainability 2024, 16(7), 2842; https://doi.org/10.3390/su16072842
Submission received: 19 January 2024 / Revised: 25 March 2024 / Accepted: 26 March 2024 / Published: 28 March 2024
(This article belongs to the Section Economic and Business Aspects of Sustainability)

Abstract

:
Environmental, social, and governance (ESG) ratings are gaining momentum in China, but their capacity to induce green innovation among heavy polluters remains to be proven. Based on the green patent data from listed heavy-polluting enterprises in China from 2010 to 2020, this paper empirically analyzes the mechanism of ESG ratings and their impact on green innovation using a multi-temporal double-difference method. The findings indicate that ESG ratings effectively promote green innovation in heavily polluting firms. The mechanism test reflects that ESG ratings can enhance the enterprises’ green innovation capacities by alleviating their financing constraints and enhancing their corporate risk-taking abilities. Further analysis reveals that the incentive effect of ESG ratings on green innovation lies in considering both source control and end-of-pipe management by addressing their environmental responsibilities and actively engaging in green innovation activities. This facilitative effect is more significant in non-state-owned enterprises (NSOEs) and large-scale enterprises. Overall, these insights provide empirical evidence to advance green innovation in heavy-polluting enterprises.

1. Introduction

Green innovation represents the future of China’s economy. Combining the principles of greenness and innovation, it is committed to maximizing the comprehensive benefits of technology, resources, economy, and environment, serving as a core driving force and a realistic requirement for regional high-quality development [1,2]. Heavy-polluting enterprises are central to green innovation, as their ability to achieve energy saving, emission reduction, and green development determines the success of sustainable development strategy in China. China’s existing environmental policies mostly adhere to Porter’s hypothesis. It argues that well-designed environmental regulations can furnish enterprises with information and incentives for technological innovation and lead to an “innovation compensation effect” and “first-mover advantage” for enterprises in the long run [3]. However, the effect of environmental policies that have been in place for many years has not been satisfactory [4], with ineffective law enforcement by local governments and even collusion between the government and enterprises. These challenges have resulted in a “softening” of environmental regulation. Consequently, China’s ecological and environmental situation is still serious [5]. The relationship between coercive policies and green innovation strategies demonstrates an inverted U-shape, where moderate coercive policies can effectively promote the implementation of green innovation strategies by enterprises. However, excessively high or low coercive policies may dissuade enterprises from adopting green innovation strategies [6].
As a result, aiming at decreasing resource depletion and environmental pollution, China has introduced the environmental, social, and governance (ESG) rating system as a market mechanism, which is not legally enforceable, to incentivize relevant enterprises to engage in green innovation activities and enhance their sustainable development capabilities. ESG ratings, serving as a comprehensive assessment methodology that considers environmental, social, and governance factors, have attracted widespread attention from investors to evaluate the sustainable performance of companies from a more holistic perspective [7]. Compared with the mandatory pressure of environmental regulations, ESG ratings, as a third-party regulatory tool, exert normative pressure from the external market in a “bottom-up” fashion, compelling companies to proactively initiate changes and actively engage in green innovation activities [8]. Under the leadership of the “dual carbon” goal, China’s ESG development has accelerated. According to the China Association of Listed Companies, the number of ESG-related reports issued by A-share listed companies increased from 371 in 2009 to 1738 by the end of June 2023, with the disclosure rate of 34%. Notably, the ESG disclosure rate of Sino-Securities 300 exceeds 90%. ESG, as an important value driver for sustainable development, is increasingly acknowledged by both real enterprises and investment institutions.
With the promotion of ESG, the positive impact of ESG ratings on corporate investment efficiency, financial performance, corporate value, and stock market performance has been demonstrated in research [9,10,11,12,13]. However, some scholars have raised concerns about potential “greenwashing” behavior resulting from ESG ratings. They argue that conducting environmental testing and establishing an ESG system may require substantial capital investment and not yield short-term benefits. Therefore, companies have an incentive to divert public opinion through “greenwashing” behavior to mislead the public and seize undue advantages [14,15,16]. Lax regulatory penalties have also been the main reason for the prevalence of “greenwashing” in recent years. China has not clarified the penalties for “greenwashing” in the ESG field, resulting in a very low cost of non-compliance and further exacerbating the “greenwashing” behavior among domestic companies [17]. Considering the possible “greenwashing” behavior of heavy polluters, it remains to be explored whether the ESG ratings really promote the green activities among them and effectively enhance their green innovation capabilities.
In this research, the ESG rating is regarded as an exogenous market shock event. Meanwhile, we adopt a multi-time-point difference in difference (DID) approach to explore the impact of ESG ratings on the green innovation of listed heavily polluting enterprises in China. The results reveal the following:
(1)
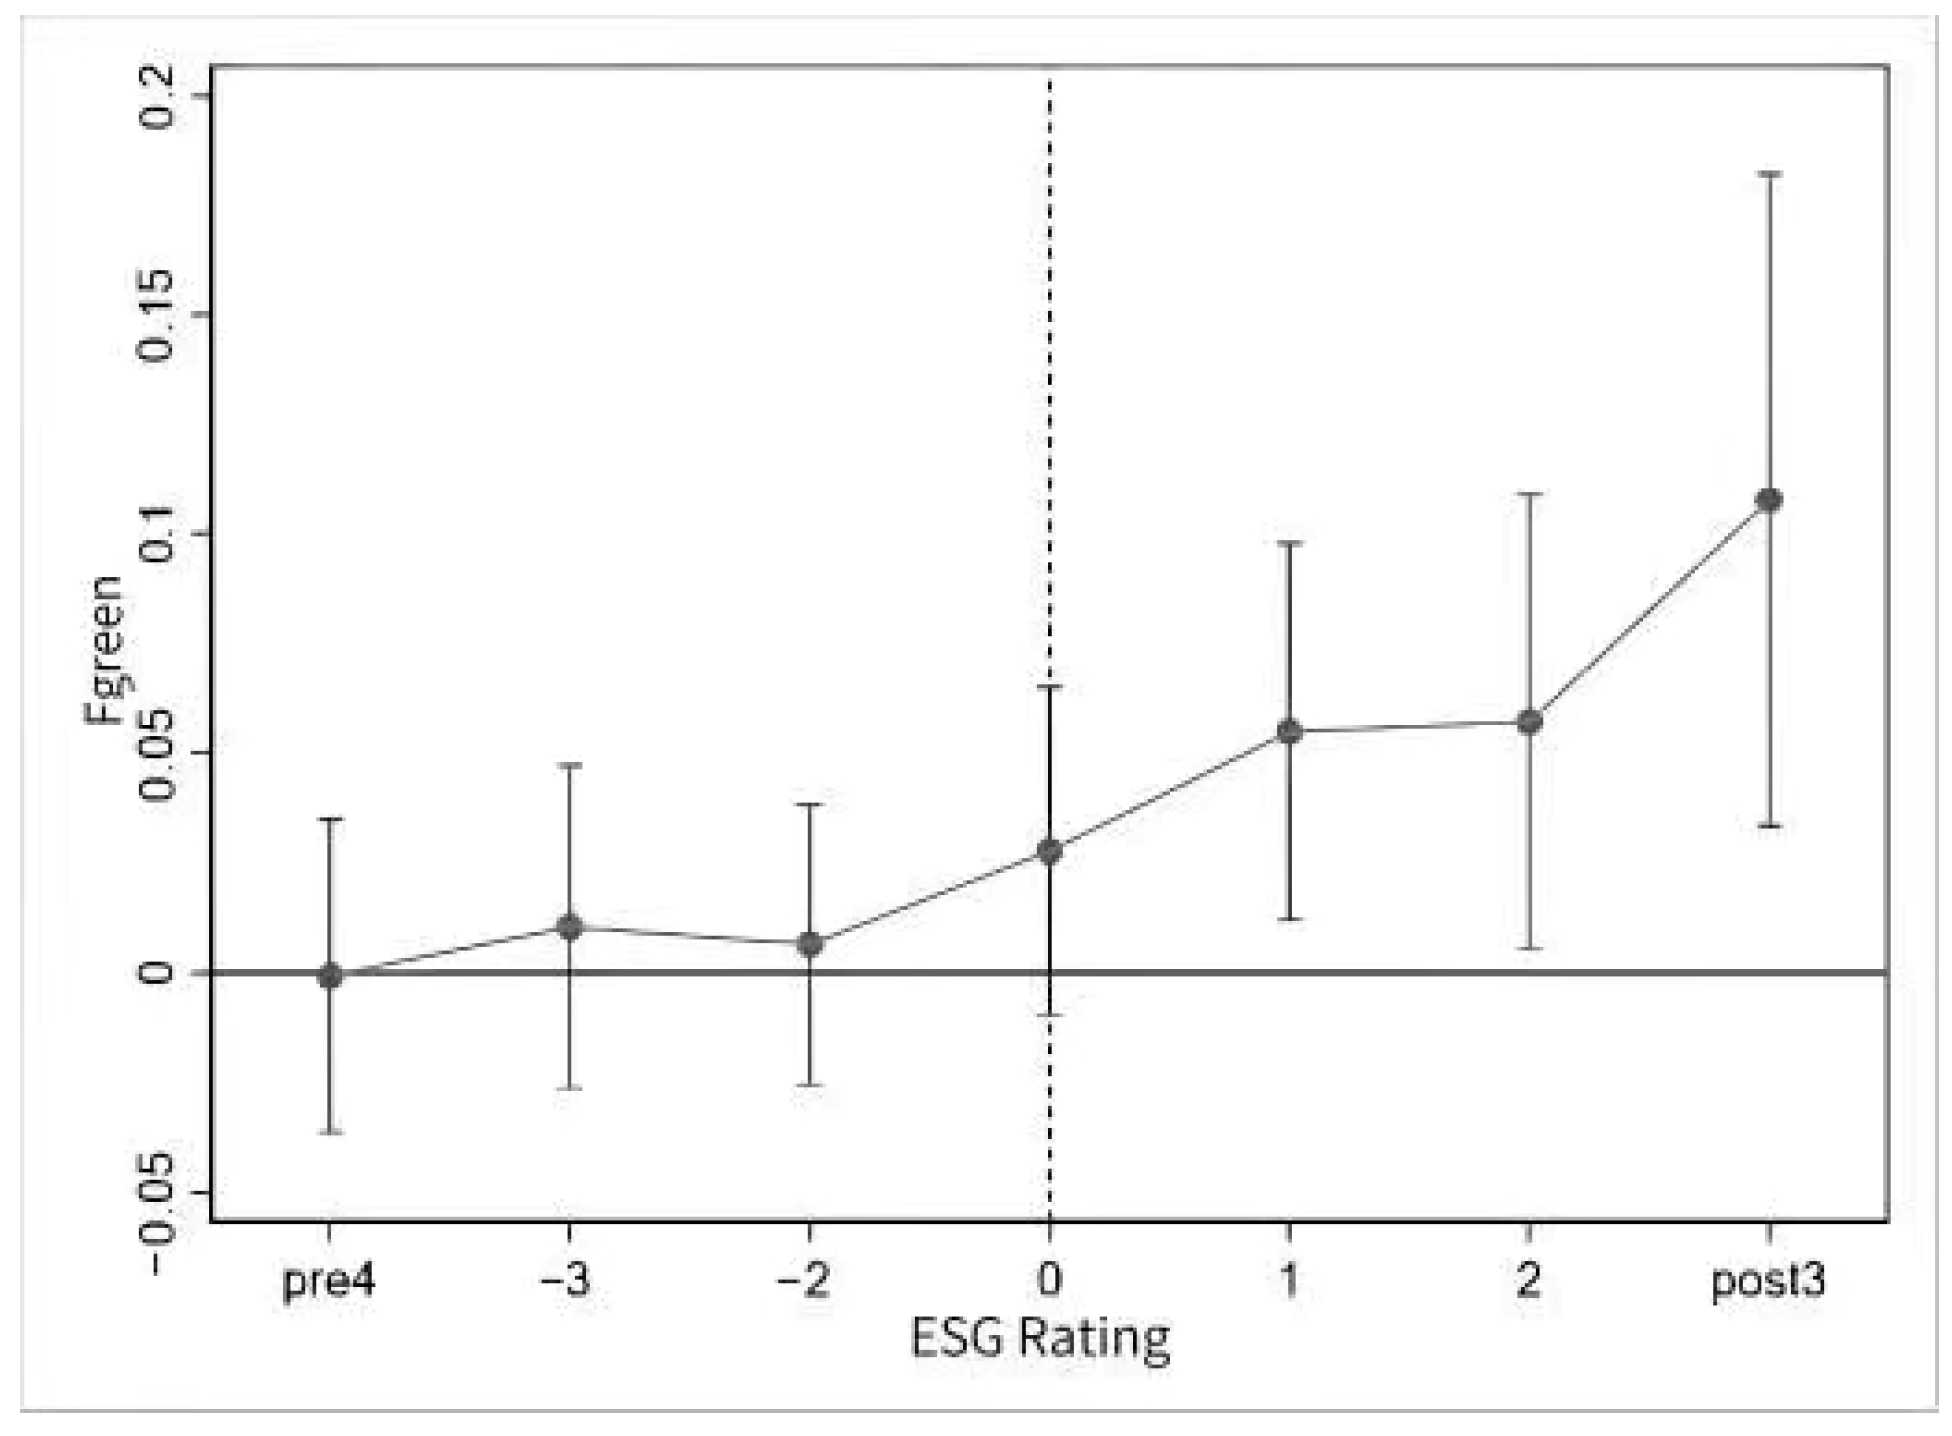
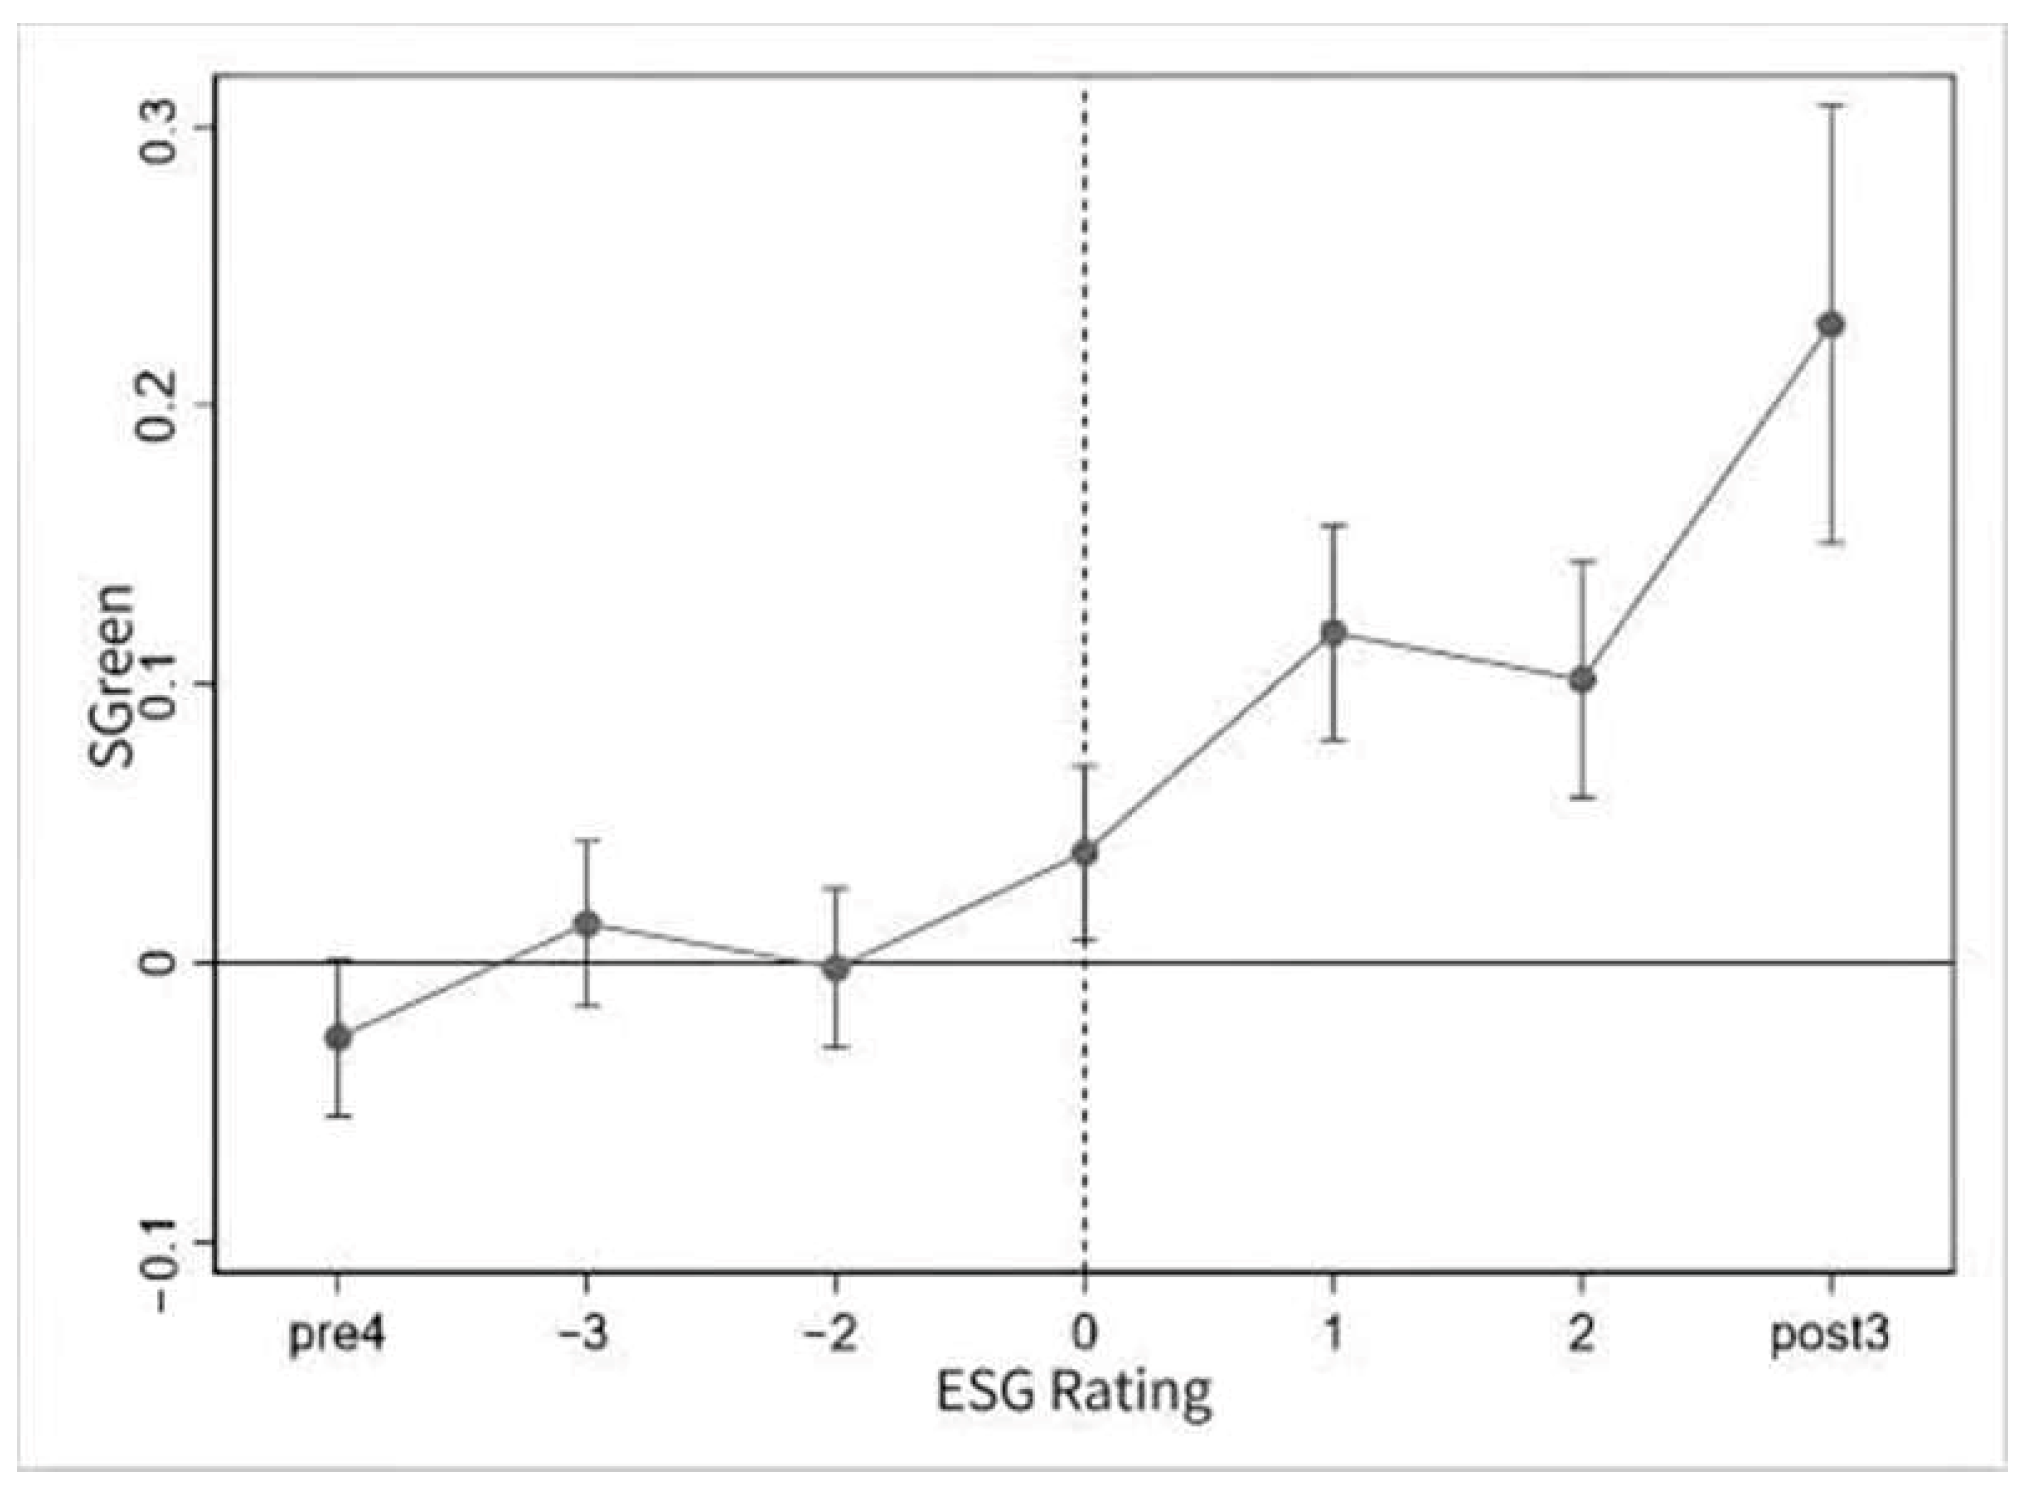
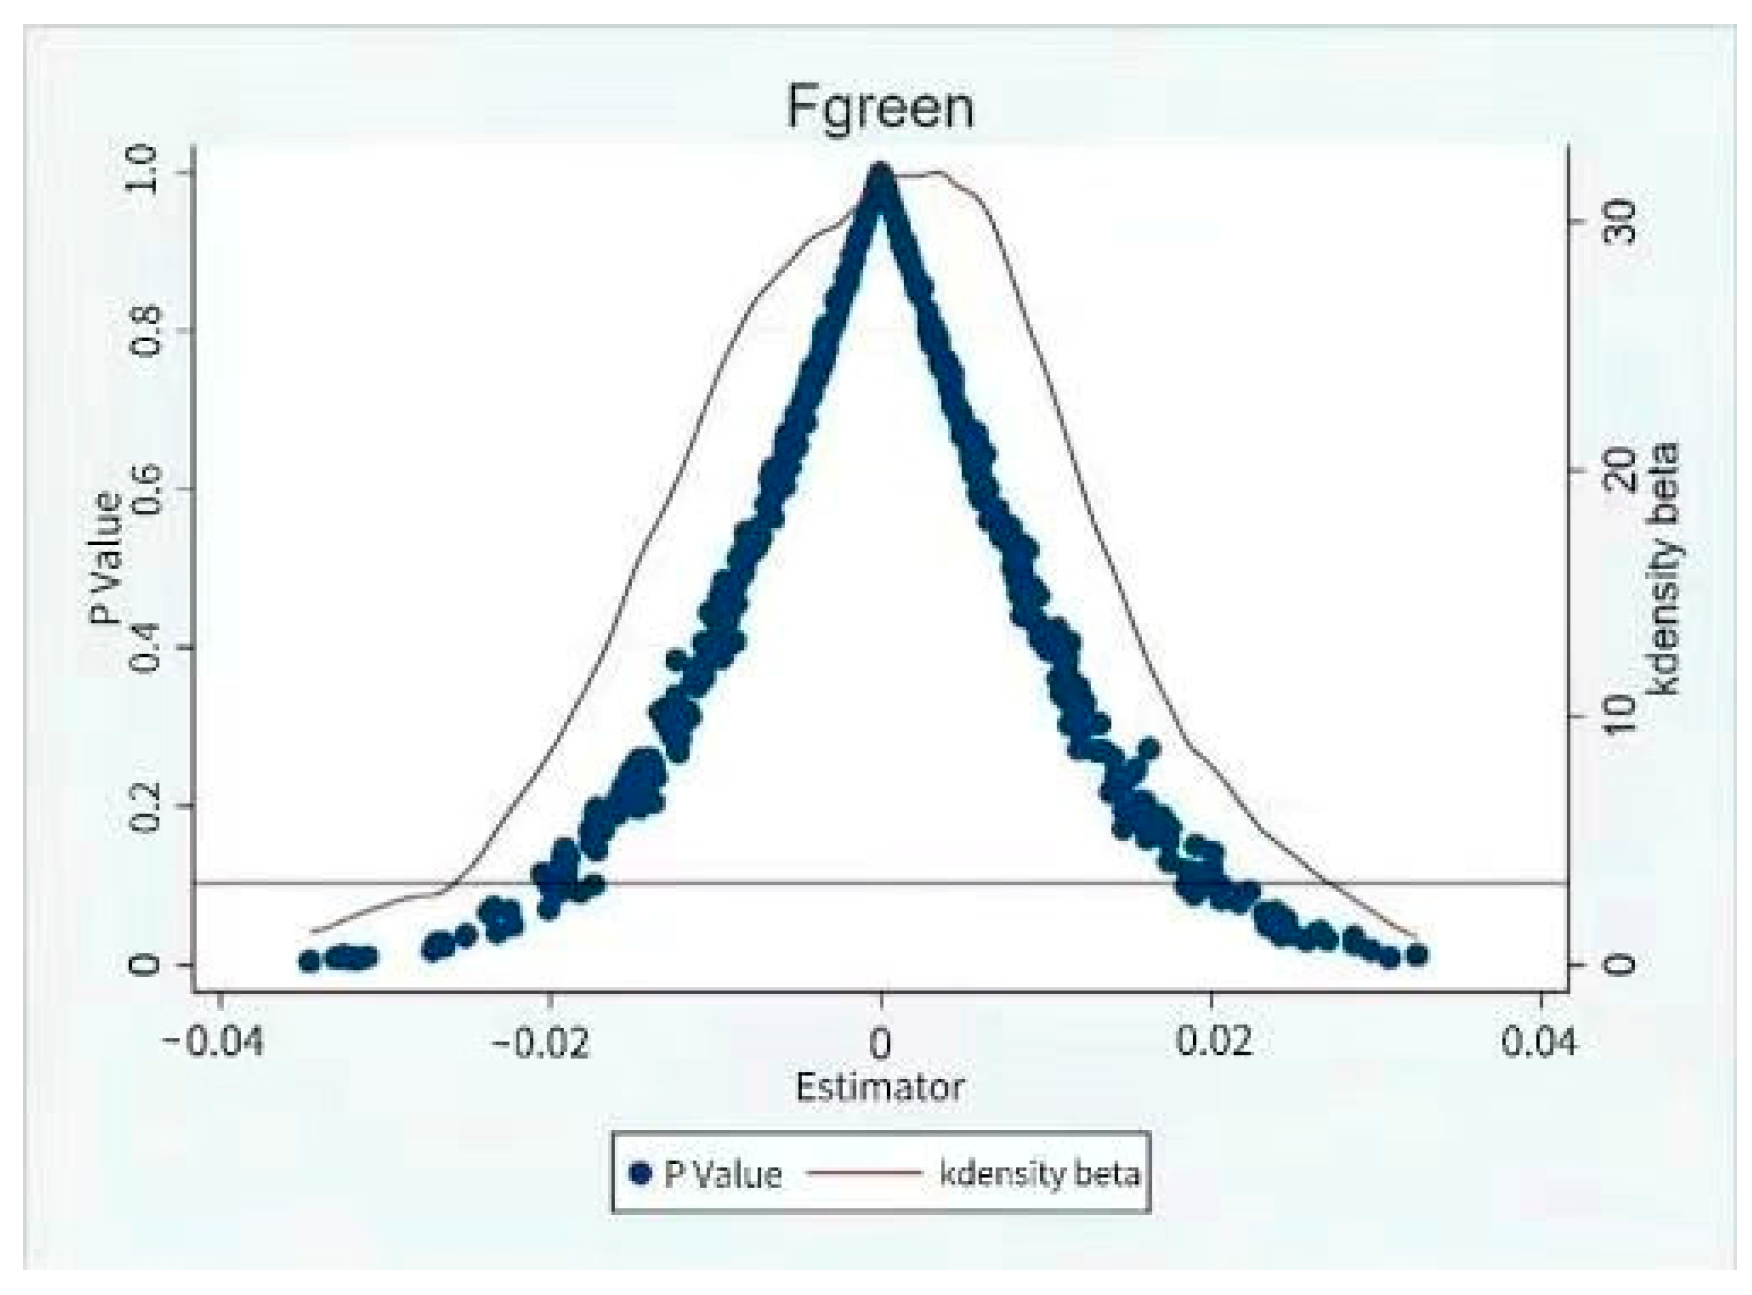
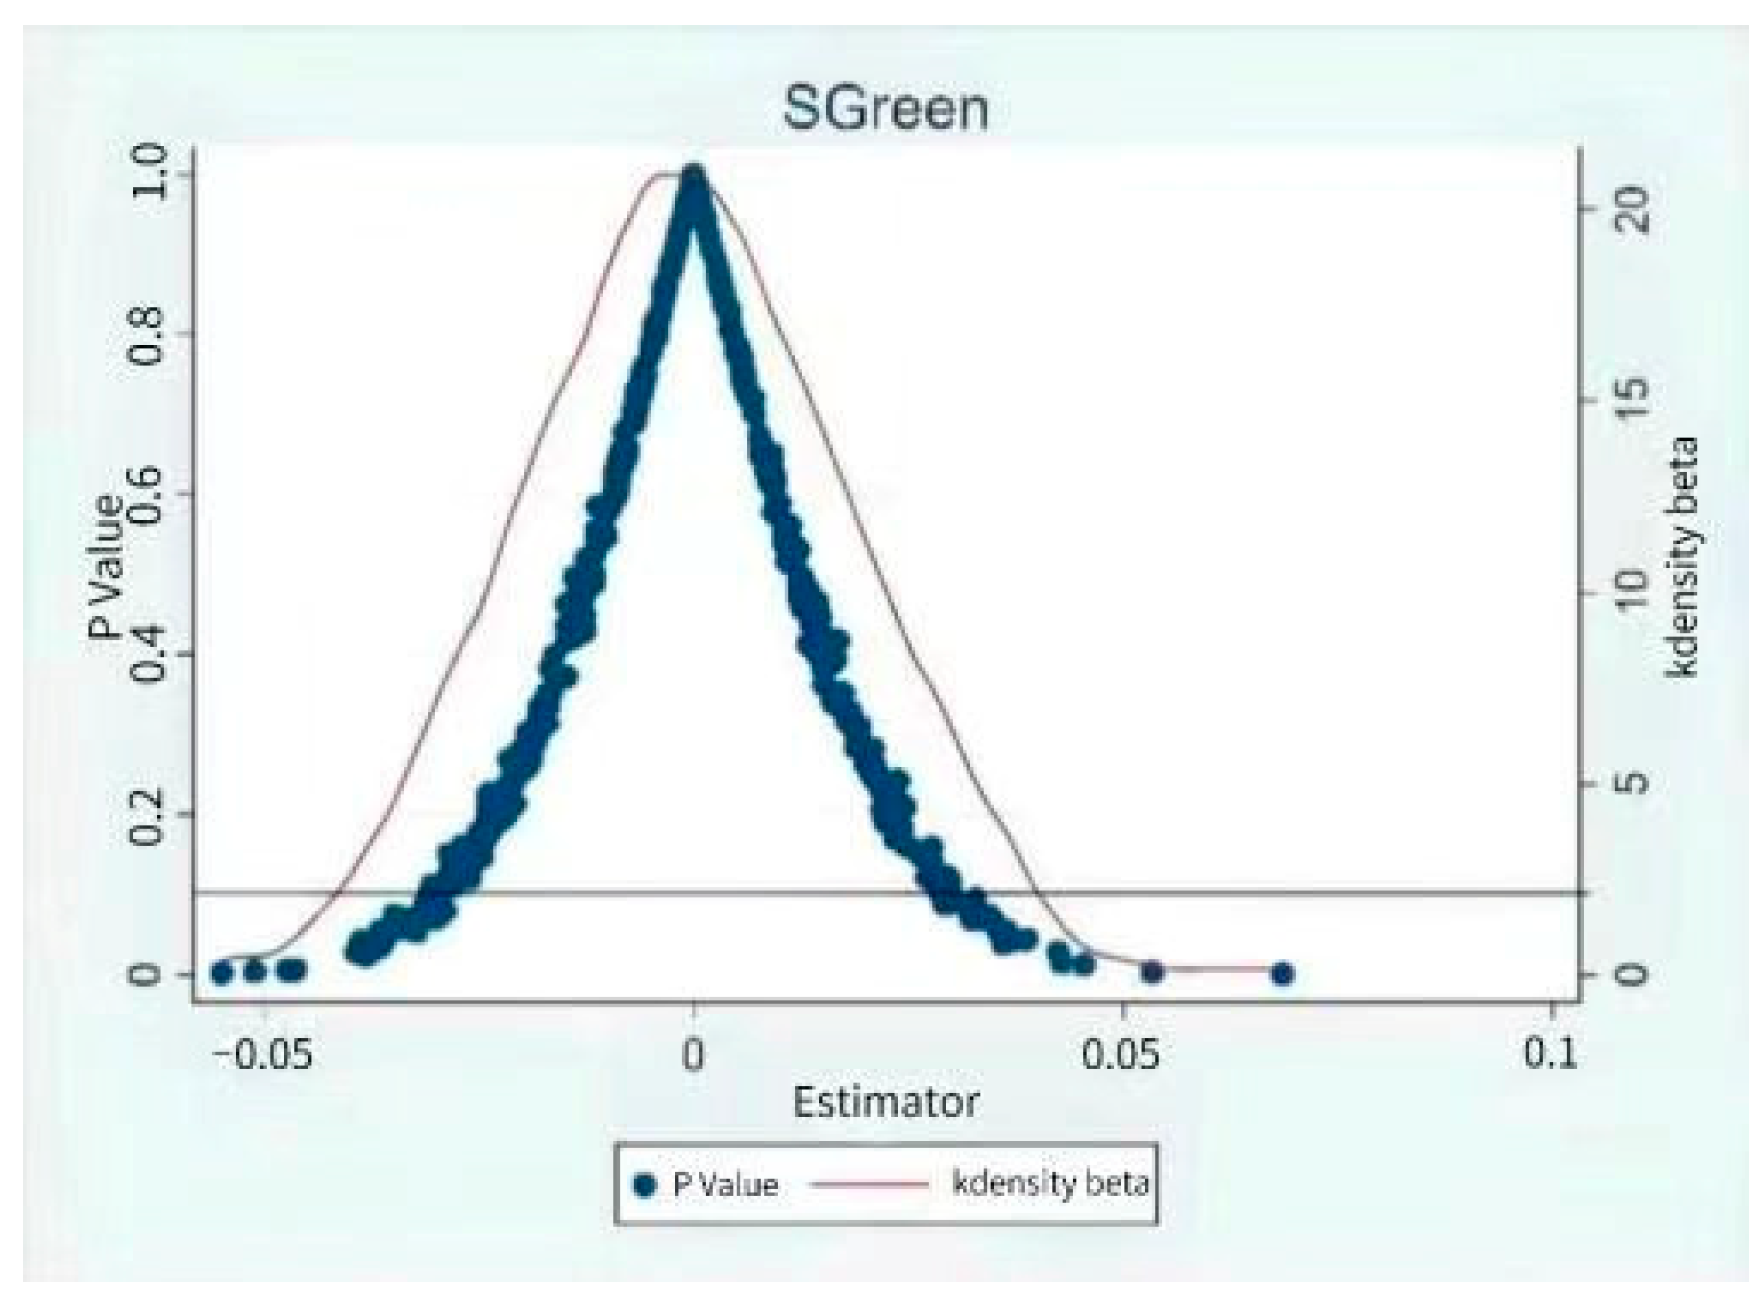
The implementation of ESG ratings exerts a significant positive impact on listed companies in heavily polluting industries, reflected in the increased number and citation frequency of green patent applications. This quantitatively and qualitatively confirms that the ESG ratings can effectively enhance the green innovation capabilities of high-polluting enterprises. Moreover, this conclusion is further verified and consolidated through a series of robustness tests, including parallel trend tests, placebo experiments, variable substitution, and adjustments during the regression.
(2)
ESG ratings play a key role in reducing financing constraints and increasing risk-taking, thereby promoting green innovation in high-polluting enterprises. Due to the inherent uncertainty of innovation activities, enterprises should pay attention to stable and continuous financial support. In addition, the acceptance of risk by management and external stakeholders also determines the enterprise’s ability to engage in green innovation activities. Therefore, ESG ratings, by alleviating financing constraints and enhancing the risk-bearing capacity of internal and external stakeholders, facilitate the progress of enterprises in green innovation.
(3)
More obviously, ESG ratings significantly enhance the green innovation capabilities of private and large enterprises. This difference may stem from the government credit endorsements and broader financing channels of state-owned enterprises (SOEs) as well as the direct participation of party organizations in major decisions. This, in turn, limits the impact of ESG ratings on easing financing constraints and enhancing risk-taking capabilities. In contrast, the ESG ratings demonstrate a limited effect on small and medium-sized enterprises because they often face resource scarcity and tend to pursue certain development and survival rather than investing in risky innovation projects that may yield returns. Furthermore, our research reveals that ESG ratings not only promote the end-of-pipe governance in heavily polluting enterprises but also strengthen source governance, thereby advancing environmental protection and sustainable development practices throughout the governance chain.
The marginal contributions of this research are primarily reflected in the following aspects:
Firstly, previous research has focused more on the role of government regulation and support as well as the impact of intrinsic corporate characteristics, with relatively less discussion on market factors [18,19,20,21,22]. This research reveals, from the perspective of market incentives, how ESG ratings function as effective market information transmission mechanisms and significantly promote green innovation in listed companies in the heavily polluting industries of China. For this purpose, a theoretical analysis framework is constructed, and strong empirical evidence is provided, offering new insights and references for academics and policymakers.
Secondly, we expanded the scope of traditional credit market research by shifting the focus from the information asymmetry among financing entities to the influence of market incentive mechanisms [23,24]. With special attention to the market ESG rating, this research analyzes how it acts as an information intermediary in the credit market to transmit signals and mitigate information asymmetry. Furthermore, based on the role of market incentive mechanisms, it alleviates corporate financing constraints, increases stakeholders’ risk-bearing willingness, and stimulates corporate investment and outcomes in green innovation, thus promoting sustainable development.
Lastly, our research is subjected to the following relevance and significance for stakeholders. For government departments, “voluntary regulation” in the Chinese market, such as ESG ratings, can provide effective, flexible, and dynamic incentives. This conclusion yields theoretical and empirical support for the government to exert its role in market coordination, facilitating the formulation of more precise and matching policies to market development, thus promoting the long-term interests of enterprises. Moreover, our research reveals the signaling effect of ESG ratings for enterprises. Specifically, the ESG ratings help enterprises to convey their commitment to environmental and social responsibilities. Furthermore, they provide investors and regulatory agencies with new means to assess corporate value and risk, aiding them in making wiser investment and regulatory decisions. Overall, this research highlights the importance of market incentive mechanisms in promoting the green development of enterprises and enhancing the overall welfare of society, thereby providing new insights and strategies for sustainable corporate development.
The subsequent content of this article is arranged as follows. The second part elaborates on the institutional background of this research, develops theoretical derivations, and proposes research hypotheses. The third part describes the data sources, empirical models, and descriptive statistics adopted. The fourth part presents the main empirical results of ESG ratings and green innovation in heavily polluting enterprises and then analyzes the intrinsic mechanisms. The fifth section explores whether ESG ratings improve both source control and end-of-pipe governance for green innovation and analyzes the heterogeneity in the relationship between ESG ratings and green innovation in heavily polluting enterprises. Subsequently, the sixth part summarizes and discusses the main findings of this research and gives relevant policy recommendations.

2. Institutional Background, Theoretical Analysis, and Research Hypothesis

2.1. Institutional Background

In the historical context of China’s economic development, environmental issues have consistently occupied a pivotal position. During the era of planned economy, industrialization often came at the expense of the environment, leading to resource depletion and environmental pollution, with insufficient awareness regarding environmental protection among enterprises and citizens. Since the inception of the reform and opening-up policy in 1978, marking China’s transition from a planned to a market-oriented economy, environmental policies have undergone a multi-stage evolution. Initially, environmental protection primarily served the planned economy, relying heavily on mandatory regulations. Various government laws and regulations were utilized to restrict market participants, aiming to maintain market order and social stability. However, with the establishment of the socialist market economy system, environmental regulatory policies have shifted from a singular focus on “pollution prevention” to embracing the broader concept of “ecological civilization”. This shift signifies a deeper understanding of environmental issues and a commitment to pursuing sustainable development. In this evolutionary process, the limitations of mandatory regulations gradually became apparent, especially in promoting innovation and adapting to dynamic market conditions. Analyzing the evolution of China’s environmental regulatory policies against the backdrop of market economy development reveals a transition from reliance on mandatory regulation toward market-driven transformation. This highlights the evolving role of the government in environmental protection, gradually shifting from direct intervention to leveraging market mechanisms and social forces. Especially in the process of the dual carbon goals, carbon peaking, and carbon neutrality, the importance of market participation has become increasingly prominent.
Market participants, including enterprises, third-party institutions, and citizens, have been endowed with increased responsibilities and autonomy to innovate and adapt to rapidly evolving market demands. This shift promotes innovation in environmental protection technologies and management approaches, enhances resource utilization efficiency, and promotes the progression of a green economy. Concurrently, the introduction of market mechanisms such as carbon trading and ESG ratings provides the possibility of achieving a win-win outcome for environmental protection and economic development.
Overall, the evolution of China’s environmental initiatives represents a transition from government-led to market-driven transformation, facilitating environmental protection and establishing the groundwork for sustainable economic development. With the proposal and implementation of the dual carbon goals, market participants will exert increasingly pivotal effects, while the government will continue to play its role in policy formulation and regulation to achieve the environmental protection goals.
China’s economic and institutional context provides this research with a unique perspective and advantage. Firstly, with the active involvement and guidance of the government, the Chinese market exhibits distinct characteristics from those of other countries, presenting a rich case study for examining the effectiveness of market tools under diverse institutional frameworks. Secondly, the continuous development and improvement of the Chinese market serve as a testing ground for exploring market incentive mechanisms, helping to reveal the potential effects and trajectories of such mechanisms. These characteristics render this research academically pioneering and forward-looking, while also ensuring the rigor and practical applicability of the research results. Lastly, as the world’s second-largest economy, China boasts a diversified industrial landscape and regional distribution, and the breadth and diversity of company samples provide sufficient credibility and extensibility for the research.

2.2. Theoretical Analysis and Research Hypothesis

2.2.1. ESG Ratings and Corporate Green Innovation

In China, with the increasing emphasis on the concept of green sustainable development, heavy-polluting enterprises characterized by high energy consumption and pollution are facing unprecedented challenges. Meanwhile, they have drawn significant attention from the government and the public in various dimensions, such as environmental protection, social responsibility fulfillment, and governance. The emergence of ESG ratings has rendered the environmental costs of these enterprises more transparent. Faced with external pressure from public opinion and regulation, these enterprises are motivated to seek green innovation to adapt to the constantly evolving external environment and mitigate ESG risks. ESG ratings not only afford enterprises an opportunity to demonstrate their potential for green development but also exert a positive impact on green innovation in terms of resource allocation optimization, governance structure enhancement, and innovation in incentive mechanisms [25].
Firstly, ESG ratings rely on the information disclosed by companies concerning their environmental protection and social responsibilities. They can reflect whether heavily polluting enterprises are actively assuming responsibility and adhering to the principles of sustainable development. Green innovation, as a risky and uncertain activity, needs substantial sustained financial support in its initial stages. ESG ratings, through signaling, guide the influx of investor funds by garnering policy support, such as tax incentives and government grants, to generate a resource effect on green innovation and reduce the financial burden on corporations [26]. Secondly, ESG ratings improve corporate information transparency and effectively mitigate information asymmetry among corporate stakeholders [27]. Based on the stakeholder theory, studies have scrutinized the factors driving corporate “greenwashing” behavior and concluded that such behavior is complex and usually involves interactions among multiple stakeholders. The lack of effective supervision of management’s speculative actions, motivated by economic benefits and the avoidance of regulatory penalties, is a primary driver behind the “greenwashing” of enterprises [28]. Therefore, promoting the effectiveness of supervision can partially inhibit the “greenwashing” behavior of enterprises. As an important external governance mechanism in the capital market, ESG ratings are issued by practitioners with professional knowledge backgrounds, facilitating the identification of “greenwashing” behaviors of corporate managers. The ESG ratings issued by them are closely scrutinized by the public and the media, which reduces the cost of monitoring the management by external investors [29]. As a result, strengthening external supervision can effectively curb managerial opportunism, promoting management to allocate corporate resources, improve governance practices, actively fulfill social responsibilities, and mitigate the risk of corporate “greenwashing” by addressing agency problems and optimizing internal controls, thus exerting a governance effect on green innovation [30]. Furthermore, in the context of promoting the development of a green economy, innovation becomes an indispensable means for heavily polluting enterprises to break through the limitations caused by high emissions and high pollution and eliminate backward production capacity. ESG ratings, as a soft market regulatory tool, exert an incentive effect on green innovation, motivating enterprises to proactively enhance their production processes, ramp up research and development efforts in areas such as green technology and green products, elevate the levels of green innovation, improve the resource utilization efficiency, and achieve the long-term sustainable development of enterprises. Finally, while the issue of greenwashing cannot be overlooked in ESG ratings, it is particularly challenging within China’s heavily polluting industrial sectors due to stringent legal and environmental regulations [31]. Such industries face significant barriers and costs associated with greenwashing, making them susceptible to market backlash, reputational harm, and reduced stakeholder support, ultimately impacting their performance [32]. Thus, compared to greenwashing, ESG ratings are more likely to truly promote substantial progress in green innovation for these enterprises. Based on the above analysis, this research proposes the following research hypothesis:
Hypothesis 1. 
ESG ratings promote green innovation of heavily polluting companies.

2.2.2. ESG Ratings, Financing Constraints, and Green Innovation

The high-input and high-risk characteristics of green innovation activities require enterprises to secure financial support from external sources [33]. With the growing societal awareness of sustainable development and environmental protection, ESG ratings have emerged as a crucial tool for enterprises to gain investors’ trust and financial support in the financing market. Firstly, ESG ratings can improve the management level and transparency of enterprises. Driven by ESG ratings, enterprises are compelled to comprehensively review their environmental, social, and governance performance as well as continuously improve and enhance their management level. Additionally, ESG ratings require companies to disclose relevant information and data to enhance their transparency and credibility. These initiatives bolster the operational efficiency and management level of enterprises, reduce their operational risks, and increase the trust of investors and financial institutions [34]. Consequently, they expand the financing possibilities for enterprises and increase the availability of funds, thus protecting green innovation activities necessitating large capital investment by enterprises. Secondly, good ESG ratings can help companies reduce financing costs. Companies with good ESG ratings signal long-term value creation and can negotiate more advantageous terms in the financing market, such as lower interest rates and longer repayment terms. This reduces financing costs and releases more funds for corporate green innovation activities. Therefore, this research proposes the following research hypothesis:
Hypothesis 2. 
ESG ratings facilitate green innovation in heavily polluting companies by alleviating corporate financing constraints.

2.2.3. ESG Ratings, Risk-Taking, and Green Innovation

The development of corporate green innovation activities requires enterprises to have a high risk-taking capability. This is primarily attributed to the fact that green innovation involves high risks and uncertainties that are difficult to assess and requires significant time and human costs while encountering a variety of risks, such as technological difficulties that cannot be broken through and difficulties in obtaining innovation results, or lagging in innovation results [35]. The principal–agent dilemma in enterprises is also a critical cause for insufficient risk-taking behavior. Owners prefer to achieve the long-term goal of the enterprise through innovation and other activities. In contrast, managers are more inclined to choose conventional projects with stable cash flows and lower risks to safeguard their interests and reputation. External investors typically advocate for reduced risk-taking behavior and invest in lower-risk and more prudent short-term projects for capital safety and a quick return [36]. Various principal–agent conflicts arising from differing objectives of the parties will further reduce corporate willingness to take risks and engage in high-risk green innovation and other activities. ESG ratings can effectively alleviate information asymmetry and principal–agent conflicts [37]. Firstly, ESG ratings represent the demand to embed the concept of green development into all decisions of corporate strategic planning. The pressure exerted by ESG ratings can constrain management behaviors and mitigate possible short-sightedness. In addition, ESG ratings convey socially responsible information that reflects the long-term orientation of enterprises toward sustainable development, thus enhancing the willingness of external investors to take risks on green innovation activities and to pay increased attention to corporate long-term development goals [38]. Based on the above analysis, this research posits the following research hypothesis:
Hypothesis 3. 
ESG ratings facilitate green innovation in heavily polluting companies by enhancing corporate risk-taking capability.

3. Study Design

3.1. Sample Selection and Data Sources

Chinese A-share listed companies operating in heavily polluting industries from 2010 to 2020 are selected as samples in this research. The final industry codes of B06, B07, B08, and B09 are selected based on the “Management Catalog of Industry Classification for Environmental Verification of Listed Companies” issued by the former Ministry of Environmental Protection. After matching with the “Guidelines for Industry Classification of Listed Companies (Revised in 2021)” issued by the China Securities Regulatory Commission, B6, B7, B8, B9, B10, B11, C15, C17, C18, C19, C22, C25, C26, C27, C28, C29, C30, C31, C32, and D44 are determined as the research samples of this research. Table 1 presents the specific details of heavily polluting industries. The sample selection criteria are as follows: (1) Listed companies with ST and ST* are excluded. “ST” stocks are designated for special treatment, and “*ST” represents a delisting risk warning. These companies face the risk of delisting due to abnormal financial conditions or other issues. Most of them fail to apply the going concern assumption, are not in accordance with normal accounting standards, and are not comparable to normal companies. (2) Samples with serious missing data such as green patent data and control variables are also excluded. Finally, 7530 valid sample observations are obtained, covering all categories of heavy polluters. In this research, the ESG rating data from Business Way Rong Green are from the WIND database, the green patent data are from the State Intellectual Property Office, and the financial data are sourced from the CSMAR database. To ensure the sample quality and mitigate the influence of extreme values, continuous variables are winsorized at the 1st and 99th percentiles.

3.2. Modeling

To verify the impact of ESG ratings on the green innovation of heavy-polluting enterprises, model 1 is constructed using the multi-temporal double-difference method to test hypothesis 1:
G r e e n i , t = α 0 + α 1 E S G _ D I D i , t + γ C o n t r o l i , t + η + ε i , t
where the explanatory variable G r e e n i , t refers to the firm i’s green innovation in year t. E S G _ D I D i . t is the core explanatory variable E S G _ D I D i , t = 1 if SynTao Green Finance releases the ESG rating data for company i in year t. Otherwise, E S G _ D I D i , t = 0 . The rating data released by SynTao Green Finance satisfy the need for double differencing at multiple time points. After SynTao Green Finance releases the ESG rating for a certain company in year t, the ESG rating data of this company will also be disclosed every subsequent year. C o n t r o l i , t denotes a series of control variables. η is firm- and year-fixed effects. ε i , t is a randomized perturbation term.
Meanwhile, to further examine the dynamic effect of ESG ratings on the impact of the green innovation of heavy-polluting enterprises and to conduct a parallel trend test, the following dynamic double-difference model is constructed by referring to the study of Sun and Abraham [39]:
G r e e n i , t = χ + λ s p r e c u t D i × I T T D < 3 + s = 3 2 λ s p r e D i × I T T D = s + s = 0 2 λ s p o s t D i × I T T D = s + λ s p o s t c u t D i × I T T D > 2 + C o n t r o l i , t + η + ε i , t
where D i = 0 and D i = 1 represent enterprises in the control and experimental groups, respectively; I · is a schematic function, and T D refers to the year of ESG ratings for firm i. The relative time to the release of ESG rating data is utilized as a reference system T T D = s . Model s = 1 serves as the base period to observe the impact of ESG rating events. The remaining variables possess consistent meanings with those in model (1). Herein, the coefficient λ is assigned in model (2), whose variation reflects the dynamic impact that ESG ratings have on green innovation. If neither λ s p r e c u t nor λ s p r e is significantly non-zero, there is no great difference between the experimental and control groups before the time of the ESG rating. Further, a significant non-zero λ s p o s t c u t and λ s p o s t would indicate a remarkable difference between the experimental and control groups after ESG rating hindsight. Consequently, the multi-temporal double-difference model constructed in this research satisfies the parallel trend test.
To further analyze the impact pathway (Z) of ESG ratings on green innovation in heavily polluting enterprises, intermediary variables are selected for analysis in this research. After data standardization, the following models are established [40]:
Z i , t = β 0 + β 1 E S G i , t + β 2 C o n t r o l i , t 1 + γ i + μ t + ε i , t
G r e e n i , t = β 0 + β 1 E S G i , t + β 2 Z i , t + β 3 C o n t r o l i , t 1 + γ i + μ t + ε i , t
Equation (2) represents the impact of a company’s external guarantees on the intermediary variables. The coefficient β 2 in Equation (3) reflects the impact of the intermediary variables on the company’s ESG performance after controlling for the influence of the external guarantees.

3.3. Descriptions of Variables

The explanatory variables include the number of green patent applications and times for the company’s green patents cited in the last five years. The most prevalent indicator for measuring green innovation in enterprises in existing studies is the quantity of green patent applications filed [41]. Based on this approach, this research adopts the measurement method of Su et al. We construct the number of green patent applications and patent citations as the explanatory variable [42].
The core explanatory variable is ESG_DID. In this research, the core explanatory variables are constructed based on the ESG rating data issued by SynTao Green Finance. SynTao Green Finance established the earliest ESG database for listed companies in China and launched its self-developed ESG rating system in 2015. This system covers a broad spectrum of areas and integrates international standards and the current situation of China’s environmental, social, and economic development. This system includes 14 ESG issues affecting Chinese companies at the current stage, which makes it capable of comprehensively assessing the ESG performance of companies with a high degree of authority. Following the approach outlined in Zhou and Zhou [43], this research employs a dummy variable for multi-period DID analysis based on the point in time of the publication of the ESG ratings for the listed companies. In the experimental group, E S G _ D I D i , t = 1 , and the rating data of the companies are published by SynTao Green Finance in the first year. In contrast, in the control group, E S G _ D I D i , t = 0 , and the rating data are not published. Furthermore, during the data screening, it was observed that if an enterprise became the subject of a Business Link Green rating in a specific year, then Business Link Green would release the rating data of that enterprise in subsequent years. Consequently, once a company is included in the experimental group, it remains there and does not revert to the control group.
The mediation variables include financing constraints (KZ) and risk-taking (RISK). We refer to the construction of the KZ index to measure the degree of financing constraints of the guaranteed enterprises. Specifically, following the practice of Kaplan and Zingales, we construct the KZ index using listed companies in China’s heavy pollution industries as a sample to measure the degree of financing constraints. Specifically, we construct the KZ index according to the following steps:
1.
Classify the entire sample for each year by operating net cash flow/previous total assets, cash dividends/previous total assets, cash holdings/previous total assets, debt-to-asset ratio, and Tobin’s Q. If the operating net cash flow/previous total assets are below the median, then KZ1 is 1, otherwise 0; if cash dividends/previous total assets are below the median, then KZ2 is 1, otherwise 0; if cash holdings/previous total assets are below the median, then KZ3 is 1, otherwise 0; if LEV is above the median, then KZ3 is 1, otherwise 0; if Tobin’s Q is above the median, then KZ4 is 1, otherwise 0.
2.
Calculate the KZ index; let (KZ = KZ1 + KZ2 + KZ3 + KZ4).
3.
Use ordered logistic regression to regress the KZ index as the dependent variable against operating net cash flow/previous total assets, cash dividends/previous total assets, cash holdings/previous total assets, debt-to-asset ratio, and Tobin’s Q, estimating the regression coefficients for each variable.
4.
Using the estimated results of the above regression model, we can calculate the KZ index of the financing constraints for each listed company. The larger the KZ index, the higher the degree of financing constraints faced by the listed company.
We measure the level of risk-taking (RISK) by the volatility of corporate earnings. ROA is the ratio of a company’s earnings before interest and taxes (EBIT) for the corresponding year to the total assets at the end of that year. When calculating volatility, we first adjust each year’s ROA for the company using the annual average value of the industry and then calculate the standard deviation and range of the company’s ROA adjusted for the industry during each observation period. The formula is as follows:
A d j _ R o a i , t = E B I T i , t A S S E T I , T 1 X k = 1 X E B I T i , t A S S E T I , T
R i s k 1 i , t = 1 T 1 t 1 T ( A d j _ R o a i , t 1 T t 1 T A d j _ R o a i , t ) 2
R i s k 2 i , t =   Max ( A d j _ R o a i , t )   Min ( A d j _ R o a i , t )
With reference to Wang et al. [44] and Gao and Liu [45], this research assigns a range of other control variables that may affect the corporate green innovation, including the size of the enterprise (Size), return on equity (Roe), gearing ratio (Lev), age of the enterprise at IPO (Age), growth rate in revenue (Growth), capital intensity (Cai), employee labor productivity (Psales), share of sole directors (Indep), and market power (Map). The definitions and calculation methods for these variables are presented in Table 2, and their descriptive statistics are shown in Table 3.
As displayed in Table 4, Fgreen exhibits the maximum and minimum values of 6.9 and 0, respectively, with a standard deviation of 0.931. This indicates a notable variability in the number of patent applications among the sample companies, reflecting significant differences in their engagement in green innovation. The SGreen shows even greater volatility, with values ranging from 0 to 6.598 and a standard deviation of 1.461. This emphasizes the discrepancies in the number of citations of green innovation patents among the sample companies. The average value of the independent variable ESG_DID is 0.14, meaning that approximately 14 out of every 100 companies in the sample have secured an ESG rating. The maximum and minimum values of the Size are 28.64 and 17.81, respectively, showing a standard deviation of 1.334. It signifies a wide distribution of company sizes in the sample, enriching the diversity of scales for the analysis, thus facilitating the examination of behavioral differences in green innovation among companies of varying sizes. In summary, these characteristics of the sample data not only reveal the diversity of companies in terms of green innovation but also provide an empirical basis for further exploring the relationship between ESG ratings and green innovation. Moreover, the results of other control variables are consistent with existing research, enhancing the reliability and universality of this study.

4. Empirical Results and Analysis

4.1. Baseline Regression Analysis

Table 2 reports the regression estimates for model (1), with all regressions controlling for firm- and year-fixed effects and using firm-level clustering robust standard errors. The first two columns display the regression results without control variables. Columns (3) and (4) are the regression results after including a range of control variables. In these two columns, the coefficients on ESG_DID are 0.126 and 0.132, respectively, both statistically significant at the 1% level. These results indicate that after receiving an ESG rating, heavily polluting companies witness a significant improvement in green innovation. Specifically, there is a noticeable increase in the number of green patent applications and the frequency of citations of these patents compared to before the rating and to companies without a rating. Therefore, hypothesis H1 in this research is validated. This trend also reflects the positive role of ESG ratings in encouraging companies to strengthen sustainable development and environmental responsibility. Moreover, regarding the control variables, the coefficients of Size are all significantly positive at the 1% level, indicating that larger enterprises are better equipped to engage in green innovation, given its high-risk activity. Conversely, the coefficient for Map is significantly negative, which may be due to some heavily polluting industries still adopting high-profit, low-cost business models, which often fall short of environmental standards. There is still room for improvement in shifting toward more sustainable business practices.

4.2. Robustness Tests

4.2.1. Parallel Trend Tests and Dynamic Effect Analysis

The premise of adopting the multi-temporal DID model refers to that both the experimental and the control groups exhibit parallel trends before the policy intervention. In this research, model (2) is employed for the parallel trend test to examine the dynamic impact of ESG ratings on the green innovation of heavy-polluting enterprises. The corresponding results are illustrated in Figure 1 and Figure 2. The dynamic effects of ESG ratings on substantive and strategic green innovation are presented separately. It is observed that the regression coefficient λ s p r e is not statistically significant in the first three years before the implementation of ESG ratings. It suggests that there is no discernible difference between the experiment and control groups before the ratings. However, in the subsequent three years after the implementation of ESG ratings, the green innovation of the experimental group is substantially improved compared to the control group. The above results validate the parallel trend hypothesis and reflect a sustained, long-term impact of ESG ratings on the green innovation of heavy-polluting enterprises.

4.2.2. Placebo Test

In this research, the methodology outlined by Alder et al. is adopted [46], and the distribution of the sample data is combined by setting the number of random sampling experiments to 500. As a result, pseudo-policy dummy variables for the placebo tests are generated, yielding the distribution of p-values and coefficients, as explicated in Figure 3 and Figure 4. During the randomization, the regression coefficients of substantive and strategic green innovation are mainly clustered around 0, and the corresponding p-values are mostly higher than 0.1. In contrast, the regression coefficients in the baseline regression results are 0.101 and 0.163, respectively, which are significantly different from the findings from the placebo test. Therefore, the ESG ratings significantly promote green innovation due to the impact of other random factors, and the conclusions obtained are robust.

4.2.3. PSM-DID

Differences in characteristics such as Size between the samples in the experimental and control groups may cause selectivity bias in the double-difference method. To address it, this research further incorporates propensity score matching (PSM). This involves matching selected control variables as covariates to identify a control group that closely resembles the experimental group. The matched samples are then tested using the same method as the baseline regression. The regression results in columns (1) and (2) of Table 4 indicate that the regression coefficients of ESG ratings are 0.172 and 0.079, which are significant at the 5% and 1% levels, respectively. These data signify that even after controlling for possible selectivity bias, ESG ratings continue to significantly contribute to the quantity and quality of green innovations of enterprises, which further validates the robustness of the conclusions obtained above.

4.2.4. Changing the Sample Interval

The rapid spread of the COVID-19 pandemic in 2020 posed significant challenges to the survival and development of many companies, leading to multiple blows such as cash flow shortages and supply chain disruptions. In this context, enterprises often experience a slowdown or deferment in their innovative activities due to more uncertainties. To mitigate the possible impact of the COVID-19 pandemic on the green innovation of enterprises, this research excludes the samples from the special year of 2020 and reruns the regression analysis. The regression results are outlined in Table 5. It demonstrates that the regression coefficients of ESG_DID on Fgreen and SGreen are 0.124 and 0.147, respectively. It indicates that the positive effect of ESG ratings on the quantity and quality of green innovations is still significant, which is in line with the results of the benchmark regression.

4.2.5. Substitution of Variables

Furthermore, the substitution of core explanatory variables is adopted in this research to verify the robustness of the finding that ESG ratings can promote green innovation among heavy-polluting enterprises. The Sino-Securities ESG rating data with comprehensive indicators and wide coverage are selected. The core explanatory variable, HZESG, is reconstructed and subjected to regression analysis by assigning values from one to nine according to the nine levels of Sino-Securities ESG ratings. Larger values imply higher ratings. The results, as given in columns (1) and (2) in Table 6, reveal that the regression coefficients of HZESG on the quantity and quality of green innovations are 0.034 and 0.030, respectively. These data are significant at the 5% and 1% levels, respectively, proving the robustness of the findings above.
Meanwhile, considering that the patent examination system in China requires time for patents related to green innovation to progress from application to authorization and eventually to practical application, there may be inherent lag. To address this, this research conducts a robustness test by lagging the independent variable by one and two periods. Columns (3) and (4) in Table 6 present the regression results with a one-period lag, while columns (5) and (6) depict the results with a two-period lag. The findings demonstrate that ESG ratings still exert a remarkable positive effect on green innovations. Specifically, the regression coefficient of ESG ratings on the quantity of green innovations with a one-period lag is 0.173, exceeding that of the baseline regression that uses green innovations in the current period. Furthermore, it verifies that there may be a certain lag in green innovation while affirming the persistent effect of ESG ratings on green innovation.

4.3. Analysis of the Path of Action

4.3.1. Financing Constraints

This research argues that as investors and financial institutions increasingly prioritize corporate social responsibility and environmental sustainability, ESG ratings can alleviate corporate financing constraints. This, in turn, enhances the availability of corporate financing funds and reduces the cost of corporate financing, thereby providing financial support for corporate green innovation activities.
Table 7 reports the results of examining the financing constraint mechanism. In column (1), the regression results of ESG ratings on the financial constraints reveal a significantly negative coefficient, indicating that ESG ratings can alleviate the financing constraints. Columns (2) and (3) present the effect of financial constraints on the green innovation of enterprises. The results suggest that the lower the financing constraints faced by enterprises, the more green innovation will be carried out. The specific results pass the significance test at the 1% and 10% levels, respectively, indicating that ESG ratings increase the green innovations of enterprises by mitigating the financing constraints. As a result, hypothesis 2 is validated.

4.3.2. Risk-Taking

Herein, we draw on Langenmayr and Lester who utilized the R&D investment of enterprises as a percentage of operating revenue to gauge their investment in risky projects [47]. Table 8 outlines the test results of the risk-taking mechanism. Column (1) reveals that the coefficient of ESG ratings is significantly positive, confirming the hypothesis that ESG ratings can enhance corporate risk-taking capability. Columns (2) and (3) report the effects of risk-taking capability on green innovations, respectively. The results indicate that the stronger the risk-taking capability, the higher the number of the green innovations of enterprises. Moreover, they reflect that ESG ratings are able to strengthen the willingness of enterprises to take risks and create a better innovation environment, which in turn promotes the development of their green innovation activities.

5. Further Analysis

5.1. Green Innovation Targeting

In the practice of environmental governance, enterprises can implement environmental improvement behaviors through two main approaches: source control and end-of-pipe management. Source control refers to fundamentally reducing pollutant emissions by improving product technology or production processes. In contrast, end-of-pipe management involves reducing the final emissions of pollutants through optimizing emission treatment equipment. According to the means of pollution management, green innovation is classified into two categories, source control innovation and end governance innovation, in this research. Based on this, the green innovation target of heavy-polluting enterprises is examined under the pressure of ESG rating, with the specific results displayed in Table 9. In terms of the quantity of innovations, ESG ratings hold a significant position in promoting both the end-of-pipe governance and source control innovations of heavy-polluting enterprises. Notably, the positive impact on source control innovation is greater than that of the end-of-pipe governance innovation. This observation proves to a certain extent that ESG ratings actually motivate enterprises to fulfill their environmental governance responsibilities in source control and end-of-pipe governance. Additionally, it signifies that ESG ratings are not merely symbolic tools for heavy-polluting enterprises to “greenwash” through symbolic behavior.

5.2. Heterogeneity Analysis

5.2.1. Heterogeneity of Property Rights

Different ownership attributes of enterprises may also lead to variations in the effects of ESG ratings on corporate green innovation. Therefore, building upon the benchmark model, the overall sample is categorized into state-owned enterprises and non-state-owned enterprises according to the ownership nature. Group regressions are then conducted to further examine whether there are heterogeneous effects of ESG ratings on green innovation across different types of business entities. The results, as presented in Table 10, indicate that ESG ratings exhibit a more pronounced promotion effect on green innovation in NSOEs compared to that in NSOEs. This research argues that the relative inadequacy of ESG ratings to incentivize green innovation in SOEs can be attributed to three main factors. Firstly, from the perspective of resources, SOEs typically have a strong correlation with the government and obvious advantages in obtaining resources and financial stability. Consequently, their ability to alleviate financing constraints and enhance their risk-bearing capacity through ESG ratings to promote green innovation is limited. Secondly, from the perspective of market competition pressure, SOEs have a slightly weaker sense of competition and motivation to innovate due to their special ownership nature and status as market subjects. In contrast, NSOEs, in a strongly competitive market environment, must have keen responsiveness to various policy events and actively seek transformation and upgrading through green innovations to maintain their competitive advantages. Thirdly, from the perspective of management systems, NSOEs usually possess more flexible management systems and decision-making mechanisms, which are more capable of responding to market demand faster and promoting green innovation. Therefore, the promotion effect of ESG ratings on the green innovation of heavily polluting enterprises is stronger in NSOEs.

5.2.2. Heterogeneity in Size

Considering that green innovation activities are characterized by longer cycles and greater uncertainty in returns, enterprises engaging in such activities require strong financial capacity and mastery of key technologies. Larger enterprises with advantages in terms of research and development capacity and capital can promote the development of green innovation activities. To delve deeper into the effect of ESG ratings on the heterogeneity of enterprises of different sizes, this research adopts the approach outlined by Yu et al. [48]. The sample is divided into two groups: large firms and small-medium enterprises (SMEs), according to the median of the logarithmic value of the total assets for further testing. As presented in Table 11, ESG ratings can significantly promote the green innovation of large enterprises, and the coefficients of the impact on the green innovation of SMEs are positive but not significant.

6. Conclusions and Policy Recommendations

ESG adheres to multiple value orientations, emphasizes the coordinated development of the economy, environment, and society, and promotes enterprises from the single pursuit of maximizing self-interest to maximizing social value. Therefore, it plays a pivotal role for enterprises in achieving sustainable development. Based on the sample data of heavy-polluting enterprises listed on the Shanghai and Shenzhen A-shares from 2010 to 2020, we investigate the impact of ESG rating on the green innovation of these enterprises. The results are summarized as follows: (1) Hypothesis 1 was confirmed: ESG ratings significantly foster green innovation within enterprises in heavily polluting sectors. Subsequent robustness tests reinforced this finding. While there are parallels with prior research [40,41], this study uniquely addresses the oversight of heavy-polluting industries, thereby contributing novel insights to the field. (2) Hypotheses 2 and 3 were substantiated, demonstrating that the alleviation of financing constraints and the enhancement of risk-taking capabilities are pivotal mechanisms through which ESG ratings encourage green innovation in enterprises within heavily polluting industries. These conclusions draw primarily upon the concept of information asymmetry and align with the perspectives and analytical framework presented by Wu et al. [42]. (3) Moreover, our research suggests that ESG ratings do not markedly enhance green innovations in SMEs and SOEs operating within heavily polluting sectors. We propose that this may be due to small and medium-sized enterprises placing a higher emphasis on survival and growth rather than on social and ecological responsibilities. Furthermore, the intricate governance structures and resource allocations of state-owned enterprises may dampen the efficacy of ESG ratings on their green innovation initiatives. This stance is corroborated by a substantial body of literature and numerous studies [49,50,51]. Drawing from the empirical findings, this research delineates the following policy implications.
Firstly, there is a need to strengthen the role of ESG ratings in guiding and incentivizing green innovation. This can be achieved by promoting the integration of ESG concepts into the strategic development plans of enterprises. Through the transmission mechanism of ESG ratings, enterprises can be incentivized to increase their investment in low-carbon technological progress and scientific and technological innovation. Simultaneously, they are encouraged to strengthen the focus of supervision and crackdowns on possible “greenwashing” behaviors at the law and regulation levels, thereby curbing such deceptive behaviors. Consideration should also be given to incorporating ESG principles into the assessment criteria for SOEs. Additionally, the private economy can also leverage ESG to enhance credit enhancement, thereby solving the financing difficulties and high financing costs, ultimately comprehensively promoting the favor of social capital to the green industry.
Secondly, it is imperative to establish a mandatory ESG disclosure system. At present, domestic ESG disclosure largely remains at a stage of encouragement and voluntary participation. Consequently, consideration can be given to expanding the scope of enterprises with mandatory disclosure, such as from large listed companies to SMEs or from key industries (like finance, minerals, and electric power) to other industries. At the specific institutional level, the introduction of a “non-disclosure is interpretation” rule could be instrumental in actively promoting China’s ESG practice gradually toward standardization, systematization, and localization.
Thirdly, it is recommended to actively create a favorable ESG external environment. Government regulators should clear the obstacles to ESG disclosure such as a lack of practical rules, insufficient motivation for disclosure, and difficulties in data integration. Meanwhile, government regulators can give certain incentives to companies participating in ESG. In particular, financial regulators can provide policy incentives to enterprises with higher ESG ratings in IPO, refinancing, bond issuance, etc. Simultaneously, stringent penalties should be imposed on enterprises that fail to disclose or provide false information in accordance with the requirements. In this way, it may create a favorable environment for the development of ESG investment.

Author Contributions

Methodology, M.J. and S.W.; Formal analysis, M.J.; Investigation, X.Z.; Writing—original draft, M.J.; Writing—review & editing, X.Z. and M.J.; Supervision, X.Z.; Funding acquisition, X.Z. and S.W. All authors have read and agreed to the published version of the manuscript.

Funding

This research was funded by National Social Science Fund of China under grant numbers 23FGLB055 and 23FSHB019.

Institutional Review Board Statement

Not applicable.

Informed Consent Statement

Not applicable.

Data Availability Statement

The data presented in this study are available on request from the corresponding author.

Conflicts of Interest

The authors declare no conflict of interest.

References

  1. Nie, Y.; Wan, K.; Wu, F.; Zou, W.; Chang, T. Local government competition, development zones and urban green innovation: An empirical study of Chinese cities. Appl. Econ. Lett. 2022, 29, 1509–1514. [Google Scholar] [CrossRef]
  2. Ji, M.; Zhang, X. Assessing the Impacts and Mechanisms of Green Bond Financing on the Enhancement of Green Management and Technological Innovation in Environmental Conservation Enterprises. J. Knowl. Econ. 2023, 1–42. [Google Scholar] [CrossRef]
  3. Xu, Y.; Wang, Z.-C.; Tao, C.-Q. Can innovative pilot city policies improve the allocation level of innovation factors?—Evidence from China. Technol. Forecast. Soc. Chang. 2024, 200, 123135. [Google Scholar] [CrossRef]
  4. Liu, Y.; Deng, Y.; Liu, Y.; Li, C.; Ankrah Twumasi, M.; Cheng, Y. Do disclosure of ESG information policies inhibit the value of heavily polluting Enterprises?—Evidence from China. Heliyon 2023, 9, e22750. [Google Scholar] [CrossRef] [PubMed]
  5. Zheng, S.; Yi, H.; Li, H. The impacts of provincial energy and environmental policies on air pollution control in China. Renew. Sustain. Energy Rev. 2015, 49, 386–394. [Google Scholar] [CrossRef]
  6. Jiang, Y.; Wu, Q.; Brenya, R.; Wang, K. Environmental decentralization, environmental regulation, and green technology innovation: Evidence based on China. Environ. Sci. Pollut. Res. 2023, 30, 28305–28320. [Google Scholar] [CrossRef]
  7. Krueger, P.; Sautner, Z.; Starks, L.T. The Importance of Climate Risks for Institutional Investors. Rev. Financ. Stud. 2020, 33, 1067–1111. [Google Scholar] [CrossRef]
  8. Serafeim, G.; Yoon, A. Stock price reactions to ESG news: The role of ESG ratings and disagreement. Rev. Account. Stud. 2023, 28, 1500–1530. [Google Scholar] [CrossRef]
  9. Wang, Y.; Wang, X. From ratings to action: The impact of ESG performance on corporate innovation. Heliyon 2024, 10, e26683. [Google Scholar] [CrossRef]
  10. Ren, C.; Ting, I.W.K.; Lu, W.M.; Kweh, Q.L. Nonlinear effects of ESG on energy-adjusted firm efficiency: Evidence from the stakeholder engagement of apple incorporated. Corp. Soc. Responsib. Environ. Manag. 2022, 29, 1231–1246. [Google Scholar] [CrossRef]
  11. Saygili, E.; Arslan, S.; Birkan, A.O. ESG practices and corporate financial performance: Evidence from Borsa Istanbul. Borsa Istanb. Rev. 2022, 22, 525–533. [Google Scholar] [CrossRef]
  12. Engle, R.F.; Giglio, S.; Kelly, B.; Lee, H.; Stroebel, J. Hedging Climate Change News. Rev. Financ. Stud. 2020, 33, 1184–1216. [Google Scholar] [CrossRef]
  13. Pedersen, L.H.; Fitzgibbons, S.; Pomorski, L. Responsible investing: The ESG-efficient frontier. J. Financ. Econ. 2021, 142, 572–597. [Google Scholar] [CrossRef]
  14. Liu, B.; Ren, X.; Liu, D.; Liu, J.; Zhang, Q.; Huang, H.; Xu, R.; Wang, R.; Liu, C.; He, Z.; et al. Ground Validation Experiment and Spectral Detection Capability Evaluation of Mars Mineralogical Spectrometer (MMS) Aboard HX-1 Orbiter. Space Sci. Rev. 2022, 218, 1. [Google Scholar] [CrossRef]
  15. de Silva Lokuwaduge, C.S.; De Silva, K.M. ESG Risk Disclosure and the Risk of Green Washing. Australas. Account. Bus. Financ. J. 2022, 16, 146–159. [Google Scholar] [CrossRef]
  16. Yoo, J.S.; Song, W.J.; Ku, J.E. CEO turnover, ESG-washing, and firm value. Manag. Decis. Econ. 2024. [Google Scholar] [CrossRef]
  17. Xing, C.; Zhang, Y.; Tripe, D. Green credit policy and corporate access to bank loans in China: The role of environmental disclosure and green innovation. Int. Rev. Financ. Anal. 2021, 77, 101838. [Google Scholar] [CrossRef]
  18. Berrone, P.; Fosfuri, A.; Gelabert, L.; Gomez-Mejia, L.R. Necessity as the mother of ‘green’ inventions: Institutional pressures and environmental innovations. Strateg. Manag. J. 2013, 34, 891–909. [Google Scholar] [CrossRef]
  19. Horbach, J.; Rammer, C.; Rennings, K. Determinants of eco-innovations by type of environmental impact—The role of regulatory push/pull, technology push and market pull. Ecol. Econ. 2012, 78, 112–122. [Google Scholar] [CrossRef]
  20. Li, Z.; Liao, G.; Wang, Z.; Huang, Z. Green loan and subsidy for promoting clean production innovation. J. Clean. Prod. 2018, 187, 421–431. [Google Scholar] [CrossRef]
  21. Bendell, B.L. I don’t Want to be Green: Prosocial Motivation Effects on Firm Environmental Innovation Rejection Decisions. J. Bus. Ethics 2017, 143, 277–288. [Google Scholar] [CrossRef]
  22. Cheng, C.C.J. Sustainability Orientation, Green Supplier Involvement, and Green Innovation Performance: Evidence from Diversifying Green Entrants. J. Bus. Ethics 2020, 161, 393–414. [Google Scholar] [CrossRef]
  23. Jiménez, G.; Salas, V.; Saurina, J. Determinants of collateral. J. Financ. Econ. 2006, 81, 255–281. [Google Scholar] [CrossRef]
  24. Xu, Y.; Saunders, A.; Xiao, B.; Li, X. Bank relationship loss: The moderating effect of information opacity. J. Bank. Financ. 2020, 118, 105872. [Google Scholar] [CrossRef]
  25. Duque-Grisales, E.; Aguilera-Caracuel, J. Environmental, Social and Governance (ESG) Scores and Financial Performance of Multilatinas: Moderating Effects of Geographic International Diversification and Financial Slack. J. Bus. Ethics 2021, 168, 315–334. [Google Scholar] [CrossRef]
  26. Tan, Y.; Zhu, Z. The effect of ESG rating events on corporate green innovation in China: The mediating role of financial constraints and managers’ environmental awareness. Technol. Soc. 2022, 68, 101906. [Google Scholar] [CrossRef]
  27. Kim, J.W.; Park, C.K. Can ESG Performance Mitigate Information Asymmetry? Moderating Effect of Assurance Services. Appl. Econ. 2023, 55, 2993–3007. [Google Scholar] [CrossRef]
  28. Ferrón-Vílchez, V.; Valero-Gil, J.; Suárez-Perales, I. How does greenwashing influence managers’ decision-making? An experimental approach under stakeholder view. Corp. Soc. Responsib. Environ. Manag. 2021, 28, 860–880. [Google Scholar] [CrossRef]
  29. Zhang, C.; Hao, D.; Gao, L.; Xia, F.; Zhang, L. Do ESG ratings improve capital market trading activities? Int. Rev. Econ. Financ. 2024, 93, 195–210. [Google Scholar] [CrossRef]
  30. Huang, Z.; Liao, G.; Li, Z. Loaning scale and government subsidy for promoting green innovation. Technol. Forecast. Soc. Chang. 2019, 144, 148–156. [Google Scholar] [CrossRef]
  31. Zhang, P.; Wu, F.; Guo, Y.; Ma, J. Does enforcement matter in promoting corporate environmental investment: Evidence from Chinese private firms. J. Clean. Prod. 2022, 337, 130432. [Google Scholar] [CrossRef]
  32. Testa, F.; Miroshnychenko, I.; Barontini, R.; Frey, M. Does it pay to be a greenwasher or a brownwasher? Bus. Strategy Environ. 2018, 27, 1104–1116. [Google Scholar] [CrossRef]
  33. Cheng, B.; Ioannou, I.; Serafeim, G. Corporate social responsibility and access to finance. Strateg. Manag. J. 2014, 35, 1–23. [Google Scholar] [CrossRef]
  34. Dhaliwal, D.S.; Li, O.Z.; Tsang, A.; Yang, Y.G. Voluntary Nonfinancial Disclosure and the Cost of Equity Capital: The Initiation of Corporate Social Responsibility Reporting. Account. Rev. 2011, 86, 59–100. [Google Scholar] [CrossRef]
  35. Zhang, D. Can digital finance empowerment reduce extreme ESG hypocrisy resistance to improve green innovation? Energy Econ. 2023, 125, 106756. [Google Scholar] [CrossRef]
  36. Guo, C.; Su, W.; Song, X.; Hu, X. Heterogeneous debt financing and environmental research & development: Evidence from China. Int. Rev. Econ. Financ. 2022, 82, 65–81. [Google Scholar] [CrossRef]
  37. Tao, J.; Shan, P.; Liang, J.; Zhang, L. Influence Mechanism between Corporate Social Responsibility and Financial Sustainability: Empirical Evidence from China. Sustainability 2024, 16, 2406. [Google Scholar] [CrossRef]
  38. Flammer, C. Competing for government procurement contracts: The role of corporate social responsibility. Strateg. Manag. J. 2018, 39, 1299–1324. [Google Scholar] [CrossRef]
  39. Sun, L.; Abraham, S. Estimating dynamic treatment effects in event studies with heterogeneous treatment effects. J. Econom. 2021, 225, 175–199. [Google Scholar] [CrossRef]
  40. Cerin, E.; Taylor, L.M.; Leslie, E.; Owen, N. Small-scale randomized controlled trials need more powerful methods of mediational analysis than the Baron–Kenny method. J. Clin. Epidemiol. 2006, 59, 457–464. [Google Scholar] [CrossRef]
  41. Fleming, L.; Sorenson, O. Science as a map in technological search. Strateg. Manag. J. 2004, 25, 909–928. [Google Scholar] [CrossRef]
  42. Su, Y.; Liu, Z.; Liang, S. Does CEO information technology background promote substantive green innovation or strategic green innovation? Technol. Anal. Strateg. Manag. 2023, 1–14. [Google Scholar] [CrossRef]
  43. Zhou, D.; Zhou, R. ESG Performance and Stock Price Volatility in Public Health Crisis: Evidence from COVID-19 Pandemic. Int. J. Environ. Res. Public Health 2022, 19, 202. [Google Scholar] [CrossRef] [PubMed]
  44. Wang, J.; Ma, M.; Dong, T.; Zhang, Z. Do ESG ratings promote corporate green innovation? A quasi-natural experiment based on SynTao Green Finance’s ESG ratings. Int. Rev. Financ. Anal. 2023, 87, 102623. [Google Scholar] [CrossRef]
  45. Gao, W.; Liu, Z. Green credit and corporate ESG performance: Evidence from China. Financ. Res. Lett. 2023, 55, 103940. [Google Scholar] [CrossRef]
  46. Alder, S.; Shao, L.; Zilibotti, F. Economic reforms and industrial policy in a panel of Chinese cities. J. Econ. Growth 2016, 21, 305–349. [Google Scholar] [CrossRef]
  47. Langenmayr, D.; Lester, R. Taxation and Corporate Risk-Taking. Account. Rev. 2018, 93, 237–266. [Google Scholar] [CrossRef]
  48. Yu, X.; Shi, J.; Wan, K.; Chang, T. Carbon trading market policies and corporate environmental performance in China. J. Clean. Prod. 2022, 371, 133683. [Google Scholar] [CrossRef]
  49. Zhou, X.; Dai, M.; Ma, X.; Charles, V.; Shahzad, U.; Zhao, X. Economic policy uncertainty and the inhibitory effect of firms’ green technology innovation. Glob. Financ. J. 2024, 60, 100960. [Google Scholar] [CrossRef]
  50. Zhang, Z.; Wu, Y.; Wang, H. Corporate financial fragility, R&D investment, and corporate green innovation: Evidence from China. Financ. Res. Lett. 2024, 62, 105190. [Google Scholar] [CrossRef]
  51. Liu, M. Quantitative ESG disclosure and divergence of ESG ratings. Front. Psychol. 2022, 13, 936798. [Google Scholar] [CrossRef] [PubMed]
Figure 1. Parallel trend test (Fgreen).
Sustainability 16 02842 g001
Figure 2. Parallel trend test (SGreen).
Sustainability 16 02842 g002
Figure 3. Placebo testing (FGreen).
Sustainability 16 02842 g003
Figure 4. Placebo testing (SGreen).
Sustainability 16 02842 g004
Table 1. Contents of the list of heavily polluting industries and sample attrition.
Primary Industry CodePrimary Industry NameSecondary Industry CodeSecondary Industry NameObs.Cumulative Percentage (%)
BMining industryB6Coal mining and washing industry2360.031
B7Oil and natural gas extraction industry670.040
B8Ferrous metal mining and dressing industry360.045
B9Non-ferrous metal mining and dressing industry1990.071
B10Non-metallic mining and dressing industry40.072
B11Mining specialized and auxiliary activities980.085
CManufacturing industryC15Alcoholic beverages, beverages, and refined tea manufacturing industry3870.136
C17Textile industry2560.170
C18Textile clothing and apparel industry1930.196
C19Leather, fur, feather (and its products) and footwear industry430.202
C22Papermaking and paper products industry1950.228
C25Petroleum, coal, and other fuel processing industry1220.244
C26Chemical raw materials and chemical products manufacturing industry14580.437
C27Pharmaceutical manufacturing industry15370.642
C28Chemical fiber manufacturing industry1970.668
C29Rubber and plastic products industry3330.712
C30Non-metallic mineral products industry5910.790
C31Ferrous metal smelting and rolling processing industry3080.831
C32Non-ferrous metal smelting and rolling processing industry5740.908
DElectricity, heat, gas production and supply industryD44Electricity and heat production and supply industry6961.000
Table 2. Variable definition and calculation method.
Index NameIndex MeaningCalculation Method
FgreenNumber of green patent applicationsExplanatory variables. The number of green patent applications filed by the company in the current year.
SGreenNumber of times the green patent is citedExplanatory variables. The number of times the company’s green patents have been cited in the last five years.
ESG_DIDWhether it has obtained an ESG ratingIndependent variable, in terms of the interaction result of the independent variables “treat” and “time”. If SynTao Green Finance released the ESG rating data for the company “i” in year “t”, the value of ESG_DID is 1; otherwise, it is 0. In this research, companies that obtained ESG rating data during the sample period are enrolled in the experimental group, while other companies are included in the control group.
SizeSize of the enterpriseTotal assets at the end of the period taken as a natural logarithm.
LevGearing ratioTotal liabilities/total assets.
RoeReturn on equityNet profit of the firm/average net assets of the firm.
AgeAge of the enterprise at IPOAge of listing of the firm plus one taken as a natural logarithm.
GrowthGrowth rate in revenue(operating income in current year—operating income in previous year) / operating income in previous year
CaiCapital intensityTotal assets/operating income.
PsalesEmployee labor productivityOperating income/total number of employees.
IndepShare of sole directorsThe ratio of the number of board directors to the number of independent directors.
MapMarket powerSales revenues/operating costs.
KZFinancing constraintsSee the previous text for the specific calculation method.
RISKRisk-takingCalculated according to models (5), (6), and (7).
Table 3. Descriptive statistics of variables.
VarMeanSt.dMinMax
Fgreen0.6020.93106.900
SGreen2.5911.46109.598
ESG0.1430.35001
Size22.381.33417.8128.64
Roe0.0440.619−45.741.117
Lev0.4160.2000.0530.887
Age2.8280.3520.6933.714
Growth0.1320.376−0.6802.020
Cai13.041.0294.83518.51
Psales13.870.7869.84518.83
Indep0.3710.0510.3330.571
Map1.6901.3500.62527.98
Table 4. Benchmark regression results.
(1)(2)(3)(4)
FgreenSGreenFgreenSGreen
ESG_DID0.173 ***0.194 ***0.126 ***0.132 **
(3.908)(3.623)(2.795)(2.539)
Size 0.254 ***0.382 ***
(6.670)(8.756)
Roe −0.0060.020 **
(−0.877)(1.992)
Lev −0.0970.250 *
(−0.887)(1.945)
Age −0.0380.318 *
(−0.481)(1.750)
Growth −0.001−0.020
(−0.039)(−0.762)
Cai 0.024−0.027
(1.092)(−0.906)
Psales −0.0300.003
(−1.148)(0.085)
Indep 0.478 *−0.027
(1.720)(−0.084)
Map −0.024 *−0.095 ***
(−1.872)(−3.477)
_cons0.262 ***1.394 ***−5.013 ***−8.542 ***
(7.849)(31.671)(−5.226)(−5.537)
Firm FeYesYesYesYes
Year FeYesYesYesYes
N7530753075307530
Adj R20.5730.6050.6330.690
Note: *, **, and *** indicate significance below the 10%, 5%, and 1% levels, respectively. The values in parentheses show the T-statistics with robust standard errors adjusted for clustering at the firm level.
Table 5. Robustness test results.
PSM-DIDChanging Regression Intervals
FgreenSGreenFgreenSGreen
ESG_DID0.172 **0.079 *0.124 ***0.147 ***
(2.297)(1.816)(2.708)(2.965)
Size0.195 ***0.363 ***0.246 ***0.339 ***
(3.702)(5.931)(6.420)(7.775)
Roe0.0410.147 **−0.0090.044
(0.956)(2.058)(−0.343)(1.439)
Lev−0.0200.487 **−0.0670.314 **
(−0.116)(2.474)(−0.575)(2.449)
Age0.1280.0990.0130.657
(0.854)(0.335)(0.089)(1.315)
Growth−0.0550.006−0.009−0.013
(−1.504)(0.140)(−0.352)(−0.473)
Cai−0.0030.0130.023−0.004
(−0.077)(0.263)(1.042)(−0.134)
Psales0.011−0.023−0.037−0.029
(0.294)(−0.425)(−1.302)(−0.797)
Indep0.0780.1800.331−0.091
(0.241)(0.387)(1.170)(−0.289)
Map−0.025−0.050−0.015−0.082 ***
(−1.093)(−1.056)(−1.058)(−2.891)
_cons−5.248 **−6.706 *−4.887 **−12.299 **
(−2.541)(−1.804)(−2.517)(−2.027)
Firm FeYesYesYesYes
Year FeYesYesYesYes
N5601560164906490
Adj R20.6600.7220.6340.741
Note: *, **, and *** indicate significance below the 10%, 5%, and 1% levels, respectively. The values in parentheses show the T-statistics with robust standard errors adjusted for clustering at the firm level.
Table 6. Results of robustness tests for replacement variables.
(1)(2)(3)(4)(5)(6)
FgreenSGreenFgreenSGreenFgreenSGreen
HZESG0.034 **0.030 *
(2.557)(1.901)
ESG_DID 0.173 ***0.118 **0.138 ***0.113 **
(3.831)(2.451)(2.823)(2.311)
Size0.260 ***0.387 ***0.173 ***0.289 ***0.102 ***0.228 ***
(6.950)(8.896)(4.315)(5.971)(2.603)(4.213)
Roe−0.0040.023 **−0.017 **0.0130.017 ***0.001
(−0.575)(2.122)(−2.432)(1.266)(3.365)(0.087)
Lev−0.0480.292 **0.1020.247 *0.0350.379 **
(−0.430)(2.260)(0.847)(1.746)(0.277)(2.370)
Age−0.0570.2840.0160.309 **0.0710.203 **
(−0.725)(1.608)(0.219)(2.458)(0.852)(2.384)
Growth−0.005−0.0220.019−0.006−0.018−0.012
(−0.219)(−0.862)(0.684)(−0.188)(−0.660)(−0.388)
Cai0.035−0.0260.008−0.0100.0340.017
(1.518)(−0.847)(0.305)(−0.309)(1.362)(0.502)
Psales−0.0400.000−0.026−0.029−0.038−0.084 **
(−1.477)(0.011)(−0.845)(−0.729)(−1.096)(−2.025)
Indep0.3660.0650.2740.3770.3830.496
(1.395)(0.199)(0.816)(1.140)(1.081)(1.415)
Map−0.017−0.087 ***−0.011−0.094 ***−0.010−0.071 **
(−1.235)(−3.291)(−0.788)(−2.859)(−0.531)(−2.413)
_cons−4.559 ***−9.262 ***−3.336 ***−7.374 ***−2.703 *−4.572 ***
(−3.629)(−3.833)(−2.604)(−3.677)(−1.870)(−2.865)
Firm FeYesYesYesYesYesYes
Year FeYesYesYesYesYesYes
N753075305842584248194819
Adj R20.6150.7570.6230.7650.6410.753
Note: *, **, and *** indicate significance below the 10%, 5%, and 1% levels, respectively. The values in parentheses show the T-statistics with robust standard errors adjusted for clustering at the firm level.
Table 7. Results of the intermediation mechanism test for financing constraints.
(1)(2)(3)
KZFgreenSGreen
ESG_DID−0.061 ***0.135 ***0.141 ***
(−14.513)(2.615)(2.714)
KZ −1.636 ***−0.718 *
(−5.760)(−1.904)
Size0.012 *0.278 ***0.399 ***
(1.958)(7.566)(9.310)
Roe0.000−0.0040.022 **
(0.551)(−0.671)(2.046)
Lev0.009−0.0540.273 **
(0.816)(−0.491)(2.113)
Age0.008−0.0380.290
(0.828)(−0.487)(1.645)
Growth0.004 **0.005−0.017
(2.006)(0.201)(−0.678)
Cai−0.0030.026−0.031
(−1.297)(1.192)(−0.983)
Psales−0.002−0.043−0.001
(−0.778)(−1.622)(−0.019)
Indep−0.0230.3450.072
(−0.827)(1.358)(0.223)
Map0.003 *−0.011−0.084 ***
(1.650)(−0.811)(−3.235)
_cons3.524 ***1.285−6.706 **
(22.146)(0.868)(−2.448)
Firm FeYesYesYes
Year FeYesYesYes
N716771677167
Adj R20.8700.6720.790
Note: *, **, and *** indicate significance below the 10%, 5%, and 1% levels, respectively. The values in parentheses show the T-statistics with robust standard errors adjusted for clustering at the firm level.
Table 8. Results of the risk-taking intermediation mechanism test.
(1)(2)(3)
RISKFgreenSGreen
ESG_DID0.315 **0.171 **0.191 ***
(2.346)(2.383)(3.012)
RISK 0.006 **0.009 **
(2.225)(2.075)
Size−0.2150.288 ***0.407 ***
(−1.516)(7.593)(9.462)
Roe−0.011−0.0090.012 **
(−0.392)(−1.234)(2.563)
Lev−0.184−0.0970.246 *
(−0.373)(−0.828)(1.863)
Age−0.061−0.0920.273
(−0.165)(−1.140)(1.512)
Growth−0.061−0.000−0.021
(−0.578)(−0.011)(−0.779)
Cai0.206 **0.041 *−0.023
(2.311)(1.700)(−0.720)
Psales−0.546 ***−0.0300.006
(−4.612)(−0.984)(0.139)
Indep1.0720.513 *0.227
(1.121)(1.913)(0.677)
Map−0.295−0.004−0.079 ***
(−1.372)(−0.298)(−2.853)
_cons13.714 **−4.938 ***−9.468 ***
(2.494)(−3.963)(−3.890)
Firm FeYesYesYes
Year FeYesYesYes
N644964496449
Adj R20.8170.7210.730
Note: *, **, and *** indicate significance below the 10%, 5%, and 1% levels, respectively. The values in parentheses show the T-statistics with robust standard errors adjusted for clustering at the firm level.
Table 9. Impact of ESG ratings on green innovation targeting.
End-To-End GovernanceSource Control
FgreenSGreenFgreenSGreen
ESG_DID0.095 ***0.025 *0.145 ***0.066 **
(3.036)(1.840)(3.178)(2.362)
Size0.072 ***0.049 ***0.221 ***0.113 ***
(3.277)(4.207)(6.102)(4.400)
Roe−0.013 *0.007 **0.006−0.004
(−1.866)(2.398)(1.303)(−0.847)
Lev0.018−0.137 ***−0.140−0.276 ***
(0.288)(−3.252)(−1.376)(−3.353)
Age0.068−0.041−0.059−0.061
(1.315)(−0.873)(−0.671)(−1.211)
Growth−0.0020.000−0.0010.013
(−0.168)(0.006)(−0.067)(0.734)
Cai0.010−0.037 ***0.022−0.059 ***
(0.823)(−3.797)(1.074)(−3.303)
Psales0.0000.041 ***−0.0310.062 ***
(0.028)(3.556)(−1.190)(2.819)
Indep0.267−0.0640.380−0.319
(1.478)(−0.673)(1.240)(−1.629)
Map−0.0070.004−0.028 **−0.018
(−0.893)(0.541)(−2.384)(−1.030)
_cons−2.405 ***−0.063−3.616 ***−0.777
(−3.125)(−0.099)(−2.724)(−0.892)
Firm FeYesYesYesYes
Year FeYesYesYesYes
N2322232232603260
Adj R20.7100.7290.6620.690
Note: *, **, and *** indicate significance below the 10%, 5%, and 1% levels, respectively. The values in parentheses show the T-statistics with robust standard errors adjusted for clustering at the firm level.
Table 10. Results of property rights heterogeneity test.
Non-StateStateNon-StateState
FgreenFgreenSGreenSGreen
ESG_DID0.192 ***0.0070.317 ***0.023
(2.965)(0.123)(4.250)(0.714)
Size0.326 ***0.258 ***0.391 ***0.386 ***
(4.658)(6.045)(5.599)(6.693)
Roe−0.025−0.0030.0120.023 *
(−0.781)(−0.867)(0.549)(1.754)
Lev−0.130−0.0370.1230.250
(−0.711)(−0.276)(0.571)(1.498)
Age−0.0100.0060.527 **−0.090
(−0.087)(0.080)(2.431)(−0.527)
Growth−0.0350.029−0.0510.019
(−1.092)(0.940)(−1.409)(0.516)
Cai−0.0100.036−0.045−0.016
(−0.283)(1.285)(−0.997)(−0.396)
Psales−0.010−0.0320.020−0.004
(−0.212)(−1.068)(0.355)(−0.084)
Indep0.4900.332−0.068−0.021
(1.191)(0.903)(−0.140)(−0.053)
Map−0.092 *−0.011−0.231 ***−0.074 ***
(−1.750)(−0.888)(−2.901)(−2.691)
_cons−6.162 ***−5.340 ***−14.149 ***−4.857 **
(−2.850)(−4.165)(−3.645)(−2.294)
Firm FeYesYesYesYes
Year FeYesYesYesYes
N4414311644143116
Adj R20.6120.6950.70.821
Note: *, **, and *** indicate significance below the 10%, 5%, and 1% levels, respectively. The values in parentheses show the T-statistics with robust standard errors adjusted for clustering at the firm level.
Table 11. Results of firm size heterogeneity test.
LargeSmall-mediumLargeSmall-medium
FgreenSGreenFgreenSGreen
ESG_DID0.464 ***0.1060.119 **0.145
(9.739)(0.976)(2.080)(0.957)
Size0.326 ***0.233 ***0.426 ***0.558 ***
(4.206)(5.252)(5.556)(7.215)
Roe−0.003−0.045 **−0.0140.042
(−0.092)(−2.316)(−0.540)(1.151)
Lev−0.058−0.098−0.0510.359 **
(−0.274)(−0.662)(−0.231)(2.067)
Age−0.0730.0110.2820.359
(−0.680)(0.130)(1.563)(0.978)
Growth−0.0430.049 *−0.0390.005
(−1.136)(1.819)(−1.019)(0.141)
Cai0.0050.001−0.098 *0.038
(0.121)(0.048)(−1.763)(0.906)
Psales0.016−0.058 *0.0710.006
(0.352)(−1.925)(1.258)(0.105)
Indep0.768 *0.2880.438−0.430
(1.884)(0.734)(0.955)(−0.970)
Map−0.040−0.012−0.105 ***−0.085 **
(−1.518)(−0.991)(−2.738)(−2.455)
_cons−6.032 ***−4.024 ***−10.745 ***−13.595 ***
(−2.722)(−3.009)(−3.274)(−3.398)
Firm FeYesYesYesYes
Year FeYesYesYesYes
N3766376437663764
Adj R20.7540.5280.8820.793
Note: *, **, and *** indicate significance below the 10%, 5%, and 1% levels, respectively. The values in parentheses show the T-statistics with robust standard errors adjusted for clustering at the firm level.
Disclaimer/Publisher’s Note: The statements, opinions and data contained in all publications are solely those of the individual author(s) and contributor(s) and not of MDPI and/or the editor(s). MDPI and/or the editor(s) disclaim responsibility for any injury to people or property resulting from any ideas, methods, instructions or products referred to in the content.

