Abstract
This paper investigates the effect of environmental, social, and governance (ESG) performance on the enterprise value of heavily polluting listed companies in China’s Shanghai and Shenzhen A-share markets. The study found that ESG performance helps to improve the corporate value of heavily polluting listed companies, and ESG performance has an impact mechanism effect on the corporate value of heavily polluting listed companies through green technology innovation, financing costs, and internal control; the analysis of heterogeneity is conducted from three different perspectives: resource endowment, ownership nature, and overseas background of senior executives. At the same time, the interaction term ESG × EPU is employed to examine the regulatory effect of economic policy uncertainty Non-state-owned enterprises can enhance their enterprise value more effectively by improving their ESG performance based on the research findings. The ESG performance of heavy polluting enterprises in non-resource-based cities has a more obvious role in promoting corporate value; in companies where executives have overseas backgrounds, ESG performance is more conducive to the improvement of corporate value. The empirical evidence derived from the research findings rationalizes the connection between the of ESG performance and enterprise value in industries with high levels of pollution, as well as the pathway of impact.
1. Introduction
With the high attention given to climate, resources, and environmental protection issues, enterprises should not only achieve efficiency growth, but also pay attention to environmental protection and social responsibility. In April 2022, “Guidelines for Investor Relations Management of Listed Companies” containing “corporate environmental, social, and governance information” were first introduced by the China Securities Regulatory Commission. In June 2022, “an ‘Implementation Plan for Enhancing Pollution Reduction and Carbon Synergy’ was jointly released by the Ministry of Ecology and Environment, the National Development and Reform Commission, and seven other government departments”. It is proposed that, by 2030, the synergistic capacity of reducing pollution and reducing carbon will be significantly improved to help achieve the goal of carbon peak. This is of great significance to enhance the transparency, accountability, and efficiency of global sustainable development information disclosure. This paper takes China‘s heavily polluting listed industrial and commercial enterprises as the research object, and tries to explore the impact of ESG performance of heavily polluting enterprises on enterprise value, aiming to promote heavily polluting enterprises to protect the ecological environment, fulfil their social responsibilities, improve corporate governance, and foster the advancement of eco-friendly and sustainable growth among corporations.
Although there have been many studies on the impact of ESG performance on corporate value at home and abroad, the research conclusions are different, and overall they can be divided into three types: First, researchers believe that ESG and corporate value are positively correlated, and ESG will promote the increase of corporate value [1,2,3,4]. With a change of research variables, ESG has a positive nonlinear (U-shaped) impact on enterprise value [5]. ESG can improve enterprise value by enhancing investor confidence [6]. ESG can not only improve the enterprise value of the enterprise, but also improve the innovation level of the enterprise [7,8]. For different research areas, the factors of ESG that play the leading role are not the same. The automotive industry is mainly affected by G [9], and for European companies, the main concern is S [10]. Second, researchers believe that good environmental performance is at the expense of corporate interests [11]. Enterprise ESG information disclosure will increase corporate costs and reduce corporate value [12,13,14,15]. ESG disputes will also weaken corporate value to a certain extent. Third, researchers believe that there is no significant relationship between ESG performance and corporate value [16,17]. The ESG policy has little impact on corporate value in the short-term [18,19,20]. Focusing solely on environmental factors in ESG is not enough to improve corporate value [21,22]. For non-key pollution monitoring enterprises, the relationship between ESG and enterprise value is not significant [23]. For high-tech enterprises, the relationship between G in ESG and enterprise value is not significant [24]. The majority of academics focus solely on the influence of ESG single factors on enterprise value, while neglecting the other relevant factors’ importance in determining enterprise value. Additionally, most researchers have a single perspective on the path of ESG performance affecting corporate value, such as profitability [25], working capital management efficiency (WCME) [26], corporate social responsibility [27], sustainability [28,29,30], debt financing [31], enterprise scale [32], transparency [33], etc. There are few researchers who choose green technology innovation, financing costs, and internal control as research perspectives.
Based on the above, this study’s sample consists of Chinese shares in heavy-polluting industries listed on the Shanghai and Shenzhen stock exchanges from 2015 to 2022. This paper presents the following contributions: First, ESG comprehensive indicators are selected from the perspective of ESG as a whole, and the performance of enterprises comprehensively considered. Second, the mechanism effect of ESG performance on enterprise value is studied from three aspects: green technology innovation, financing cost, and internal control. Third, the regulating effect of economic policy uncertainty on the relationship between ESG performance and enterprise value is studied. Fourth, heterogeneity analysis is carried out from the aspects of resource endowment, ownership nature, and overseas background of executives. Finally, the findings can help government departments to promote the construction of an ESG evaluation system with Chinese characteristics, and open up a new path for heavy-polluting enterprises to achieve green and low-carbon development.
2. Literature Review and Research Hypotheses
- (1)
- ESG performance and enterprise value
According to research on ESG performance, ESG can bring many opportunities and benefits to the development of enterprises. For example, ESG performance can improve the market and book value of enterprises [34,35], enhance the capacity for sustainable development and informatization level of enterprises [36], and reduce the financing constraints and financing costs of enterprises [37]. In addition, enterprises improve their management and governance models and constantly solve various problems in their development, which is of great help to realize the strategic objectives of enterprises and improve the development of governance.
According to the stakeholder theory [38], various stakeholders contribute to the development of enterprises in different ways. With their support, enterprises can continue to survive and grow. Enterprises should maintain the interests and relationships of all parties, fulfil the contracts with stakeholders, and meet the needs of all stakeholders from the perspective of ESG practice [39]. The first is the environmental level. Enterprises should take sustainable development as the principle; pay attention to protecting the ecological environment and resources; improve energy conservation, emission reduction measures, and environmental cost accounting; and bear the responsibility of protecting the environment. Secondly, at the social level, enterprises should strengthen their product quality supervision, strengthen the protection of user privacy data and the protection of women’s rights and interests, actively participate in the process of rural revitalization, and give full play to the value of enterprises. Finally, at the management level, enterprises should continue to improve corporate governance, attach importance to information disclosure, adhere to anti-unfair competition, and contribute to maintaining a good competitive environment. ESG helps to enhance the corporate image from the above three aspects, meet the needs of all stakeholders, assist businesses in building a favorable image, and foster the continual advancement of enterprises. Based on the above analysis, we propose Hypothesis 1:
Hypothesis 1:
ESG performance has a positive impact on corporate value.
- (2)
- ESG performance, green technology innovation, and enterprise value
Generally speaking, policies, resources, and investors are inclined to ESG-performing enterprises, and technological innovation is an important way to improve ESG performance. Therefore, in order to obtain the support of policies, resources, and investors, enterprises will continuously enhance their innovation ability. In addition, the competition and comparison between enterprises make enterprises place greater emphasis on ESG performance, so as to accelerate the rate of technological advancement. The technological transformation and upgrading of enterprises are not only conducive to making up for the shortcomings of enterprises, but also conducive to obtaining higher accounting profits, improving the stability of enterprise operation, and coping better with external risks, so as to realize a virtuous circle.
The theory of sustainable development emphasizes the significance of not only focusing on economic efficiency but also giving equal consideration to social equity. In order to improve their own ESG performance, enterprises actively increase the number of R&D personnel in ESG practice [40]. The technological innovation activities of enterprises not only improve their own innovation ability but can also promote the upgrading of production technology, reduce production costs, enhance competitive advantages, improve operating efficiency, and, thus, contribute to the sustainable development of enterprises. Based on the above analysis, Hypothesis 2 is proposed:
Hypothesis 2:
Enterprise ESG performance is helpful to improve green technology innovation, thereby increasing corporate value.
- (3)
- ESG performance, internal control, and enterprise value
Internal control refers to various procedures, methods, and means implemented by the organization to achieve specific goals under certain conditions. According to research, internal control can indeed bring many benefits to the development of enterprises, such as curbing management corruption and fraud and improving the innovation ability of enterprises [41]. In terms of theoretical logic, enterprises improve their ESG performance, formulate strategies more suitable for enterprise development, and adjust their organizational structure, which is conducive to improving the level of operation and management, and realizing an improvement in enterprise value.
According to the theory of information asymmetry [42], the difference in information mastery will make different subjects make different choices. In the management of enterprises, the management will be more inclined to obtain short-term benefits, while the board of directors will be more inclined to long-termism, and the difference between the two will make them choose different business strategies. Enhancing the internal control mechanisms within enterprises, elevating the governance standards, and intensifying management oversight all contribute to the reduction of fraudulent practices, enhanced protection of shareholders’ interests, and the facilitation of long-term, sustainable growth for companies. In summary, enterprise ESG performance helps to improve internal control. Internal control can mitigate the issue of principal–agent conflict arising from the imbalance of information. This paper proposes Hypothesis 3:
Hypothesis 3:
Enterprise ESG performance helps to improve internal control, thereby improving corporate value.
- (4)
- ESG performance, financing cost, and enterprise value
ESG can reflect the non-financial performance of enterprises, and good ESG performance can provide positive information for enterprises and send positive signals to investors [43]. Enterprises with higher ESG evaluation are often more likely to attract long-term investment. In addition, the government actively promotes the development of green finance. For enterprises with good environmental performance, it is easier to obtain bank loans, thereby reducing financing costs, reducing the burden on enterprises, and helping to enhance corporate value. The financing cost directly affects the financial situation of the enterprise. High-cost financing methods will increase the financial burden on enterprises and reduce profits, thus affecting the solvency and profitability of enterprises.
The cost of financing will affect the capital structure of the enterprise, that is, the proportion of debt and equity. When the debt cost is relatively low, companies are more inclined to use debt financing, and when the debt cost rises, companies may be more inclined to use equity financing [44]. The change of capital structure will affect the risk and value of enterprises. Financing costs will also affect the competitiveness of enterprises in the market. Low-cost financing methods can help companies reduce the price of products or services, increase market share, and, thus, increase the value of the company. Financing cost directly affects the financial situation, capital structure, investment decision, stock price, and competitiveness of enterprises, so it has an important impact on enterprise value. In summary, the better the ESG performance of the enterprise, the smaller the financing cost of the enterprise. Based on the above analysis, we can propose Hypothesis 4:
Hypothesis 4:
Enterprise ESG performance helps to reduce financing costs and increase corporate value.
- (5)
- ESG performance, economic policy uncertainty, and enterprise value
The uncertainty of macroeconomic policy is an unavoidable risk in the business process of enterprises, but from the law of economic operation, any uncertainty contains many opportunities, brings new market opportunities, and promotes enterprise investment. On the other hand, the uncertainty of economic policy will also bring risks and challenges. Based on the above analysis, we propose Hypothesis 5:
Hypothesis 5:
The uncertainty of economic policy positively regulates the relationship between ESG and enterprise value.
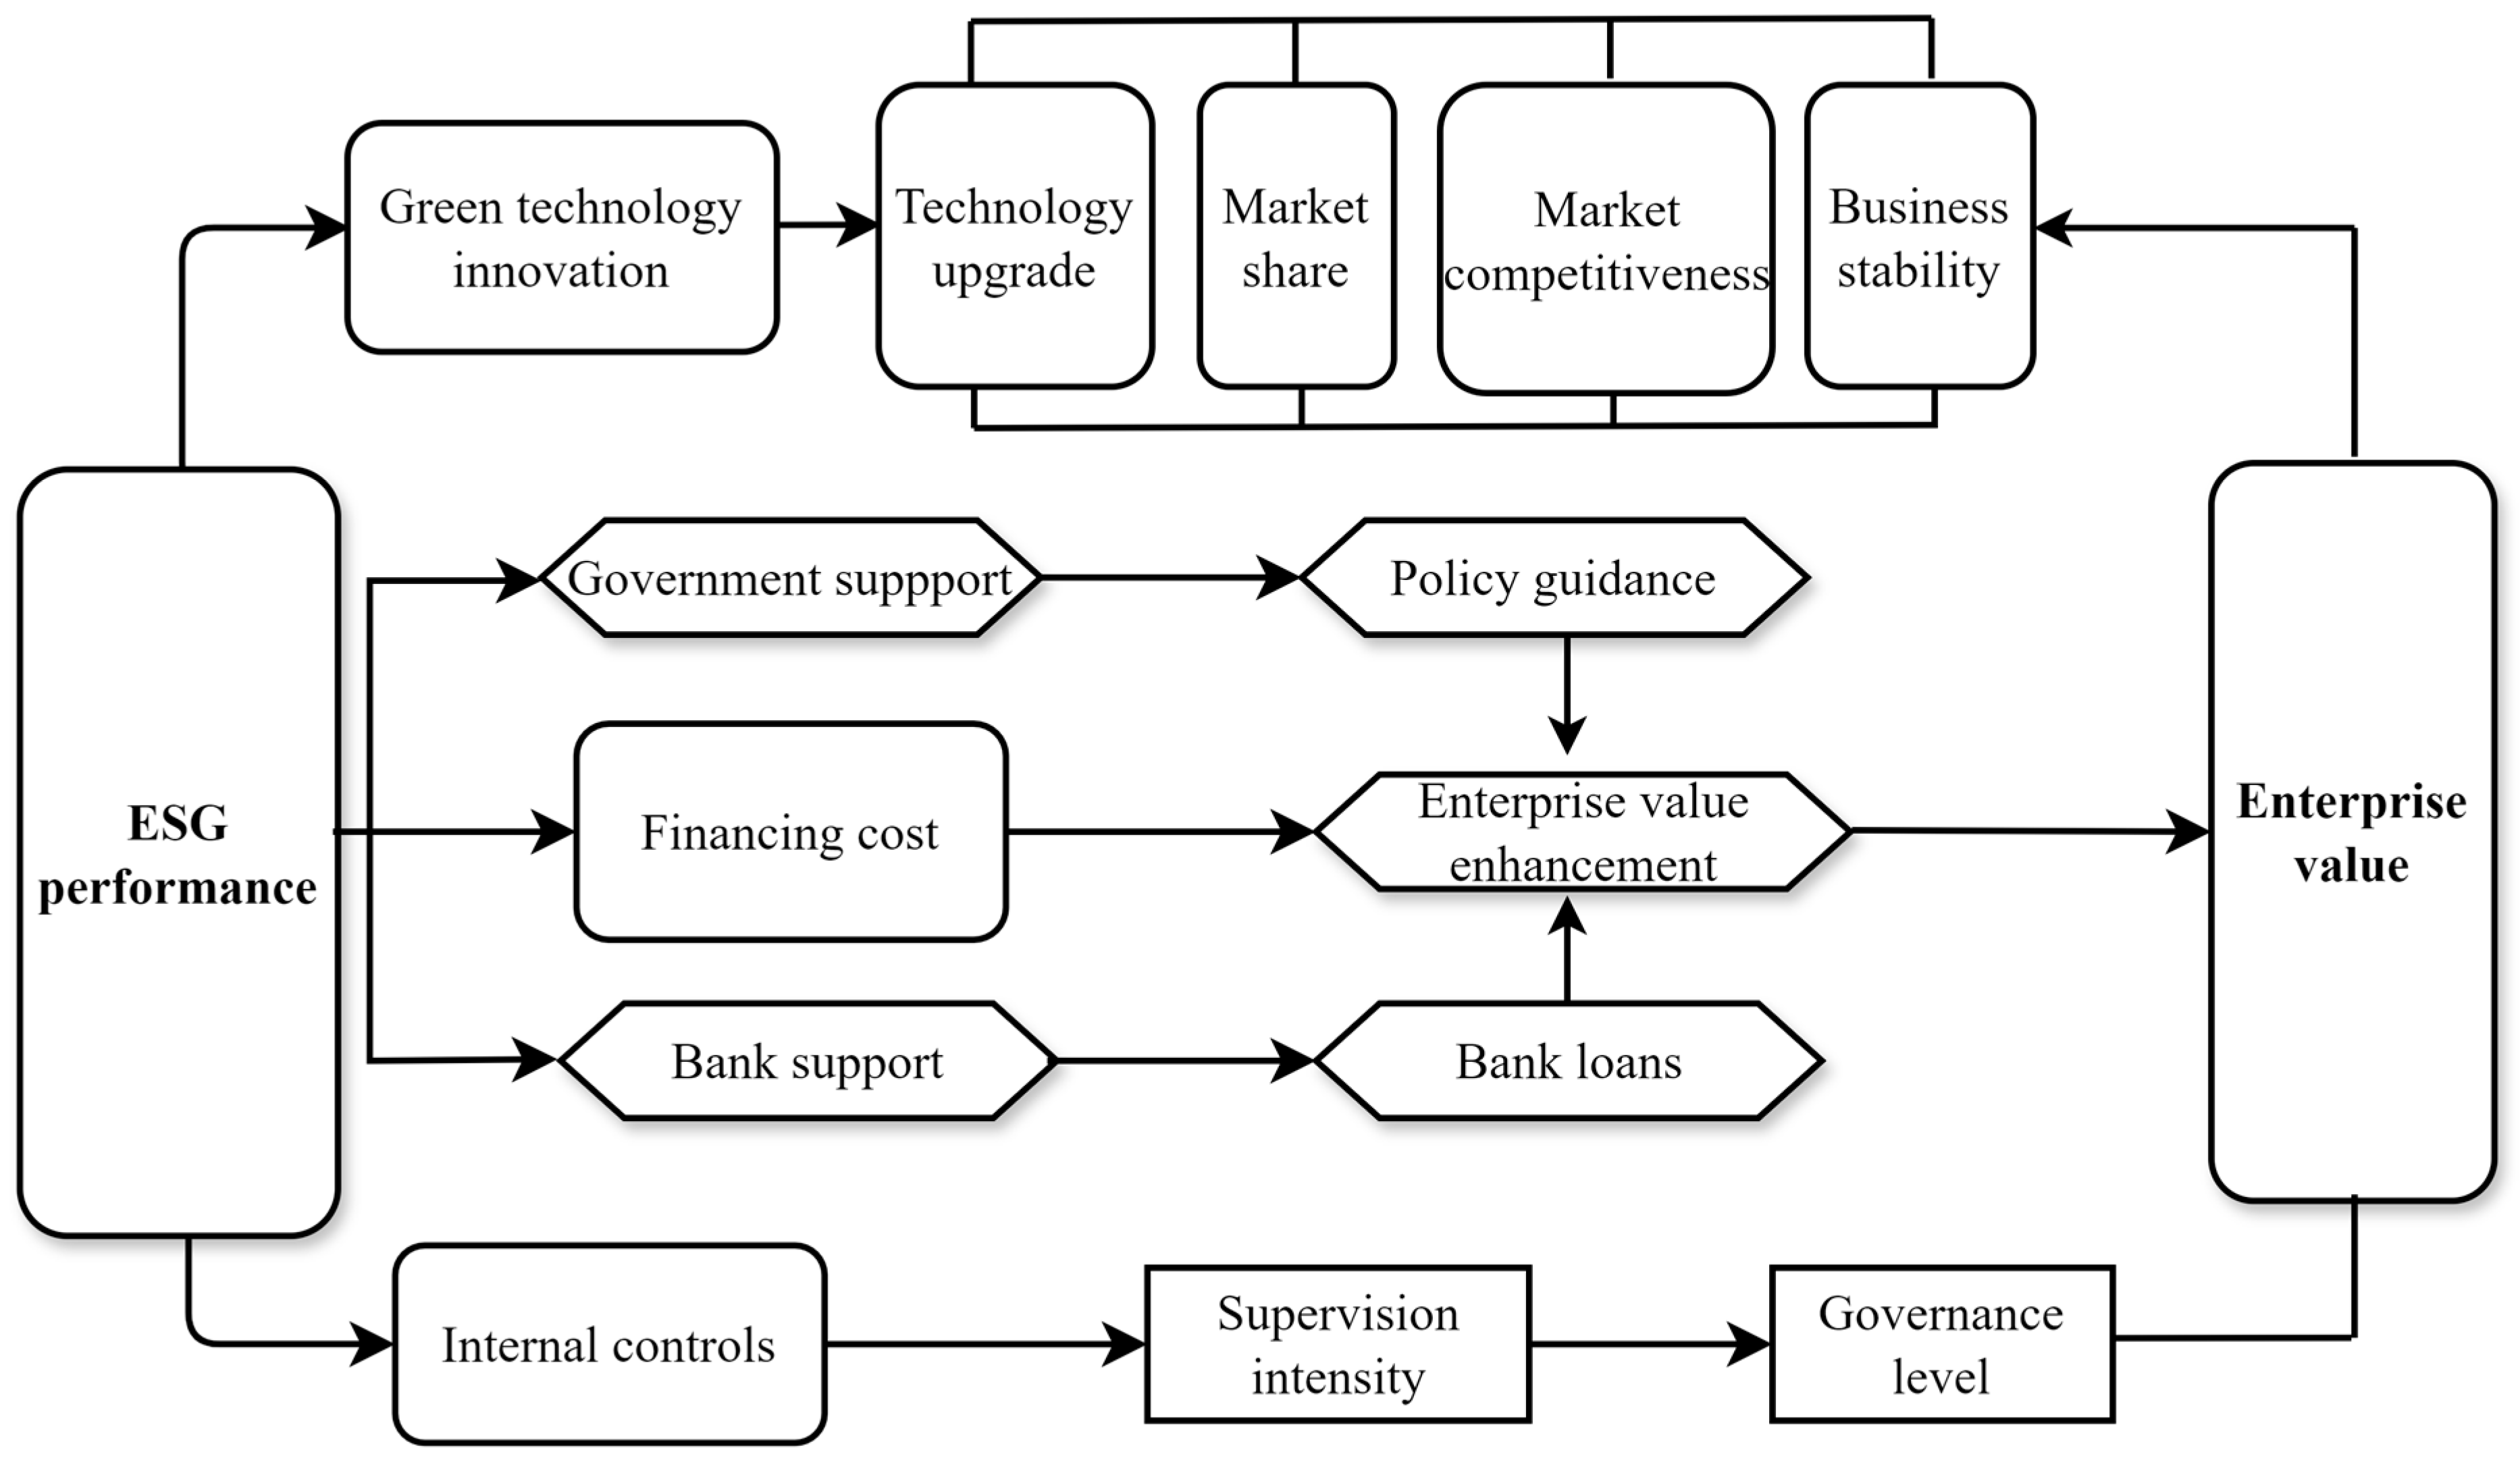
Based on this logical reasoning, a mechanism framework of ESG rating influencing the value of enterprises is established in this paper, which includes three components: green technology innovation [45,46,47], internal control, and financing cost, as shown in Figure 1.

Figure 1.
The influence mechanism of ESG performance on the value of heavily polluting listed companies.
3. Research Design
3.1. Sample Selection and Data Sources
This paper selects 2015–2022 as the observation years, and selects a total of 661 heavily polluting listed companies in China. ESG performance is from the Huazheng ESG rating database. In 2014, the issuance of the revised Environmental Protection Law of the People’s Republic of China took place, requiring key polluters to truthfully disclose their major pollutant discharge to the public, and for polluters to further attach importance to environmental protection. Therefore, the sample of this paper began in 2015. The study excludes ST, ST* companies, and companies that lack important variables, and finally obtains 4677 observations, and winsorizes the main variables at the 95% level. The primary sources of data utilized are predominantly derived from the CSMAR database, Wind database, and the online portals of provincial statistical bureaus.
3.2. Variable Setting
- (1)
- Enterprise value (EV)
The explained variable is enterprise value. There are various measures of enterprise value in available research, such as the TobinQ value and EVA. This study chooses the return on total assets (ROA) as the measure, which reflects the utilization efficiency and profitability of the company’s total assets and reflects the intrinsic value of the enterprise [48,49].
- (2)
- ESG performance (ESG)
The ESG concept was first proposed by Goldman Sachs in 2007, and internationally it is represented by Sunglass, Thomson Reuters, and Dow Jones. China’s domestic ESG evaluation is more diversified, for example, there are several evaluation systems such as the Huazheng index. Despite the fact that the international ESG rating system is more perfect, there are many inappropriate measurements of ESG performance of Chinese companies, due to its lack of understanding of China’s national conditions and development, so we choose the Huazheng ESG rating index to assess the ESG performance of companies.
The Huazheng ESG rating has constructed a corporate governance evaluation system for listed companies and, at the same time, it has incorporated data on rural revitalization into the evaluation indexes to better reflect Chinese characteristics. The Huazheng ESG ratings range from C to AAA, and the nine ratings are assigned from 1 to 9 by the assignment method.
- (3)
- Intermediate variables
Green technological innovation (Gre): Since patent application data are more stable and timelier than licensing data, this paper selects the logarithm of the number of green patent applications as a proxy variable for green technological innovation [50,51].
Financing cost (Fc): Based on relevant research, the measurement of financing expenses is performed by calculating the proportion of the company’s financial costs in relation to the total liabilities at the end of the year. [52,53].
Internal control (Inc): The “Dibo internal control index of Chinese Listed Companies” is used to measure the level of internal control. The index is a combination of the five elements of internal control, the efficiency of the implementation of corporate internal control norms, and the effectiveness of the implementation, which is a more realistic reflection of the level of internal control of listed companies in China [54].
- (4)
- Control variables
To prevent omitted variables from causing bias in the model estimation results, as well as to comprehensively collate the control variables used in related literature studies [55,56], the following control variables are selected in this paper: company age (Age), business life (Time), percentage of fixed assets (FA), percentage of intangible assets (IA), asset-liability ratio (lev), ownership concentration (Contl), combination of chairman and CEO positions (Com), percentage of independent directors (Indr), accounting quality (AcQ), company growth (Growth), Enterprise size (Size), audit quality (AuQ), and board size (Bsize). In addition, we control for year and industry. The relevant variables are defined in Table 1.

Table 1.
Variable definitions.
3.3. Model Setting
For the study of the impact of ESG performance on enterprise value, model (1) is constructed:
Meanwhile, in order to investigate the mechanism effect between ESG performance and the enterprise value, this paper introduces mediating variables to construct model (2) based on the mediation effect test method [57]:
where Med stands for the mediating variables green technology innovation (Gre), financing cost (Fc), and internal control (Inc), i stands for individual firms, and t stands for year; is the intercept term, and is the random error term. In the empirical analysis, a benchmark regression is conducted for model (1), followed by a mechanism test for model (2).
In order to study the impact of economic policy uncertainty on the relationship between ESG performance and enterprise value, the interaction term ESG*EPU is introduced, based on model (1), to obtain model (3).
4. Empirical Analysis
4.1. Descriptive Statistics
Table 2 presents the summary statistics. Different heavy polluters exhibit significant variations in their ESG performance. The maximum value of the internal control index is six times the minimum value, which shows that there are obvious differences in the internal control level of different enterprises. Green technology innovation ranges from 0 to 281, highlighting significant variations in the level of innovation across different enterprises. The control variables such as company age are also all within a reasonable range.
Table 2.
Descriptive statistics of major variables.
According to relevant studies, two or more explanatory variables are highly correlated. To prevent multicollinearity among explanatory variables, we use a variance inflation factor (VIF) to diagnose multicollinearity [58]. The VIF value reflects the correlation between the variables; when 0 < VIF < 10, this indicates that there is no multicollinearity problem. As can be seen in Table 3, the variables in this study exhibit VIF values below 10 and tolerances exceeding 0.1, suggesting the absence of a multicollinearity issue among them.
Table 3.
Multicollinearity analysis.
4.2. Baseline Regression Analysis
On the basis of correlation analysis, to examine the ESG performance’s impact on enterprise value in heavy-pollution industry, this paper adopts a regression of model (1) and controls the industry and year, and rwe can find the results in Table 4. When the control variables are not considered, it is significant; when the control variables are added, the results are still significant at the 1% level. This shows that the higher the ESG score, the greater the enterprise value, that is, the better the ESG performance of the enterprise, the greater the enterprise value, and H1 holds. Thus, it can be seen that by improving management, production technology, and environmental protection, heavily polluting enterprises can help to enhance their enterprise value.
Table 4.
Benchmark regression results.
4.3. Mechanism Test
According to the above theoretical analysis logic, on the basis of model (2), the path test of green technology innovation, internal control, and financing cost is added to explore the internal logic.
According to the data presented in Table 5, there is a notable positive correlation between ESG performance and green technology innovation. This correlation is found to be remarkable at the 5% level, indicating that a favorable ESG performance has the potential to enhance the extent of corporate green technology innovation. Enterprises strengthen green technology innovation and other behaviors are conducive to the enhancement of enterprise innovation capacity, which can promote the upgrading of production technology, reduce production costs, and improve operational efficiency.
Table 5.
Mechanism test of ESG impact on enterprise value.
ESG performance and financing costs are significantly negatively correlated at the 1% level, which means that the better the ESG performance, the lower the cost of corporate financing. Enterprises with good ESG performance have good non-financial performance, which is conducive to attracting investors, and at the same time, they can obtain preferential bank loans, which helps enterprises to expand their scale of operation, expand the operation of the business, and enhance the value of the enterprise.
The regression coefficient of ESG performance and enterprise internal control is 0.032, which is significantly positively correlated at the 1% level; we find ESG performance helps to improve the level of enterprise internal control.
4.4. Regulating Effect
As one of the key macro-factors, economic policy uncertainty will affect ESG and ROA. On the one hand, economic policy uncertainty will have an impact on the marginal value of capital and labor input [59,60,61,62], and the uncertainty may increase or decrease the relationship between ESG and firm performance. Meanwhile, the uncertainty of economic policies will affect the economic activities of enterprises. The performance of the economic activities of enterprises can be reflected by the financial report, and the indicators used to measure ESG performance will eventually be reflected by the company’s financial report. It is precisely the existence of the macroeconomic factor of economic policy uncertainty that may affect the ESG prediction of enterprise value [63]. To solve this problem, the interaction term ESG*EPU is introduced. The term EPU pertains to the unpredictability surrounding economic policies. In this study, the economic policy uncertainty is constructed using the South China Morning Post as the subject of analysis, while the data are sourced from the Global Economic Policy Uncertainty Website [64]. According to Table 6, the interaction term coefficient is significant at the 10% level after regression of model (3). This suggests that the real options value of ESG activities dominates the ability to wait for the resolution of uncertainty.
Table 6.
Introduction of interaction terms.
4.5. Robustness Analysis
- (1)
- Replace the explained variable
Replace the explained variable with ROE, and use ROE to reflect the enterprise value [65]. From Table 7, regardless of the consideration of control variables, a strong positive correlation between ESG performance and enterprise value is observable at the 1% level. The regression results are consistent with the foregoing discussion.
- (2)
- Replace the explanatory variable
Replace the explanatory variable with Bloomberg ESG ratings [66]. It can be seen from Table 7 that after the explanatory variable is replaced with Bloomberg ESG rating data, whether the control variable is added or not, ESG performance has a significant impact on corporate value, indicating that the results are still robust after replacing the explanatory variables.
- (3)
- Replace regression model
To ensure accurate results, a robustness test is conducted by substituting the regression model. The OLS least-squares regression model is employed as a replacement for the two-way fixed-effect model [67]. The regression results are shown in Table 8. The replacement of the regression model reveals a significant impact of ESG performance on corporate value, reaching a level of significance at 1%. Furthermore, the findings remain robust.
- (4)
- Endogeneity test
To address the endogeneity issue between variables, the explanatory and control variables are regressed using lagged data from the previous period, ensuring the preservation of the original context. We find in Table 9 that the results are still significantly positive, showing that the results are robust.
- (5)
- Strip out the effects of inflation
Inflation, as an important influencing factor, has received much attention in empirical research. Specifically, due to the supply chain and the war in Ukraine, the impact of inflation increased significantly in 2022 [68] and inflation automatically increases the value of the ROA, resulting in a higher nominal value of a company’s net income, while total assets recorded at historical cost remain the same. With the increase in ESG investment, the value of ESG will continue to increase [69], and the ROA will also increase due to inflation. At this time, high ESG and ROA may cause endogenous problems. In order to solve this problem, after excluding the data of 2022, a robustness test is conducted in this paper. According to Table 10, after excluding the effect of inflation, the correlation between ESG performance and enterprise value is still significant at the 1% level.
Table 7.
Replace explained variable and explanatory variable.
Table 8.
Replace regression model.
Table 9.
Control variables are all regressed with one-period lagged data.
Table 10.
The regression results after adjusting for inflation.
4.6. Heterogeneity Analysis
- (1)
- Resource endowment
The amount of resources in the region will affect the layout and development of the industrial structure [70]. Based on the “National Sustainable Development Plan for Resource-based Cities (2013–2020)” issued by the State Council, the cities where the enterprises are located fall into two categories. The regression results are presented in Table 11. The correlation between the ESG performance regression coefficients of heavy-polluting enterprises in non-resource-based cities is significantly positive at the 1% level, with a coefficient of 0.004. The regression coefficient of ESG performance of heavy-polluting enterprises in resource-based cities to enterprise value is not significant.
Table 11.
Heterogeneity analysis of resource endowment.
- (2)
- Nature of ownership
Enterprises with different ownership nature will be different in terms of social responsibility, internal reform, and the degree of implementation of national policies. To investigate the impact of ownership nature variation, this research divides the enterprises into two categories [71]. Non-state-owned enterprises are recorded as 0, state-owned enterprises are recorded as 1, and the regression results are shown in Table 12. The regression coefficient of non-state-owned enterprises is more significant as a whole.
Table 12.
Heterogeneity analysis of the nature of ownership.
- (3)
- Executives’ background
According to the upper echelons theory, the decision-making behavior of enterprises is closely related to the cognitive level, education level, and concept of decision-makers. If corporate executives have overseas education or an overseas employment background, they usually have a stronger ability to accept and innovate, and are more likely to accept the ESG concept. In this paper, according to whether the senior executives of the board of directors have overseas education or employment background, the sample enterprises are divided into two types of executives with no background and background for regression [72]. Specifically, as shown in Table 13, regardless of whether the directors and supervisors have an overseas background, the regression coefficient is notable in that it is greater in the group with an overseas background than in the group without an overseas background, indicating that ESG performance has a greater impact on corporate value in enterprises with an overseas background.
Table 13.
Heterogeneity analysis of executive background.
5. Discussion
Firstly, government departments should actively promote the construction of an ESG evaluation system with Chinese characteristics, strengthen the supervision and management of ESG rating agencies, enhance the legislation and regulations pertaining to the disclosure of ESG information, thereby encouraging enterprises to proactively reveal their ESG information, and accelerate the construction of ESG information infrastructure and promote the establishment of a unified ESG regulatory agency. Additionally, they should offer tax benefits and environmental grants to heavily polluting corporations that exhibit commendable ESG practices, intensify penalties for companies with subpar ESG performance, and elevate the significance of ESG for enterprises.
Secondly, enterprises should understand correctly the positive effect of ESG performance on the improvement of enterprise value, the reduction of financing costs, and the improvement in enterprise value. At the same time, enterprises should pay attention to the formation of ESG management teams, strengthen cooperation with ESG rating agencies, strengthen their own ESG data collection and management, actively disclose ESG information, actively assume social responsibility, integrate emission reduction paths and methods suitable for their own development, and realize the unity of economic development and environmental protection.
6. Conclusions
Based on the data from heavily polluting listed companies from 2015 to 2022, we evaluate the impact of ESG rating on enterprise value. The results show that ESG performance helps to enhance enterprise value. Green technology innovation, enterprise internal control, and financing cost play an intermediary role. Good ESG performance can improve the level of enterprise green technology innovation, contribute to the sustainable development of enterprises, and enhance enterprise value. ESG performance helps to improve the internal control level. The better the ESG performance, the lower the financing cost, which helps to enhance the value of the enterprise. According to the heterogeneity analysis of resource endowment, ownership nature, and overseas background of executives, it is found that the ESG performance of heavily polluting enterprises in non-resource-based cities has a more obvious effect on the promotion of enterprise value; the ESG performance of non-state-owned enterprises is more conducive to enhancing corporate value; and the ESG performance of enterprises with an overseas background is more conducive to the improvement of enterprise value. By studying the moderating effect of economic policy uncertainty, it is found that economic policy uncertainty will affect the relationship between ESG performance and enterprise value. The uncertainty of economic policy positively regulates ESG and ROA. The conclusion of the study provides empirical evidence to demonstrate the relationship between ESG performance and enterprise value in heavy-polluting industries and the path of influence, which is helpful for heavy-polluting enterprises to improve ESG performance, and further provides experience for the transformation and development of similar enterprises. It is helpful to promote the sustainable and healthy development of China’s economy and strengthen the construction of an ESG information disclosure system in China.
As an important indicator to evaluate corporate social sustainable development, an ESG rating can not only enhance corporate image and value but also enhance corporate financial and social responsibility risk management capabilities and promote corporate green development. Therefore, poor ESG performance is contrary to high-quality development of enterprises. Enterprises with higher ESG ratings can obtain more favorable financing conditions, such as low-interest loans, preferential bond pricing, etc. By improving environmental, social, and governance performance, companies can reduce financing costs, increase financial leverage, and enhance competitive advantages.
Author Contributions
Conceptualization, Y.Z. and X.W.; methodology, Y.Z.; software, X.W.; validation, Y.Z. and W.G.; formal analysis, X.W. and X.T.; investigation, Y.Z., X.W. and X.G.; resources, Q.W. and X.T.; data curation, Y.Z. and X.W.; writing—original draft preparation, X.W. and Y.Z.; writing—review and editing, X.G., Q.W. and W.G.; visualization, X.W.; supervision, Y.Z. All authors have read and agreed to the published version of the manuscript.
Funding
This research received no external funding.
Institutional Review Board Statement
Not applicable.
Data Availability Statement
The data presented in this study are available on request from the corresponding author.
Acknowledgments
Special thanks are given to those who participated in the writing of this paper.
Conflicts of Interest
The authors declare no conflict of interest.
References
- Siwei, D.; Chalermkiat, W. An Analysis on the Relationship between ESG Information Disclosure and Enterprise Value: A Case of Listed Companies in the Energy Industry in China. Cogent Bus. Manag. 2023, 10, 2207685. [Google Scholar] [CrossRef]
- Aladwey, L.M.A.; Alsudays, R.A. Does the Cultural Dimension Influence the Relationship between Firm Value and Board Gender Diversity in Saudi Arabia, Mediated by ESG Scoring? J. Risk Financ. Manag. 2023, 16, 512. [Google Scholar] [CrossRef]
- Zhang, C.; Azman, N.H.B.N. Environmental Social and Governance (ESG) Performance of Corporate Value in Different Periods. Bus. Manag. Strategy 2023, 14, 85–108. [Google Scholar] [CrossRef]
- Habib, A.M. Does Real Earnings Management Affect a Firm’s Environmental, Social, and Governance (ESG), Financial Performance, and Total Value? A Moderated Mediation Analysis. Environ. Dev. Sustain. 2023, 1–30. [Google Scholar] [CrossRef]
- Rastogi, S.; Singh, K.; Kanoujiya, J. Firm’s Value and Esg: The Moderating Role of Ownership Concentration and Corporate Disclosures. Asian Rev. Account. 2024, 32, 70–90. [Google Scholar] [CrossRef]
- Tang, H.; Xiong, L.; Peng, R. The Mediating Role of Investor Confidence on Esg Performance and Firm Value: Evidence from Chinese Listed Firms. Financ. Res. Lett. 2024, 61, 104988. [Google Scholar] [CrossRef]
- Lemma, T.T.; Muttakin, M.; Mihret, D. Environmental, Social, and Governance Performance, National Cultural Values and Corporate Financing Strategy. J. Clean. Prod. 2022, 373, 133821. [Google Scholar] [CrossRef]
- Dincă, M.S.; Vezeteu, C.-D.; Dincă, D. The Relationship between Esg and Firm Value. Case Study of the Automotive Industry. Front. Environ. Sci. 2022, 10, 1059906. [Google Scholar] [CrossRef]
- Aydoğmuş, M.; Gülay, G.; Ergun, K. Impact of Esg Performance on Firm Value and Profitability. Borsa Istanb. Rev. 2022, 22, S119–S127. [Google Scholar] [CrossRef]
- Tahmid, T.; Hoque, M.N.; Said, J.; Saona, P.; Azad, M.A.K. Does Esg Initiatives Yield Greater Firm Value and Performance? New Evidence from European Firms. Cogent Bus. Manag. 2022, 9, 2144098. [Google Scholar] [CrossRef]
- Garcia, A.S.; Orsato, R.J. Testing the Institutional Difference Hypothesis: A Study About Environmental, Social, Governance, and Financial Performance. Bus. Strategy Environ. 2020, 29, 3261–3272. [Google Scholar] [CrossRef]
- Liu, Y.; Deng, Y.; Li, C.; Twumasi, M.A.; Cheng, Y. Do Disclosure of Esg Information Policies Inhibit the Value of Heavily Polluting Enterprises?—Evidence from China. Heliyon 2023, 9, e22750. [Google Scholar] [CrossRef] [PubMed]
- Yang, B.; Lin, C.; Ren, C. Internationalization Strategy, Social Responsibility Pressure and Enterprise Value. Soft Comput. 2020, 24, 2487–2494. [Google Scholar] [CrossRef]
- Sadiq, M.; Singh, J.; Raza, M.; Mohamad, S. The Impact of Environmental, Social and Governance Index on Firm Value: Evidence from Malaysia. Int. J. Energy Econ. Policy 2020, 10, 555–562. [Google Scholar] [CrossRef]
- Kim, R.; Koo, B. The Impact of ESG Rating Disagreement on Corporate Value. J. Deriv. Quant. Stud. 2023, 31, 219–241. [Google Scholar] [CrossRef]
- Wu, Z.; Lin, S.; Chen, T.; Luo, C.; Xu, H. Does Effective Corporate Governance Mitigate the Negative Effect of ESG Controversies on Firm Value? Econ. Anal. Policy 2023, 80, 1772–1793. [Google Scholar] [CrossRef]
- Anita, M.; Shveta, S.; Surendra, S.Y.; Arvind, M. When Do ESG Controversies Reduce Firm Value in India? Glob. Financ. J. 2023, 55, 100809. [Google Scholar]
- Behl, A.; Kumari, P.S.R.; Makhija, H.; Sharma, D. Exploring the Relationship of ESG Score and Firm Value Using Cross-Lagged Panel Analyses: Case of the Indian Energy Sector. Ann. Oper. Res. 2022, 313, 231–256. [Google Scholar] [CrossRef]
- Zheng, Y.; Wang, B.; Sun, X.; Li, X. ESG Performance and Corporate Value: Analysis from the Stakeholders’ Perspective. Front. Environ. Sci. 2022, 10, 1084632. [Google Scholar] [CrossRef]
- Rojo-Suárez, J.; Alonso-Conde, A.B. Short-Run and Long-Run Effects of ESG Policies on Value Creation and the Cost of Equity of Firms. Econ. Anal. Policy 2023, 77, 599–616. [Google Scholar] [CrossRef]
- Al-Issa, N.; Khaki, A.R.; Jreisat, A.; Al-Mohamad, S.; Fahl, D.; Limani, E. Impact of Environmental, Social, Governance, and Corporate Social Responsibility Factors on Firm’s Marketing Expenses and Firm Value: A Panel Study of Us Companies. Cogent Bus. Manag. 2022, 9, 2135214. [Google Scholar] [CrossRef]
- Brinette, S.; Sonmez, F.D.; Tournus, P.S. ESG Controversies and Firm Value: Moderating Role of Board Gender Diversity and Board Independence. IEEE Trans. Eng. Manag. 2023, 71, 4298–4307. [Google Scholar] [CrossRef]
- Wu, K.; Chang, B.-G. The Concave–Convex Effects of Environmental, Social and Governance on High-Tech Firm Value: Quantile Regression Approach. Corp. Soc. Responsib. Environ. Manag. 2022, 29, 1527–1545. [Google Scholar] [CrossRef]
- Akbar, Z.F.; Nusa, I.B.S.; Iriyadi, I. The Influence of Profitability and Liquidity on Firm Value (Case Study on a Non-Financial Company Indexed ESG Quality 45 Idx-Kehati on the Indonesia Stock Exchange 2017–2020). Asian J. Econ. Bus. Account. 2022, 22, 132–142. [Google Scholar] [CrossRef]
- Habib, A.M. Does the Efficiency of Working Capital Management and Environmental, Social, and Governance Performance Affect a Firm’s Value? Evidence from the United States. Financ. Mark. Inst. Risks (FMIR) 2022, 6, 18–25. [Google Scholar] [CrossRef]
- Benjamin, S.J.; Biswas, P.K. Does Winning a Csr Award Increase Firm Value? Int. J. Discl. Gov. 2022, 19, 313–329. [Google Scholar] [CrossRef]
- Dmitry, Z.; Venera, V.; Gayaz, V. Accounting for ESG Risks in the Discount Rate for Business Valuation. Кoрпoративные финансы 2022, 16, 83–98. [Google Scholar]
- Sani, N.F.A.; Muda, R.; Arshad, R.; Nair, R. The Influence of Environmental, Social, Governance Factors and Firm Performance on the Sustainable Reporting of Malaysian Companies. Int. J. Econ. Bus. Res. 2020, 20, 407–424. [Google Scholar] [CrossRef]
- Qureshi, M.A.; Kirkerud, S.; Theresa, K.; Ahsan, T. The Impact of Sustainability (Environmental, Social, and Governance) Disclosure and Board Diversity on Firm Value: The Moderating Role of Industry Sensitivity. Bus. Strategy Environ. 2020, 29, 1199–1214. [Google Scholar] [CrossRef]
- Feng, Z.; Wu, Z. ESG Disclosure, Reit Debt Financing and Firm Value. J. Real Estate Financ. Econ. 2023, 67, 388–422. [Google Scholar] [CrossRef]
- Abdi, Y.; Li, X.; Càmara-Turull, X. Exploring the Impact of Sustainability (ESG) Disclosure on Firm Value and Financial Performance (FP) in Airline Industry: The Moderating Role of Size and Age. Environ. Dev. Sustain. 2022, 24, 5052–5079. [Google Scholar] [CrossRef]
- Yu, E.P.; Guo, C.Q.; Van Luu, B. Environmental, Social and Governance Transparency and Firm Value. Bus. Strategy Environ. 2018, 27, 987–1004. [Google Scholar] [CrossRef]
- Aboud, A.; Diab, A. The Impact of Social, Environmental and Corporate Governance Disclosures on Firm Value: Evidence from Egypt. J. Account. Emerg. Econ. 2018, 8, 442–458. [Google Scholar] [CrossRef]
- Aouadi, A.; Marsat, S. Do ESG Controversies Matter for Firm Value? Evidence from International Data. J. Bus. Ethics 2018, 151, 1027–1047. [Google Scholar] [CrossRef]
- Pekovic, S.; Vogt, S. The Fit between Corporate Social Responsibility and Corporate Governance: The Impact on a Firm’s Financial Performance. Rev. Manag. Sci. 2021, 15, 1095–1125. [Google Scholar] [CrossRef]
- Buchanan, B.; Cao, C.X.; Chen, C. Corporate Social Responsibility, Firm Value, and Influential Institutional Ownership. J. Corp. Financ. 2018, 52, 73–95. [Google Scholar] [CrossRef]
- Sackley, H.W.; Vashakmadze, T.T. The Enhancement of Equity Valuations in Developed and Emerging Markets through the Use of Sustainable Investment Indicators. Кoрпoративные финансы 2014, 8, 53–57. [Google Scholar] [CrossRef]
- Balogh, I.; Srivastava, M.; Tyll, L. Towards Comprehensive Corporate Sustainability Reporting: An Empirical Study of Factors Influencing ESG Disclosures of Large Czech Companies. Soc. Bus. Rev. 2022, 17, 541–573. [Google Scholar] [CrossRef]
- Mzembe, A.N.; Idemudia, U. External Stakeholders and the Social Enterprise (SE) Identity Formation in a Developing Country Context: A Social Exchange Perspective. Soc. Enterp. J. 2024, 20, 32–53. [Google Scholar] [CrossRef]
- Jianqiang, G.; Rong, L.; Juan, X. Data Element Embedding and Firm Performance: The Influence of ESG Investment. Front. Environ. Sci. 2022, 10, 974399. [Google Scholar] [CrossRef]
- Cheng, R.; Kim, H.; Ryu, D. ESG Performance and Firm Value in the Chinese Market. Invest. Anal. J. 2023, 53, 1–15. [Google Scholar] [CrossRef]
- Lin, S. The Measurement of Zombie Enterprise under Information Asymmetry—A Case of China’s Iron and Steel Industry. J. Appl. Econ. 2023, 26, 2259245. [Google Scholar] [CrossRef]
- Zhao, W.; Liang, Y.; Li, P. Can Enterprises’ Participation in Targeted Poverty Alleviation Reduce the Cost of Debt Financing? Evidence from China. Financ. Res. Lett. 2023, 58, 104551. [Google Scholar] [CrossRef]
- Su, Y.; Zhu, X.; Deng, Y.; Chen, M.; Piao, Z. Does the Greening of the Tax System Promote the Green Transformation of China’s Heavily Polluting Enterprises? Environ. Sci. Pollut. Res. 2023, 30, 54927–54944. [Google Scholar] [CrossRef] [PubMed]
- Chen, M.; Su, Y.; Piao, Z.; Zhu, J.; Yue, X. The Green Innovation Effect of Urban Energy Saving Construction: A Quasi-Natural Experiment from New Energy Demonstration City Policy. J. Clean. Prod. 2023, 428, 139392. [Google Scholar] [CrossRef]
- Chaudhry, S.M.; Chen, X.H.; Ahmed, R.; Nasir, M.A. Risk Modelling of ESG (Environmental, Social, and Governance), Healthcare, and Financial Sectors. Risk Anal. 2023. [Google Scholar] [CrossRef] [PubMed]
- Su, Y.; Li, W.; Chen, M.; Wu, C.; Tan, X. Innovation Policy and Ecological Welfare Performance: Evidence from a Quasi-Natural Experiment of China. Environ. Sci. Pollut. Res. 2023, 30, 100994–101013. [Google Scholar] [CrossRef] [PubMed]
- Abughniem, M.S.; Al Aishat, M.A.H.; Hamdan, A. Free Cash Flow and Firm Performance: Empirical Evidence from the Amman Stock Exchange. Int. J. Innov. Creat. Chang. 2020, 10, 668–681. [Google Scholar]
- Bansal, D.; Singh, S. Does Board Structure Impact a Firm’s Financial Performance? Evidence from the Indian Software Sector. Am. J. Bus. 2022, 37, 34–49. [Google Scholar] [CrossRef]
- Wu, W.; Wu, W.; Wu, K.; Ding, C. The Nexus between Green Innovations and Natural Resources Commodity Prices in China. Resour. Policy 2022, 78, 102719. [Google Scholar] [CrossRef]
- Jiang, C.; Liu, D. Effects of Venture Capital on Green Technology Innovation in New Energy Vehicle Industry in China. Energy Environ. 2024, 35, 418–437. [Google Scholar] [CrossRef]
- Chen, H.; Yoon, S.S. Does Technology Innovation in Finance Alleviate Financing Constraints and Reduce Debt-Financing Costs? Evidence from China. Asia Pac. Bus. Rev. 2022, 28, 467–492. [Google Scholar] [CrossRef]
- Zhai, L. Impact of Board Characteristics on Debt Financing Costs. In Proceedings of the 2019 International Conference on Economic Management and Model Engineering (ICEMME) 2019, Malacca, Malaysia, 6–8 December 2019. [Google Scholar]
- Liu, A. An Empirical Study on the Quality of Internal Control and the Financing Cost of Enterprises. In Proceedings of the 2017 7th International Conference on Education, Management, Computer and Society (EMCS 2017) 2017, Shenyang, China, 17–19 March 2017. [Google Scholar]
- Rabaya, A.J.; Saleh, N.M. The Moderating Effect of Ir Framework Adoption on the Relationship between Environmental, Social, and Governance (ESG) Disclosure and a Firm’s Competitive Advantage. Environ. Dev. Sustain. 2022, 24, 2037–2055. [Google Scholar] [CrossRef]
- Dai, L.; Song, C.; You, Y.; Zhang, W. Do Sovereign Wealth Funds Value ESG Engagement? Evidence from Target Firm’s Csr Performance. Financ. Res. Lett. 2022, 50, 103226. [Google Scholar] [CrossRef]
- Jia, J.; Ma, Y.; Xu, S.; Zheng, J.; Ma, X.; Zhang, Y.; Sun, W.; Liu, L. Effect of Academic Self-Efficacy on Test Anxiety of Higher Vocational College Students: The Chain Mediating Effect. Psychol. Res. Behav. Manag. 2023, 16, 2417–2424. [Google Scholar] [CrossRef] [PubMed]
- Tamura, R.; Kobayashi, K.; Takano, Y.; Miyashiro, R.; Nakata, K.; Matsui, T. Mixed Integer Quadratic Optimization Formulations for Eliminating Multicollinearity Based on Variance Inflation Factor. J. Glob. Optim. 2019, 73, 431–446. [Google Scholar] [CrossRef]
- Bloom, N. The Impact of Uncertainty Shocks. Econometrica 2009, 77, 623–685. [Google Scholar]
- Campello, M.; Cortes, G.S.; d’Almeida, F.; Kankanhalli, G. Exporting Uncertainty: The Impact of Brexit on Corporate America. J. Financ. Quant. Anal. 2022, 57, 3178–3222. [Google Scholar] [CrossRef]
- Campello, M.; Kankanhalli, G.; Muthukrishnan, P. Corporate Hiring under COVID-19: Financial Constraints and the Nature of New Jobs. J. Financ. Quant. Anal. 2023, 1–45. [Google Scholar] [CrossRef]
- Campello, M.; Kankanhalli, G.; Kim, H. Delayed Creative Destruction: How Uncertainty Shapes Corporate Assets. J. Financ. Econ. 2024, 153, 103786. [Google Scholar] [CrossRef]
- Kankanhalli, G.; Kwan, A. Bargaining Power in the Market for Intellectual Property: Evidence from Licensing Contract Terms. J. Empir. Leg. Stud. 2024, 21, 109–173. [Google Scholar] [CrossRef]
- Xie, G.; Chen, J.; Hao, Y.; Lu, J. Economic Policy Uncertainty and Corporate Investment Behavior: Evidence from China’s Five-Year Plan Cycles. Emerg. Mark. Financ. Trade 2021, 57, 2977–2994. [Google Scholar] [CrossRef]
- Leyva-Townsend, P.; Rodriguez, W.; Idrovo, S.; Pulga, F. Female Board Participation and Firm’s Financial Performance: A Panel Study from a Latin American Economy. Corp. Gov. Int. J. Bus. Soc. 2021, 21, 920–938. [Google Scholar] [CrossRef]
- Luo, K.; Wu, S. Corporate Sustainability and Analysts’ Earnings Forecast Accuracy: Evidence from Environmental, Social and Governance Ratings. Corp. Soc. Responsib. Environ. Manag. 2022, 29, 1465–1481. [Google Scholar] [CrossRef]
- Onali, E.; Ginesti, G.; Vasilakis, C. How Should We Estimate Value-Relevance Models? Insights from European Data. Br. Account. Rev. 2017, 49, 460–473. [Google Scholar] [CrossRef]
- Govindarajan, V.; Ilyas, H.; Silva, F.B.G.; Srivastava, A.; Enache, L. How Companies Can Prepare for a Long Run of High Inflation. Harvard Business Review. 2022. Available online: https://hbr.org/2022/05/how-companies-can-prepare-fora-long-run-of-high-inflation (accessed on 22 September 2022).
- Dantas, M. Are ESG Funds More Transparent? 2021. Available online: https://papers.ssrn.com/sol3/papers.cfm?abstract_id=3269939 (accessed on 25 February 2024).
- Liu, T.; Song, Y.; Xing, X.; Zhu, Y.; Qu, Z. Bridging Production Factors Allocation and Environmental Performance of China’s Heavy-Polluting Energy Firms: The Moderation Effect of Financing and Internationalization. Energy 2021, 222, 119943. [Google Scholar] [CrossRef]
- Zhou, B.; Wu, J.; Guo, S.; Hu, M.; Wang, J. Environmental Regulation and Financial Performance of Chinese Listed Companies. PLoS ONE 2020, 15, e0244083. [Google Scholar] [CrossRef]
- Hu, D.; Peng, Y.; Fang, T.; Chen, C.W. The Effects of Executives’ Overseas Background on Enterprise Digital Transformation: Evidence from China. Chin. Manag. Stud. 2022, 17, 1053–1084. [Google Scholar] [CrossRef]
Disclaimer/Publisher’s Note: The statements, opinions and data contained in all publications are solely those of the individual author(s) and contributor(s) and not of MDPI and/or the editor(s). MDPI and/or the editor(s) disclaim responsibility for any injury to people or property resulting from any ideas, methods, instructions or products referred to in the content. |
© 2024 by the authors. Licensee MDPI, Basel, Switzerland. This article is an open access article distributed under the terms and conditions of the Creative Commons Attribution (CC BY) license (https://creativecommons.org/licenses/by/4.0/).