
Categorization of the Potential Impact of Italian Quarries on Water Resources through a Multi-Criteria Decision Aiding-Based Model


Abstract
1. Introduction
2. Materials and Methods
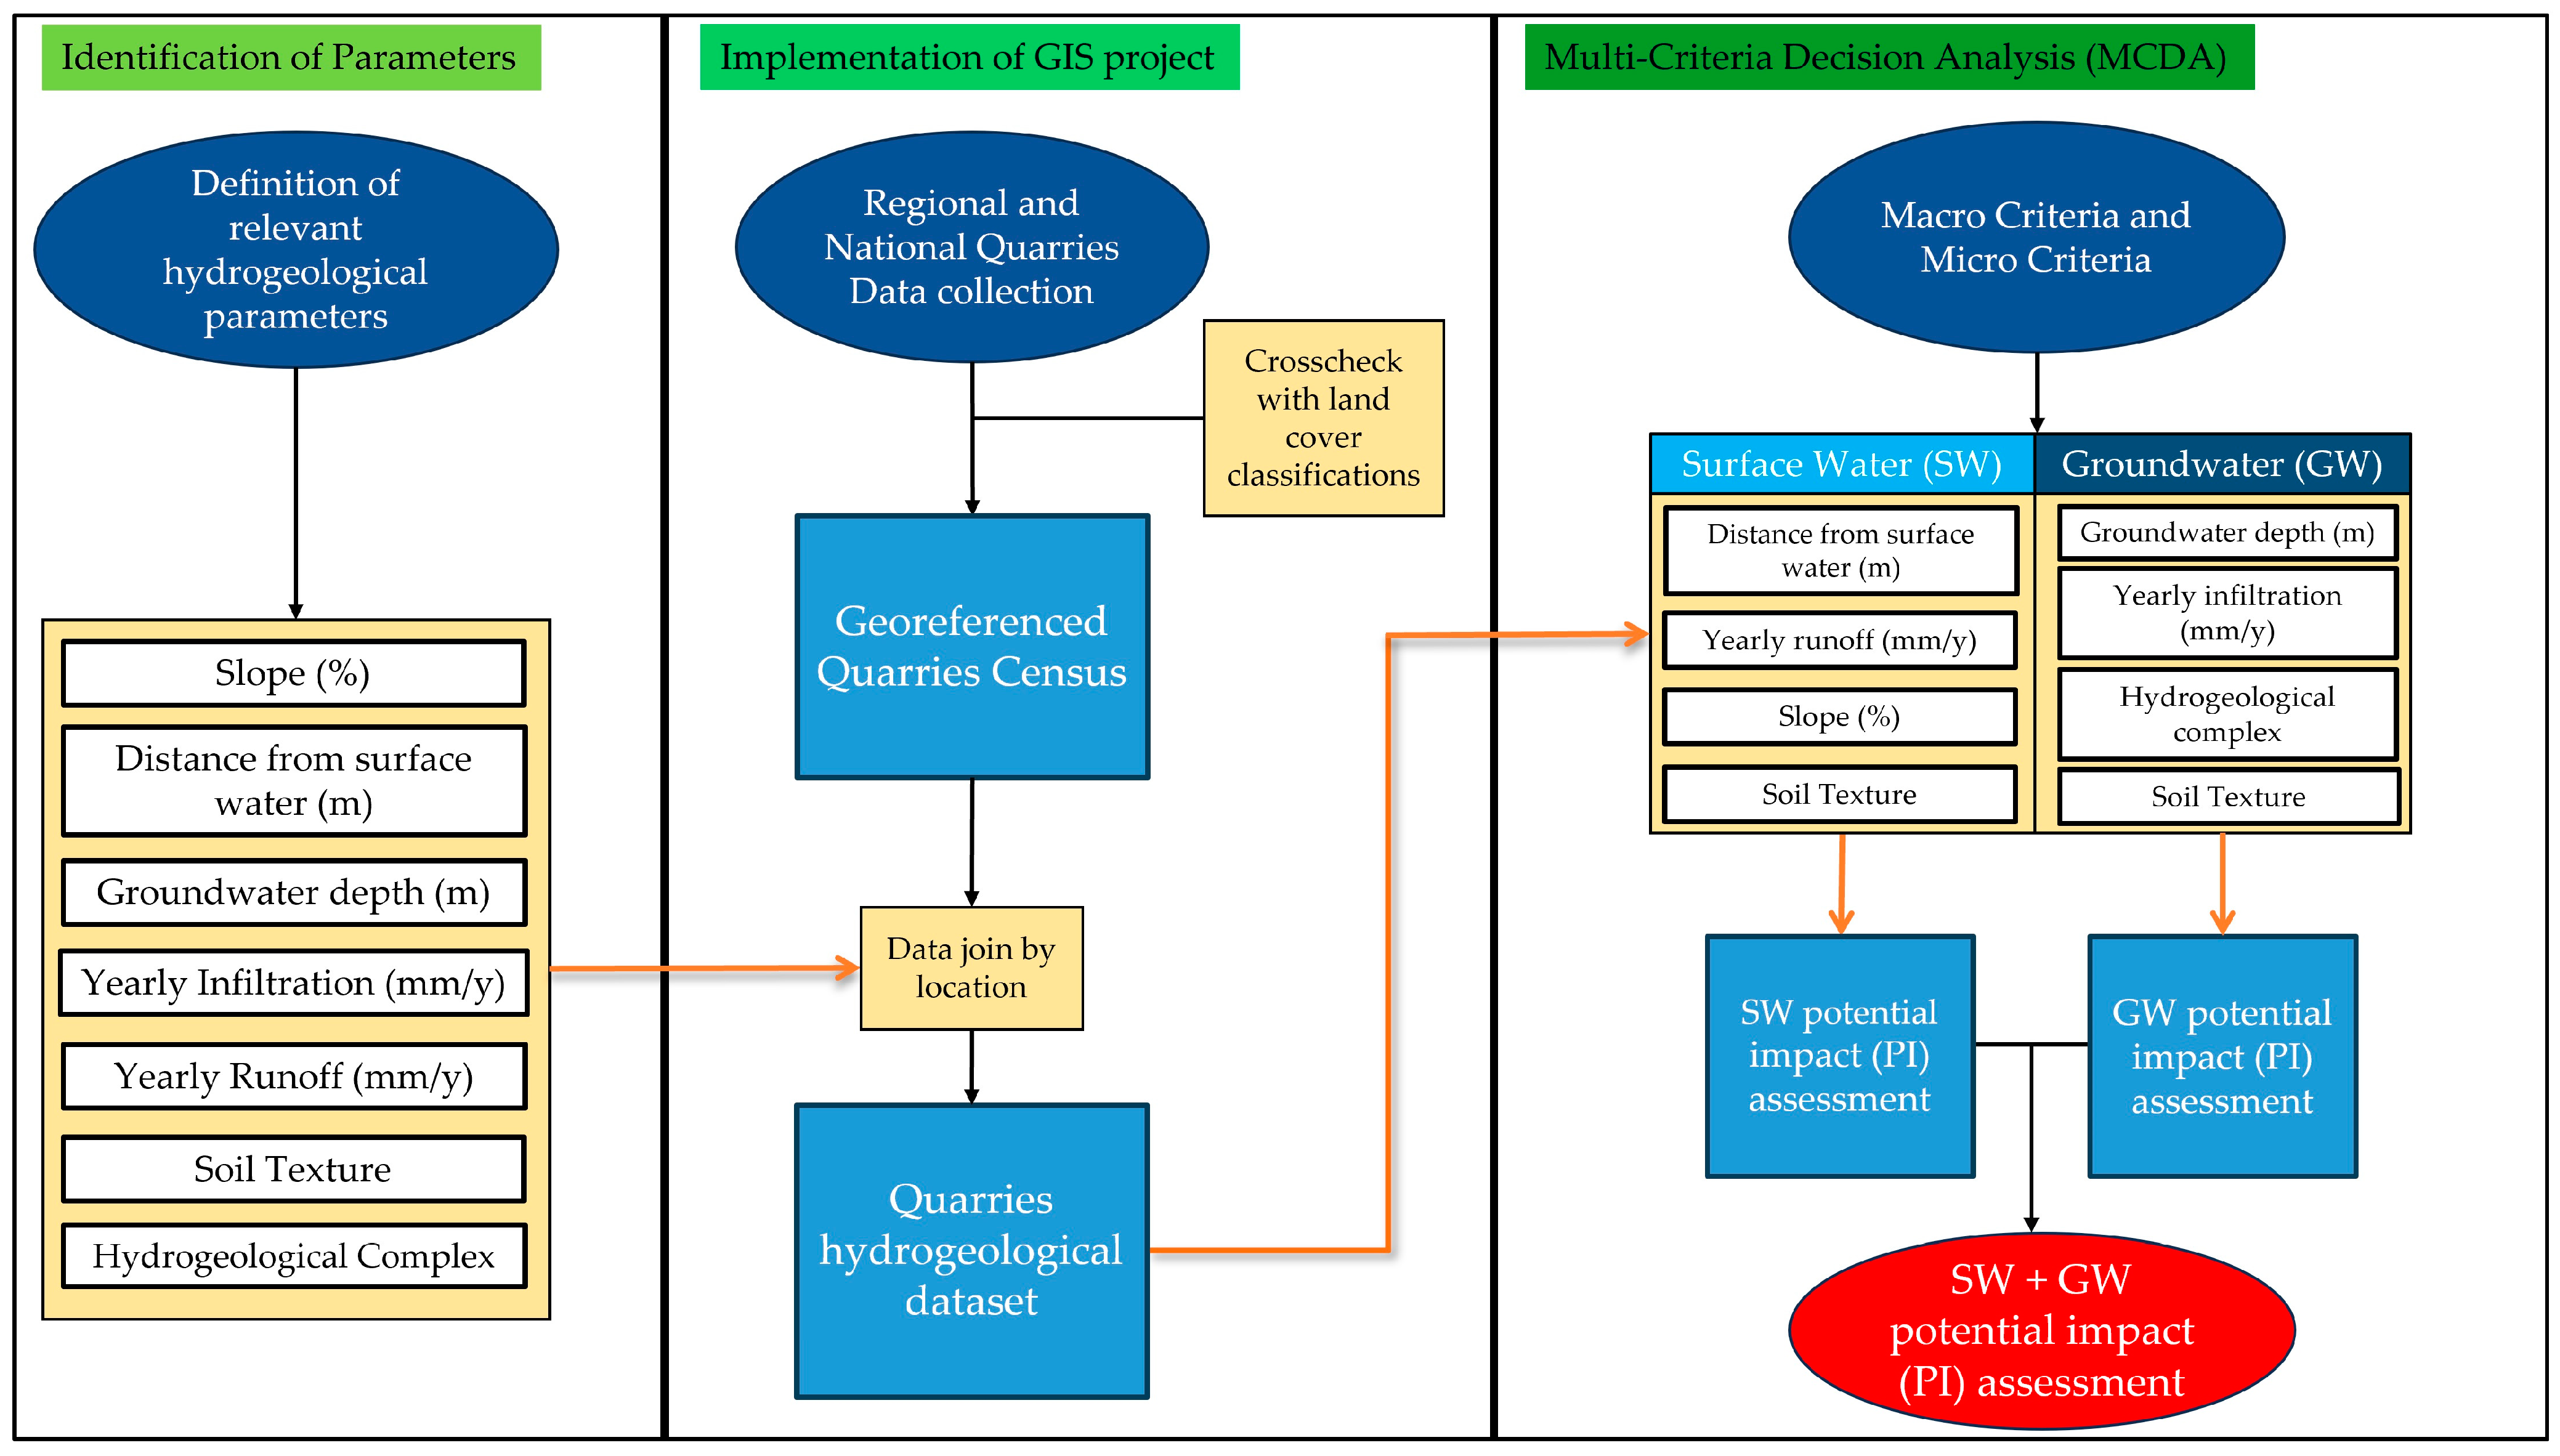
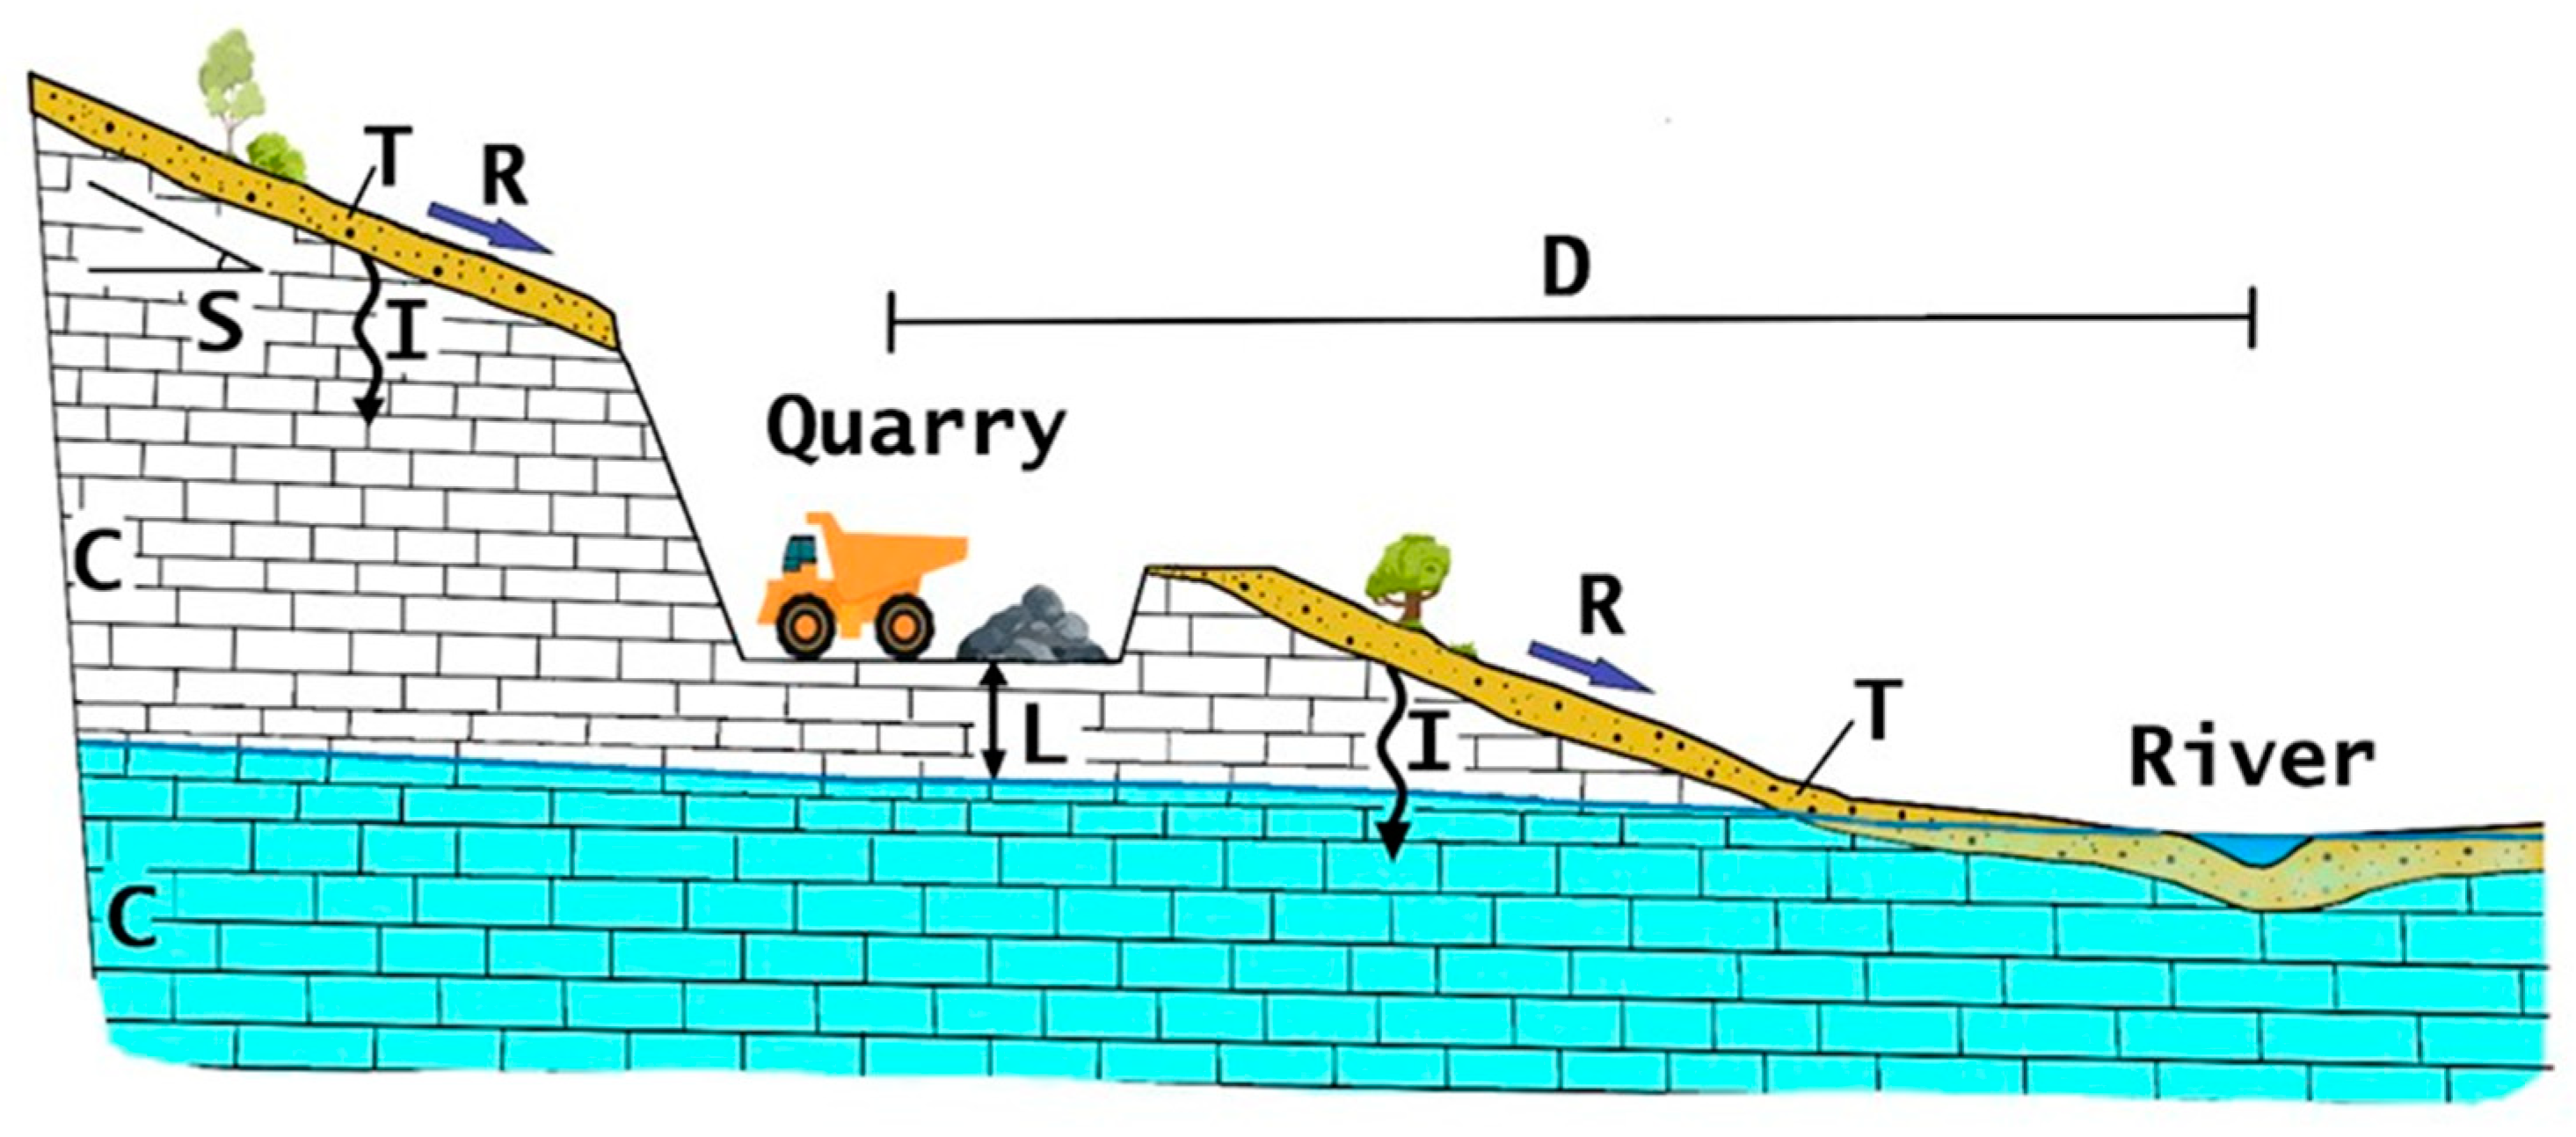
2.1. Conceptual Model of the Impact of Quarries on Water Resources: Identification of Parameters
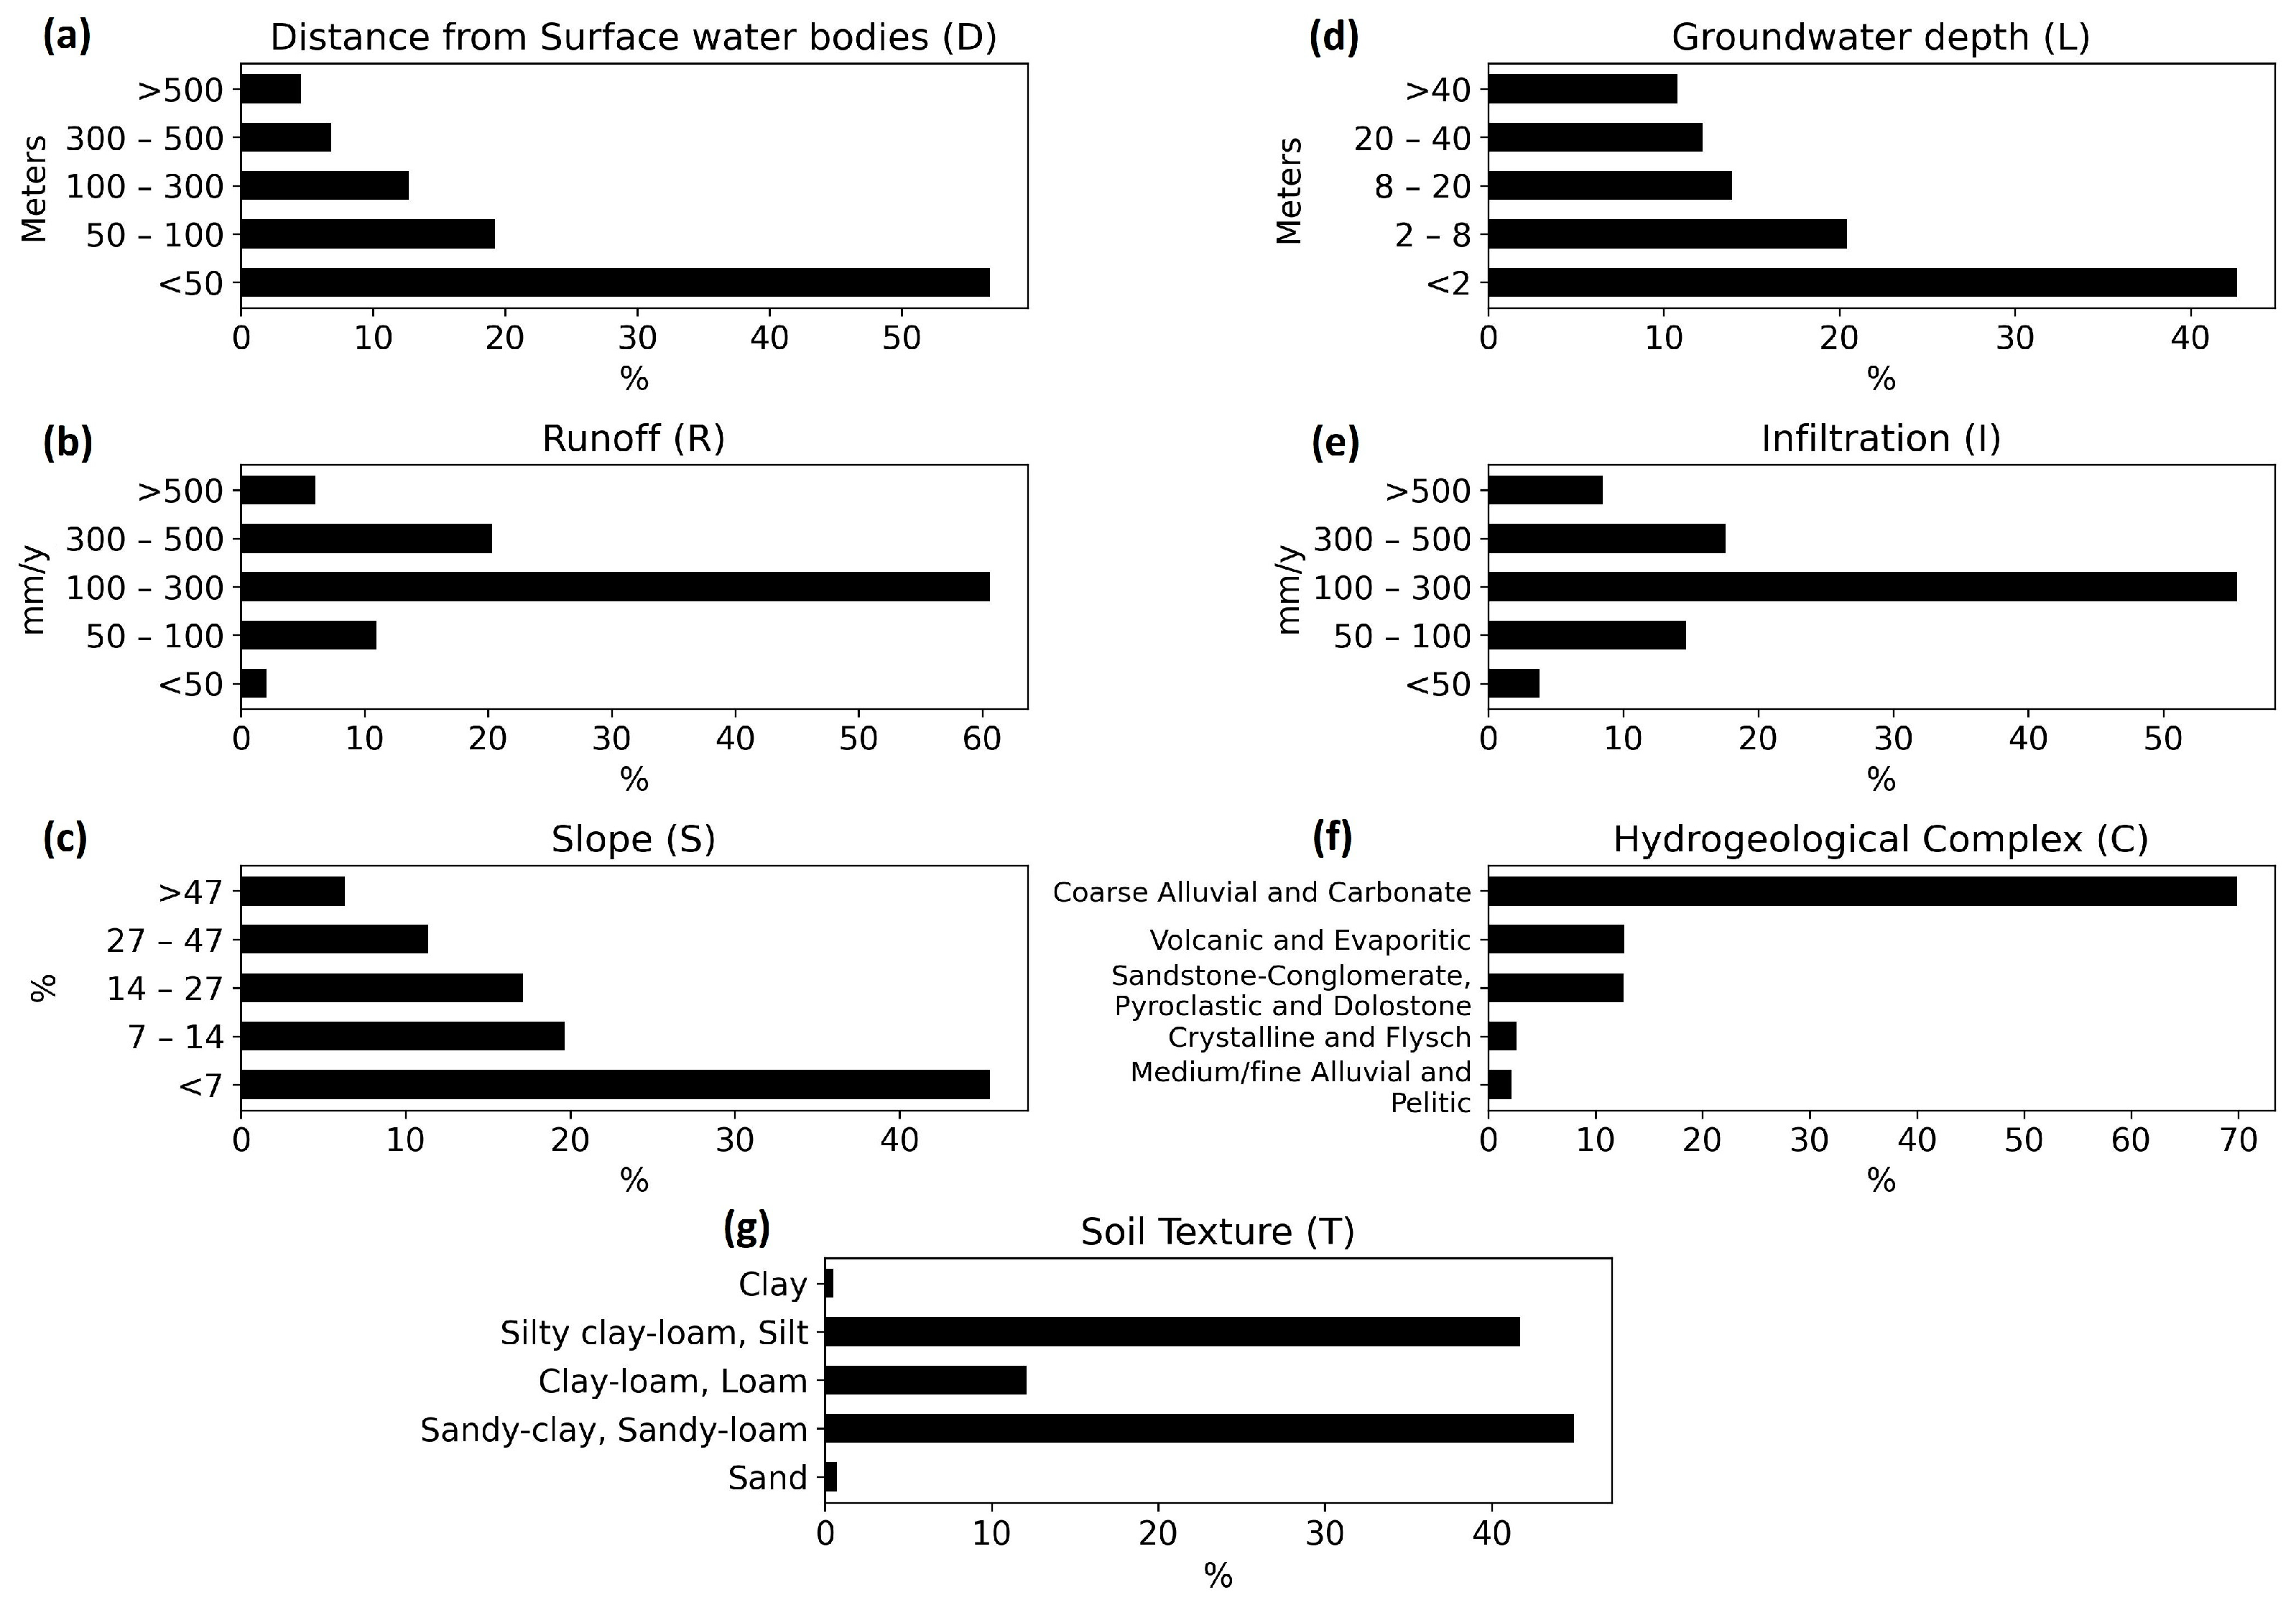
- The distance of the quarry from surface water bodies (D), which influences the dilution of any contaminant load from the quarry area into the surface water body;
- The amount of runoff (R) on which the contaminant load discharging into the surface water body depends;
- The surface slope of the quarry area (S), which affects the velocity of surface runoff and then the time for pollutants to reach the surface water body;
- The soil texture of the quarry area (T), which determines the components of the runoff, specifically the distribution between the overland flow and the interflow that can reach the surface water body.
- The groundwater level depth in the quarry area (L), influencing the hydrodynamic interactions and exposure to groundwater pollution;
- The amount of effective infiltration (I), which determines the contaminant load that can reach the groundwater;
- The hydrogeological complex of the quarry area (C), that is, a geological unit or more geological units united by a homogeneous degree and type of permeability, with a size which is significant for the scale of the groundwater flow [36,37]. The recharge, flow and discharge of groundwater depend precisely on the different hydrogeological complexes identified in Italy [38];
- The soil texture of the quarry area (T), which acts as initial filter in mitigating groundwater pollution from surface sources.
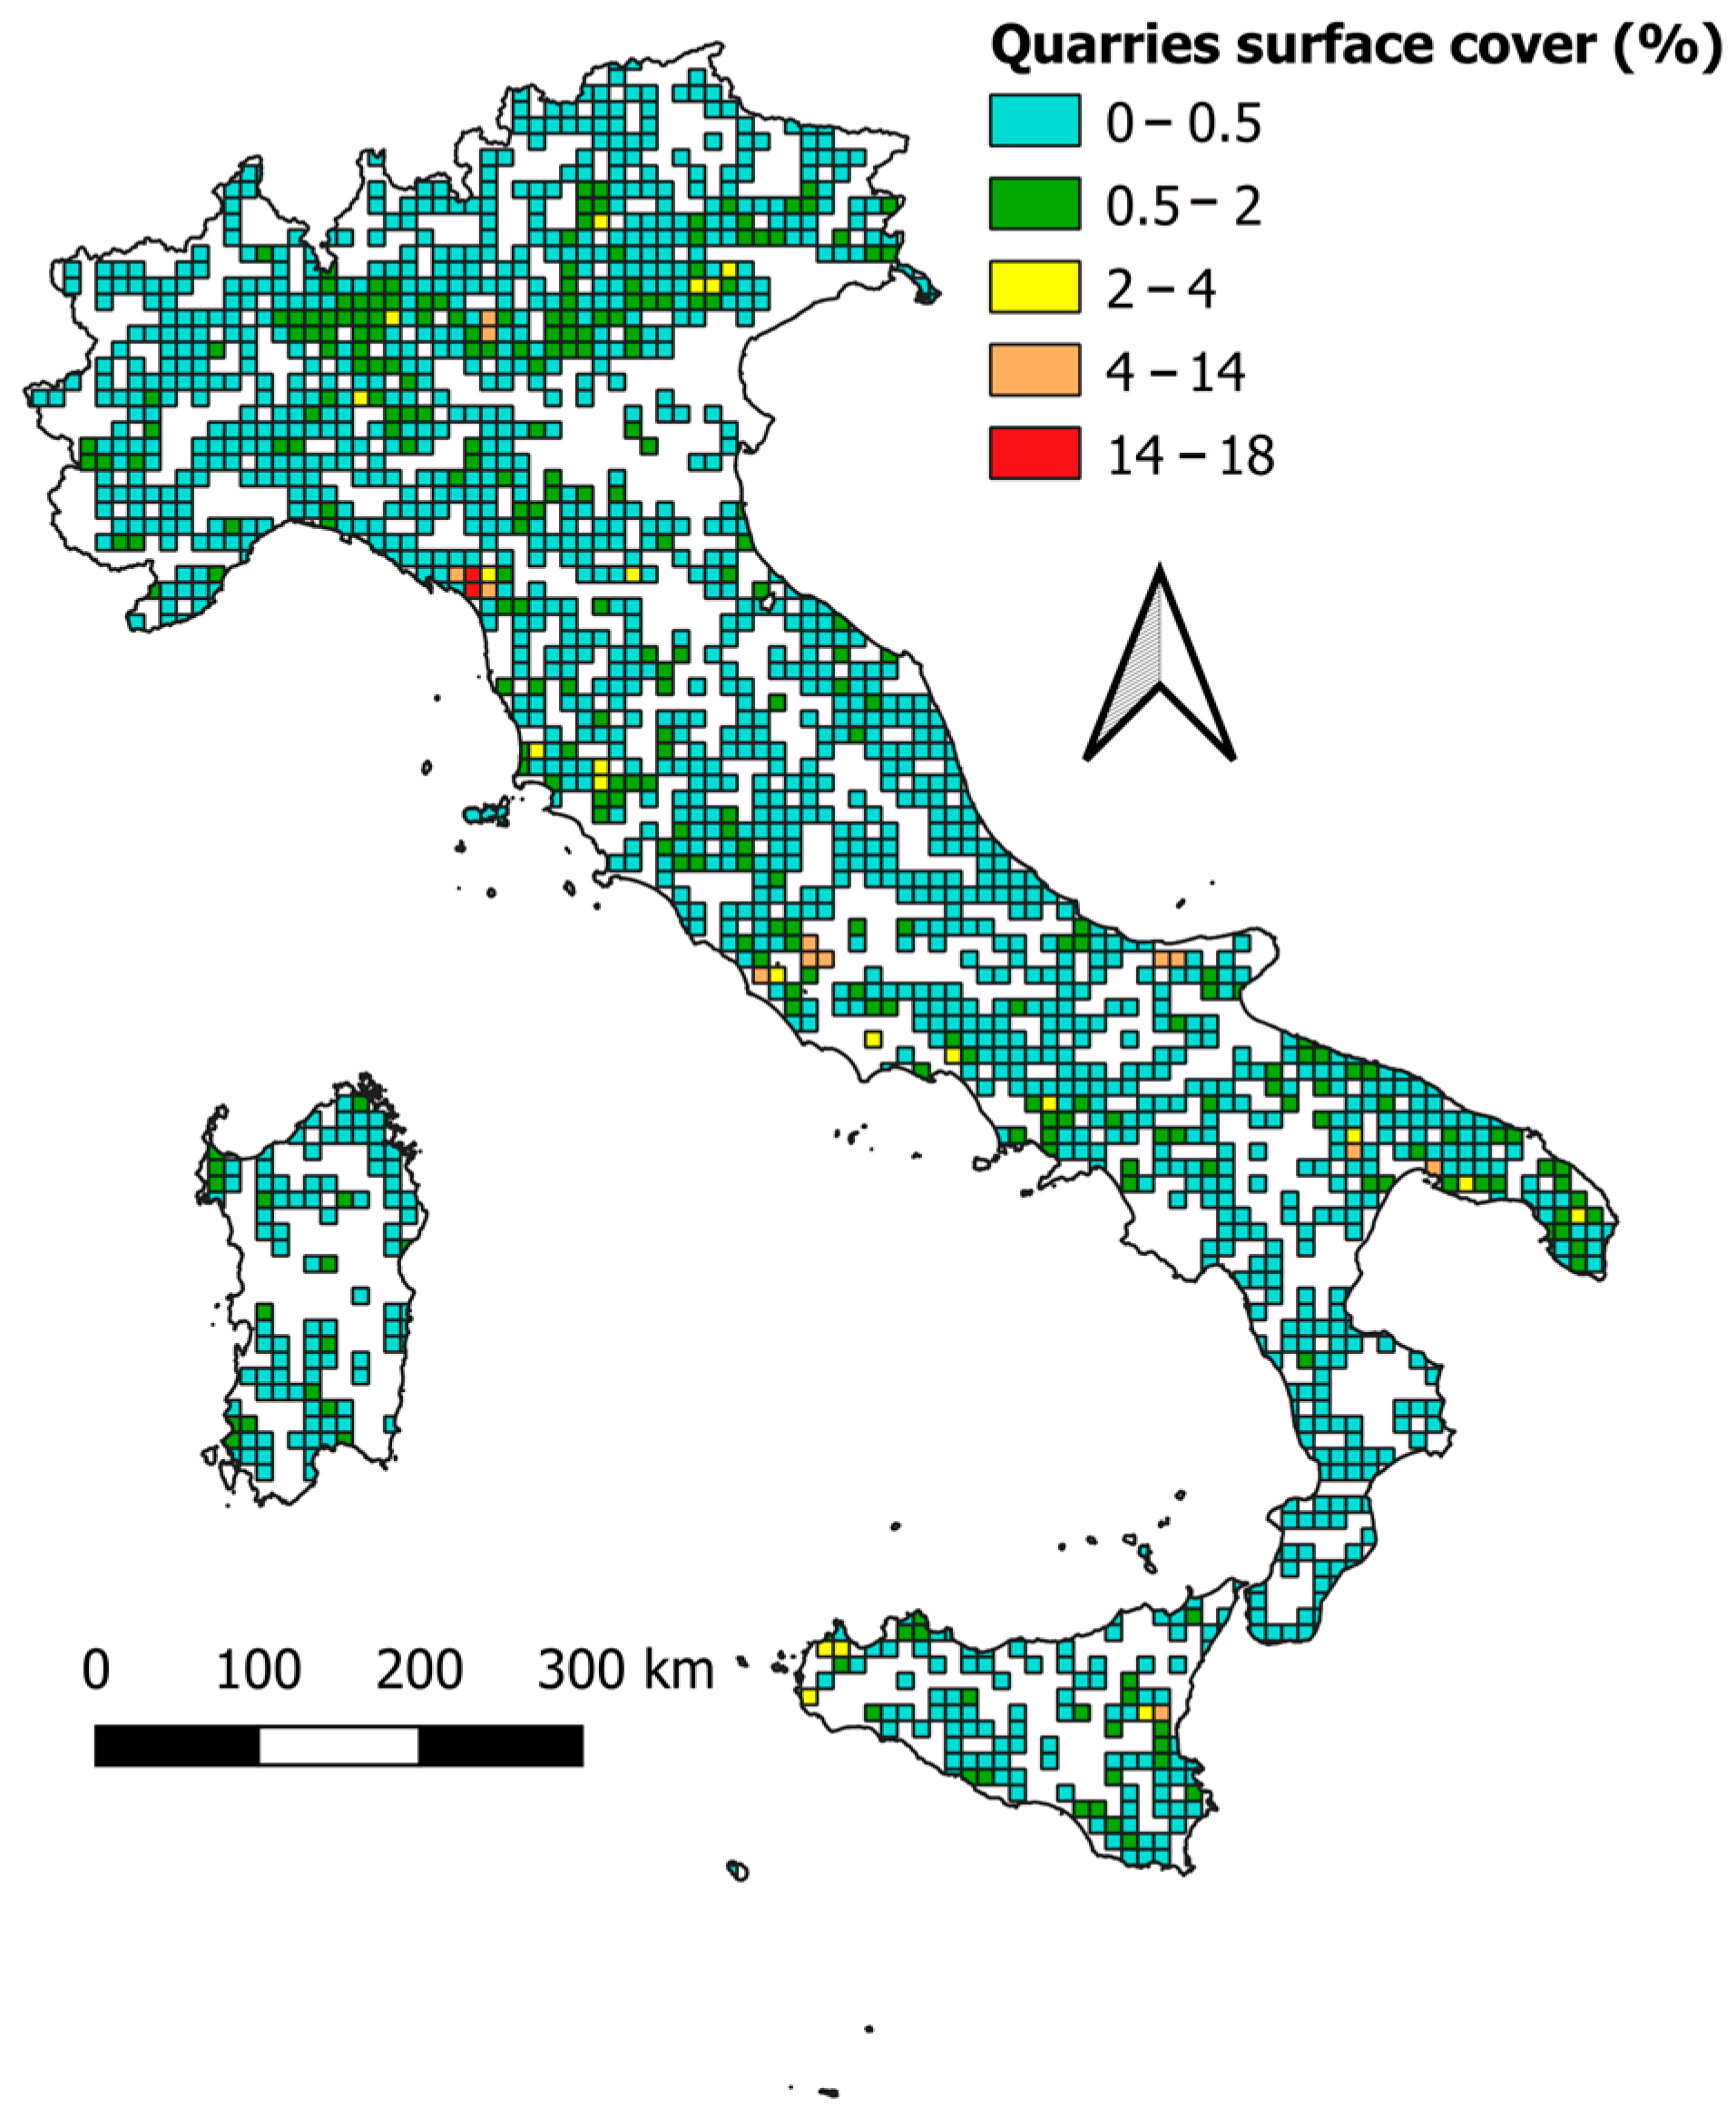
2.2. Database of the Italian Quarries: Implementation of GIS Project
- The ISTAT’s database on quarries and mines [33], which reports information on extraction activities categorized by site and material type;
- Twenty-one Regional Mining Activity Plans (PRAEs); i.e., the regulatory instruments for planning mining activities on a regional scale, where quarrying data are updated according to different Italian regions;
- Other reports prepared by environmental organizations [39].
- Specifically, the surface slope (S) was calculated using a Digital Elevation Model (DEM) with a 25 m resolution [42], through an algorithm derived from the GDAL DEM utility (included in the QGIS package), which generates a slope map from any GDAL-supported elevation raster file. To estimate the distance of quarries from surface water (streams, rivers and lakes) (D), a specific layer was created by merging data from the Italian Ministry of Environment and Energy Security’s database on hydrographic network and lake location [43]. Annual effective infiltration (I) and runoff (R) were derived from the model “BIGBANG 4.0” [38], which calculates the water balance equation for the entire Italian territory using square cells of 1 km2. Soil texture (T) information was obtained from the European Soil Data Centre 2.0 [44], where soil texture is mapped according to the USDA classification with a cell size of 500 m. The hydrogeological complex (C) of quarry areas was derived from the map of hydrogeological complexes carried out by ISPRA [45], which identified 11 hydrogeological complexes based on the lithological map of Italy [46]. The groundwater-level depth in the quarry areas (L) was determined considering the following: (i) the national borehole dataset [47], providing information on wells and boreholes deeper than 30 m; (ii) the Regional Water Protection Plans, containing details on wells and springs; and (iii) a 1 km-resolution raster file of water table depth [48], adopted only when no data on wells and springs close to the quarry were available from the aforementioned databases.
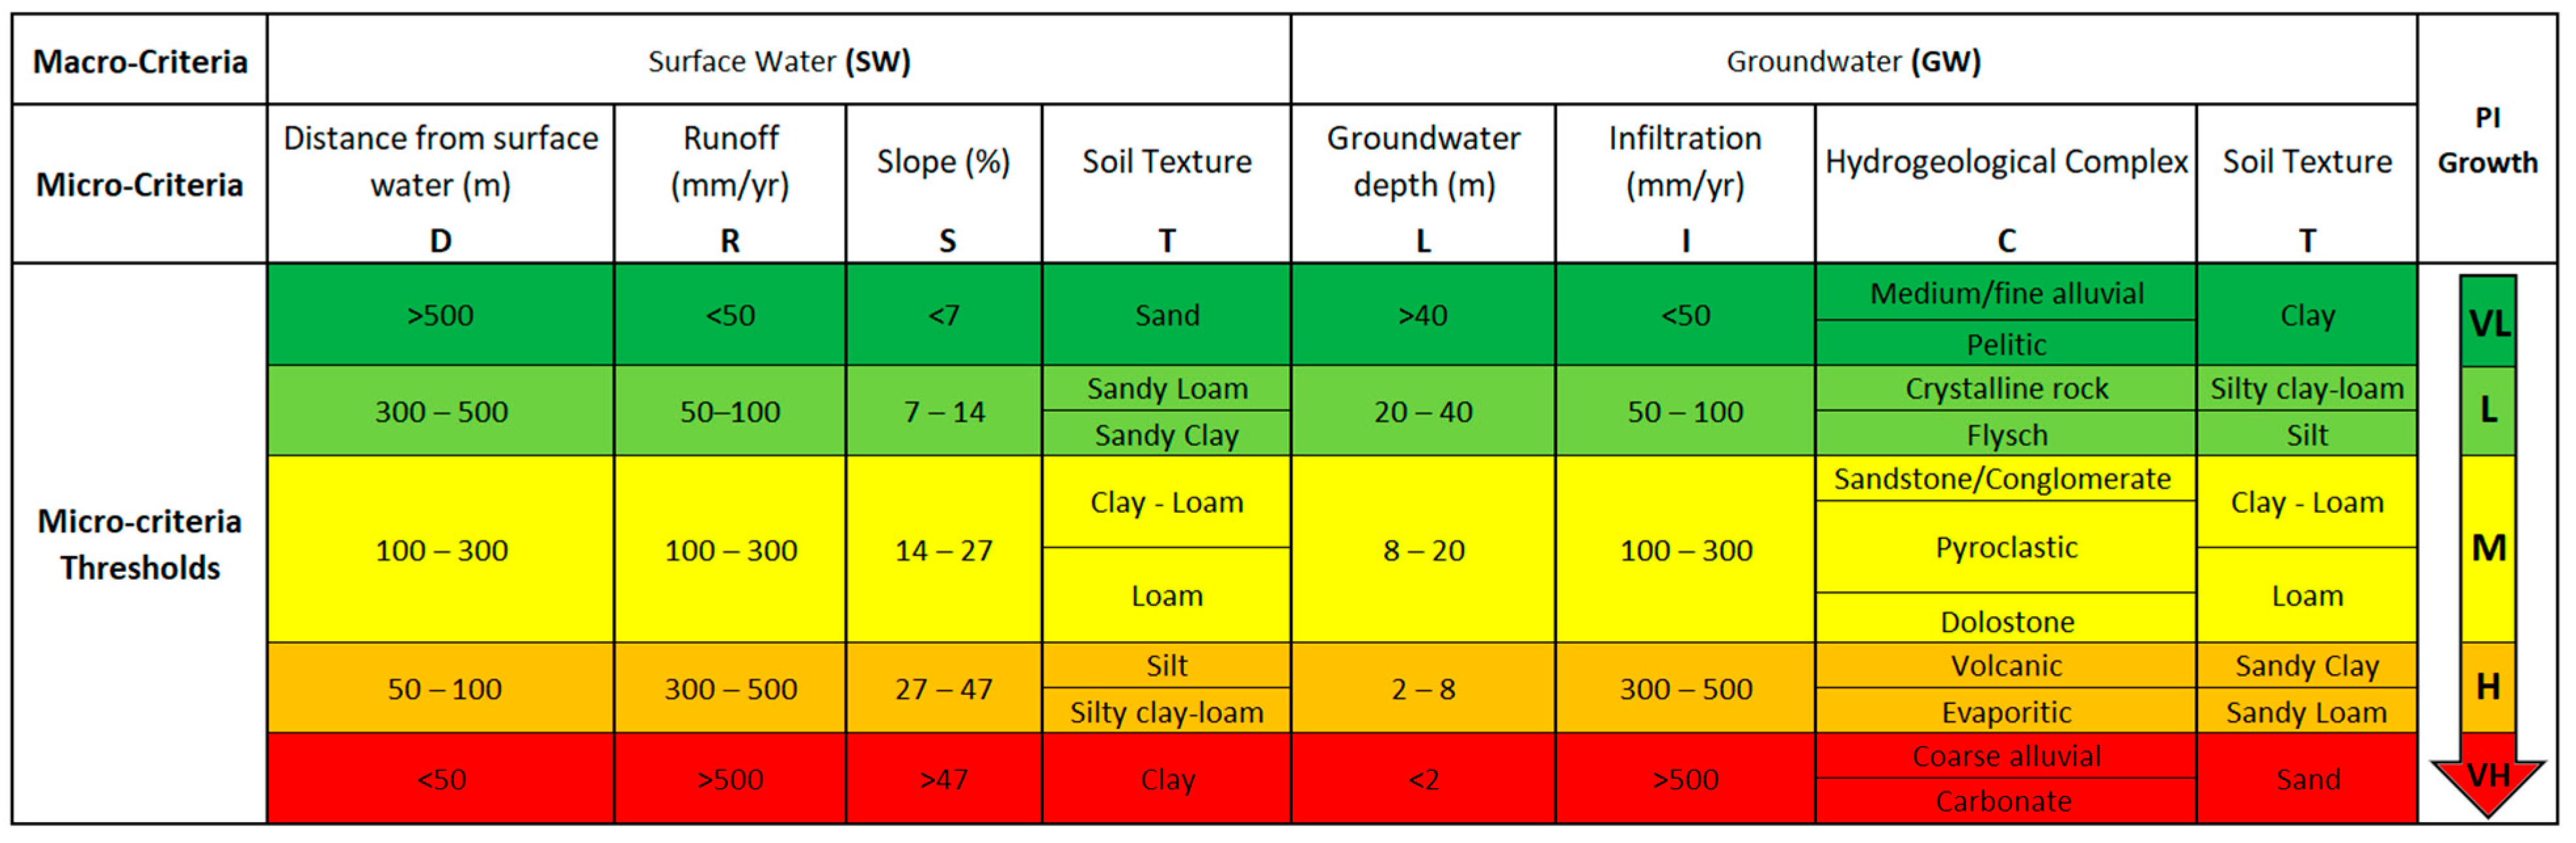
2.3. Multi-Criteria Decision Aiding (MCDA)
- 1.
- The calculation of a concordance index cj(a,b), so if
- gj(b) − gj(a) ≤ qj is cj(a,b) = 1, there is no contradiction with the statement “aSb”;
- qj < gj(b) − gj(a) ≤ pj, is 0 < cj(a,b) < 1, there is weak contradiction with the statement “aSb”;
- gj(b) − gj(a) ≥ pj, is cj(a,b) = 0, there is a total contradiction with the statement “aSb”.
- 2.
- The calculation of a discordance index dj(a,b), such as to indicate the extent to which the relation between the a and b on j-criterion disagrees with the statement “aSb” and its effect on the relation aSb, so if
- gj(b) − gj(a) ≤ pj[gj(a)] is dj(a,b) = 0, there is no contradiction with the statement “aSb”;
- pj[gj(a)] < gj(b)-gj(a) ≤ vj[gj(a)], is 0 < dj(a,b) < 1, there is weak contradiction with the statement “aSb”;
- gj(b) − gj(a) ≥ vj[gj(a)], is dj(a,b) = 1, this prohibits any outranking of a over b, regardless of the evaluations on all the remaining criteria.
- 3.
- The construction of the outranking relation is completed by establishing the degree of credibility σ(a,b), a value between 0 and 1. This value, considering both the concordance and discordance indices, summarizes the strength of the “aSb” relation.
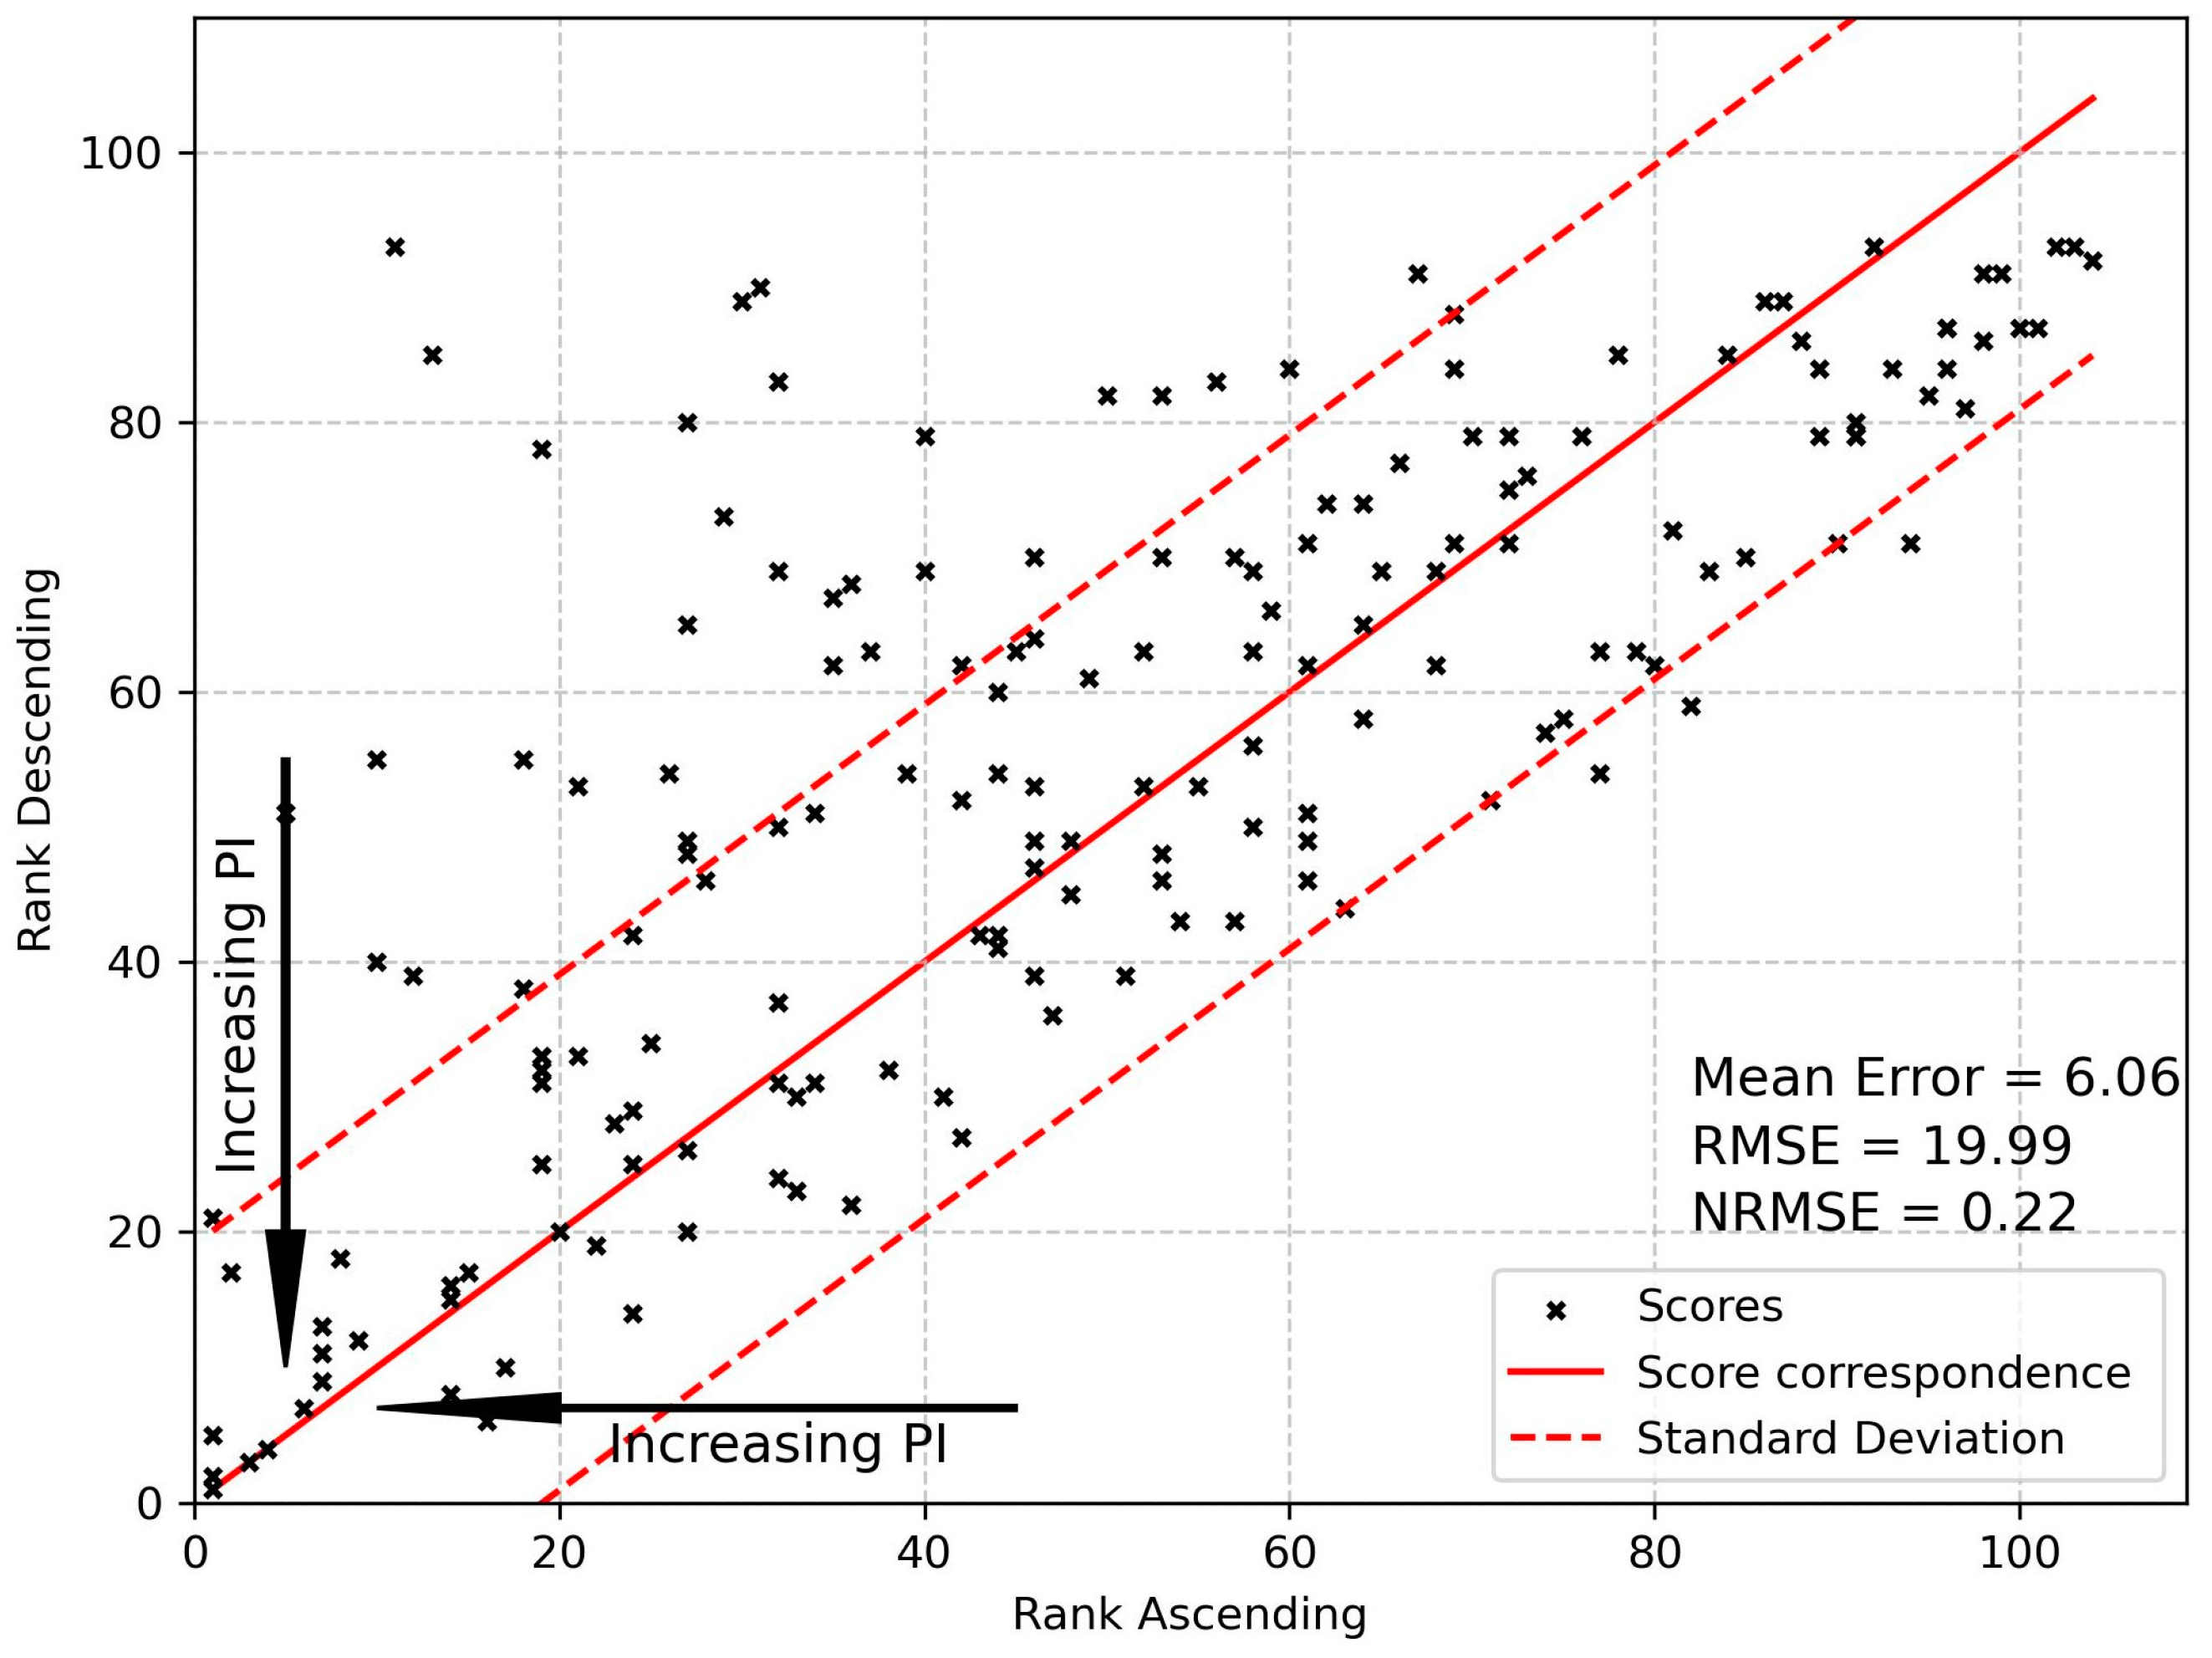
- Better than alternative b, if, in at least one classification (ascending or descending), a is positioned better than b, and in the other a is classified at least as well as b;
- Equivalent to alternative b, if the two belong to the same class in both systems;
- Incomparable with alternative b, if there is a contradiction in the two classifications; for example, a is in a better position than b in the ascending classification, but b is positioned ahead of a according to the descending distillation.
3. Results
4. Discussion
5. Conclusions
Author Contributions
Funding
Institutional Review Board Statement
Informed Consent Statement
Data Availability Statement
Acknowledgments
Conflicts of Interest
References
- Mohsin, M.; Zhu, Q.; Naseem, S.; Sarfraz, M.; Ivascu, L. Mining Industry Impact on Environmental Sustainability, Economic Growth, Social Interaction, and Public Health: An Application of Semi-quantitative Mathematical Approach. Processes 2021, 9, 972. [Google Scholar] [CrossRef]
- Bridge, G. Contested Terrain: Mining and the Environment. Annu. Rev. Environ. Resour. 2004, 29, 205–259. [Google Scholar] [CrossRef]
- Mancini, L.; Sala, S. Social Impact Assessment in the Mining Sector: Review and Comparison of Indicators Frameworks. Resour. Policy 2018, 57, 98–111. [Google Scholar] [CrossRef]
- European Parliament. Social and Environmental Impacts of Mining Activities in the EU; Mononen, T., Kivinen, S., Kotilainen, J., Leino, J., Eds.; Technical Report; European Union: Brussels, Belgium, 2022. [Google Scholar]
- CSIR-Environmentek, Pretoria and Geology Department, University of Zimbabwe-Harare. An Overview of the Impact of Mining and Mineral Processing Operations on Water Resources and Water Quality in the Zambezi, Limpopo and Olifants Catchments in Southern Africa; Ashton, P.J., Love, D., Mahachi, H., Dirks, P., Eds.; Technical Report; International Institute for Environment and Development (IIED): Johannesburg, South Africa, 2001. [Google Scholar]
- Mayes, W.M.; Large, A.R.G.; Younger, P.L. The Impact of Pumped Water from a De-watered Magnesian Limestone Quarry on an Adjacent Wetland: Thrislington, County Durham, UK. Environ. Pollut. 2005, 138, 443–454. [Google Scholar] [CrossRef] [PubMed]
- Varouchakis, E.A.; Perez, G.A.C.; Diaz-Loaiza, A.; Spanoudaki, K. Sustainability of mining activities in the European Mediterranean region in terms of a spatial groundwater stress index. Spat. Stat. 2022, 50, 100625. [Google Scholar] [CrossRef]
- Hobbs, S.L.; Gunn, J. The Hydrogeological Effect of Quarrying Karstified Limestone: Options for Prediction and Mitigation. Q. J. Eng. Geol. Hydrogeol. 1998, 31, 147–157. [Google Scholar] [CrossRef]
- Delle Rose, M.; Parise, M.; Andriani, G.F. Evaluating the Impact of Quarrying on Karst Aquifers of Salento (southern Italy). Geol. Soc. Spec. Publ. 2007, 279, 153–171. [Google Scholar] [CrossRef]
- Chambers, J.E.; Meldrum, P.I.; Wilkinson, P.B.; Ward, W.; Jackson, C.; Matthews, B.; Joel, P.; Kuras, O.; Bai, L.; Uhlemann, S. Spatial Monitoring of Groundwater Drawdown and Rebound Associated with Quarry Dewatering Using Automated Time-lapse Electrical Resistivity Tomography and Distribution Guided Clustering. J. Eng. Geol. 2015, 193, 412–420. [Google Scholar] [CrossRef]
- Bell, F.G.; Donnelly, L.J. Mining and Its Impact on the Environment, 1st ed.; Taylor & Francis: London, UK, 2006; p. 560. [Google Scholar] [CrossRef]
- Gunn, J.; Bailey, D. Limestone Quarrying and Quarry Reclamation in Britain. Environ. Geol. 1993, 21, 167–172. [Google Scholar] [CrossRef]
- Morton, K.L.; van Mekerk, F.A. A Phased Approach to Mine Dewatering. Mine Water Environ. 1993, 12, 27–33. [Google Scholar] [CrossRef]
- Dubois, C.; Goderniaux, P.; Deceuster, J.; Poulain, A.; Kaufmann, O. Hydrogeological Characterization and Modelling of Weathered Karst Aquifers. Applicability to Dewatering Operations in Limestone Quarries. Environ. Earth Sci. 2019, 78, 99. [Google Scholar] [CrossRef]
- Piscopo, V.; Sbarbati, C.; Lotti, F.; Lana, L.; Petitta, M. Sustainability Indicators of Groundwater Withdrawal in a Heavily Stressed System: The Case of the Acque Albule Basin (Rome, Italy). Sustainability 2022, 14, 15248. [Google Scholar] [CrossRef]
- Gray, N. Environmental impact and remediation of acid mine drainage: A management problem. Environ. Geol. 1997, 30, 62–71. [Google Scholar] [CrossRef]
- Benvenuti, M.; Mascaro, I.; Corsini, F.; Lattanzi, P.; Parrini, P.; Tanelli, G. Mine Waste Dumps and Heavy Metal Pollution in Abandoned Mining District of Boccheggiano (Southern Tuscany, Italy). Environ. Geol. 1997, 30, 238–243. [Google Scholar] [CrossRef]
- Eang, K.E.; Igarashi, T.; Kondo, M.; Nakatani, T.; Tabelin, C.B.; Fujinaga, R. Groundwater Monitoring of an Open-pit Limestone Quarry: Water-rock Interaction and Mixing Estimation within the Rock Layers by Geochemical and Statistical Analyses. Int. J. Min. Sci. Technol. 2018, 28, 849–857. [Google Scholar] [CrossRef]
- Barago, N.; Pavoni, E.; Floreani, F.; Crosera, M.; Adami, G.; Lenaz, D.; Covelli, S. Hydrogeochemistry of thallium and other potentially toxic elements in neutral mine drainage at the decommissioned Pb Zn Raibl mine (Eastern Alps, Italy). J. Geochem. Explor. 2022, 245, 107129. [Google Scholar] [CrossRef]
- Akcil, A.; Koldas, S. Acid Mine Drainage (AMD): Causes, Treatment and Case Studies. J. Clean. Prod. 2006, 14, 1139–1145. [Google Scholar] [CrossRef]
- Cidu, R.; Dadea, C.; Desogus, P.; Fanfani, L.; Manca, P.P.; Orrù, G. Assessment of Environmental Hazards at Abandoned Mining Sites: A Case Study in Sardinia, Italy. Appl. Geochem. 2012, 27, 1795–1806. [Google Scholar] [CrossRef]
- Simate, G.S.; Ndlovu, S. Acid Mine Drainage: Challenges and Opportunities. J. Environ. Chem. Eng. 2014, 2, 1785–1803. [Google Scholar] [CrossRef]
- Liao, J.; Wen, Z.; Ru, X.; Chen, J.; Wu, H.; Wei, C. Distribution and migration of heavy metals in soil and crops affected by acid mine drainage: Public health implications in Guangdong Province, China. Ecotoxicol. Environ. Saf. 2016, 124, 460–469. [Google Scholar] [CrossRef]
- Doveri, M.; Natali, S.; Franceschi, L.; Menichini, M.; Trifirò, S.; Giannecchini, R. Carbonate Aquifers Threatened by Legacy Mining: Hydrodynamics, Hydrochemistry, and Water Isotopes Integrated Approach for Spring Water Management. J. Hydrol. 2021, 593, 125850. [Google Scholar] [CrossRef]
- Andersen, L.J.; Gosk, E. Applicability of vulnerability maps. Environ. Geol. Water Sci. 1989, 13, 39–43. [Google Scholar] [CrossRef]
- Wardrop, D.; Leake, C.; Abra, J. Practical Techniques That Minimize the Impact of Quarries on the Water Environment. Appl. Earth Sci. 2001, 110, 5–14. [Google Scholar] [CrossRef]
- Rahnema, M.; Amirmoeini, B.; Moradi Afrapoli, A. Incorporating Environmental Impacts into Short-Term Mine Planning: A Literature Survey. Mining 2023, 3, 163–175. [Google Scholar] [CrossRef]
- Aller, L.; Bennett, T.; Lehr, J.; Petty, R. Drastic: A Standardized System to Evaluate Groundwater Pollution Potential using Hydrogeologic Setting. J. Geol. Soc. India 1987, 29, 23–37. [Google Scholar]
- Civita, M.; De Maio, M. Valutazione e Cartografia Automatica Della Vulnerabilità Degli Acquiferi All’ Inquinamento con il Sistema Parametrico: SINTACS R5, a New Parametric System for the Assessment and Automaticmap Ping of Groundwater Vulnerability to Contamination; Pitagora Editrice: Bologna, Italy, 2000; p. 240. [Google Scholar]
- Fannakh, A.; Farsang, A. DRASTIC, GOD, and SI Approaches for Assessing Groundwater Vulnerability to Pollution: A Review. Environ. Sci. Eur. 2022, 34, 77. [Google Scholar] [CrossRef]
- Collier, L.; Barthélemy, J.; Carletti, T.; Moriamé, M.; Sartenaer, A.; Hallet, V. Calculation of an Interaction Index Between the Extractive Activity and Groundwater Resources. Energy Procedia 2015, 76, 412–420. [Google Scholar] [CrossRef][Green Version]
- Barthélemy, J.; Carletti, T.; Collier, L.; Hallet, V.; Moriamé, M.; Sartenaer, A. Interaction prediction between groundwater and quarry extension using discrete choice models and artificial neural networks. Environ. Earth Sci. 2016, 75, 1467. [Google Scholar] [CrossRef]
- Istituto Nazionale di Statistica (ISTAT). Attività Estrattive da cave e Miniere|ANNO 2018. Available online: https://www.istat.it/it/archivio/246015 (accessed on 16 February 2024).
- Ministero delle Imprese e del Made in Italy (MIMIT). Regio Decreto 29 luglio 1927, n. 1443 “Norme di Carattere Legislativo per Disciplinare la Ricerca e la Coltivazione delle Miniere nel Regno”. Available online: https://www.mimit.gov.it/images/stories/energia/1443rd27.pdf (accessed on 16 February 2024).
- Barbulescu, A. Assessing Groundwater Vulnerability: DRASTIC and DRASTIC-Like Methods: A Review. Water 2020, 12, 1356. [Google Scholar] [CrossRef]
- Celico, P. Prospezioni Idrogeologiche, 1st ed.; Liguori Editore: Napoli, Italy, 1986; Volume 1, p. 536. [Google Scholar]
- Civita, M. Idrogeologia Applicata e Ambientale; CEA Casa Editrice Ambrosiana: Torino, Italy, 2005; p. 800. [Google Scholar]
- Istituto Superiore per la Protezione e la Ricerca Ambientale (ISPRA). Il Bilancio Idrologico Gis Based a scala Nazionale su Griglia Regolare—BIGBANG: Metodologia e Stime. Rapporto Sulla Disponibilità Naturale Della Risorsa Idrica, Rapporti 339/21; Braca, G., Bussettini, M., Lastoria, B., Mariani, S., Piva, F., Eds.; Technical Report; Istituto Superiore per la Protezione e la Ricerca Ambientale (ISPRA): Rome, Italy, 2021.
- Legambiente. Rapporto Cave 2021; Zanchini, E., Nanni, G., Eds.; Technical Report; RC Legambiente: Rome, Italy, 2021. [Google Scholar]
- Copernicus Land Monitoring Service 2018. European Environmental Agency (EEA). CORINE Land Cover 2018. Available online: https://land.copernicus.eu/en/products/corine-land-cover (accessed on 16 February 2024).
- Istituto Superiore per la Protezione e la Ricerca Ambientale (ISPRA). Carta Uso del Suolo 2022. Available online: https://groupware.sinanet.isprambiente.it/uso-copertura-e-consumo-di-suolo/library/copertura-del-suolo/carta-di-copertura-del-suolo/uso-del-suolo-2022 (accessed on 16 February 2024).
- European Environmental Agency. EU-DEM v1.1, Raster. Available online: https://sdi.eea.europa.eu/catalogue/geoss/api/records/3473589f-0854-4601-919e-2e7dd172ff50 (accessed on 16 February 2024).
- Ministero Dell’ambiente e della Sicurezza Energetica (MASE). Geoportale Nazionale. Reticolo Idrografico. Available online: http://wms.pcn.minambiente.it/ogc?map=/ms_ogc/wfs/Aste_fluviali.map (accessed on 16 February 2024).
- Panagos, P.; Van Liedekerke, M.; Borrelli, P.; Köninger, J.; Ballabio, C.; Orgiazzi, A.; Lugato, E.; Liakos, L.; Hervas, J.; Jones, A. European Soil Data Centre 2.0: Soil Data and Knowledge in Support of the EU Policies. Eur. J. Soil Sci. 2022, 73, e13315. [Google Scholar] [CrossRef]
- Gafà, R.M.; Martarelli, L.; Monti, G.; Silvi, A.; La Vigna, F. Preliminary Elaboration of a Permeability Map of Italy Starting from the Information of the Lithological Map of Italy. Acque Sotter. Ital. J. Groundw. 2019, 8, 75–77. [Google Scholar] [CrossRef]
- Bucci, F.; Santangelo, M.; Fongo, L.; Alvioli, M.; Cardinali, M.; Melelli, L.; Marchesini, I. A New Digital Lithological Map of Italy at the 1:100000 Scale for Geomechanical Modelling. Earth Syst. Sci. Data 2022, 14, 4129–4151. [Google Scholar] [CrossRef]
- Istituto Superiore per la Protezione e la Ricerca Ambientale (ISPRA). Dati Geognostici e Geofisici—Archivio Indagini nel Sottosuolo (Legge 464/84). Available online: http://portalesgi.isprambiente.it/it/categorie-db/sondaggi (accessed on 16 February 2024).
- Fan, Y.; Li, H.; Miguez-Macho, G. Global Patterns of Groundwater Table Depth. Science 2013, 339, 940–943. [Google Scholar] [CrossRef]
- Turner, B.L.; Kasperson, R.E.; Matson, P.A.; McCarthy, J.J.; Corell, R.W.; Christensen, L.; Eckley, N.; Kasperson, J.X.; Luers, A.; Martello, M.L.; et al. A framework for vulnerability analysis in sustainability science. Proc. Natl. Acad. Sci. USA 2003, 100, 8074–8079. [Google Scholar] [CrossRef]
- Yazdi, M. Risk assessment based on novel intuitionistic fuzzy hybrid-modifed TOPSIS approach. Saf. Sci. 2018, 110, 438–448. [Google Scholar] [CrossRef]
- Koulinas, G.K.; Demesouka, O.E.; Marhavilas, P.K.; Vavatsikos, A.P.; Koulouriotis, D.E. Risk Assessment Using Fuzzy TOPSIS and PRAT for Sustainable Engineering Projects. Sustainability 2019, 11, 615. [Google Scholar] [CrossRef]
- Foroozesh, F.; Monavari, S.M.; Salmanmahiny, A.; Robati, M.; Rahimi, R. Assessment of sustainable urban development based on a hybrid decision-making approach: Group fuzzy BWM, AHP, and TOPSIS–GIS. Sustain. Cities Soc. 2022, 76, 103402. [Google Scholar] [CrossRef]
- Shen, S.L.; Lin, S.S.; Zhou, A. A cloud model-based approach for risk analysis of excavation system. Reliab. Eng. Syst. Saf. 2023, 231, 108984. [Google Scholar] [CrossRef]
- Xiang, H.T.; Lyu, H.M. Assessment of vulnerability to waterlogging in subway stations using integrated EWM-TOPSIS. Smart Constr. Sustain. Cities 2023, 1, 17. [Google Scholar] [CrossRef]
- Saaty, R.W. The Analytic Hierarchy Process—What It Is and How It Is Used. Math. Model. 1987, 9, 161–176. [Google Scholar] [CrossRef]
- Roy, B. Decision-aid and decision-making. Eur. J. Oper. Res. 1990, 45, 324–331. [Google Scholar] [CrossRef]
- Scarelli, A.; Narula, S.C. A multicriteria assignment problem. J. Multi-Crit. Decis. Anal. 2002, 11, 65–74. [Google Scholar] [CrossRef]
- Tsoukiàs, A. On the Concept of Decision Aiding Process: An Operational Perspective. Ann. Oper. Res. 2007, 154, 3–27. [Google Scholar] [CrossRef]
- Saaty, T.L. Decision making with the analytic hierarchy. Int. J. Serv. Sci. 2008, 1, 83–98. [Google Scholar] [CrossRef]
- Cinelli, M.; Gonzalez, M.A.; Ford, R.; McKernan, J.; Corrente, S.; Kadziński, M.; Słowiński, R. Supporting Contaminated Sites Management with Multiple Criteria Decision Analysis: Demonstration of a Regulation-consistent Approach. J. Clean. Prod. 2021, 316, 128347. [Google Scholar] [CrossRef]
- Figueira, J.R.; Greco, S.; Roy, B.; Słowiński, R. An Overview of ELECTRE Methods and their Recent Extensions. J. Multi-Crit. Decis. Anal. 2013, 20, 61–85. [Google Scholar] [CrossRef]
- Figueira, J.R.; Mousseau, V.; Roy, B. ELECTRE Methods. In Multiple Criteria Decision Analysis, International Series in Operations Research & Management Science, 2nd ed.; Greco, S., Ehrgott, M., Figueira, J., Eds.; Springer: New York, NY, USA, 2016; Volume 233, pp. 155–185. [Google Scholar] [CrossRef]
- Govindan, K.; Jepsen, M.B. ELECTRE: A comprehensive literature review on methodologies and applications. Eur. J. Oper. Res. 2019, 250, 1–29. [Google Scholar] [CrossRef]
- Figueira, J.R.; Greco, S.; Roy, B.; Słowiński, R. ELECTRE Methods: Main Features and Recent Developments. In Handbook of Multicriteria Analysis. Applied Optimization; Zopounidis, C., Pardalos, P., Eds.; Springer: Berlin, Germany, 2010; Volume 103, pp. 51–89. [Google Scholar] [CrossRef]
- Fernández, E.; Figueira, J.R.; Navarro, J.; Roy, B. ELECTRE TRI-nB: A new multiple criteria ordinal classification method. Eur. J. Oper. Res. 2017, 263, 214–224. [Google Scholar] [CrossRef]
- Bouyssou, D.; Marchant, T.; Pirlot, M. A theoretical look at ELECTRE TRI-nB and related sorting models. 4OR Q. J. Oper. Res. 2023, 21, 1–31. [Google Scholar] [CrossRef]
- Université Laval—Faculté des Sciences de l’Administration. MCDA-ULaval: A Software Tool for Multicriteria Decision Aiding. Available online: https://cersvr1.fsa.ulaval.ca/mcda-ulaval/?q=en (accessed on 14 March 2024).
- Roy, B.; Bouyssou, D. Aide Multicritère à la Décision: Méthodes et cas; Economica: Paris, France, 1993; p. 695. [Google Scholar]
- Saaty, T.L. The Analytic Hierarchy Process: Planning, Priority Setting, Resources Allocation; Mcgraw-Hill: New York, NY, USA, 1980; p. 287. [Google Scholar]
- Simos, J. Evaluer l’Impact sur l’Environnement, une Approche Originale par l’Analyse Multicritère et la Négociation; Presses Polytechniques et Universitaires Romandes: Lausanne, Switzerland, 1990; p. 261. [Google Scholar]
- Maystre, L.Y.; Pictet, J.; Simos, J. Méthodes Multicritères ELECTRE: Description, Conseils Pratiques Et Cas D’application À La Gestion Environnementale; Presses Polytechniques et Universitaires Romandes: Lausanne, Switzerland, 1994; Volume 8, p. 323. [Google Scholar]
- European Environment Agency. European Waters Assessment of Status and Pressures, EEA Report No.7/2018; Kristensen, P., Whalley, C., Zal, F.N.N., Christiansen, T., Eds.; Technical Report; European Union: Copenhagen, Denmark, 2018. Available online: https://www.eea.europa.eu/publications/state-of-water (accessed on 16 February 2024).
- Amirshenava, S.; Osanloo, M. A hybrid semi-quantitative approach for impact assessment of mining activities on sustainable development indexes. J. Clean. Prod. 2018, 218, 823–834. [Google Scholar] [CrossRef]


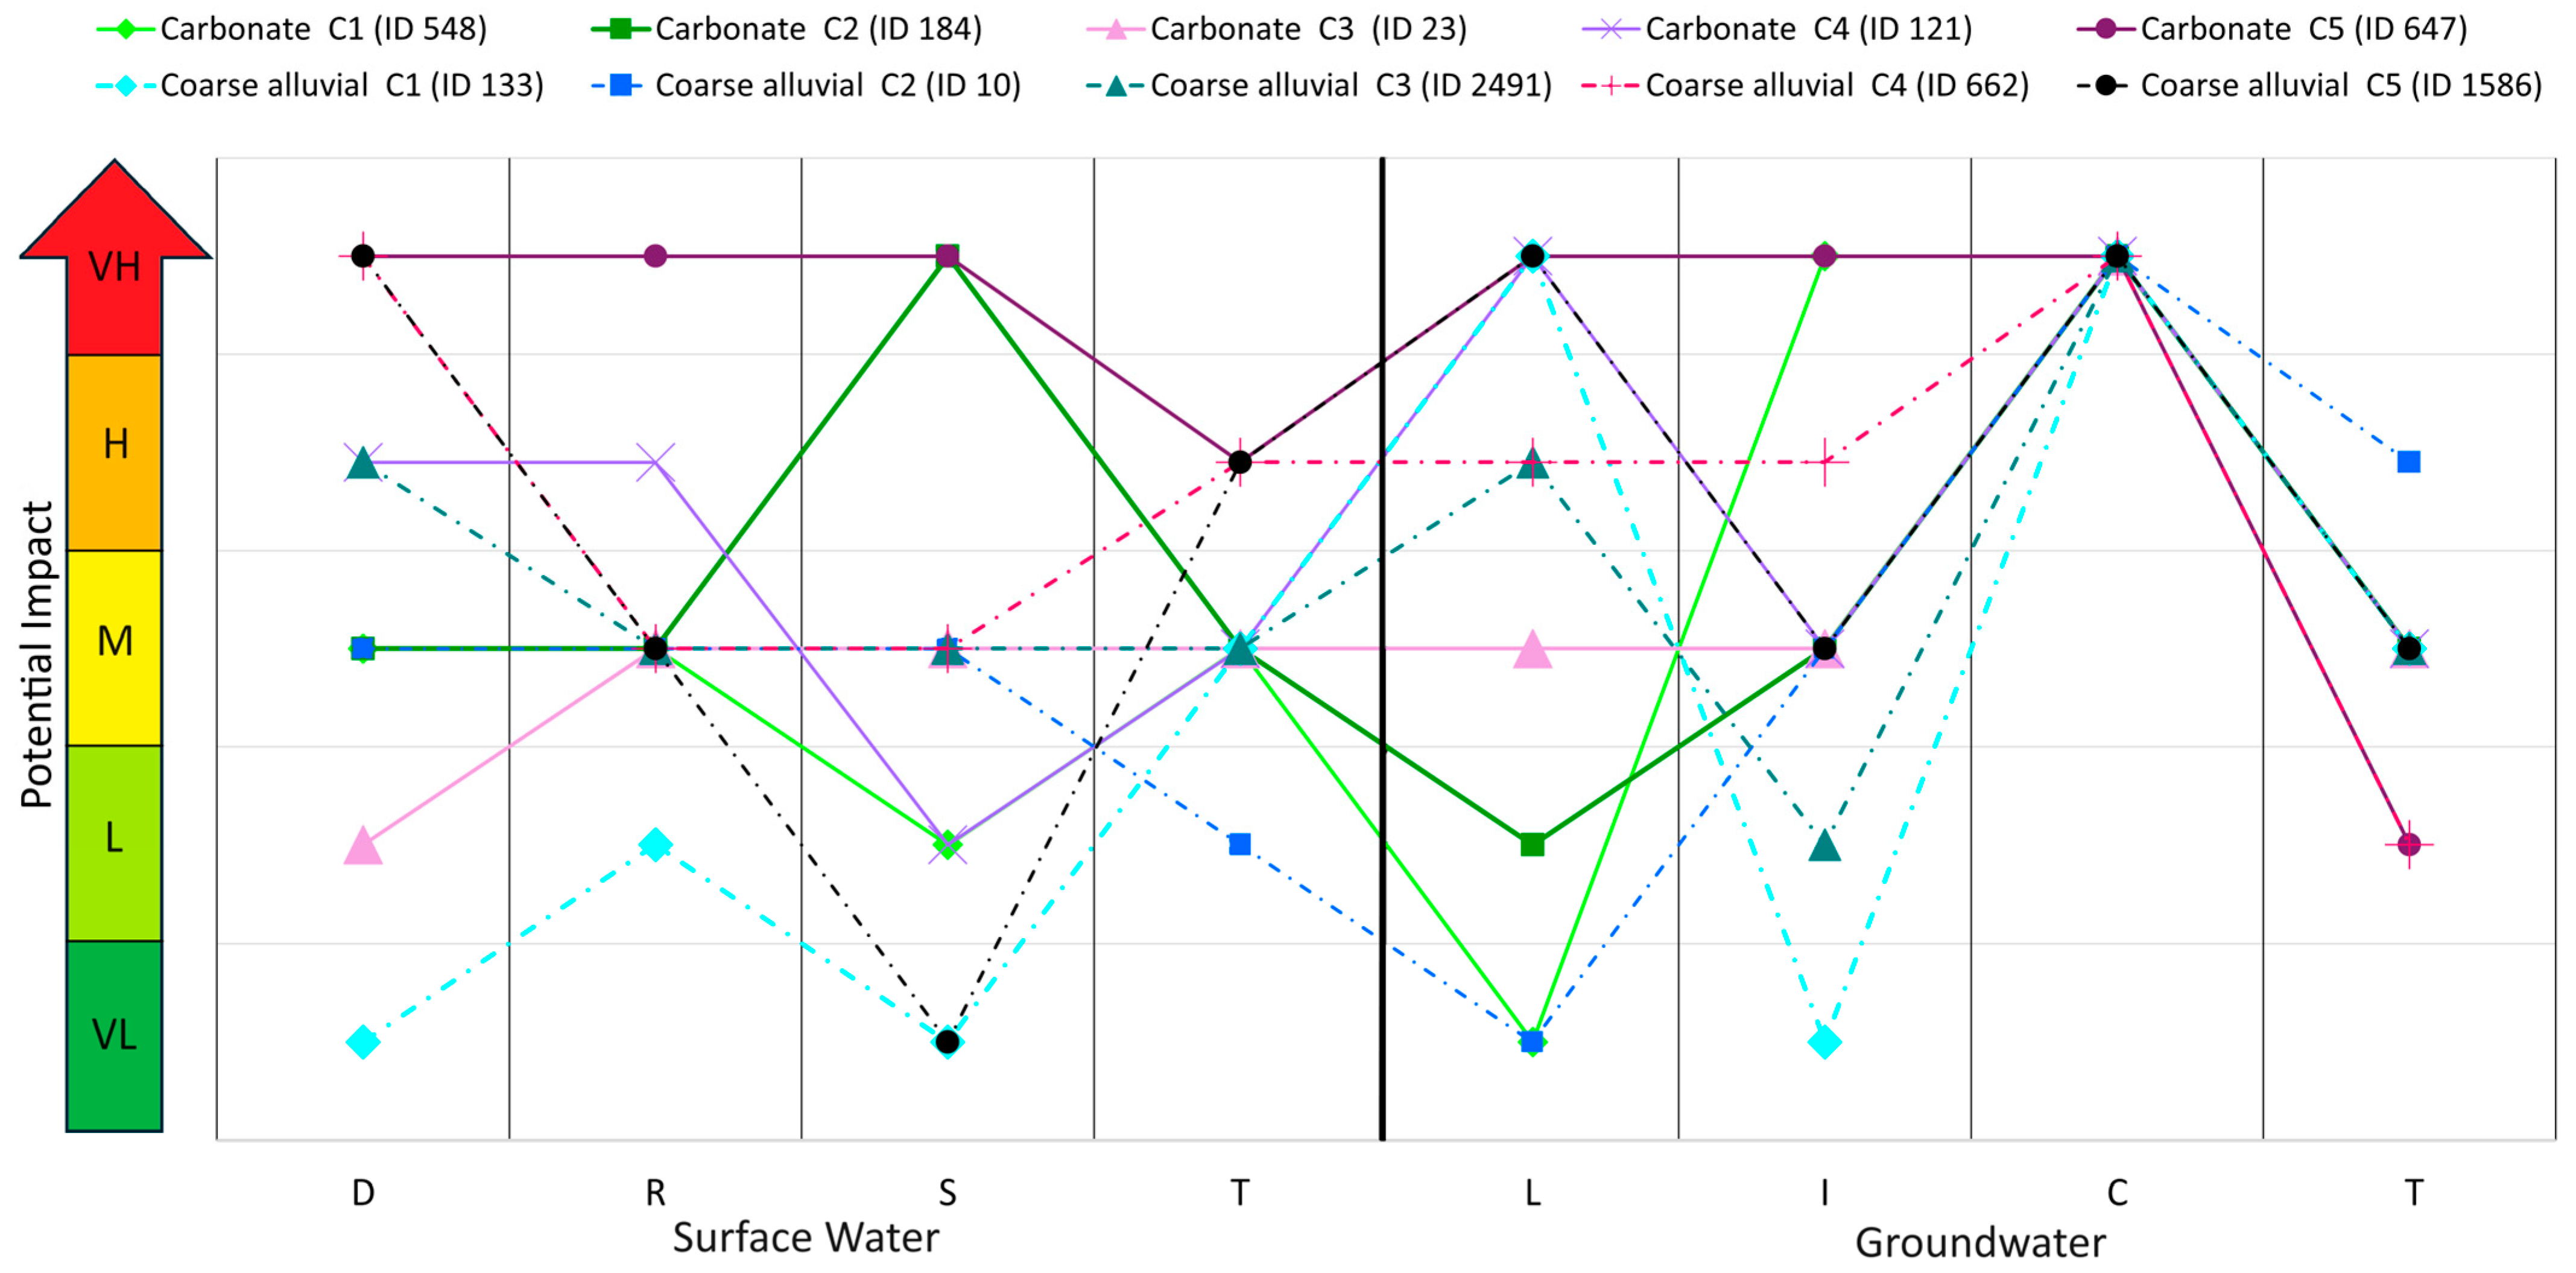
| MCDA Classification | Level of Impact |
|---|---|
| Category 1 (C1) | Very low impact (VL) |
| Category 2 (C2) | Low impact (L) |
| Category 3 (C3) | Medium impact (M) |
| Category 4 (C4) | High impact (H) |
| Category 5 (C5) | Very high impact (VH) |
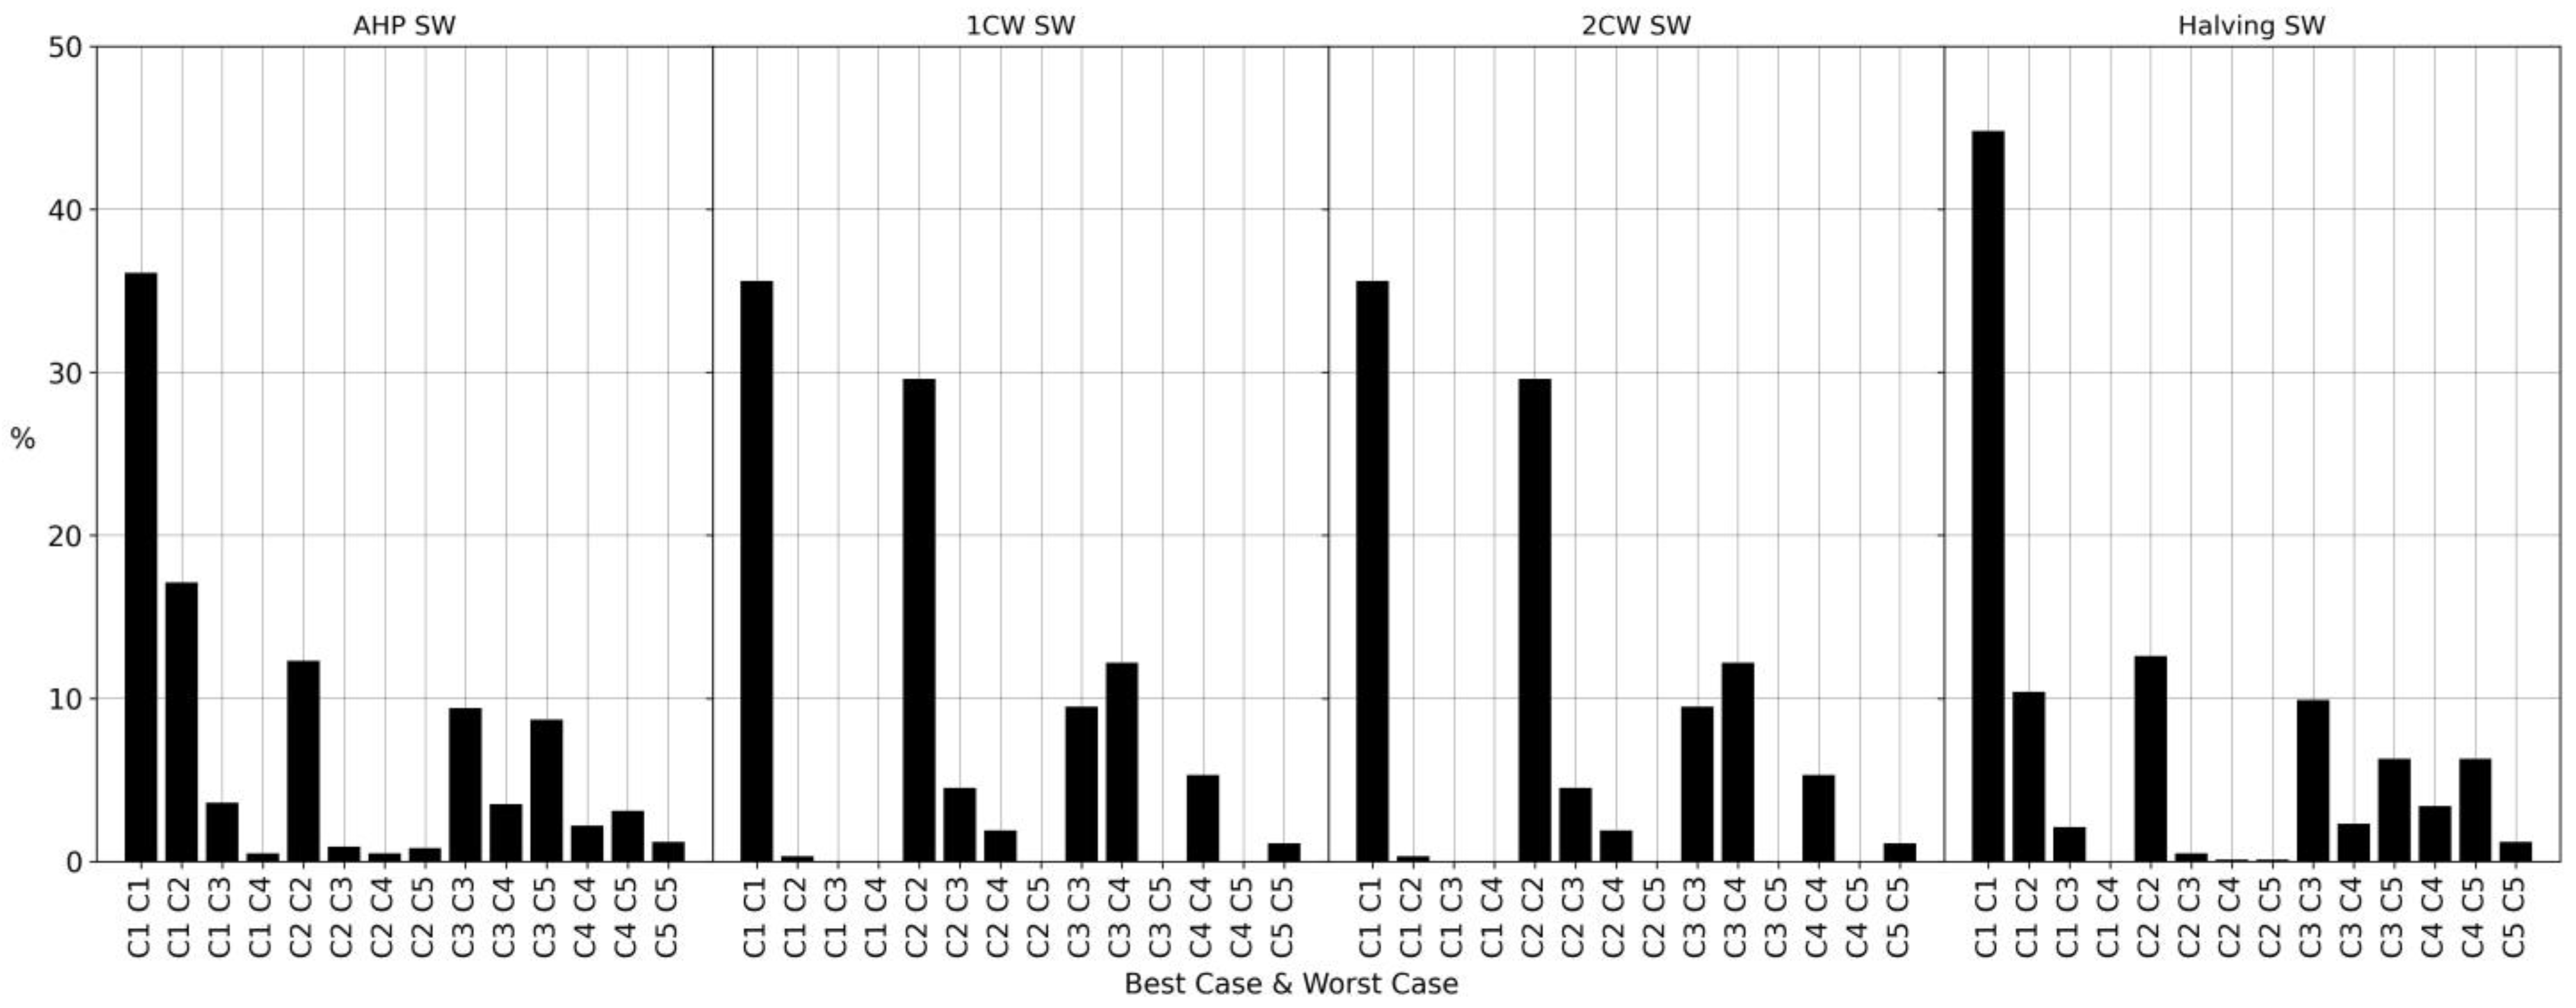
| Micro SW | AHP | 1CW | 2CW | Halving |
| D | 0.253 | 0.222 | 0.216 | 0.267 |
| R | 0.137 | 0.158 | 0.148 | 0.133 |
| S | 0.084 | 0.078 | 0.091 | 0.067 |
| T | 0.026 | 0.039 | 0.034 | 0.033 |
| Micro GW | AHP | 1CW | 2CW | Halving |
| L | 0.236 | 0.222 | 0.216 | 0.267 |
| I | 0.144 | 0.130 | 0.148 | 0.133 |
| C | 0.077 | 0.112 | 0.113 | 0.067 |
| T | 0.043 | 0.039 | 0.034 | 0.033 |
Disclaimer/Publisher’s Note: The statements, opinions and data contained in all publications are solely those of the individual author(s) and contributor(s) and not of MDPI and/or the editor(s). MDPI and/or the editor(s) disclaim responsibility for any injury to people or property resulting from any ideas, methods, instructions or products referred to in the content. |
© 2024 by the authors. Licensee MDPI, Basel, Switzerland. This article is an open access article distributed under the terms and conditions of the Creative Commons Attribution (CC BY) license (https://creativecommons.org/licenses/by/4.0/).
Share and Cite
Paoletti, M.; Piscopo, V.; Sbarbati, C.; Scarelli, A. Categorization of the Potential Impact of Italian Quarries on Water Resources through a Multi-Criteria Decision Aiding-Based Model. Sustainability 2024, 16, 2804. https://doi.org/10.3390/su16072804
Paoletti M, Piscopo V, Sbarbati C, Scarelli A. Categorization of the Potential Impact of Italian Quarries on Water Resources through a Multi-Criteria Decision Aiding-Based Model. Sustainability. 2024; 16(7):2804. https://doi.org/10.3390/su16072804
Chicago/Turabian StylePaoletti, Matteo, Vincenzo Piscopo, Chiara Sbarbati, and Antonino Scarelli. 2024. "Categorization of the Potential Impact of Italian Quarries on Water Resources through a Multi-Criteria Decision Aiding-Based Model" Sustainability 16, no. 7: 2804. https://doi.org/10.3390/su16072804
APA StylePaoletti, M., Piscopo, V., Sbarbati, C., & Scarelli, A. (2024). Categorization of the Potential Impact of Italian Quarries on Water Resources through a Multi-Criteria Decision Aiding-Based Model. Sustainability, 16(7), 2804. https://doi.org/10.3390/su16072804