Article

Auto-Routing Systems (ARSs) with 3D Piping for Sustainable Plant Projects Based on Artificial Intelligence (AI) and Digitalization of 2D Drawings and Specifications

1
Graduate Institute of Ferrous and Eco Materials Technology, Pohang University of Science and Technology (POSTECH), Pohang 37673, Republic of Korea
2
Department of Industrial and Management Engineering, Pohang University of Science and Technology (POSTECH), Pohang 37673, Republic of Korea
3
DofTech Engineering, 83 Baikbum-ro 1 Gil, Mapo-Ku, Seoul 04104, Republic of Korea
*
Author to whom correspondence should be addressed.
Sustainability 2024, 16(7), 2770; https://doi.org/10.3390/su16072770
Submission received: 28 December 2023 / Revised: 16 March 2024 / Accepted: 23 March 2024 / Published: 27 March 2024

Abstract

:
The engineering sector is undergoing digital transformation (DT) alongside shifts in labor patterns. This study concentrates on piping design within plant engineering, aiming to develop a system for optimal piping route design using artificial intelligence (AI) technology. The objective is to overcome limitations related to time and costs in traditional manual piping design processes. The ultimate aim is to contribute to the digitalization of engineering processes and improve project performance. Initially, digital image processing was utilized to digitize piping and instrument diagram (P&ID) data and establish a line topology set (LTS). Subsequently, three-dimensional (3D) modeling digital tools were employed to create a user-friendly system environment that visually represents piping information. Dijkstra’s algorithm was implemented to determine the optimal piping route, considering various priorities during the design process. Finally, an interference avoidance algorithm was used to prevent clashes among piping, equipment, and structures. Hence, an auto-routing system (ARS), equipped with a logical algorithm and 3D environment for optimal piping design, was developed. To evaluate the effectiveness of the proposed model, a comparison was made between the bill of materials (BoM) from Company D’s chemical plant project and the BoM extracted from the ARS. The performance evaluation revealed that the accuracy in matching pipe weight and length was 105.7% and 84.9%, respectively. Additionally, the accuracy in matching the weight and quantity of fittings was found to be 99.7% and 83.9%, respectively. These findings indicate that current digitalized design technology does not ensure 100% accurate designs. Nevertheless, the results can still serve as a valuable reference for attaining optimal piping design. This study’s outcomes are anticipated to enhance work efficiency through DT in the engineering piping design sector and contribute to the sustainable growth of companies.

1. Introduction

1.1. Industrial Trend of Plant Engineering

In 2022, the global economy experienced sluggish growth due to decreased demands, largely attributed to the resurgence of COVID-19 and the Russian–Ukrainian War [1]. The oil and gas engineering, procurement, and construction (EPC) market worldwide was significantly impacted in 2020 by the pandemic [2]. As of 2023, this market has rebounded to its pre-pandemic levels. In the post-COVID-19 business landscape, the global oil and gas EPC industry, valued at an estimated USD 197 billion in 2022, is projected to grow at a compound annual growth rate (CAGR) of 5.5% from 2022 to 2030. It is expected to reach USD 301.3 billion by 2030 [3].
Aligned with the growth of the global oil and gas EPC market, the plant engineering industry is actively integrating artificial intelligence (AI) technology and pursuing engineering technology innovations amidst the digital transformation (DT) sparked by the Fourth Industrial Revolution [4]. According to McKinsey, automation will transform 20–30% of labor hours into different formats over the next decade [5]. The plant engineering industry is also undergoing a DT in its workforce environment. Digital transformation in the engineering sector drives growth by improving or introducing new business models, enhances operational efficiency through data-driven problem-solving, and enables quick adaptation in a rapidly changing environment via real-time data collection and analysis [6].
EPC projects have a substantial impact, as they are often large-scale endeavors under-taken with substantial investments in plants, infrastructure, and energy [7]. An independent project analysis (IPA) revealed that 65% of over 300 EPC projects failed to achieve their established objectives [8]. Another study found that 73% of EPC projects exceeded their scheduled timelines, and 64% surpassed their budgetary constraints. On average, the actual costs were 59% higher than the initially agreed contract amounts [9].
In EPC projects, decisions made during the design phase directly impact the construction stage. Among 100 EPC projects, 65% that suffered from inadequate engineering output faced issues related to cost and schedule [10]. Insufficient engineering output often leads to rework, delays in the schedule, cost overruns, and potential liquidated damages (LDs). As of 2020, design costs represented 7.3% of the total capital expenditure (CAPEX) for domestic chemical plant projects in Korea and 9.7% globally [11]. In EPC chemical plants, design costs approximate 9% of the total EPC CAPEX, yet the value added by design is nearly 15% of the total investment [12]. Moreover, design errors were ranked as the second most significant out of 57 risk factors in the risk assessment of global steel plant projects [13]. Design, a critical component of EPC projects, has a significantly influence.

1.2. Role of Piping Design in EPC Projects

Piping design is the process of creating a layout to connect various facilities within a plant [14]. It is a vital part of EPC plant projects, accounting for over 40% of the total de-sign budget [15]. At Company P’s Korean steelworks, the COKES plant, primarily com-posed of piping, serves as a chemical facility. In planning a new COKES plant, the distribution of total design costs shows that piping design contributes 56%, machinery 32%, civil engineering 8%, and electrical and instrumentation each contribute 8% [16]. Given its substantial role in engineering, delays in the piping design process can trigger a domino effect on other engineering activities, ultimately leading to schedule delays and cost overruns.
Piping design entails creating connections between various facilities within a plant. This process involves many personnel engaged in piping-related tasks during the design and construction phases. The detailed piping design process is composed of the following six steps.
  • Step 1. Piping routing calculation (or analysis): by collaborating with a process de-sign team, the piping design team receives documents on piping information, such as a piping and instrument diagram (P&ID), piping material specification, and piping material class, to prepare a piping list.
  • Step 2. Equipment layout setting and plot plan writing: after identifying the process flow through P&ID and approximately understanding the piping route, a plot plan is drafted by receiving the size and location information for the equipment and structure from the process design team.
  • Step 3. 3D modeling implementation: the 3D modeling of piping proceeded based on P&ID and the line list, while other facilities and devices were also modeled in 3D through the plot plan mentioned in step 2. More than 90% of piping design drawings are completed using 3D modeling tools.
  • Step 4. Preparing isometric drawings: piping drawings prepared according to the installation unit length or piping manufacturing are called isometric (ISO) drawings. ISO drawings encompass pipe, pipe welding, and connection assembly information; piping installation thus proceeds according to ISO drawings as they contain all relevant information about the piping line.
  • Step 5. Setting pipe priority: priorities are determined on drawings according to the installation sequence for determining the priorities of the piping installation process. The points for integrating newly installed piping with pre-existing piping are determined based on location information received from the project at the initial design stage. These points are incorporated into the design to establish the priorities of the piping design process.
  • Step 6. Writing a bill of materials (BoM): all materials and parts required for a project are listed in a BoM through which the quantity and type of materials can be systematically managed.
The efficiency of piping design has improved with recent advancements in 3D modeling tools, a marked contrast to traditional manual design methods [17]. Three-dimensional modeling is a powerful tool in plant design and construction. However, inaccurate modeling results can have serious implications for the performance and safety of a plant [18]. Inaccurate modeling can precipitate errors during the design phase, potentially leading to the degradation of plant performance. For example, the incorrect modeling of pipelines can cause issues with fluid flow, directly resulting in a decrease in plant efficiency. In particular, inaccurate 3D modeling may lead to the wrong placement, omission, or improper design of safety equipment, which can escalate into serious safety concerns. Consequently, inaccurate 3D modeling incurs additional costs to rectify ensuing problems, thereby diminishing overall operational efficiency. Therefore, to minimize the potential impact of inaccurate modeling, direct human intervention remains essential, necessitating the investment of time and effort. In the last three years, 744 experienced piping design technicians in the United States earned an average daily wage of USD 485 (as of 9 December 2023) [19]. Furthermore, approximately 30% of all engineers involved in chemical plant projects are piping design engineers [10]. Considering labor expenses, the cost increases resulting from delays can significantly impact the overall project.

1.3. Problem Statement and Research Objectives

Petrochemical plants rely on complex piping systems to transport a wide range of fluids, from harmless water to highly corrosive chemicals. Traditional piping design involved engineers manually using 2D drawings, significantly affecting the efficiency, accuracy, and safety of the design process. Such a manual design approach presents several limitations and drawbacks. Firstly, manual design processes are highly susceptible to human error, leading to a greater likelihood of inaccuracies. In the design phase, missed or incorrect information can result in issues during the construction phase. This is particularly critical in complex piping systems found in chemical plants, where design mistakes can directly lead to safety incidents and increased costs. Secondly, the repetitive nature of manual design results in significant time consumption, lowering design efficiency. Especially when design changes necessitate rework, this can lead to delays and additional costs. Thirdly, manual design relies heavily on the engineer’s experience and knowledge, limiting the range of design options. Incorporating the latest technologies or trends into design choices requires engineers to continually update their expertise in specific fields. Additionally, reliance on the specialized knowledge and experience of skilled engineers in manual design can exacerbate the issue of professional personnel shortages, potentially leading to long-term imbalances in design quality. Lastly, manual design faces challenges in document management, making it difficult to maintain the consistency and accuracy of design information. This can result in unmanaged design change histories, complicating subsequent work. Thus, while manual piping design has historically met needs, its limitations are becoming increasingly clear. To overcome these shortcomings, there has been a recent shift towards the adoption of automated piping design systems utilizing 3D CAD software [17].
The plant industry is facing increasing risks in project schedules and quality due to the growing complexity of multi-disciplinary design in large-scale and complex plant projects. In this context, the domestic plant engineering industry is grappling with challenges stemming from a decrease in the number of engineers and an aging workforce [20]. The introduction of 3D CAD systems has contributed, to some extent, to mitigating these issues. However, the reality faced by EPC engineering firms, characterized by the scaling up of plants and the difficulty in securing sufficient engineering talent, remains inadequately addressed. The industry is increasingly embracing the latest technological advancements, particularly those associated with Industry 4.0 (I4.0), such as artificial intelligence, cloud computing, and big data. This collective shift towards integrating these technologies is conceptually known as DT [21]. Plant engineering firms are making concerted efforts to pursue DT to address the scarcity of engineers and challenges posed by the expansion and complexity of projects. Simultaneously, they aim for sustainability in alignment with the technological advancements associated with the FIR [22].
DT can enhance the design process, improve communication, and reduce human errors by leveraging advanced technologies such as 3D or 4D Building Information Modeling (BIM). This can ultimately improve the efficiency of construction, and minimize construction delays and costs. Additionally, digital design is easily reusable, making it easier to apply to similar projects and thereby enhance productivity. To tackle these challenges, it is imperative to automate traditional piping design processes through digital transformation. This approach aims to improve design accuracy, enhance efficiency, and reduce the high dependency on experts in the design process.
The primary objective of this study is to create a system that automates piping route design through digital technology. The focus is specifically placed on piping design, a significant component in the engineering domain. This study has established the following detailed goals accordingly.
  • To develop a system that automates the accurate design of piping routes, which traditionally has been a manual task performed by engineers. This system aims to replace the manual process with an automated approach for piping route design.
  • To contribute to DT within the engineering sector by providing a solution that addresses the swiftly evolving external technological environment.
Hence, the auto-routing systems (ARSs) for optimal piping auto-routing was developed. In this study, the ARS for the P&ID of EPC plant projects was developed. The ARS was set with identical process conditions as those observed in completed projects. Piping design is fundamentally based on process conditions, which serve as the essential specifications for operating a piping system [23]. Process conditions include fluid type, temperature, pressure, speed, and corrosion resistance. Piping diameter is selected based on fluid characteristics, while fluid temperature determines the piping material. Pressure and piping schedule are related to the thickness of the piping. An appropriate material must also be reflected in environmental conditions depending on the piping location. The developed model was evaluated using the as-built data of a chemical plant project executed by Company D, a major EPC firm in Korea. Only a portion of the provided data were used in this study due to security concerns and to prevent technology leaks.

2. Literature Review

In this section, studies related to the development of automated models for optimal piping route design were analyzed. The results of each study, as they pertain to this re-search, are examined. The review of previous studies is categorized into three groups: digital image processing, plant 3D model layout, and auto-routing systems in engineering design.

2.1. Digital Image Processing

Cordella et al. [24] categorized symbol recognition in images into three types: representation, description, and classification. Nazemi et al. [25] developed a mathematical information retrieval (MIR) system that converts the mathematical representation of images into machine language. However, MIR faces limitations in accurately recognizing and converting mathematical expressions. Saabni et al. [26] introduced a binary method and line segmentation approach for automatically extracting text lines from gray-scale images, noting a decrease in system processing speed due to inconsistent spacing between letters. Pham et al. [27] employed a merging optimization algorithm to detect intersection points in text images, using the linear least squares technique to enhance image clarity and optimize the merged area for better image characteristic detection. Yan et al. [28] introduced a text recognition method employing a color clustering algorithm for segmenting an image into multiple layers by class. Shi et al. [29] developed an end-to-end scene text recognition method for detecting and recognizing text in natural images. Kulkarni et al. [30] utilized a stepwise and integrated approach for detecting and recognizing specific words in color images. Mittal et al. [31] proposed a multi-directional text detection method in images, employing a super resolution mapping approach for subpixels, although this required adjustments to the video frame speed. Elyan et al. [32] presented a semi-automatic and heuristic approach for detecting and identifying symbol locations in drawings. Kang et al. [33] developed intelligent P&ID by applying a digital image processing technique to automatically recognize and extract design information from piping and instrumentation drawings converted into images. Yu et al. [34] proposed a deep learning method for recognizing and extracting object information from P&ID. However, the proposed method requires a large number of resources and training data for object information recognition due to insufficient datasets. Elyan et al. [35] suggested an algorithm with improved symbol classification accuracy for recognizing and arranging various types of symbols on drawings, even with a small amount of training data. Guo et al. [36] proposed a deep learning-based framework for symbol extraction and recognition by combining a deep convolutional neural network (CNN) and graph convolutional network (GCN). However, text and certain symbols were not as easily recognized. Renton et al. [37] suggested an approach for extracting and classifying symbols from floor plans. Their approach involves applying digital images to GCN and extracting them into groups corresponding to each node classification and symbol. Naiemi et al. [38] developed a local word direction pattern (LWDP) algorithm to address the difficulty in detecting complex backgrounds, curves, and vertical text. LWDP requires additional support from other text recognition technologies as its performance can degrade based on environmental conditions. Kim et al. [39] proposed a method for recognizing symbols and text in a P&ID image by employing deep learning technology. Symbols are recognized based on the GFL method, while text is recognized through the EasyOCR framework. However, there are challenges related to a lack of sufficient training data and the need to assess the effectiveness of parallel network structures for learning object relations. Xie et al. [40] introduced a framework to automate the generation of queried engineering drawings in the manufacturing sector, achieving a 90.78% accuracy rate in classifying mechanical drawings. Tong et al. [41] enhanced the maximally stable extreme region (MSER) object detection method by proposing a multi-channel MSER detection approach. However, this method may not be suitable for real-time processing due to an increased processing time with larger and more complex images. Kohli et al. [42] presented a solution using OpenCV technology for detecting text in handwritten documents, with limitations in recognizing various fonts and numbers. Liu et al. [43] proposed a framework for open-set text recognition capable of discovering and recognizing character strings, but noted potential performance degradation with specific languages.

2.2. Three-Dimensional Modeling Layout for Plant Project

Wen et al. [44] proposed a topology-based algorithm that enables consistency checks and searches by matching a 3D model with a 2D image drawing. Belov et al. [45] suggested a MiniZinc model for optimizing the pipe layout of a chemical plant. MiniZinc incorporates practical requirements and ensures the effective functioning of a plant while minimizing the overall cost of the plan. Chen et al. [46] developed a maximal dis-joint ball decomposition (MDBD)-based GCN for shape analysis, addressing the issue of incompatibility between shape analysis algorithms and their application. Uchida et al. [47] introduced a method to determine line intensity in 3D models using line properties and thicknesses. Kim et al. [48] developed an automatic pipe and elbow recognition technique using curvature information and a CNN-based classification algorithm. This technique, recognizing pipes and elbows through a center line and a connection method based on a CNN neural network, was noted to be sensitive to noise and occlusion. Sierla et al. [49] extracted control loop information from P&ID and 3D CAD drawings and converted it into a graph. They developed a Data Exchange in the Process Industry (DEXPI) algorithm to obtain an integrated graph model. Kim et al. [50] proposed a method for identifying objects by selecting dimension and resolution for 3D shape search in the point cloud query. Jin et al. [51] proposed a part-based recurrent multi-view aggregation network (PREMA) for identifying consistent 3D models; however, the suggested network functions exclusively within a trained model. Nie et al. [52] proposed a cross-domain learning network (CLN) for performing a 3D shape search based on 2D images. They introduced a collaborative learning network for mapping 2D images and 3D shapes through cross alignment. Fu et al. [53] proposed a method to optimize 3D piping arrangements to avoid resonance in piping systems. This method estimates the optimal frequency for piping placement using the wave approach method. Parisher et al. [54] explained model conflicts, interference, and BoM extraction in 3D modeling techniques. Pan et al. [55] presented a new approach for automatically generating 3D piping models by simultaneously registering a laser scan point cloud and image. Perez-Perez et al. [56] introduced a learning method based on Markov random field (MRF), which assigns semantic labels by utilizing a point cloud system in industrial building projects. Hou et al. [57] proposed a GCN-based FuS-GCN approach as a 3D model classification and search method for application to boundary representation 3D CAD when operating in a mesh or point cloud. Zhang et al. [58] suggested an approach for generating a 3D CAD model from an isometric projection image. Their approach was verified in an open dataset composed of thousands of 3D shapes, and it achieved an F-score of 99.59%. In the field of plant engineering, commonly used commercial 3D modeling software applications are Intergraph SmartPlant3D (SP3D) and AVEVA Everything3D (E3D). SP3D, developed by Hexagon, is a widely used 3D tool, particularly in onshore plants [59]. It supports database (DB) creation, with supported DB types including Microsoft SQL (MS SQL) and Oracle. E3D, developed by AVEVA, is a 3D design tool primarily used in the offshore and power industries [60]. Both SP3D and E3D support on-premise or cloud environments.

2.3. Auto-Routing System for Engineering Design

Kang et al. [61] developed a method for designing marine pipeline routes with obstacles based on Dijkstra’s Laplacian smoothing algorithm. Wu et al. [62] adopted an improved ACO to apply piping routing design (PRD) for an oil and gas processing system in a semi-submersible production platform. Grabusts et al. [63] utilized a simulated annealing method for finding the shortest route between different objects. Dong et al. [64] developed an auto-routing approach based on A-star and genetic algorithms for finding optimal routes in ship pipe route design (SPRD). Min et al. [65] suggested a jump point search (JPS)-based auto-routing algorithm for shortening the time required to find the optimal pipe route. Sierla et al. [66] used graph matching to resolve the difference identified between 2D and 3D source graphs. Luo et al. [67] conducted a study on obtaining a 2D path accessible by robots on a ground surface path through the improved Dijkstra algorithm. Their method enhanced the accuracy of robot task execution. Gunawan et al. [68] suggested an auto-routing method for pipes in a ship engine room using the Dijkstra and genetic algorithm. By maximizing the usage of piping support, costs were reduced by 5.59%, and the length of the piping route was shortened by 13.25%. Lin et al. [69] suggested differential evolution and cuckoo search (DDECS) for the problem of ship pipe route layout optimization. Tsai et al. [70] developed a site pipeline inspection and auto-adjusting approach by utilizing augmented reality and a grid-based path planning algorithm. Lee et al. [71] presented a method for generating the shortest passage plan for a navigable ship based on the automatic identification system data. However, the presented method necessitates a comprehensive setup of the environment and data for its application to alternative routes. Skretas et al. [72] developed a framework for routing and designing pipelines applicable to full-scale main pipelines. Furthermore, they also used the multi-objective optimization (MOO) algorithm to quantify the environmental impact in relation to financial costs. Vivaldini et al. [73] proposed automating logistics processes by implementing an auto-routing system to enhance cost efficiency and boost productivity. The researchers applied a time window algorithm to develop a system, addressing issues within warehouses and ensuring optimal route solutions. Ha et al. [74] constructed a system capable of organizing expert knowledge for improving the design of ship piping. The researchers utilized an arrangement path-finding algorithm to represent routes in mathematical expressions to concretize expert knowledge. Kim et al. [75] devised a curriculum-based reinforcement learning method that can quickly adapt when choosing a ship’s pipeline, which often requires adjustments. Compared to existing methods, the suggested approach resulted in improved piping length and bent count but a longer learning time. Table 1 below provides an overview of prior research within each category.

2.4. Limitation of Previous Research

By analyzing the recent technological trends in piping design, the authors examined the technologies and limitations for the auto-routing of piping. First, numerous studies on image digitalization and associated technologies were analyzed. Currently, academic research predominantly focuses on image digitalization technology. However, there is a paucity of studies on the assessment of the practical effectiveness of implementing this technology in real-world projects. Various studies employed image-matching technology to align each component with its property information for management as topology data. Additionally, significant research has been conducted on path algorithms for auto-routing design using machine learning. However, the majority of these studies were limited by insufficient foundational datasets and a lack of continued research. This study aims to analyze the latest technological advancements in auto-routing to incorporate state-of-the-art technology into the design of piping auto-routing systems. The goal is to develop an ARS that is suitable for practical use in plant project design.
Moreover, after reviewing the commercial 3D modeling SW commonly used in the plant engineering field, it was also found that 3D modeling tools such as E3D and SP3D do not have automatic design functions. This means a significant amount of a design engineer’s man-hours must be invested to produce ISO drawings. This study developed ARS, a 3D-based automatic routing system for piping paths, to overcome these limitations and improve the productivity of piping design engineers. To this end, digital image processing technology and the Dijkstra algorithm, which were discovered through previous research, were applied. The ARS developed in this study is intended to be applied to actual plant project design, and it is expected to promote DT in the plant engineering field and contribute to the sustainable growth of the industry.

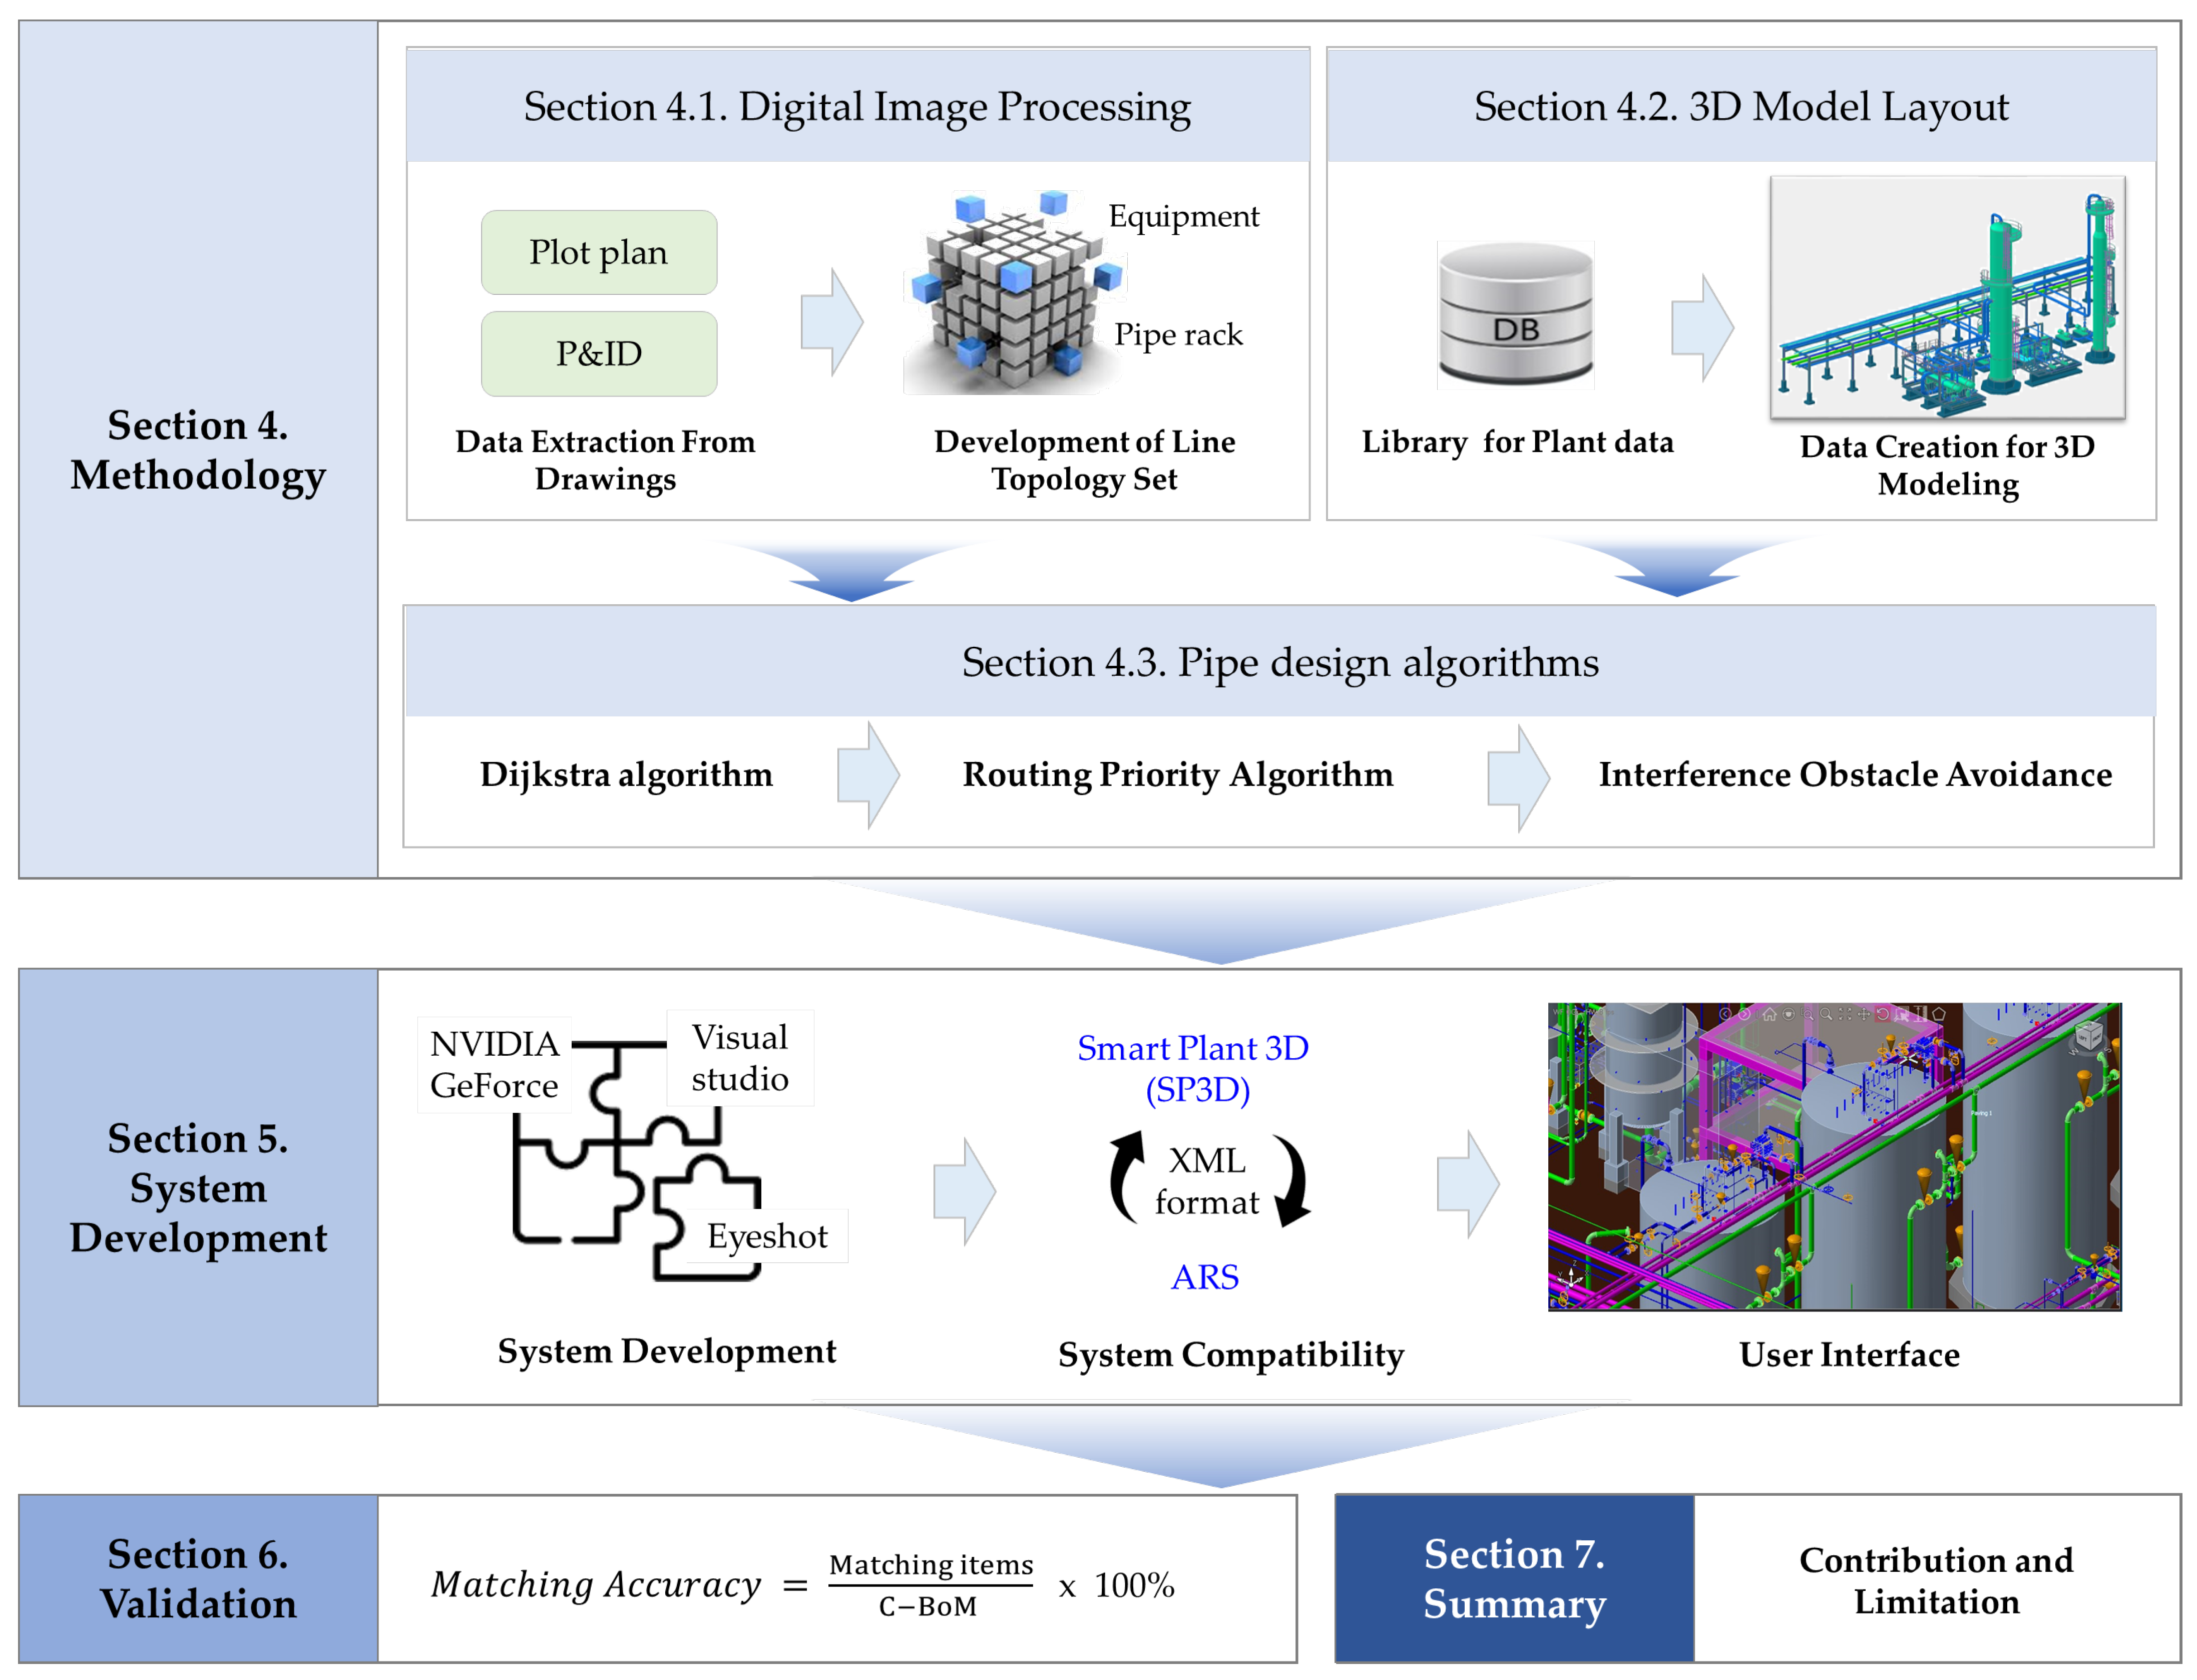
3. Research Framework

This section explains the overall development process for automatically extracting design information in drawings to design optimal piping routing.
Section 4 outlines the primary methodology adopted for the development of the ARS. First, the P&ID and line list are digitized. This is followed by digital image processing for the auto-routing process. An algorithm for image and text recognition was employed to extract and identify symbols, lines, and text. This section elaborates on how a line topology set (LTS), the fundamental unit of auto-routing, is configured using extracted data. It then describes a system for visually presenting P&ID and plot plan diagrams through 3D modeling. The data for 3D modeling, stored in a library database, include commonly used facilities, devices, structures, and packages. The integration process of external data with the system for configuring 3D modeling is also detailed. As the third research approach, one section explains three essential algorithms necessary for the ARS. It describes the use of the Dijkstra algorithm for finding the optimal route and routing priority algorithm for determining the priority of piping. Additionally, the section covers an interference avoidance algorithm designed to prevent obstacles from disrupting the piping route until it reaches its destination. Section 5 explains the user interface (UI) screen and certain features of the system developed in Section 4. The ARS server environment is distinguished into hardware and software. Furthermore, interlocking with external programs and data compatibility are explained. In Section 6, a simulation is performed to compare the system results with the as-built data of a chemical plant project. A newly configured route is compared with the existing route, and 3D modeling is applied to check the adjusted route. Lastly, Section 7 summarizes the ARS developed in this study. Additionally, future research directions are discussed in this section. Figure 1 shows a visual representation of the overall research process.

4. Methodology

Section 4 provides an in-depth explanation of the technologies and algorithms employed in the development of the ARS. First, digital image processing is the process of digitalizing piping object information from the ARS using P&ID and line lists [32]. The technology and algorithms that allow a system to recognize P&ID, list lines, and extract necessary information are included. Furthermore, creating a 3D model layout involves transforming all information derived from P&ID and plot plans, excluding line information, into data and arranging it within the system. The technology and algorithms for arranging the 3D model layout using data are included. An optimal pipe design algorithm applied to the ARS is explained in detail. Figure 2 presents the technologies applied for developing the ARS and their relationships.

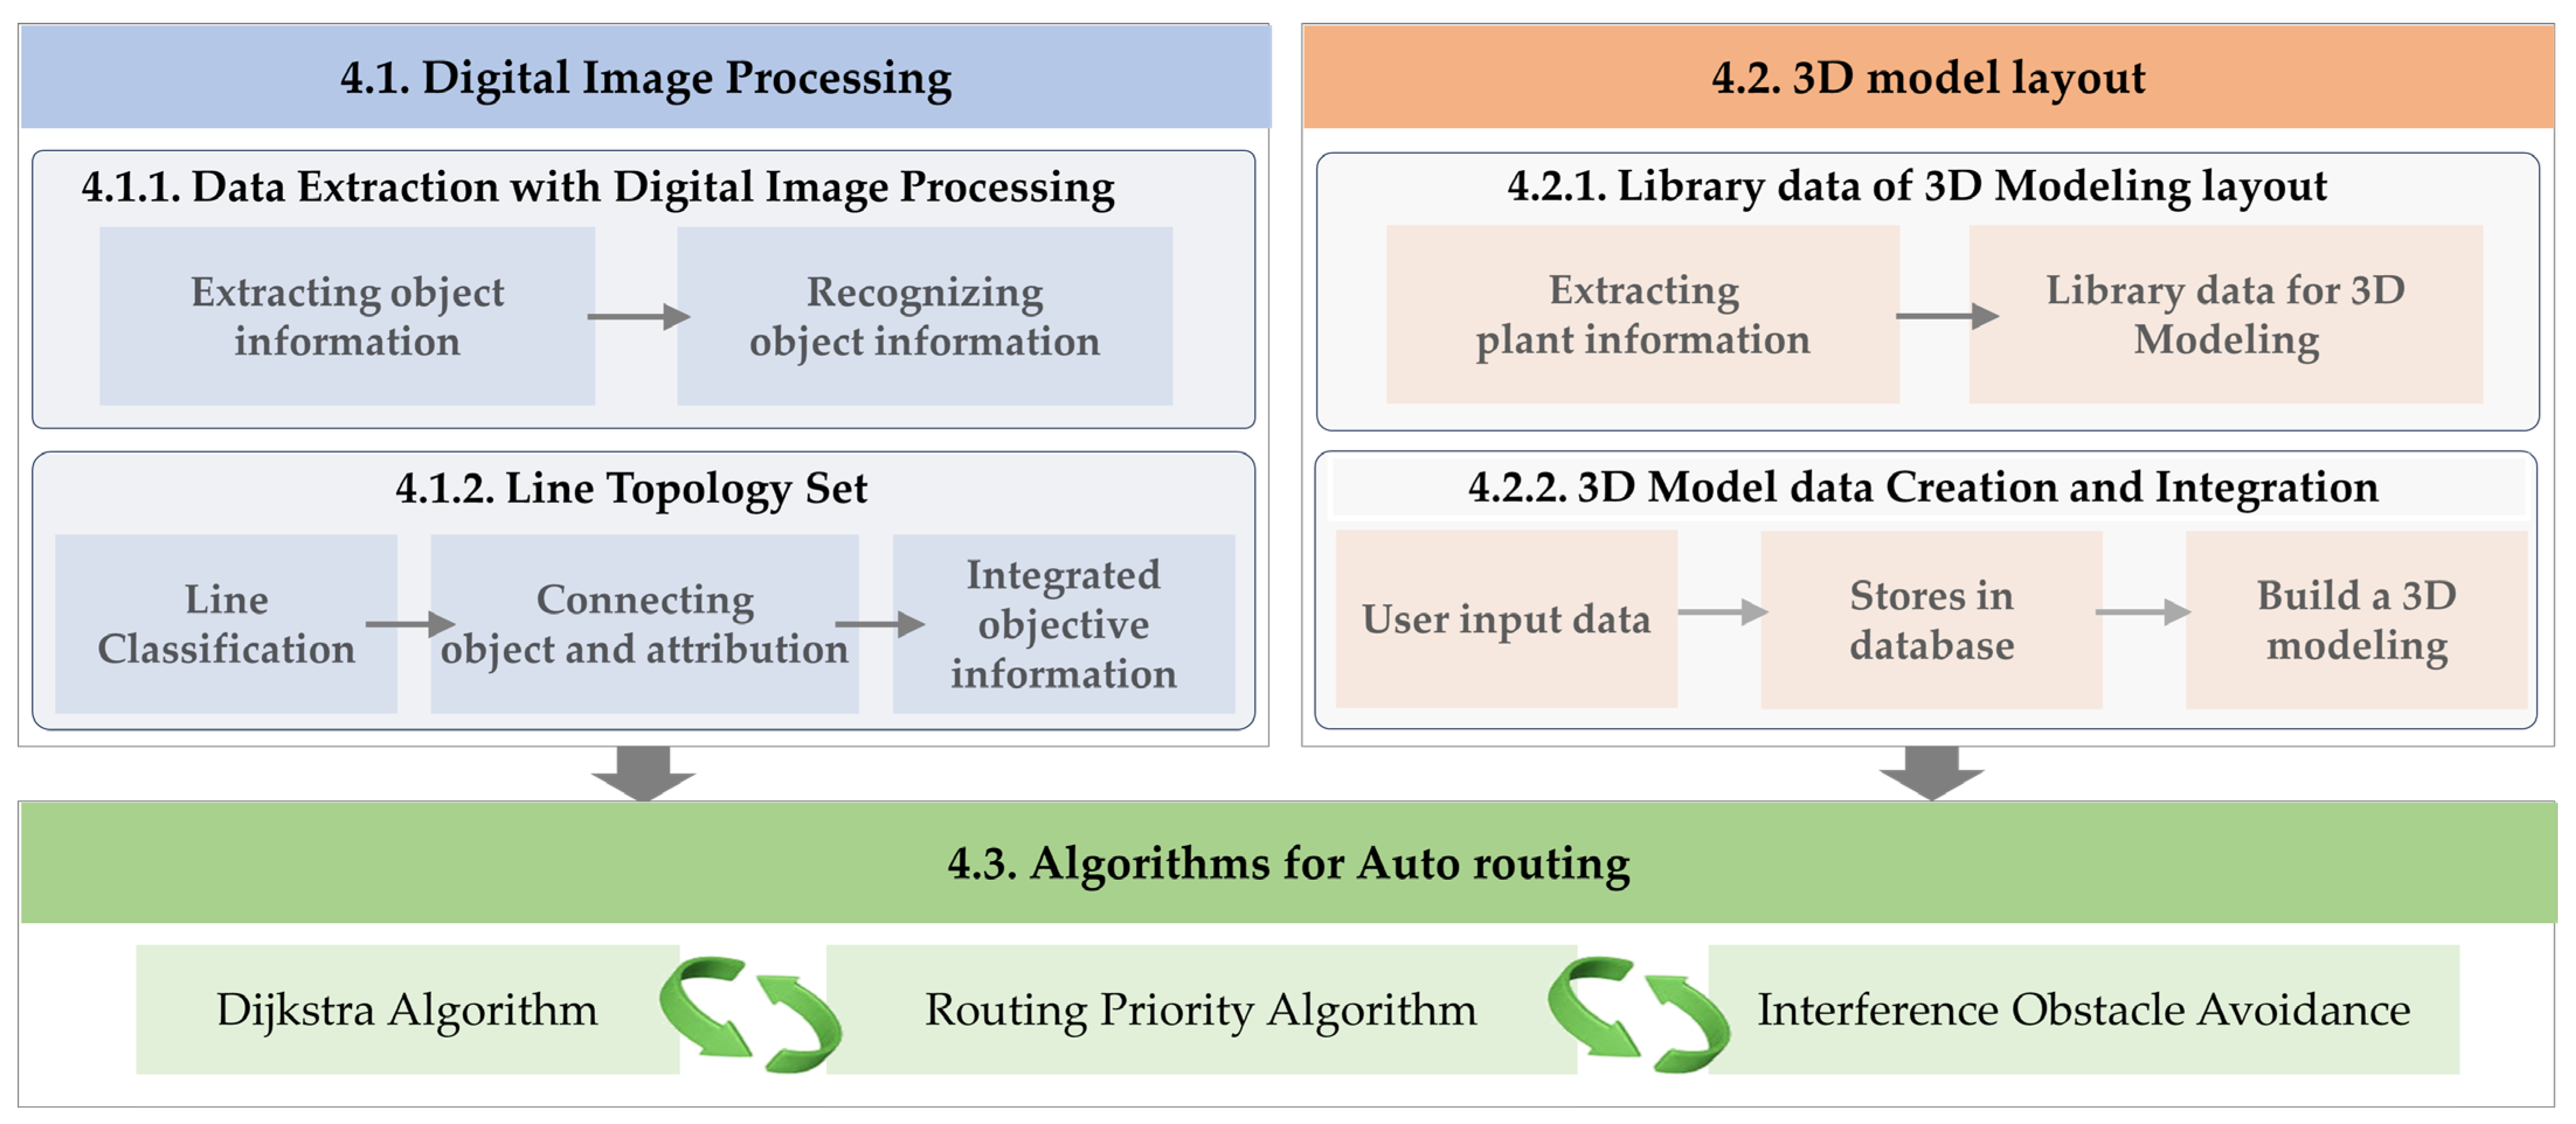
4.1. Digital Image Processing on Piping Drawings

In this study, a method that converts object information from P&ID into a digital image was used to digitize piping information. As the basic unit of auto-routing of piping, LTS or the set of object information was utilized to designate piping information at a group level. Digital image processing serves as a data preprocessing step for the ARS, during which any information in P&ID drawings essential for auto-routing is converted into a digital format [76]. However, the mere conversion of object information into a digital format does not qualify as the digitalization of P&ID. Furthermore, digital P&ID involves the reconfiguration process to assign attributes and establish linkages for structures between identified symbols, lines, and text [34]. Digital image processing was performed in two separate steps: extracting data from drawings and developing the LTS.

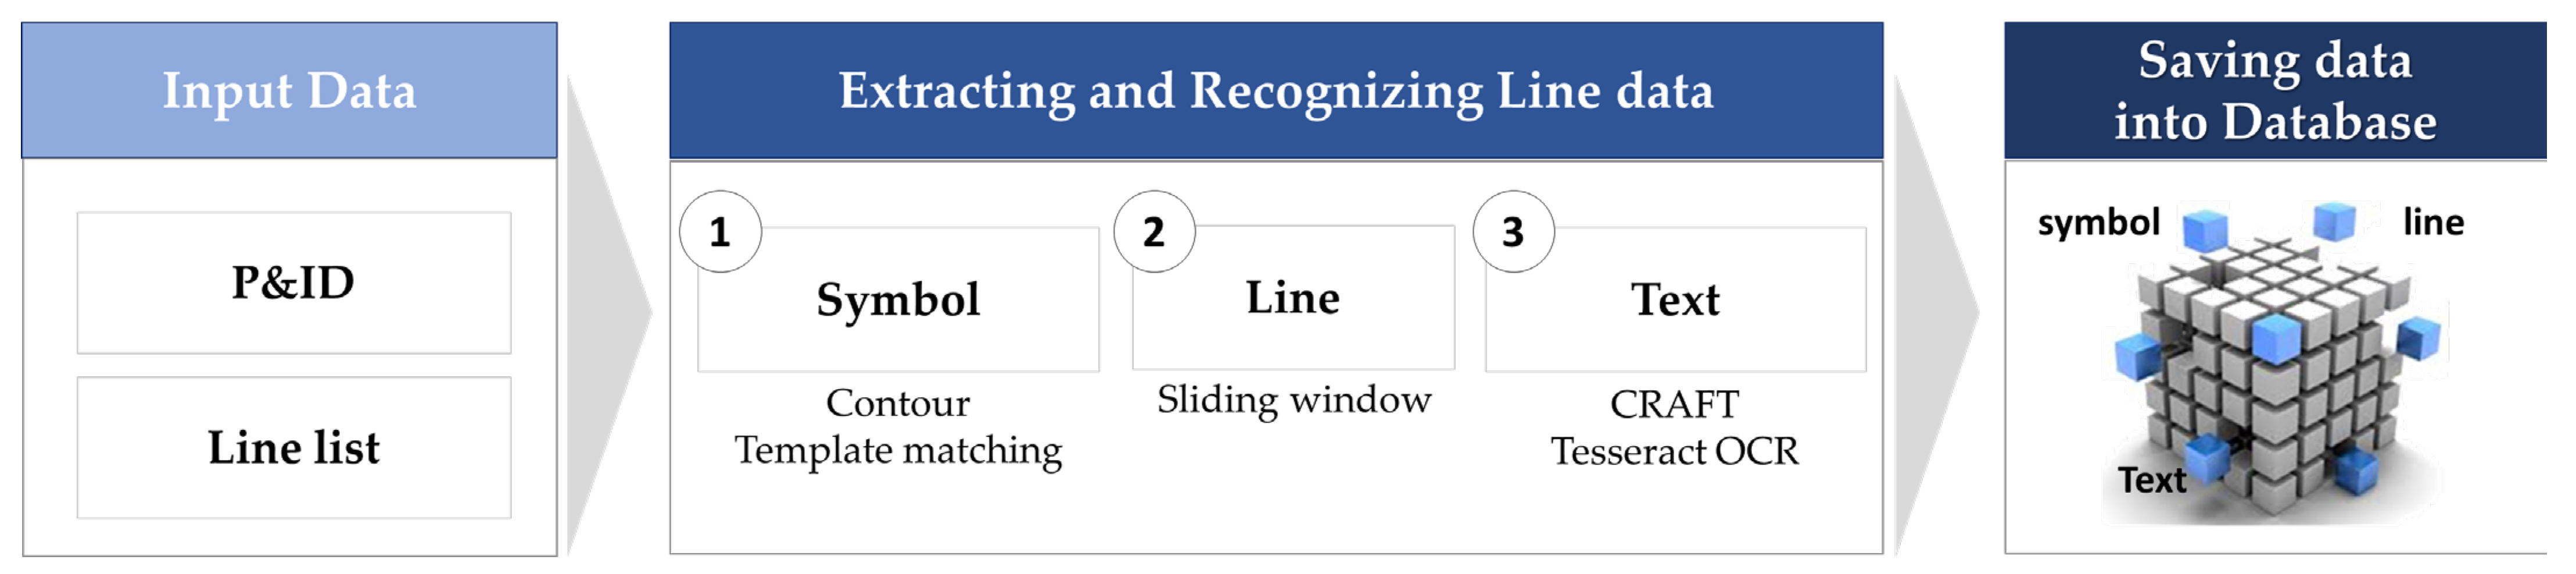
4.1.1. Data Extraction with Digital Image Processing

Conventionally, P&ID piping design was typically conducted manually by individuals relying on 2D images. Data errors were expected due to the simultaneous involvement of multiple managers in projects [77]. To overcome this type of issue, this study selected a method for automatically recognizing and extracting P&ID objects and attribute images from the system. The process is as follows.
First, symbols are identified and extracted from P&ID drawings. Before symbol recognition, relevant symbols are defined and registered in the system to facilitate accurate identification. This pre-registration of precisely defined symbols assists in correctly identifying those extracted from P&ID. A contour algorithm, which utilizes color or brightness differences in an image to delineate object boundaries, is employed to extract symbols from P&ID automatically. This algorithm transforms symbols into a format suitable for computer processing by expressing attributes extracted from the image [78]. Following symbol extraction, the template matching technique used in ID2 [33] is employed for symbol recognition in P&ID. This technique involves comparing and matching a provided template across various sections of the target image. Successfully matched symbols are then verified for accuracy and stored in the system’s database. After symbol recognition, a verification process is conducted to align the identified symbols with those on the system’s pre-registered symbol list. The recognized symbols are saved in a system database and subsequently removed from the drawings as a precautionary measure to prevent system errors.
Second, lines representing piping or process flow are extracted from P&ID [79]. Lines in a P&ID are classified into three types based on their purpose.
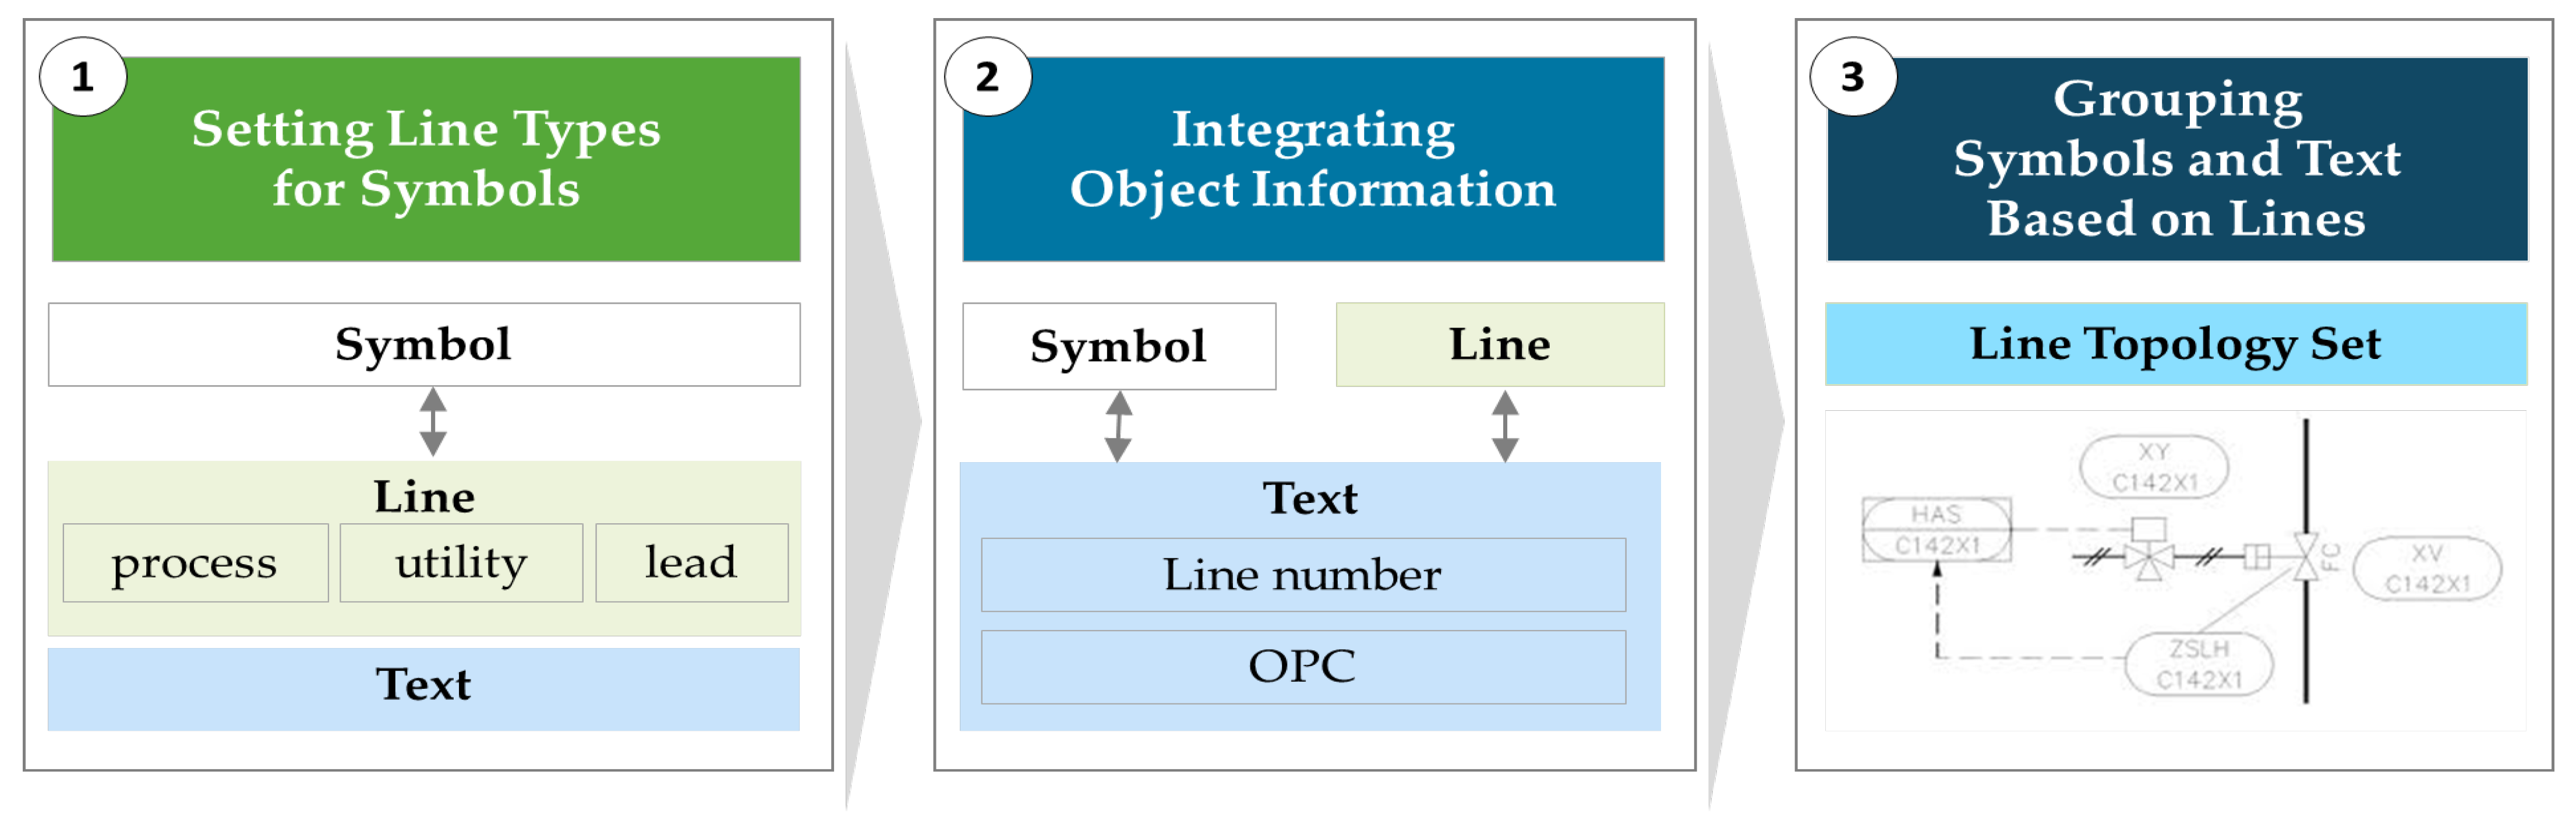
  • Process line: piping for processing or delivering fluid (liquid or gas) in a process, often used in production, chemical processing, and manufacturing.
  • Utility line: piping used for supporting auxiliary facilities of a plant or for maintenance, often carrying steam, coolant, and air.
  • Lead line: auxiliary line explaining equipment, instrumentation, or lines in a P&ID and not representing actual piping.
The sliding window technique was used for line extraction. This technique pertains to a technology wherein continuous pixel data, such as time-series data or images, are identified as a line once aggregating into a specifically sized cluster [80]. This technique was applied to recognize and extract the patterns of line forming on P&ID.
Finally, text is recognized and extracted from P&ID. Text extraction from drawings requires calculating the drawing’s aspect ratio (horizontal/vertical length) first to accurately identify the region where the text is positioned. This method is termed a character region awareness for text detection (CRAFT) algorithm [81]. Once an area is determined to contain text based on its aspect ratio, a boundary box is automatically generated around it for text extraction. Optical character recognition (OCR) technology is then applied to this extracted text region for final text recognition. Hence, Tesseract, an open-source OCR engine, is used. Tesseract supports a wide range of languages and fonts and delivers high-speed results regardless of image quality, text size, or font [82]. However, the recognition rate may be lower in P&IDs containing a complex mix of symbols, lines, and text when compared to general documents with only text. Therefore, after applying Tesseract to identify symbols or lines that have already been recognized, these elements are removed from the drawings to improve the recognition rate of other symbols and text. Furthermore, if the recognition rate is not 100%, Tesseract might recognize the datum as a similar image or fail to recognize it. In such cases, manual intervention is required, where a person directly matches the text in an image with the corresponding character.
Once extracted from P&ID, object data are processed through extraction and recognition algorithms before being stored in a system database. An administrator can manually add or modify these stored data. Figure 3 illustrates the process of extracting each object, attributing information from P&ID to it, and storing it through digital image processing.

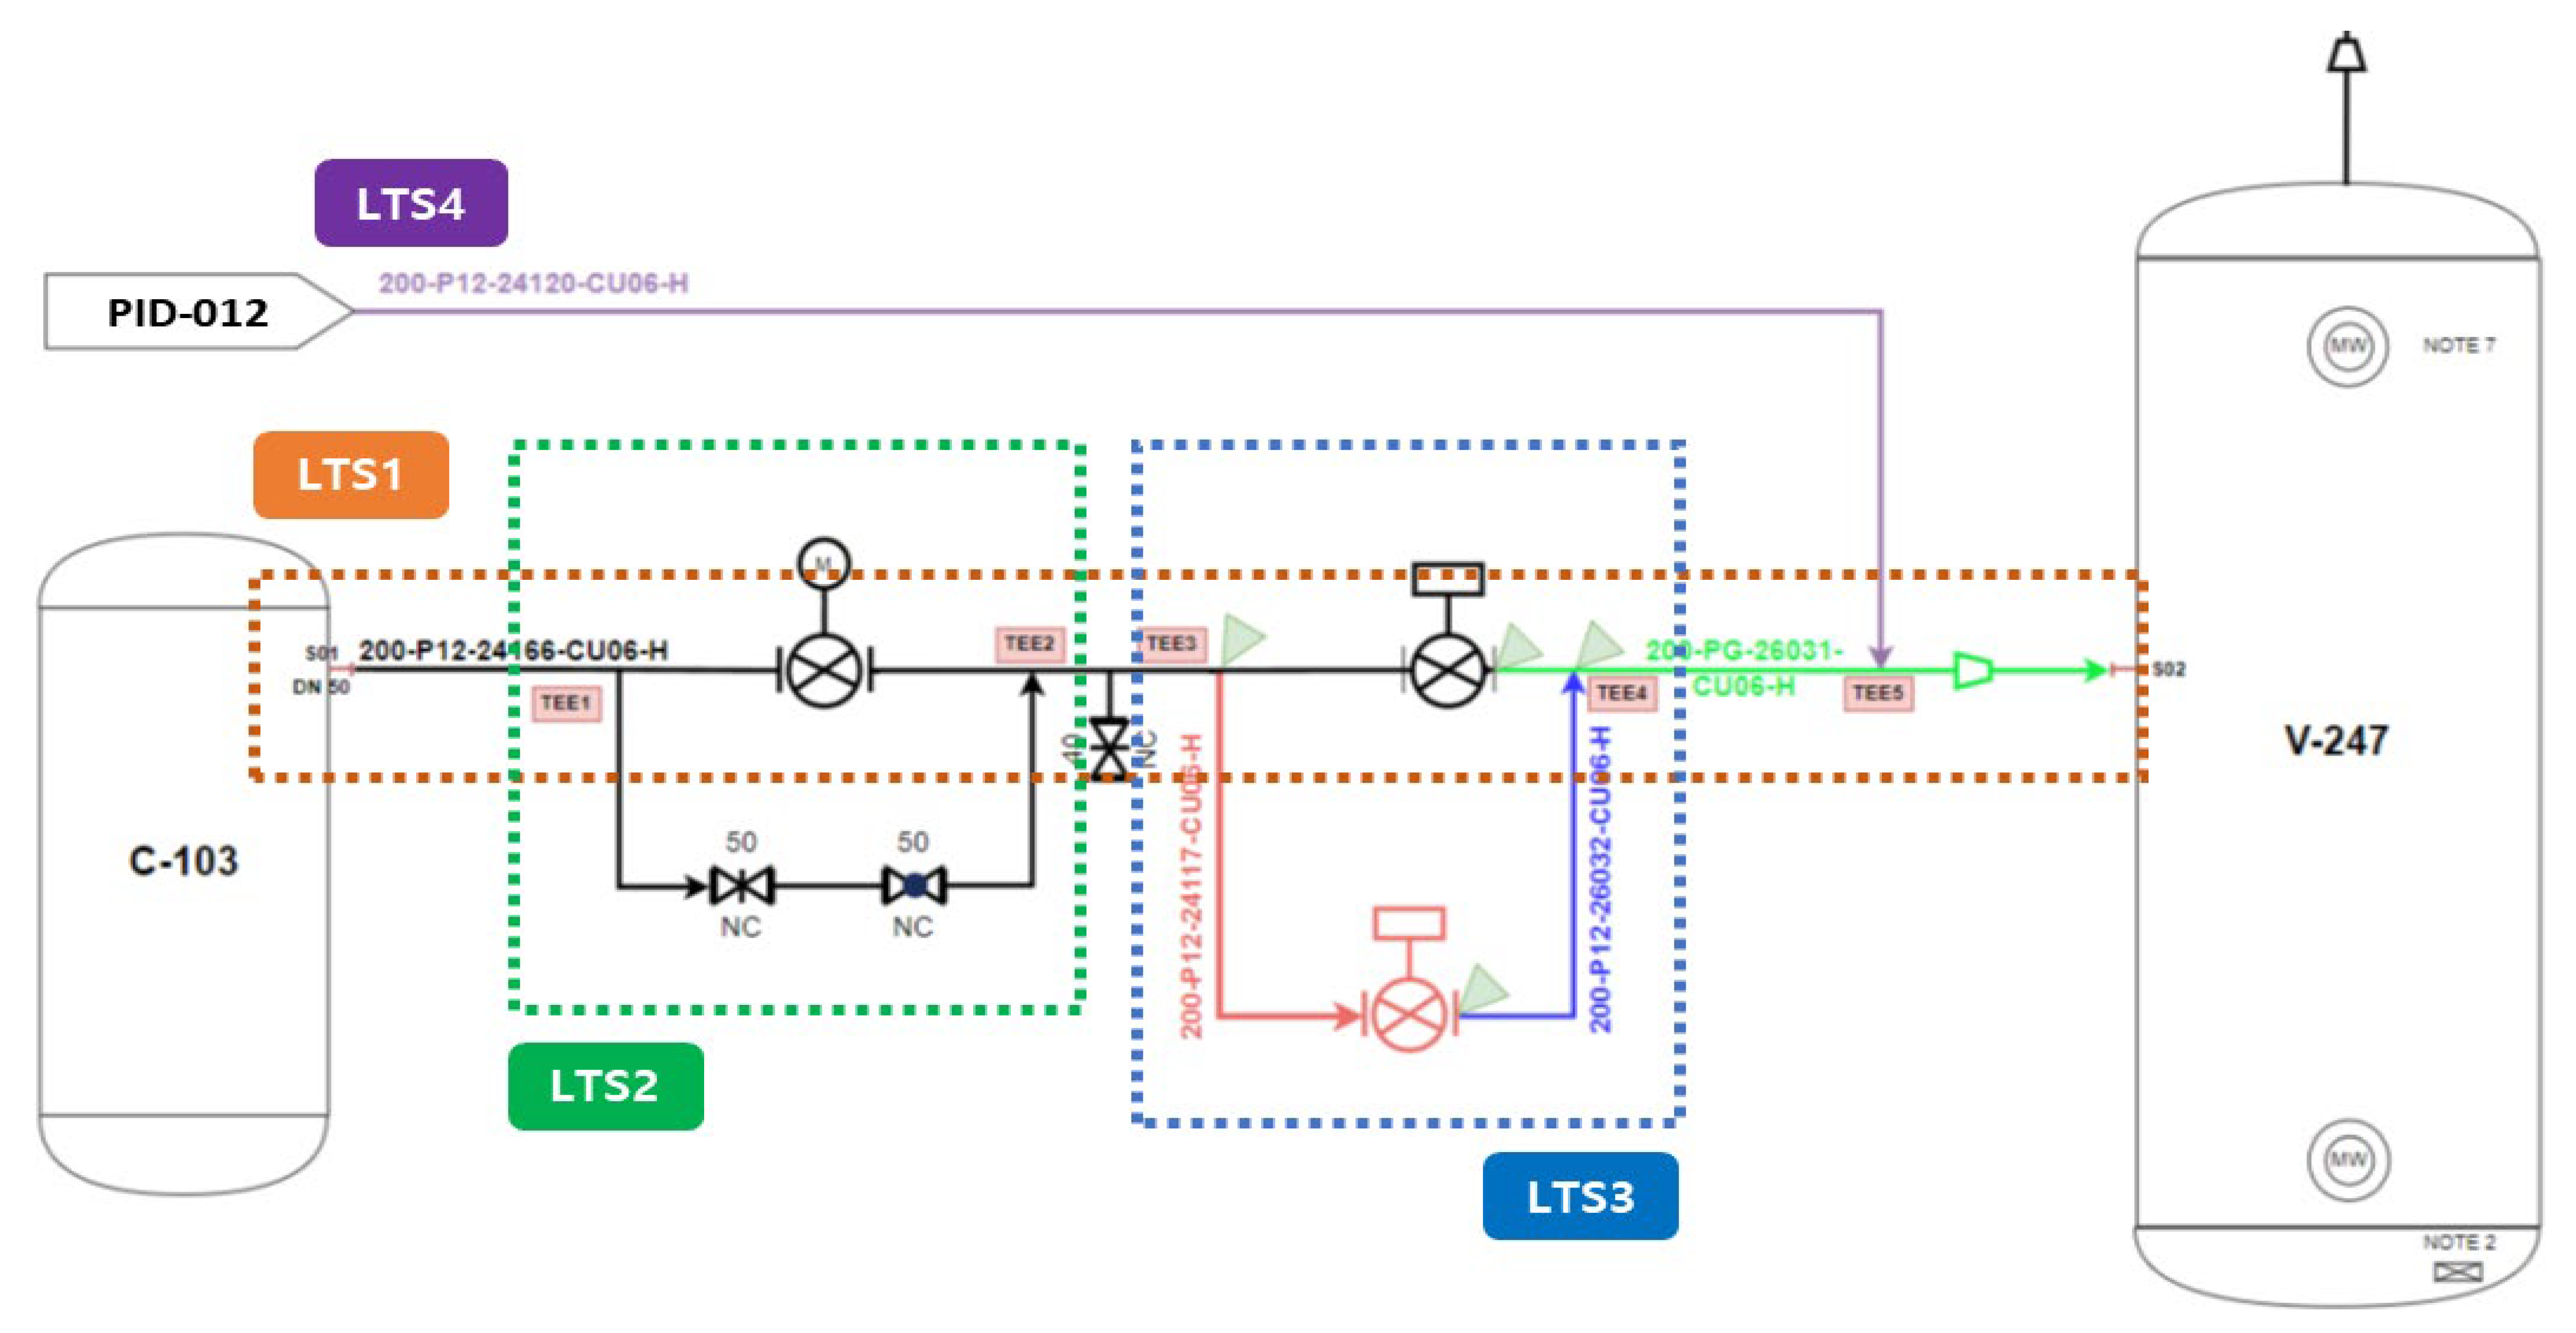
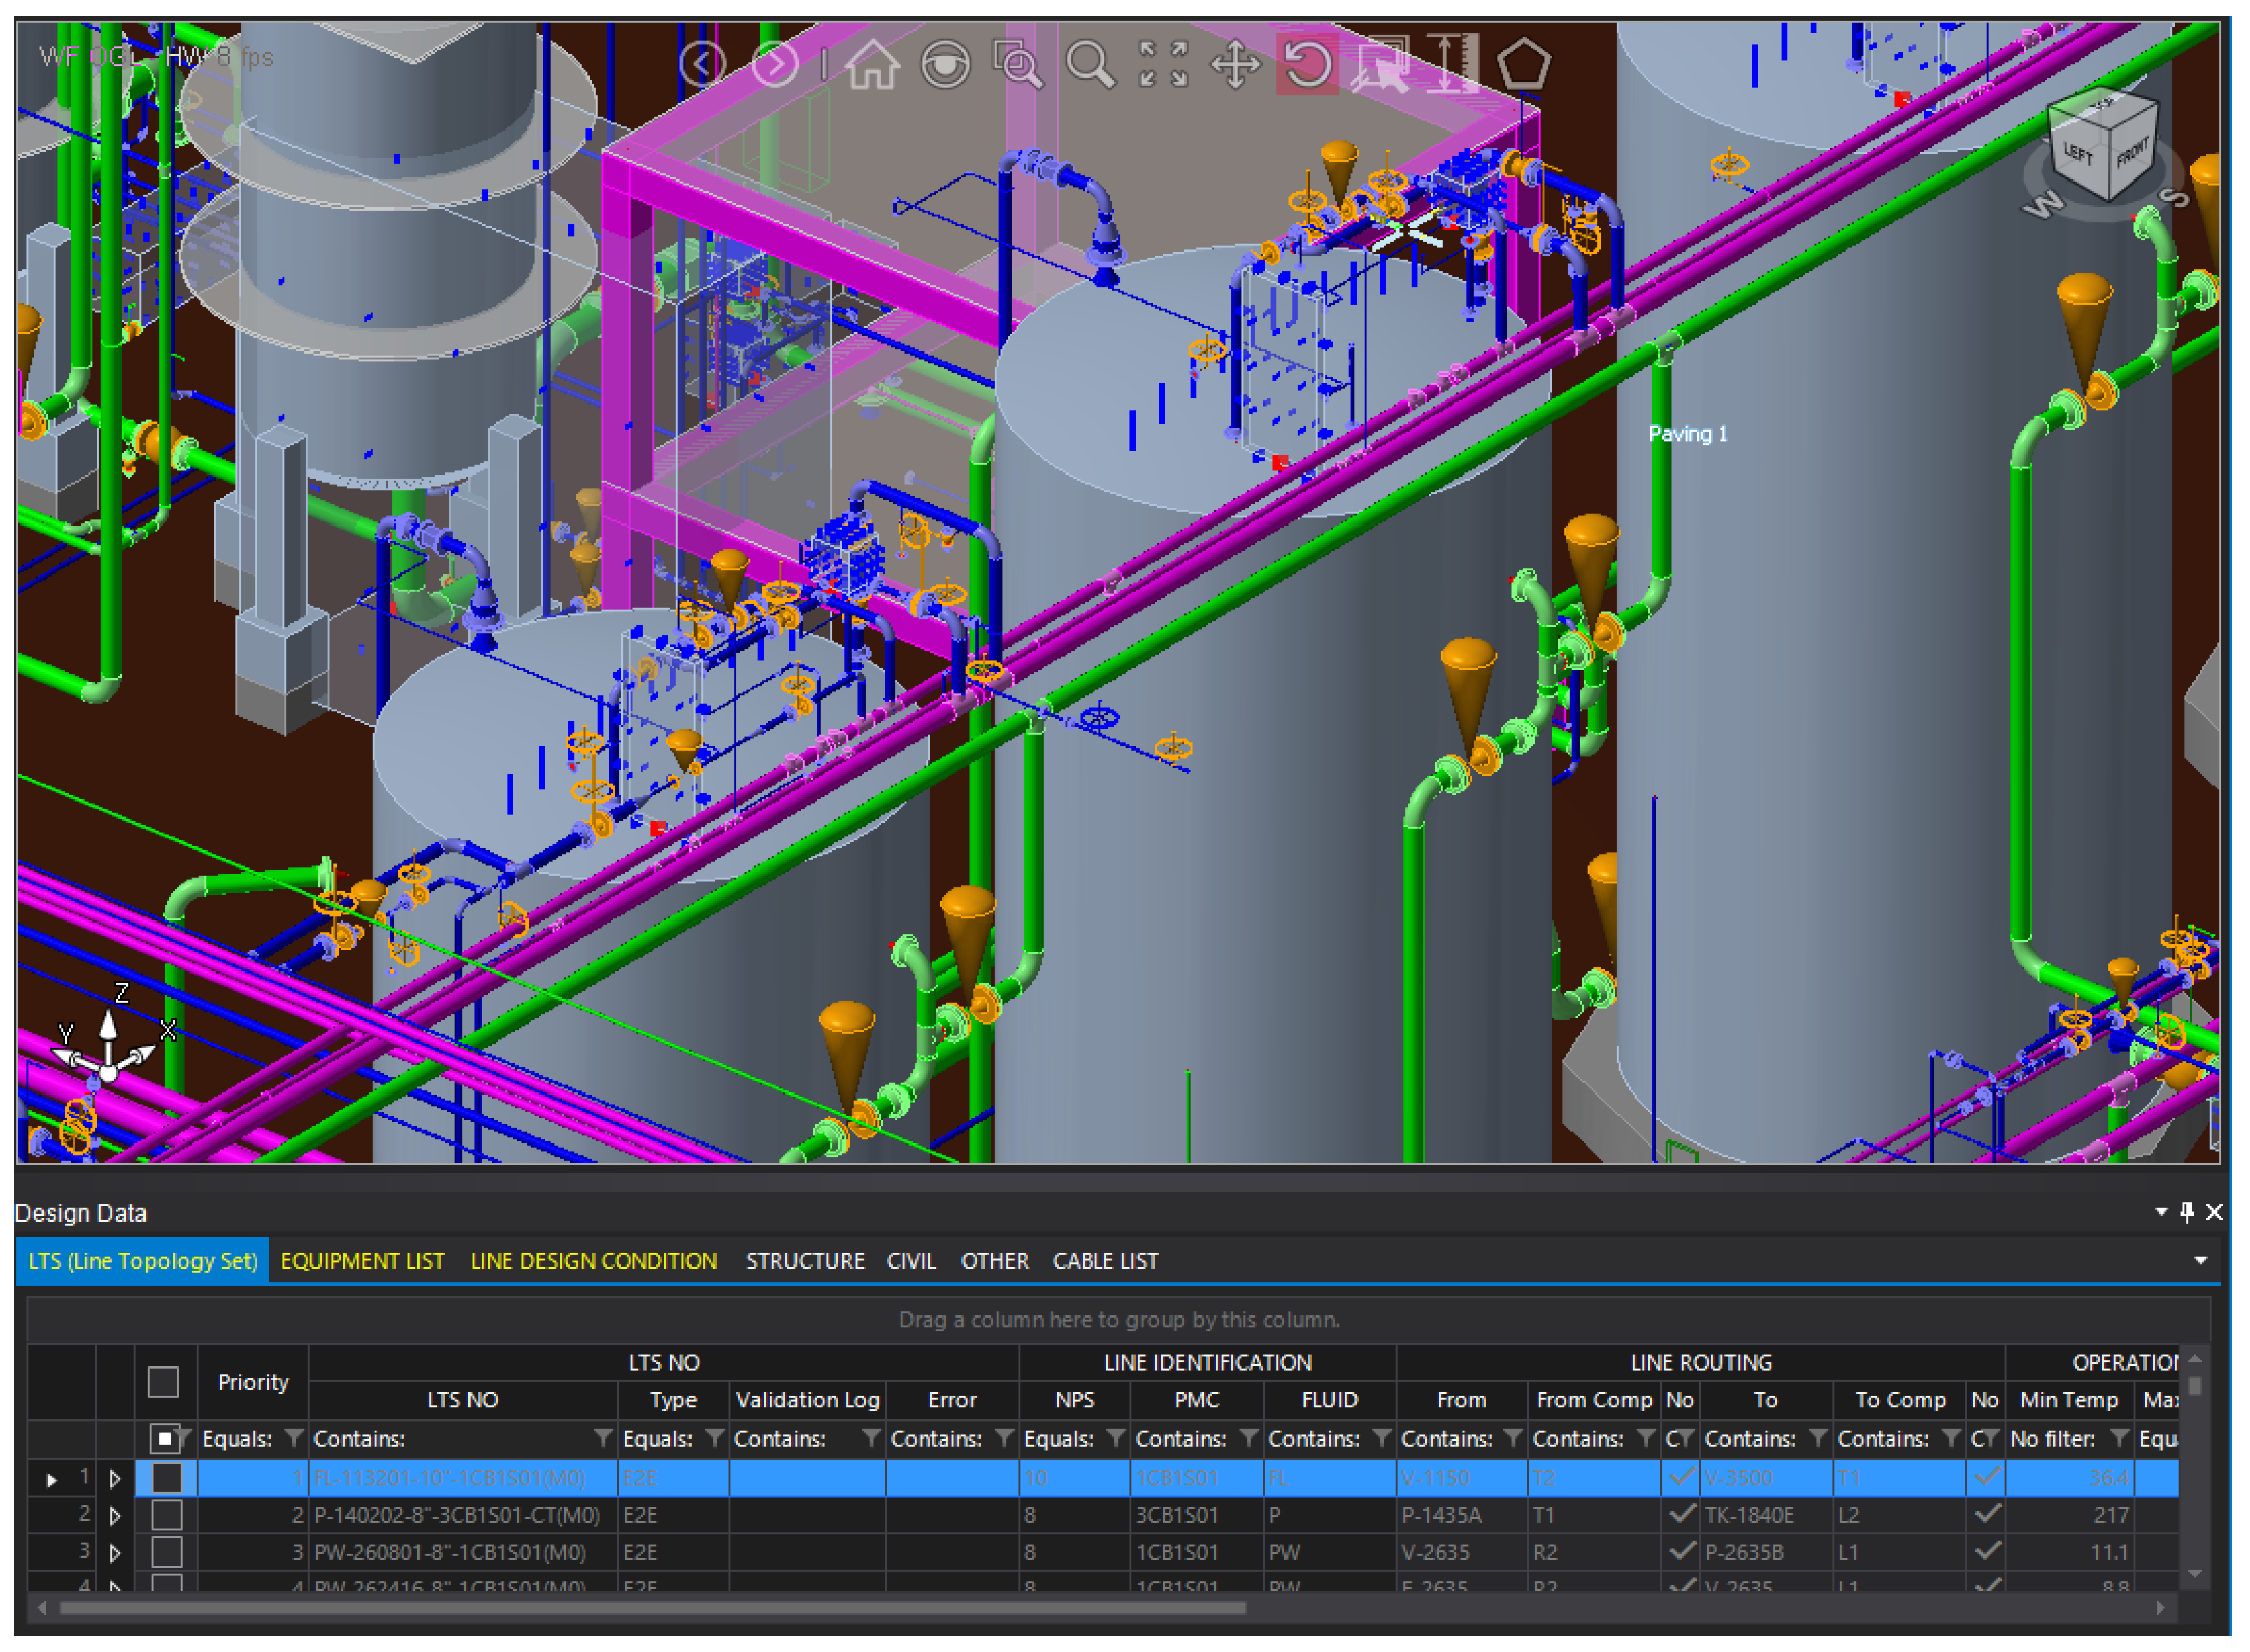
4.1.2. Line Topology Set

The outcomes of recognizing, extracting objects, and attributing information are consolidated into an LTS for facilitating auto-routing. LTS, comprising topology data that reflect line ‘from–to’ information, serves as the foundational unit for auto-routing [33]. The development process for LTS is outlined as follows.
First, the line type of symbols stored in the database is established. In a P&ID, symbols are interconnected by lines, and these symbols are classified based on line type and attributes. A connected symbol is identified to determine its line type when a line is recognized. By associating line information with recognized symbols, these symbols are then categorized according to their line type. Linking symbols with lines allows for the advanced identification of the number of other devices or instruments connected to the piping. This process also aids in preventing unnecessary or incorrect line connections with symbols by pre-defining the connection information.
Second, a distance-based algorithm is applied to connect the text information be-tween a line and symbol to configure integrated design information. A line number is a unique identification number of a line, which is text information consisting of a code or number [83]. After calculating the distance between the line and line number in a P&ID, the closest objects were connected to each other. A tag number is a unique identification number of a device or facility component [84]. Similar to the object integration of a line and line number, a symbol and the closest tag number were identified to be matched.
Third, information on symbols and text connected to each line is extracted and grouped by line to configure line topology. Furthermore, a connection state recognition algorithm was utilized to check whether each line and symbol were adequately connected. Furthermore, when lines are drawn across multiple drawings, an off-page connector (OPC) is used to connect the text with the respective drawing. The OPC refers to symbols used for connecting different drawings in a P&ID [85]. Symbols linked in relation to a line are sequentially organized to construct one final LTS. Figure 4 shows how objects and attributes are configured as LTSs.
The data items constituting an LTS in the ARS include LTS number, line number, line size, from-to information, and P&ID number. LTS1, or LTS number, denotes LTS connecting a vessel with the tag number C-103 and V-247 (Figure 5). LTS2 is a bypass line of the main line for controlling the fluid flow in specific situations. Given that LTS2 is branch piping connected to the main piping, their numbering system is identical (Table 2). The bypass line does not always have the exact specifications as the main piping, and its specifications may vary depending on the piping design. Unlike a bypass line, LTS3 has an independent control system. It is distinguished from a bypass line, which uses the same line number as the main piping and is marked with “BP”, and LTS3 uses an entirely different line number as a branch line, which is still connected to the main piping but requires independent control. LTS4 refers to a branch line connected to the main line that continues onto other drawings. Certain lines use the OPC because they are drawn independently, reflecting variations in the significance of the process or extending to other drawings when not all information can be included. Figure 5 shows a part of the process design to facilitate the understanding of LTS data items.
In ‘C-103′ of LTS1, ‘C’ denotes a container, and the number indicates the respective equipment number. Furthermore, ‘V’ in ‘V-247′ denotes a vessel. This P&ID is on the 13th drawing and is marked as PID-013. Table 2 presents the information of LTS attribute data shown in the ARS saved in the database.
LTS is a system that tracks piping paths based on P&ID data recognized by ID2, and accurate LTS cannot be generated without accurate P&ID information [32]. If the recognition rate of ID2 is 100% accurate, it enables the automation of LTS generation, and the reliability of LTS generation can be promising. Currently, the recognition accuracy of ID2 for P&ID data is not 100% due to errors occurring in the image processing process [32]. Currently, human correction is required to reduce the errors of ID2. Various studies are being conducted to improve the accuracy of ID2, and it is expected that the accuracy of ID2 can be improved close to 100% through the development of ID2 algorithms using deep learning technology, improvements in image preprocessing technology, and research on human–computer interaction methods in the future.

4.2. Three-Dimensional Model Layout for Plant Facility

The 3D modeling phase in the piping design process represents a crucial milestone. Traditionally, piping design has been performed using 2D drawings and design tools. Furthermore, 2D AutoCAD and other CAD software have been used to generate drawings of piping and facilities [86]. However, improvements in computing capabilities and 3D modeling software have given rise to the technological trend of employing 3D modeling tools since the 2000s. The 3D modeling of piping design involves visually representing piping information found in P&ID, structure and equipment specifications, as well as plot plans. This ensures that users can easily interpret the information at a glance [87]. Three-dimensional modeling significantly enhances the ease of understanding designs and structures in a visual format. Realistic three-dimensional visualization is particularly effective in accurately identifying the relationships between spaces and objects. This study incorporates process and facility plant information data into the ARS in a three-dimensional format. These data encompass equipment, structures, electrical and instrumentation components, and buildings. Users have the capability to input plant information directly into the system as digital documents. Once stored in the database, this information is organized within the system’s virtual space and presented on a screen in a three-dimensional format for visual clarity. Figure 6 demonstrates the process of creating a 3D model layout for the plant information discussed in this section.

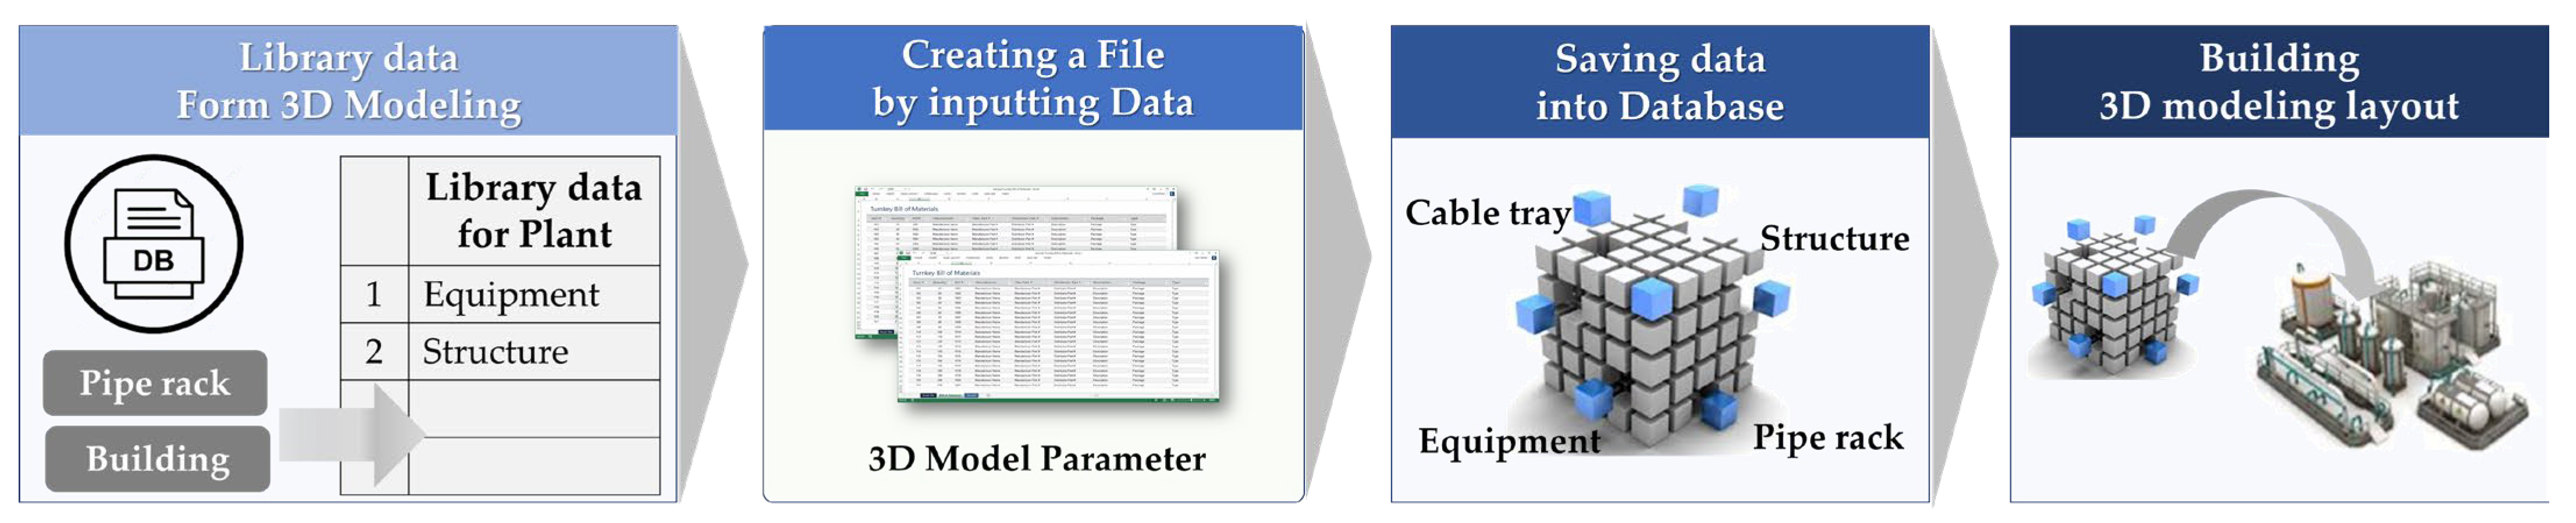
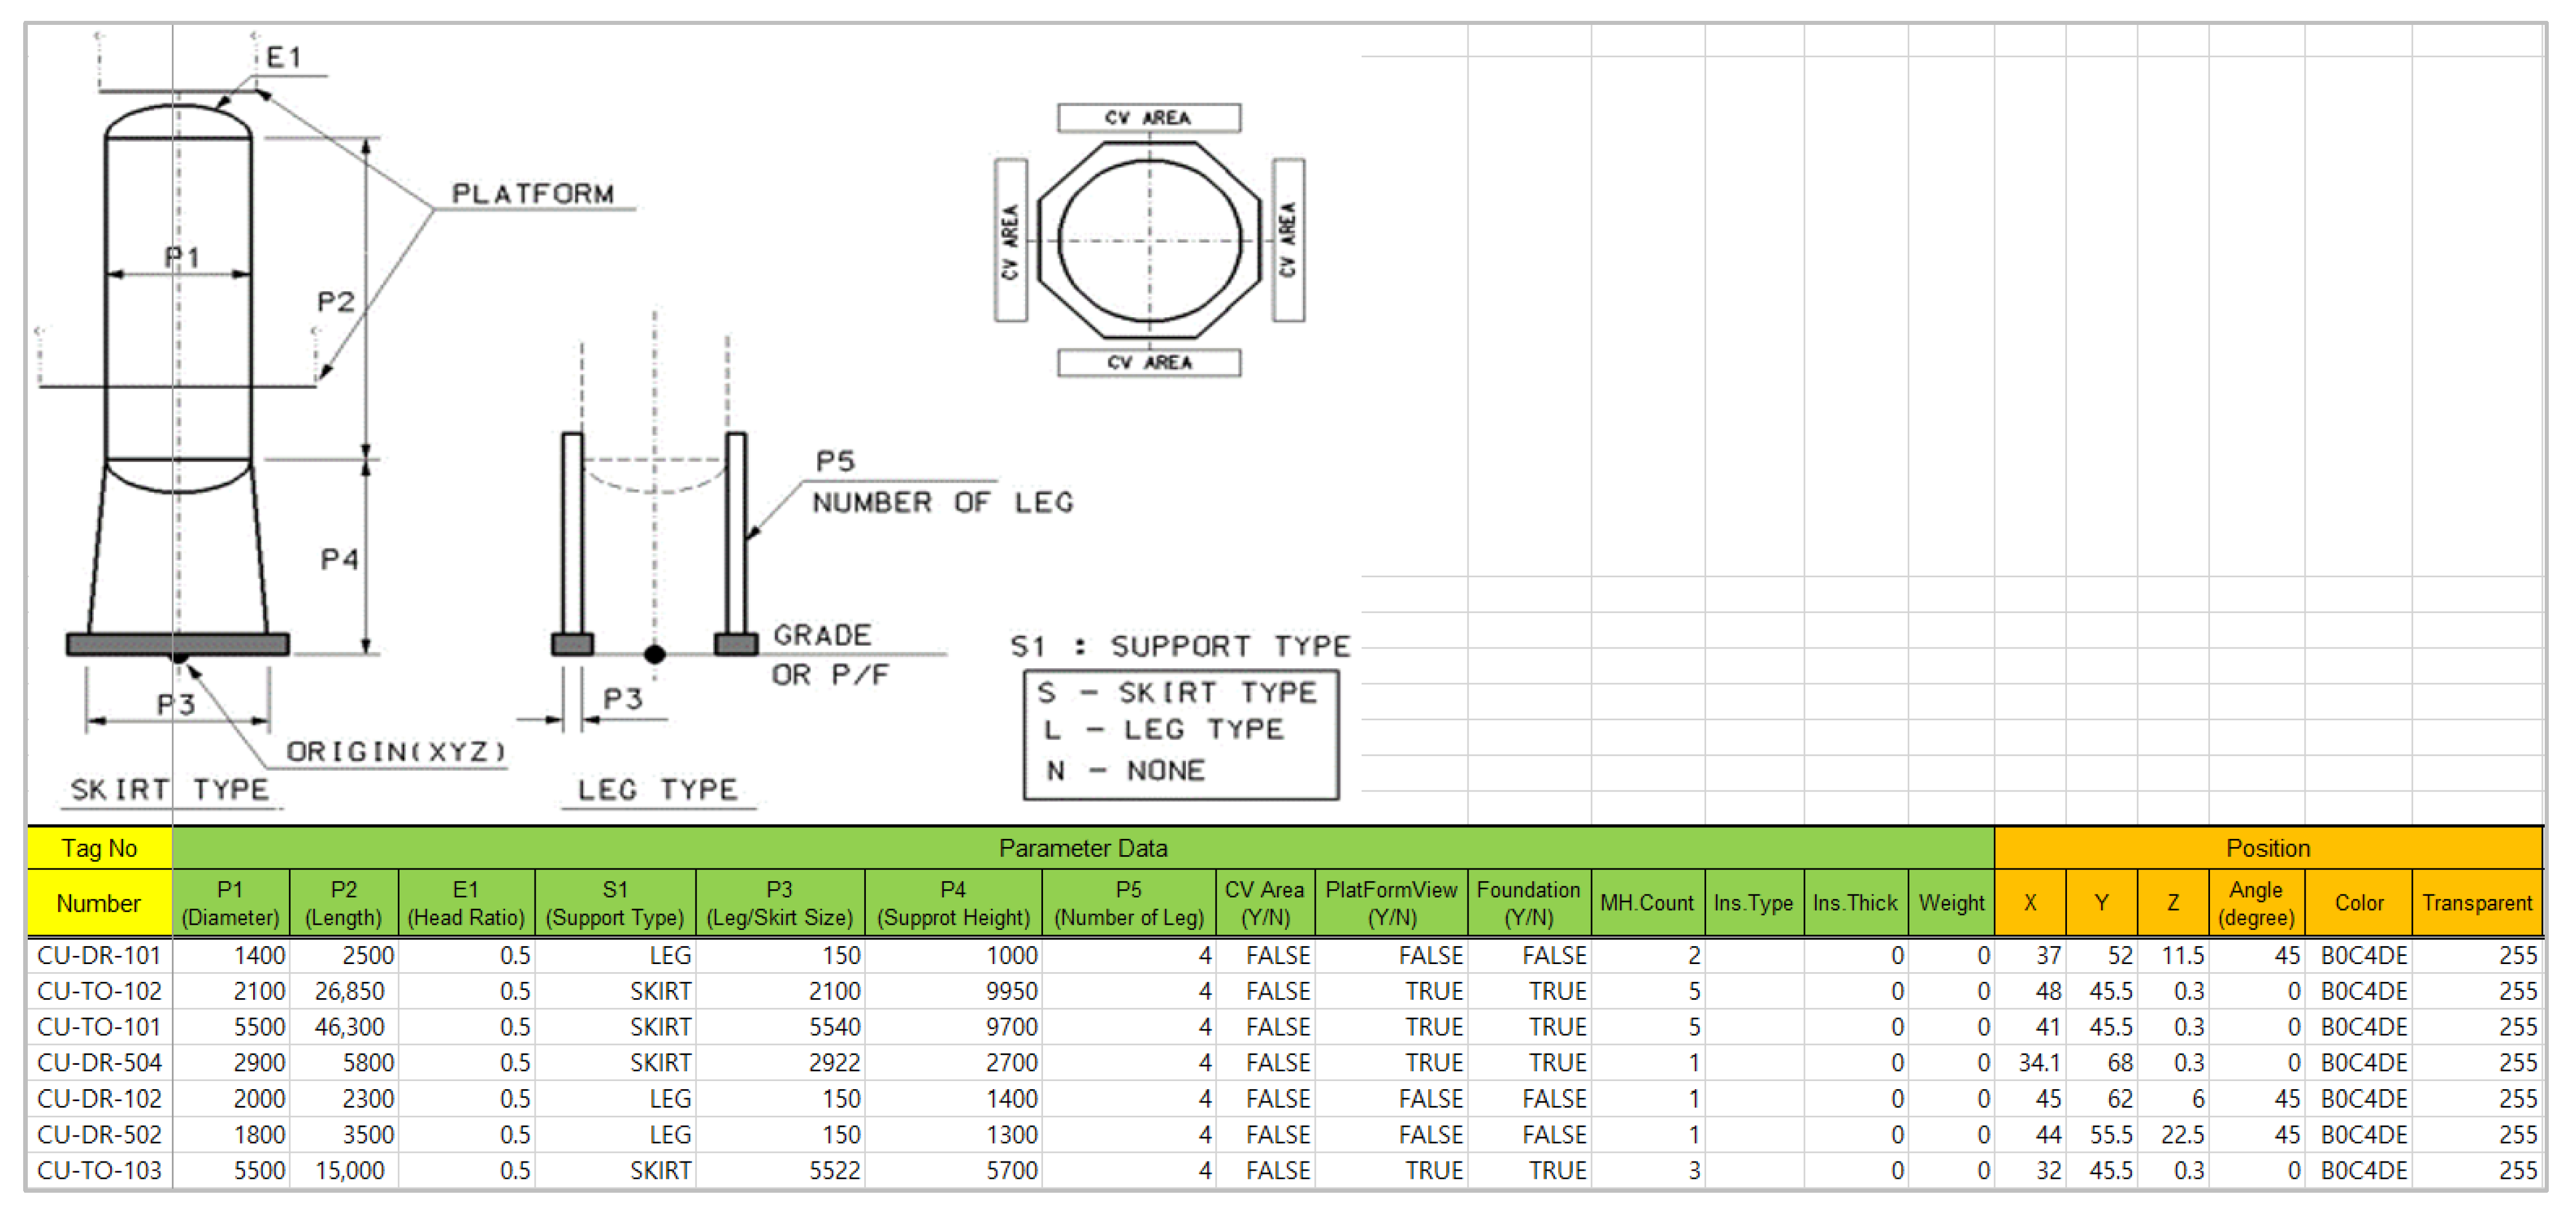
4.2.1. Library Data for 3D Modeling

Library data typically include reusable design elements, templates, symbols, and parts [88]. These types of data aid designers in easily finding and integrating elements that are used repeatedly. The ARS stores commonly used plant information in chemical plants, such as area, building, civil, equipment, structure, pipe rack, and cable tray, as library data in a database.
The plant information, as described above, was first converted into a digital rule for digital encoding. The digital rule is composed of an 11-digit digital code system (code of account) that machines can recognize, designed for 3D modeling [89]. This developed digital rule is stored as a rule in the ARS’s library and displayed as a 3D model.
The ARS pre-acquired a dataset containing plant information of a chemical plant and registered it within the system. This enables users to conduct 3D modeling in the ARS using these pre-registered data. At the commencement of a new project, a P&ID and plot plan, created by the process design team, are handed over to the piping design team. The plant information from the P&ID and plot plan is then extracted and stored in a library database. The incomplete registration of datasets can lead to errors during the execution of a project. To mitigate such errors in the ARS, files created outside the system can be imported as datasets on an ad hoc basis. These imported files are automatically saved and managed in the library database, making them available for use in future projects. The library database plays a crucial role in efficiently managing facility and equipment information, thereby streamlining work processes and enhancing accuracy. This functionality is a key contributor to the effectiveness of 3D modeling tasks.
During 3D modeling, the initial step involves configuring the plant layout, followed by the arrangement of piping to match the layout. A 3D modeling layout should be easily adjustable at any point, accommodating change order as required. Given that an engineer should update drawings based on revision data, the system allows users to make revisions directly when necessary.

4.2.2. Data Creation and Integration for 3D Modeling

The design of a chemical plant project often undergoes changes based on its primary objective and type. Factors such as the project’s nature, the size and capacity of equipment and structures, location and environmental conditions, materials, technical level, and budget are key determinants of plant information. Although the plot plan and P&ID are used as sources of data for the 3D model layout, they may not wholly reflect the complexities of a systematic plant project. The system developed in this study allows for the seamless importation of files written externally, enabling the easy addition and management of data for the 3D model layout. Microsoft Excel is employed as the tool for importing data into the system.
When a user enters facility specification information into Excel, 3D modeling layout data can be easily added accordingly. Furthermore, necessary changes required for facility data can be applied. Figure 7 shows an Excel sheet containing facility drawings and related specifications of plant information.
Detailed specification information of each facility is required for entering facility data into the system. The input data are organized into categories: tag number, parameter, position, and work breakdown structure (WBS). A tag number acts as a unique identification code assigned to each facility, ensuring there is no duplication. The use of facility abbreviations combined with numbers facilitates quick identification. It is crucial that the facility list registered in the system is organized to avoid overlapping with other tag numbers. The parameter category encompasses the detailed specifications of a facility, including its diameter, height, ratio, and support type, as well as the type and weight of equipment installed in the facility. Position details the arrangement, tilt, color, and transparency of the facility within its allocated space. By linking facilities with the WBS used in project management, the importance and role of each facility can be clearly defined within the project’s comprehensive hierarchical framework. Table 3 in the document displays the specifications of facility data stored in the database for 3D modeling.
The plant information inputted into ARS is stored in the library of ARS in a rule-based format and then displayed through 3D modeling. Piping design is typically designed using 3D modeling SW, and ARS is also a 3D model-based platform.
In general, 3D modeling is commonly conducted to verify piping routing results. In this study, to reduce costs associated with frequent 3D modeling and software updates, and to decrease dependence on commercial software, we developed our own 3D modeling software for ARS development, named ARS 3D Modeling. ARS 3D Modeling is developed based on the functionality of Eyeshot, which visualizes routing results in 3D [90]. This self-developed ARS 3D Modeling software is embedded into the ARS platform.

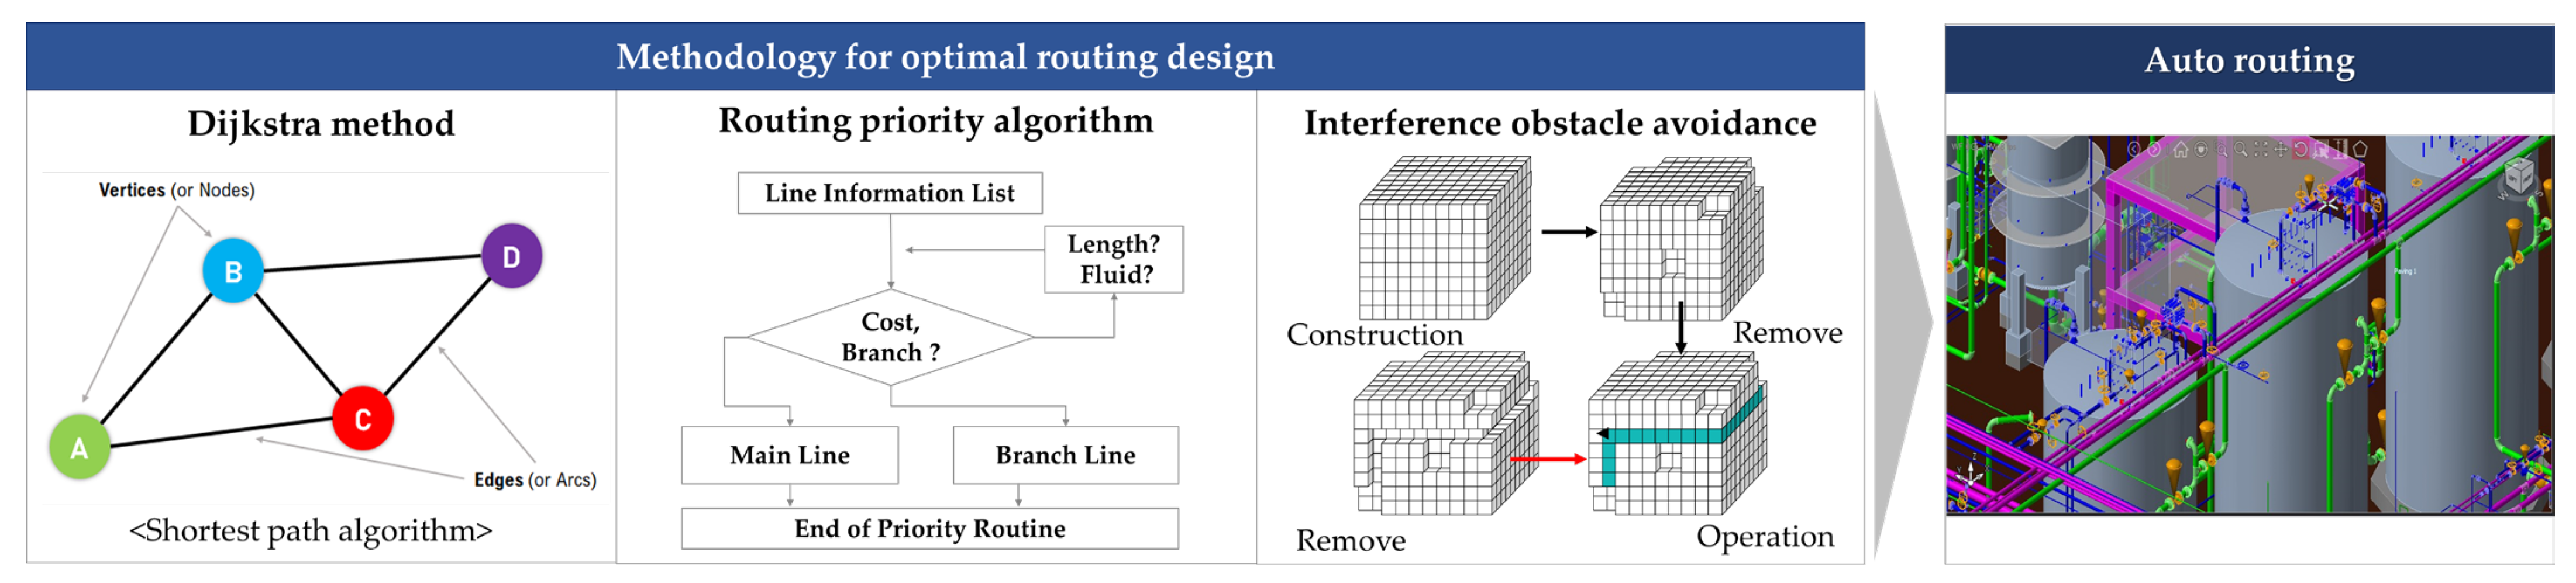
4.3. Piping Design Algorithms for Optimal Route Automation

Conventionally, piping design is manually performed by considering appropriate positions and making an immediate reference to obstacles [91]. However, its effectiveness is compromised as it fails to consider the factors influencing piping routes. The design of piping routes is a complex and time-consuming process within the design field [92].
In this study, the proposed ARS was developed by applying various algorithms for piping route design, including the Dijkstra method, routing priority logic, and interference obstacle avoidance. Firstly, the Dijkstra algorithm was employed to find the shortest path between two points. Next, the routing priority algorithm was applied to achieve efficient placement of piping routes. Finally, the interference obstacle avoidance algorithm was utilized to prevent interference between pipes. Figure 8 visually illustrates the application process of the algorithms utilized for optimizing piping routes in this study.

4.3.1. Dijkstra Algorithm

The Dijkstra algorithm is an algorithm that finds the shortest path between two points using dynamic programming [93]. The Dijkstra algorithm, a heuristic approach used for path planning, is widely employed to calculate optimal piping routes by utilizing real-time data that include obstacle information. While it offers advantages such as fast computation speed and ease of implementation, its obstacle avoidance capabilities are somewhat limited. Moreover, the Dijkstra algorithm cannot be used if there are negative weights within the graph.
The basic operation of the Dijkstra algorithm proceeds as follows:
  • Initialization: a starting node is designated and the distance of the starting node is set to 0; groups are then formed with other nodes leading toward the destination.
  • Iteration: an unvisited node with the lowest weight is selected and moved from the starting node. The algorithm calculates the shortest distance for neighboring nodes of the currently selected node based on the weight factor and then chooses the closest node to be moved. The selected node is marked as visited.
  • Termination: if the current node is identical to the target node, then the process is terminated; otherwise, steps 3 and 4 are repeated.
Here, “node” is one of the fundamental elements of graph theory, representing locations or points within the graph. In this study’s P&ID, it refers to the tag numbers of structures and equipment.
Based on this principle, the Dijkstra algorithm can be computed. Several predefinitions are necessary before the computation using the Dijkstra algorithm
  • where k represents the iteration number.
  • Lk(a,v) is the length of the shortest path from node a to node v after k iterations.
  • Lk−1(a,v) is the length of the shortest path from node a to node v after k−1 iterations.
  • Lk−1(a,u) is the length of the shortest path from node a to node u after k−1 iterations, where u is a neighbor of node v.
  • w({u,v}) is the weight of the edge between nodes u and v.
Equation (1) represents the formula of the Dijkstra algorithm for calculating the shortest path from node a to node v in a graph [94].
L k ( a , v ) =   l e n g t h min [ L k 1 ( a , v ) , L k 1 ( a , u ) + w ( { w , v } ) ]
The minimum function min is utilized to select the path from vertex a to vertex v. This path chooses the shortest path between going through v (i.e., Lk−1(a,v)) and going through u, incorporating the weight of the edge between u and v (i.e., Lk−1(a,u) + w({u,v})). The Dijkstra algorithm progresses through initialization, iteration, and termination steps, repeating until the shortest path is investigated, and then it concludes.
Following this mathematical modeling, the Dijkstra algorithm was digitally implemented. This study employed the C# programming language, and the coding for the Dijkstra algorithm is as follows (Algorithm 1).
Algorithm 1. Dijkstra.
Path Dijkstra(Node[] G, Node From, Node To)
{
        Path path = new Path();
        foreach(var node in G)
        {
                if(node in Obstacle) node.Walkable = False
        }
        var node = From;
        path.Add(From);
        while(node! = To)
        {
                Node next = null;
                double cost = 0;
                var adjacents = AdjacentNodes(G, node);
                foreach(var adjacent in adjacents)
                {
                       if(adjacent.Walkable == False) contine;
                       cost = CostFunc(node, adjacent);
                       if(cost > adjacent.Cost) continue;
                       next = adjacent;
                }
                if(next! = null)
                {
                       node = next;
                       node.Cost = cost;
                       path.Add(node);
                }
        }
        return path;
}
In piping route design, it is crucial to consider the physical characteristics and constraints of the pipes. Industrial piping design, in particular, may involve irregular layouts, various pipe diameters, and dynamic changes in the pipe network (such as adding or removing pipes, adjusting flow rates, and accommodating new constraints), along with complex site structures and various obstacles. The Dijkstra algorithm may not be suitable for such scenarios.
To optimize piping routes and avoid obstacles in industrial settings, various algorithms can be applied, not limited to just the Dijkstra algorithm. These diverse methods have been developed considering the conditions and requirements of the site. For instance, the A* algorithm is an enhanced algorithm derived from Dijkstra’s algorithm, utilizing heuristic functions to shorten the time required to find the optimal path [64]. The A* algorithm excels in obstacle avoidance capabilities but is slower in computation speed and more complex to implement than the Dijkstra algorithm. By combining the Dijkstra and A* algorithms, it is possible to satisfy both computation speed and obstacle avoidance capabilities. Additionally, algorithms such as genetic algorithms and reinforcement learning can be applied. In industrial piping design, combining various algorithms and methods rather than relying solely on the Dijkstra algorithm to find the most optimal solutions is common. The selection of algorithms can be based on the conditions and requirements of the site, including factors such as obstacle size, shape, location, shortest path, minimum cost, minimum time, data volume, speed, and so on.

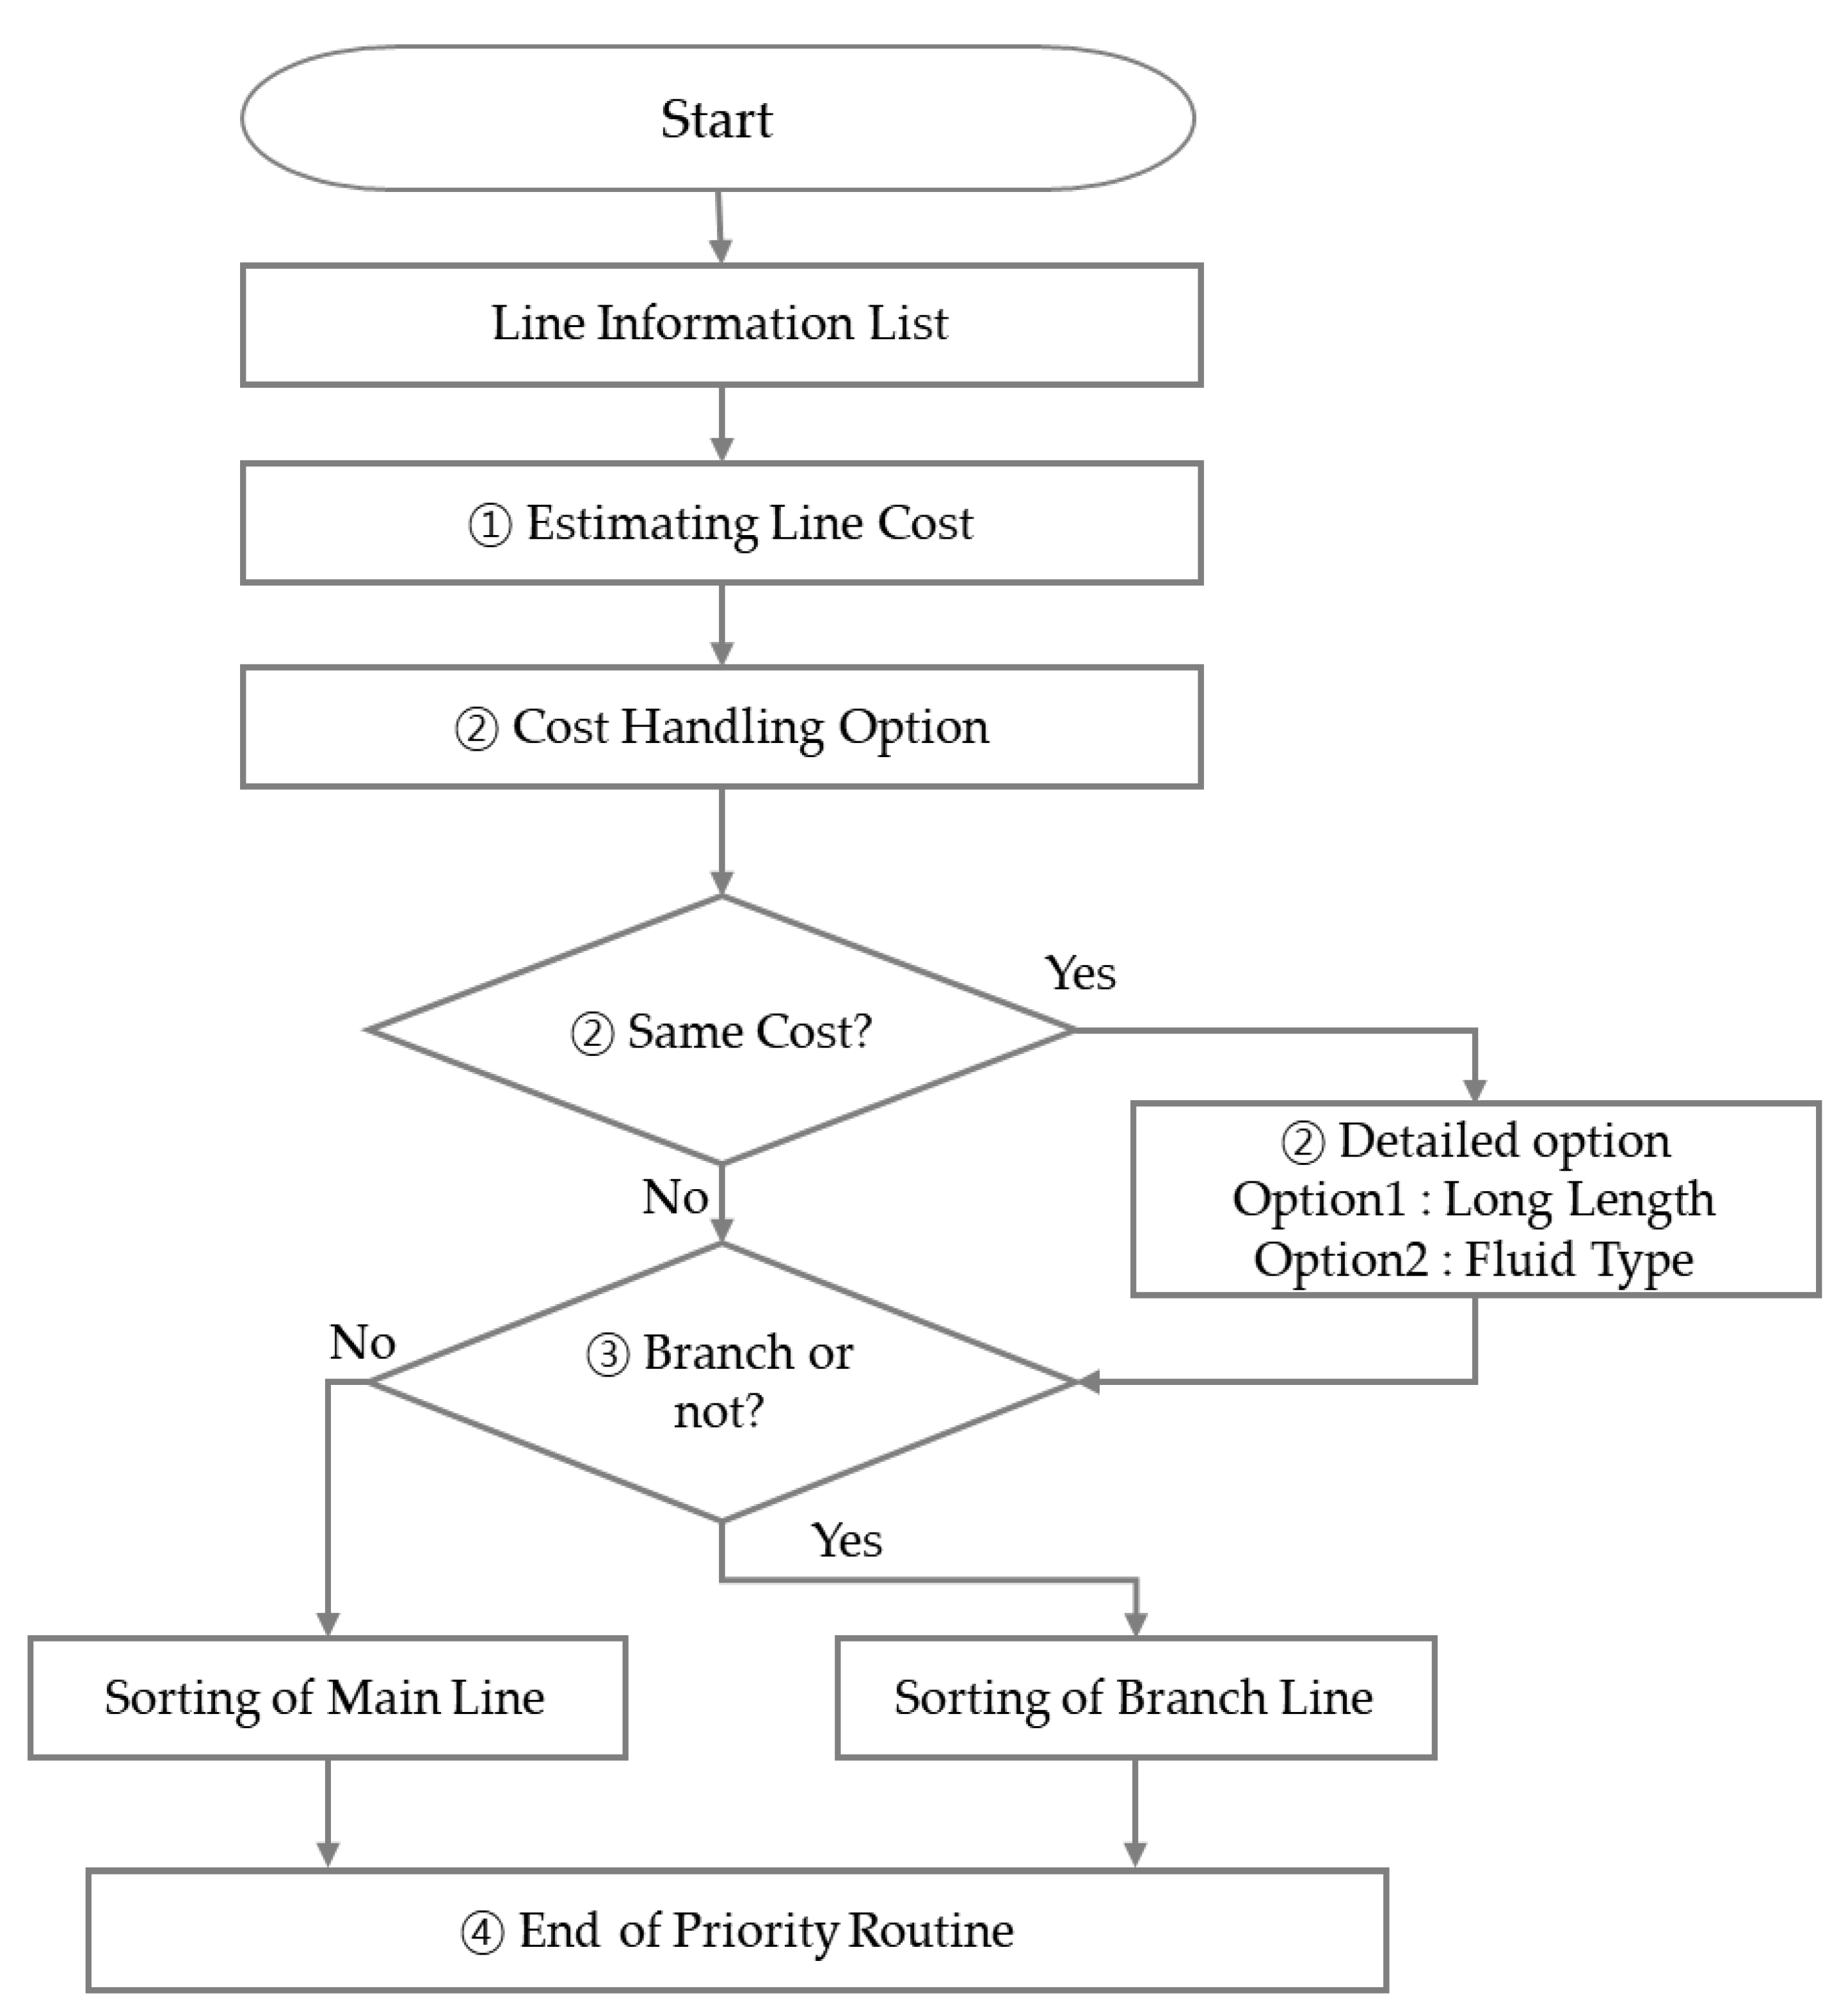
4.3.2. Routing Priority Algorithm

In the process of piping design, it is necessary to determine the priority of piping routes. Setting the routing priority of the piping system is a strategic design decision for effectively controlling and optimizing fluid supply. Given that it is difficult to comprehensively evaluate the significance of piping solely based on the shortest distance, it is essential to establish routing priority to differentiate design importance and mitigate potential errors. Piping design usually assigns higher importance to lines, incurring more significant costs. Therefore, those lines must be prioritized during routing, and priority should be arranged in the system by setting additional priority options besides expenses. The prioritization of the most critical lines should consider efficiency and economic feasibility.
The routing priority algorithm in the ARM proceeded as follows.
Line information from the line list in the database is imported. The imported information includes weight, material, size, and specification data which are used to calculate the line cost. Equation (2) is used for calculating the line cost.
Cost = pipe weight × material ratio
If the line cost value is identical, then alternative options can be specified to establish routing priority. Detailed priority is assigned based on piping length and fluid information. Generally, longer piping segments incur higher costs and possess greater importance. Furthermore, priority can be determined by the fluid type. A fluid process is given higher priority owing to its greater importance, whereas a utility process is assigned lower priority.
A pipeline is categorized into a main line and a branch line based on its function. The main line serves as the conduit for the fluid in the piping system and typically constitutes a core element in piping design. The branch line refers to the part connected to a specific point branching off from the main line. As small segments branching off from the main line, they provide fluid or utility required for specific regions or equipment. Hence, the main line is positioned first, with the branch lines following suit. Even if the branch line has a high cost, its priority is established after the main line is arranged. If the main line is arranged in a specific area, the branch line is set to be arranged after the main line by establishing the cost and options through the routing priority algorithm.
As the ARS features a routing priority editor, an individual can modify the priority of specific lines by configuring constraint options for priority.
Figure 9 shows the logic for routing priority during piping design.
Table 4, Table 5 and Table 6 present the data organized by line number in a particular piping process, with the data listed following the routing priority algorithm. Piping with higher costs, as determined by the piping cost calculation equation, is given priority according to routing priority logic. In Table 4, line information is sorted by cost priority.
If the cost is the same, then priority is determined based on line length and fluid type. Line numbers ‘U01-P-1025′ and ‘01-CWS-1024′ have the same cost. However, ‘U01-P-1025’ is assigned a higher priority due to its longer length and fluid type of ‘process’. In Table 5, priority is determined based on the piping length.
The main line and branch line can be discerned based on from–to equipment information. The main lines span from the first to the third line, while the subsequent lines constitute the branch lines. The main lines are organized with priority, and the remaining branch lines are arranged subsequent to the main lines. Furthermore, the branch lines are sorted based on cost and option. All costs and fluid types are identical; thus, priority is determined based on the line length. Additionally, in Table 6, the priority of the branch line is determined based on the piping length.

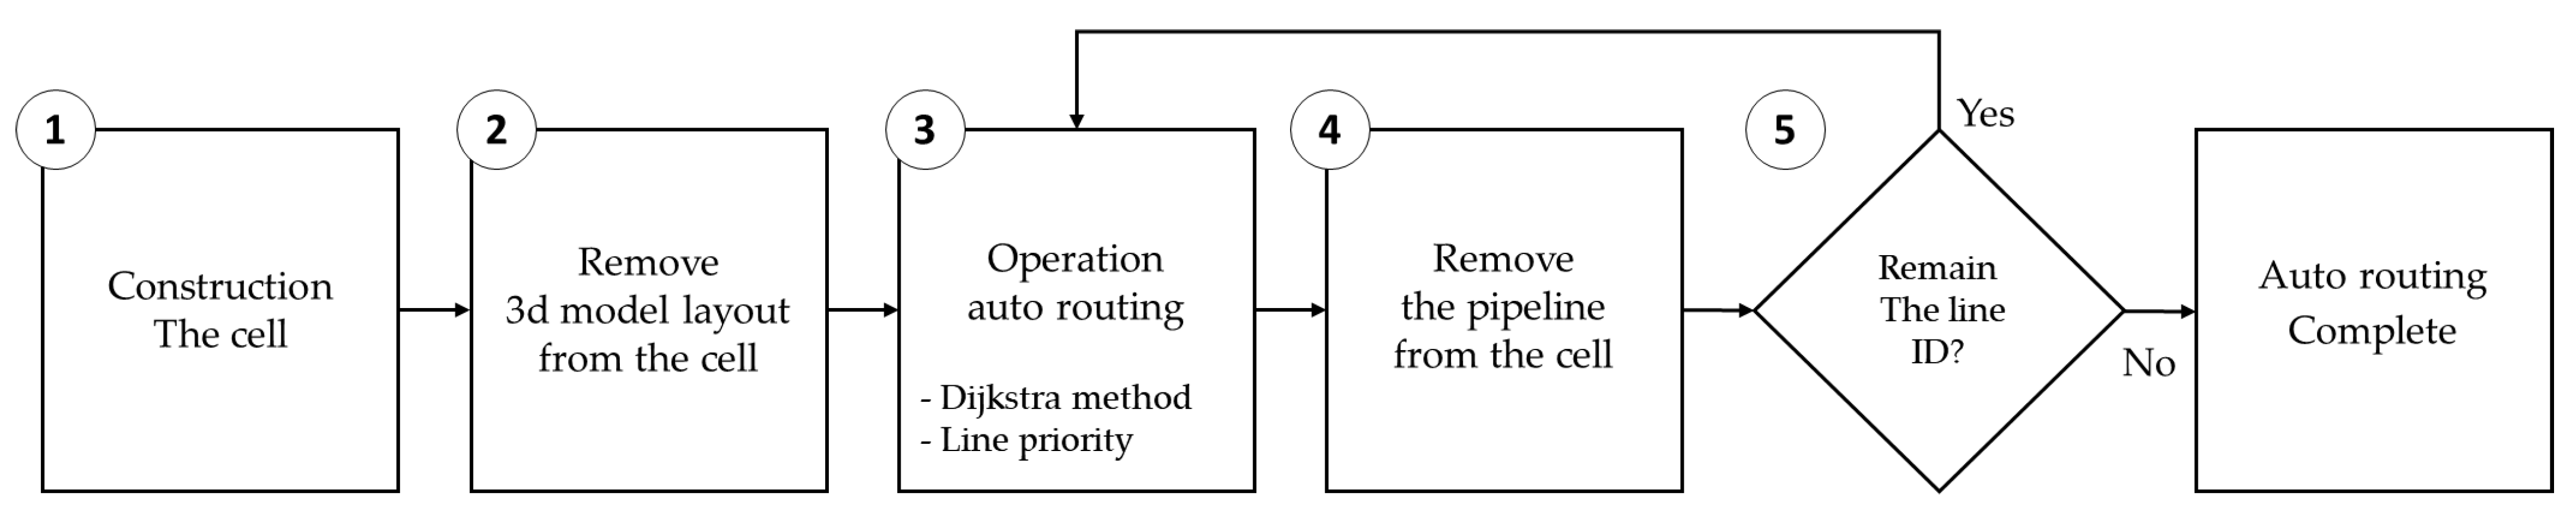
4.3.3. Interference Obstacle Avoidance

During the auto-routing process, if interference occurs between a facility and piping, then the system detects an error, leading to an interruption in the auto-routing process. Consequently, design delays may ensue, or manual corrections may be required to rectify the errors. This study incorporated an interference obstacle avoidance algorithm to mitigate interference occurrences in the optimal path, ensuring optimal design. The logical process of this algorithm is as follows.
Similar to the space factor in the Dijkstra algorithm, a virtual 3D space is first configured in cell-unit blocks.
A 3D model is generated using a plot plan, and the corresponding cells are removed.
An optimal path is set by applying the Dijkstra algorithm and the line priority algorithm, which are then applied to the corresponding cell blocks. As mentioned earlier, the space factor was applied to calculate the weight factor, which is a core element in the Dijkstra algorithm. The space factor for cells subjected to the optimal routing algorithm is designated as 0, while the space factor for neighboring cells is adjusted to vary the weight factor, effectively preventing interference.
The cells applied with the Dijkstra and line priority algorithms are removed.
The arranged LTS is iteratively implemented through the line priority algorithm and the Dijkstra algorithm is employed to determine the optimal path for cell blocks. Once applied, these cell blocks are subsequently eliminated. This process is repeated until the LTS is all consumed in the system.
Figure 10 shows the schematic diagram of an interference avoidance algorithm.

5. System Development

In this section, the system development environment of the proposed auto-routing model is explained in addition to the user interface (UI) and compatibility with external programs.

5.1. System Development Environment

The piping auto-routing model developed in this study is systematized. The programming language used for developing the ARS was C#, and the .NET Framework was used as an open-source program development tool [95,96]. The operating system is based on Windows 11 [97]. The CPU used for system development was equipped with the AMD Ryzen processor, which is capable of building a 3D environment. An advanced graphic card was also used because 3D modeling requires rendering and advanced graphic technology. The GeForce RTX™ 4060 by NVIDIA was used for the graphics card [98]. An Integrated Development Environment (IDE) is a library; this is a software application that aids the efficiency of developers in developing software codes [99]. Visual Studio was employed as an IDE owing to its advantage of supporting various programming languages and platforms in the Windows environment [100]. Eyeshot was used as a 3D engine for implementing 3D modeling. Eyeshot is a .NET-based 3D engine compatible with CAD [90]. The database of the ARS was constructed in the Windows environment using MSSQL 2016. The server infrastructure environment of ARS was configured as on-premise, which indicates that the service or software is operated and maintained internally within an organization [101]. The computer network of the ARS consists of a server–client architecture. The server–client architecture has a centralized data structure, requiring an administrator account for managing and revising data [102]. Table 7 presents the development environment of the ARS.

5.2. System Compatibility

System compatibility is defined as the ability of two or more systems to work together and utilize each other’s data or software [103].
In this study, the developed ARS was designed to be interoperable with another commercial 3D program, SP3D, utilizing the ARS’s 3D data. The methods for connecting different applications, such as commercial engineering design tools and the ARS system, are as follows. Firstly, data exchange and connectivity can be facilitated through an Application Programming Interface (API) or Software Development Kit (SDK) [104,105]. An API provides a gateway for accessing the functions or data of a specific program from another program. Commercial 3D design tools like SP3D and E3D also offer APIs. Secondly, direct data connection is possible, meaning the DB of ARS and SP3D can be directly linked, allowing for real-time data synchronization and the immediate reflection of design changes [106]. This method is simpler than using API interfaces but may lead to integration issues if the DB structure changes. Thirdly, developing separate plugins for SP3D or E3D can enhance user convenience by directly integrating ARS functions into the SP3D interface, although plugin development can be time-consuming and costly [107]. Another approach is integration based on cloud platforms [108]. This enables data sharing and collaboration without geographical constraints but requires additional considerations for security and data management.
The proposed ARS in this study resolved compatibility issues between SP3D by developing a dedicated plugin for SP3D. Data exchange was conducted in eXtensible Markup Language (XML) format. The 3D model data generated by ARS were transmitted to SP3D in an XML format. The SP3D plugin developed for this study converted XML data into a format usable in SP3D, interfacing through APIs provided by SP3D. Consequently, by linking ARS with SP3D, data generated by ARS could be immediately utilized in SP3D, reducing data loss and enhancing the efficiency of the design process. Furthermore, maintaining consistency in design data helped to reduce design errors. The output from the ARS can be exported in MS Excel format, and this exported Excel file can then be used in SP3D.
The files exported from ARS can be reviewed not only through SP3D but also via Navisworks. Navisworks is a review software provided by Autodesk [109]. The ARS supports the creation of .NWD file formats, which are exclusive to Navisworks.

5.3. User Interface

A relevant user interface (UI) must be included during system development to deliver the optimal path algorithm of a piping auto-routing model and data processes to users. The UI is a critical component that directly interacts with users and the system. A user-friendly UI enhances the overall user experience, and an intuitive, easy-to-understand UI enables users to utilize the system effectively [110].
The line information of a P&ID is saved in the system, and then the piping route is displayed on the screen. LTS is listed in the design data menu positioned at the bottom of the screen. Figure 11 shows the optimal piping route and equipment arrangement finally implemented in the ARS through 3D modeling and performed based on P&ID and line list information. Once an LTS number shown at the bottom of the screen is clicked, the respective LTS is shown as a 3D screen. An alarm is issued to warn the user when LTS data contain errors. On the left side of the screen, the project is systematically managed by decomposing work units into a project work breakdown structure (WBS). To reduce project complexity and clarify the scope of each task, the work time and cost have been visualized. Additionally, project progress can be tracked by monitoring project schedules and budgets. The ARS output can be exported in the MS Excel format.

6. Validation through Case Studies

In this section, the performance of the developed model is evaluated to examine the practical application of the ARS. To compare the accuracy of ARS design, actual data from the ‘A’ petrochemical project and ‘L’ refinery project conducted by ‘D’ EPC Company in Korea were utilized. By comparing the results of these actual projects with those generated by ARS, the design accuracy of ARS was evaluated. Additionally, the time spent on piping design tasks by humans was compared to the time taken by ARS to assess the performance of ARS.

6.1. Comparison of Conventional Piping Design Process and ARS Design Process

Piping design in plant design plays a crucial role in transporting fluids or gases, significantly impacting the performance and safety of the plant. P&ID represents the virtual design area that visually demonstrates the basic elements and interactions of the system. On the other hand, piping design involves evaluating the feasibility and performance of the system by considering the actual layout of structures and machinery, falling under the realm of physical design.
Piping design includes considering the placement of machinery and structures, determining the piping routes based on this information. This process involves setting potential routes using pipe routing studies (PRS) or piping conceptual drawings (PCD) [111]. The drawings created at this stage are not final submissions and are subject to modifications based on other design data later on. The ultimately produced piping route drawings are referred to as piping plans. Recently, 3D modeling tools have included features that automatically convert PRS into piping plans.
Traditionally, piping design often involved manual work by designers. In such cases, the design quality varied greatly depending on the experience and skills of the workers, making common errors and consuming significant time and costs. Errors occurring during the design process have a significant impact on project schedules and quality. Utilizing digital technology to automate piping design, detect errors, and make corrections is crucial in improving efficiency and accuracy in the piping design process.

6.2. Test Set-up for Auto-Routing System

To evaluate the performance of the ARS proposed in this study, actual data from the ‘A’ Petrochemical plant project and ‘L’ Refinery project of Company D were utilized to compare the performance of ARS and the alignment with the actual project.
The ARS proposed in this study requires verification of the 3D modeling results of the plant’s piping and equipment configuration and layout shown in the P&ID. Therefore, this study attempted to compare the 3D modeling results of ARS with the 3D modeling results of the piping engineer to verify whether the 3D modeling results of ARS match the actual plant configuration. Still, it was not possible to compare them in reality. This study compared the piping quantity information of the BoM that ARS and the engineer manually 3D modeled to verify the results of the path layout of the piping. Through this, the performance of ARS was evaluated, and the alignment with the actual project was confirmed.
When a piping engineer manually designs the piping path using a 3D CAD SW, a BoM is produced through the SW. If the piping path is automatically performed using ARS, the piping quantity of the project is automatically calculated. This study utilized the BoM as a performance evaluation metric to compare the results of piping route designs between the engineer’s manual design and the automatic routing by ARS. The weight and quantity of piping are crucial indicators in cost estimation, directly impacting construction costs, making them important metrics in piping design. The BoM specifies the type and quantity of piping. Comparing BoM data can quickly verify the results of 3D modeling and reduce the time and cost of verifying 3D modeling.
The performance evaluation process is as follows. First, after inputting the line information of the completed project that was manually designed by the engineer through a 3D CAD SW into ARS, the data were digitized and an optimal piping design was performed within ARS. A BoM was then generated from the optimal piping route, and the 3D model layout was created during this process. The BoM produced through the ARS is referred to as ARS-BoM. The BoM from the completed project is termed the as-built BoM (AB-BoM). Subsequently, the ARS-BoM is compared to the AB-BoM of the completed project to verify if there is a match.
Seven engineers performed a comparative analysis between ARS-BoM and AB-BoM with at least ten years of experience in EPC design. Table 8 presents the information of the subject matter experts (SMEs) of seven engineers who compared ARS-BoM and AB-BoM.
A BoM includes information on the piping and related materials used in plant construction. In this study, abbreviations are employed to denote piping information within a BoM. “DWG” indicates a drawing, with “DWG_NO” referring to the drawing’s number. “Item type” specifies the type of piping, usually classified into pipe and fitting. A pipe is a straight, circular piping element, whereas a fitting is a connector used for joining pipes or altering their direction. “Line_NO” represents the attributes of piping in each P&ID, encompassing a variety of meanings. Although it may differ by project, it typically comprises a project number, fluid type, and sequence. “Line_NO” assigns a number to each pipe but not to fittings, which are considered components. Fluid type specifies the type of fluid in each piping section, with “DW” denoting distilled water. “Pipe THK” refers to the pipe’s thickness, related to pipe pressure, while ‘SCH’ indicates the pipe schedule. The numerical value following ‘SCH’ represents the pressure unit in MPa. As the number succeeding ‘SCH’ increases, the pipe’s thickness increases. “Q’ty” is measured in meters for pipes and as a count for fittings. Finally, weight signifies the weight of the piping. Although a BoM includes many items, only quantitative values linked to cost, such as quantity and weight, are crucial for comparison. Therefore, quantity and weight are the main comparison items used to contrast the ARS-BoM and the AB-BoM. Specifically, the quantity and weight of the pipe and fitting list are examined to confirm the accuracy of the piping design. Table 9 displays the BoM data items extracted from the ARS.
“Matching accuracy” was used as an indicator to compare the data between the ARS-BoM and the AB-BoM. Accuracy is a measurement indicator demonstrating to what extent measurements or results match the actual values [112]. In this study, matching accuracy can be calculated as shown in Equation (3).
M a t c h i n g   A c c u r a c y = Matching   items C BoM   × 100 %
where the matching item denotes the number of cost data items in AB-BoM that match those in the ARS-BoM. Furthermore, C in C-BoM indicates that the project has been completed. To validate the accuracy of the system, the weight, length, and quantity in the ARS-BoM were compared with the AB-BoM, which represents as-built data.

6.3. Performance Evaluation Results and Discussion

6.3.1. Case 1—Petrochemical Project

When comparing the AB-BoM and the ARS-BoM of the ‘A’ petrochemical project, if the piping auto-routing in ARS was carried out identically to the actual project, the matching accuracy between AB-BoM and ARS-BoM would be 100%. In Company D’s AB-BoM, the line number is 3434, while the average line number for a chemical plant typically ranges between 3000 and 5000. The number of fittings recorded was 6936.
Upon comparing the AB-BoM and the ARS-BoM of the ‘A’ petrochemical project, the pipe weight in the AB-BoM was 247,338 kg, whereas in the ARS-BoM, it was 244,617 kg. The total length of piping was 18,825 m for the AB-BoM and 15,981 m for the ARS-BoM. Therefore, the match accuracy for pipe quantity was 98.9% in terms of weight and 84.9% in terms of length.
In terms of fitting quantity, the weight of the fittings in the AB-BoM was 31,542 kg when compared to 31,459 kg in the ARS-BoM. The total number of fittings was 6936 for the AB-BoM and 5822 for the ARS-BoM. Consequently, the match accuracy for fitting quantity was 99.7% for weight and 83.9% for the number of fittings. Table 10 summarizes the performance evaluation results for the ARS for the ‘A’ petrochemical project.
The validation results of AB-BoM and ARS-BoM demonstrated discrepancies in matching accuracy for pipes and fittings. The weight of the tested pipes and fittings matched precisely within the margin of error at 98.9% and 99.76%, respectively. However, errors arose in the lengths of pipes and fittings at 84.9% and 83.9%, respectively. Although the quantity of pipes and fittings showed almost 100% accuracy in terms of weight, there was a reduction in numbers. ARS-implemented piping design was confirmed to be different from the volume data of the existing project, and an analysis was conducted based on this finding. When analyzing errors based on the line numbers, it was discovered that the specifications for some pipe and fitting items had changed. A 3D modeling simulation for verifying each line number and BoM revealed that the reason for the discrepancy in pipe lengths was due to the system configuring the piping route using a new path, not the original one. This new route comprised shorter and thicker routes for the pipes. It was observed that the specifications for 15% (518) of the items had changed based on the line number criteria. As the pipe route changed, the size or shape of the fittings was also altered accordingly. Although the weight of the fittings matched the original specifications, the count of fittings decreased as the number of pipe line number items reduced. The project was likely influenced by various indirect factors affecting the piping design, such as initial technical requirements, material selection, operations and maintenance methods, and material availability. Although the weight, closely associated with cost, matched accurately, there could still be variations. Cost is one of the most crucial elements in a project, with weight and length being directly linked to it. Hence, it was not possible to argue which piping design was optimal due to these direct and indirect factors. However, the ARS’s ability to present multiple possible piping routes suggests the potential for achieving work efficiency and economic benefits through optimal piping design, a primary goal of the research. Ordering through BoM before construction could significantly impact the overall project cost in case of shortages or excesses. Fortunately, while weight impacts ordering before construction, length can be adjusted during the construction. This reveals that the actual project was executed closely to the optimum design. Nonetheless, similar to traditional piping design, should issues or errors in piping design arise, users need to check and correct the line numbers manually. This indicates that ARS is not yet perfect and still requires human verification.

6.3.2. Case 2—Refinery Project

ARS’s performance was evaluated not only for the petrochemical project but also for the refinery project, focusing on the ‘L’ refinery project in the Middle East. The method for evaluating the performance of ARS through the ‘L’ refinery project case is the same as the ‘A’ petrochemical project. The comparison of AB-BoM and ARS-BoM for the ‘L’ refinery project resulted in Table 11, showing the evaluation of ARS’s performance for the ‘L’ refinery project.
A comparison of the AB-BoM and ARS-BoM of the ‘L’ refinery project showed that the weight of the pipe in the AB-BoM was 364,884 kg and the weight of the pipe in the ARS-BoM was 368,748 kg. The total length of the piping was 67,528 m in the AB-BoM and 67,953 m in the ARS-BoM. The matching accuracy of the pipe quantity is 99% for weight and 99.4% for length. The comparison of the fitting quantity showed that the weight of the fitting in the AB-BoM and ARS-BoM was 29,187 kg and 28,898 kg, respectively, and the total number of fittings was 5401 in the AB-BoM and 5268 in the ARS-BoM. As a result, the matching accuracy for the fitting quantity is 99.0% for weight and 97.5% for quantity.
As shown above, the matching accuracy for the weight of piping and fittings was found to be over 98% in both petrochemical and refinery projects after comparing the actual BoM data with the ARS BoM data. In addition, comparing the quantity of piping and fittings showed that the matching accuracy of the refinery project was higher than that of the petrochemical project.
In this paper, the matching accuracy was verified by comparing the BoM of only two representative projects. However, when ARS was applied to the actual piping design of five onshore petrochemical and refinery projects, similar results to cases 1 and 2 were observed. The authors are currently applying ARS to piping design in industrial plants at S Electronics in Korea. They plan to analyze the performance of ARS after the design is completed.
The performance evaluation of ARS for BoM has limitations. ARS, which designs routes based on P&ID, automatically calculates BoM after 3D modeling, and all P&ID data that are modeled in 3D can be calculated as BoM. However, miscellaneous items such as small diameter pipes less than 2 inches are not modeled in 3D, and, as a result, they are not reflected in the BoM. This can be a potential source of error when calculating the final construction cost. Nevertheless, it is analyzed that these errors will not have a significant impact on the performance of the ARS. This is because the BoM calculated after the engineer manually designs cannot be defined as 100% perfect. The manual routing of pipes by engineers can vary from engineer to engineer, which can affect the comparison based on BoM. In addition, in actual design, elements that are not included in the BoM may exist due to the engineer’s experience and judgment. Given that errors such as these may not be reflected in the BoM, it is expected that these factors would not have a significant impact on the matching accuracy of ARS based on the comparison results of BoMs between engineers and ARS for the two project cases.

6.4. Comparison of Human Design and the ARS

The preceding section focused on a comparison between the actual project and the ARS to validate the match accuracy of the auto-routing quantities. In this section, the manual design process conducted by engineers is compared with the ARS to evaluate the time efficiency of the ARS in finalizing designs. An image tool within AutoCAD was utilized to render actual facilities and devices. The average number of equipment and plant information items in a P&ID was determined to be approximately 1150. To conduct this comparison, three engineers of similar skill levels were assigned the task of designing, and their collective average work time was subsequently calculated.
In line with the standard piping design procedure, the time taken by engineers to perform 3D modeling of the plot plan and equipment in a P&ID was calculated. The ARS proposed in this study is designed to execute 3D modeling using the plot plan and P&ID and to devise an optimal piping route. Therefore, the time required for the ARS to scan drawings and construct a 3D model was also computed. The term ‘day’, as used in this study, refers to a calendar day rather than a working day.
In comparing the time required for 3D modeling between the manual process by engineers and the ARS, it was observed that an engineer typically spent an average of 30 min on 3D modeling for each facility, whereas the ARS took about 10 min. For designing 1150 facilities, an engineer would require approximately 575 h, while the ARS would require around 192 h. In terms of days, the manual modeling of 1150 facilities requires an engineer approximately 24 days, whereas the ARS can complete the same task in 8 days.
Consequently, it was established that the automated 3D modeling by the ARS is three times faster than the manual design process by an engineer. Table 12 presents a comparison of the actual time required for 3D modeling between engineers and the ARS.
The time taken to design an optimal piping route was compared between an engineer and the ARS. For this comparison, the as-built data of Company D’s chemical plant, which included 3454 pipes, were utilized. Like the 3D modeling comparison, three engineers with equivalent skills were tasked with performing the optimal piping design, and their average completion time was recorded. For the engineers, the total time taken for the entire design process, which included writing the line list, setting the line routing, and creating the piping design drawings, was calculated. In the case of the ARS, the time taken for the system to perform the piping design automatically was determined. These observed data were then compared. It is important to note that in this study, the term ‘day’ refers to a calendar day rather than a working day.
On average, an engineer took approximately 30 min to configure a piping route for a single line manually. The time required by the ARS could not be ascertained in the same manner, as its design process was not based on the unit of the line number. To manually design the optimal route for 3454 pipelines, an engineer required a total of 1727 h. In contrast, the ARS only needed 45 h to recognize and verify the piping route automatically. When these working hours are converted into days, it is found that an engineer typically requires 72 days to complete the task, whereas the ARS completes the same work in approximately two days.
The comparison shows that the ARS can accomplish piping auto-routing 36 times more quickly than an engineer, thereby drastically shortening the time required for design tasks. Table 13 shows the comparison of design time between engineers and the ARS during the optimal piping routing design.
The plant engineering industry, a complex sector requiring significant capital and manpower investment, uses substantial time and costs throughout processes such as design, construction, and operation. However, the application of Industry 4.0 technologies relative to its scale remains inadequate, and the achievement level of digital transformation is low in reality [113]. An ARS, proposed in this study, was developed for plant engineering design and its effectiveness was verified by applying it to actual piping design. This study is meaningful in that it presents specific ways to improve the work process and increase the sustainability of the plant engineering field. Moreover, it is expected to enhance sustainability and productivity simultaneously through digital innovation in the plant engineering sector.

7. Summary

7.1. Conclusions and Contributions

This study focused on identifying the most efficient piping route in the design phase of EPC plant piping, leading to the development of the ARS, which incorporates AI technology. The process began with the recognition and extraction of object information from P&ID through digital image processing. Subsequently, the symbols, lines, and text identified through this technology were grouped into an LTS, the basic unit for performing au-to-routing. Additionally, plant information data, particularly regarding facilities, were implemented in 3D. To develop the ARS, a dataset of a chemical plant was obtained and stored as a library in the system’s database. Given that EPC plants may have varied piping design information depending on the project type and purpose, the ARS was designed to import files generated outside the system seamlessly. Furthermore, the study applied three algorithms to find an optimal route during piping design. Dijkstra’s algorithm was used to determine the shortest path of piping, and a routing priority algorithm was implemented to avoid errors in piping design and to enhance the efficiency of piping installation. Interference obstacle avoidance was also incorporated to prevent the crossing or interference of pipes and to determine the most suitable arrangement. Finally, employing an on-premise approach, the ARS was used to create a model for the optimal piping route.
To validate the developed ARS in this study, the matching accuracy of the BoM data generated by the ARS was compared with the BoM data from ‘D’ Company’s petrochemical and refinery projects. Pipe and fitting were compared among the items in a BoM, and their weight and quantity were set as the comparison factors. For the petrochemical and refinery projects, the comparison between AB-BoM and ARS-BoM results showed that in both cases, piping design exhibited a similar matching accuracy of over 98% in terms of weight. However, in terms of quantity, the refinery project showed more precise alignment. Similarly, in fitting design for both cases, the weight had a matching accuracy of over 99%, but the quantity accuracy was higher for the refinery project. The paper discussed the performance verification of ARS by comparing BoMs for two representative EPC projects, such as petrochemical and oil refinery projects. Although it does not elaborate on the simulation results of other projects, it has been confirmed that similar results to cases 1 and 2 were derived from the results of testing the accuracy of ARS in five other onshore plant projects.
Discrepancies were observed in the matching accuracy of pipes and fittings. However, the ARS proposed an alternative feasible route. Additionally, the ARS demonstrated the ability to decrease the time required for 3D modeling threefold and piping route design by 36 times when compared to the manual efforts of an engineer. These findings suggest that this study has effectively created a system that realizes increased work efficiency and economic design, aligning with the objectives set forth in the research.
The contributions of this study are discussed in terms of theoretical, technical, and practical aspects. The theoretical contributions of this study are as follows. The ARS addressed existing challenges by integrating various algorithms. It enhanced the Dijkstra algorithm by applying routing priority and interference obstacle avoidance algorithms simultaneously. The primary limitation of the Dijkstra algorithm is its focus solely on straightforward path designation without considering various constraints. The ARS overcame this by incorporating design constraints, such as priority and obstacle avoidance, into the Dijkstra algorithm, thereby reducing design errors.
The technical contributions of this study are significant and multifaceted. Firstly, the ARS transformed all data necessary for piping design into a digital format, making it accessible and usable within a single system. The system effectively utilized aggregated data, such as LTS, to reconfigure complex data for suitability in piping design. Secondly, the ARS enabled the independent execution of 3D modeling for each process within one integrated system. This feature is particularly beneficial as various teams managing different aspects of a project contribute to the overall completion through their collaborative efforts. The ARS provides the capability to monitor each team’s progress, aiding in the timely completion of tasks according to the project schedule. Thirdly, the ARS ensures that the piping route design results are compatible with SP3D and E3D. This compatibility guarantees the feasibility of utilizing 3D models within these programs. The design of the ARS focuses heavily on flexibility and compatibility, facilitating seamless data exchange and supporting plug-ins with other software applications. Moreover, using a unified solution across various environments can reduce costs while maintaining independence in piping design.
The practical implications of this study are significant and include the following aspects: Firstly, the case study of the ARS demonstrated a substantial reduction in the time required for piping design. The time for the 3D modeling of facilities was reduced threefold, while the time for the 3D modeling of piping routes decreased by 36. This reduction in design time can lead to considerable economic benefits. Secondly, this study offered a valuable solution for enhancing work efficiency. By facilitating route design based on data, the ARS improved the quality of the design through standardized design practices. It also ensured accurate calculations of design quantities through 3D modeling, enhancing the overall quality and reliability of the design process. Thirdly, the ARS holds the potential to mitigate the loss of knowledge caused by the dwindling number of experienced engineers. By storing datasets from previous projects, the ARS preserves advanced design expertise, contributing to sustainable development in the field of piping design. Fourth, this system was developed following the interface of typical design programs, considering user-friendly menus and item placement. Users can operate the program simply by referring to a basic manual, and users with a fundamental understanding of piping design can easily use it. Additionally, the design can be optimized for efficiency or cost-effectiveness according to user requirements. The system implements a 3D modeling screen to show the design results in an easily understandable manner. Real-time feedback is provided based on user input to create an environment that allows users to grow technically.

7.2. Limitation and Future Works

A fundamental limitation was the discrepancy in comparison data during model testing. This resulted in a noticeable difference between the piping design of an actual plant project and the design output generated by the ARS. The discrepancy stemmed from environmental constraints present in the ARS that were not applicable to the actual project, even though the primary process conditions were similar between an engineer’s design and the ARS. Specifically, an increase in pipe thickness was noted in certain sections of the actual project, where the piping design incorporated an oversizing factor. This oversizing factor is used to improve the stability of the piping design by intentionally specifying a higher piping design ratio. As a consequence, the actual project exhibited a greater weight of piping, leading to a design configuration that differed from that produced by the ARS.
To overcome these limitations and enhance the accuracy of ARS in the future, additional technological developments will be required. It would not be an exaggeration to say that we are currently living in the era of AI, given its widespread utilization across various sectors. The plant engineering industry is no exception to this trend.
The potential benefits that AI can bring to the engineering sector are as follows. AI can automate various tasks such as design, analysis, simulation, and inspection, thereby reducing engineers’ workload and enhancing productivity [114]. AI also has the capability to detect and correct errors that might be overlooked by engineers, thereby improving the accuracy of design and operations, and ultimately contributing to cost savings. Moreover, AI-based tools can facilitate predictive maintenance through data analysis, enhancing the safety of plants, minimizing downtime, and reducing costs. Lastly, AI enables new methods of design and operation previously unattainable, such as augmented reality (AR) and 3D printing technologies, thus creating new opportunities within the plant engineering sector.
Although AI has the potential to bring innovation to the engineering industry, it also poses several challenges. First, AI can automate many tasks, reducing engineers’ working hours and improving productivity. However, it may also lead to issues such as job loss for humans. Additionally, AI fundamentally relies on vast amounts of data. However, the use of low-quality or distorted data can lead to skewed results, and inaccuracies due to unreliable data in safety-related fields can result in serious safety issues. Furthermore, AI-based systems are susceptible to cyber-attacks, necessitating continuous measures for data protection and security against breaches of data collected by AI. Lastly, legal issues related to AI, such as liability, intellectual property rights, and data protection, have not yet been clearly established.
The current state of AI technology is not without its imperfections. Especially in the plant engineering industry, which faces challenges due to a lack of data, there may be limitations in addressing complex issues and applying AI to specific environments or problems. Although AI technology’s advancements are emerging as a game-changer for the industry, the adoption of AI in the EPC piping design field is progressing more slowly compared to other industries. Moreover, the replacement of engineers by AI is still in its early stages. Despite these challenges, the rapidly evolving field of AI technology necessitates research into fully automated ARS.
Second, additional research is needed to develop a 3D modeling-based automatic placement technology for optimal piping routes using AI technology to improve the performance of the ARS. This entails developing rule classification algorithms and automatic route placement learning algorithms based on the digital rule set for piping route design developed in this study. In this case, not only the automatic design of piping routes but also the development of systems that optimize piping routes by integrating AI technology is required. Third, developing a training dataset for AI models is also necessary. To apply AI, a large amount of piping design data used in actual plant design need to be collected. Fourth, 100% recognition of P&ID data is required for the full automation of LTS generation. Research efforts such as developing the ID2 algorithm using deep learning technology and improving digital image processing techniques are necessary to enhance the recognition accuracy of ID2.
Finally, it is necessary to expand to 4D, 5D, and 6D BIM in conjunction with 3D BIM. The 3D modeling-based ARS proposed in this study visualizes the spatial elements of the plant. In the future, the development of a 4D BIM model that adds a time element to 3D BIM and a 5D BIM model that integrates cost information into 4D BIM can help simulate and manage project schedules and cost information [115]. BIM also plays a vital role in sustainability. By developing a 6D BIM-based system that adds operational and maintenance information to 5D BIM, it is possible to optimize the life-cycle cost of the plant and realize sustainable operations.
However, there are some limitations to implementing BIM-based systems. Firstly, compatibility issues can arise between various software tools and systems. To address these issues, adherence to data exchange standards and protocols and ensuring interoperability are necessary. Furthermore, integrating legacy systems with BIM-based systems can be complex. Developing interfaces for smooth integration, optimizing data exchange, integrating data, and actively working to overcome these constraints are essential.

Author Contributions

Conceptualization, D.-H.K., S.-W.C. and E.-B.L.; methodology, D.-H.K. and S.-W.C.; software, D.-H.K., S.-W.C. and S.-O.K.; validation, D.-H.K. and S.-W.C.; formal analysis, D.-H.K. and S.-W.C.; investigation, D.-H.K. and S.-W.C.; resources, S.-O.K.; data curation, D.-H.K. and S.-W.C.; writing—original draft preparation, D.-H.K. and S.-W.C.; writing—review and editing, D.-H.K., S.-W.C. and E.-B.L.; visualization, D.-H.K. and S.-W.C.; supervision, S.-W.C. and E.-B.L.; project administration, E.-B.L. and S.-O.K.; funding acquisition, S.-W.C., E.-B.L. and S.-O.K. All authors have read and agreed to the published version of the manuscript.

Funding

This research was sponsored by the Korea Ministry of Trade Industry and Energy (MOTIE) and the Korea Evaluation Institute of Industrial Technology (KEIT) through the Technology Innovation Program funding for “Development of optimization technology for pipe-cable auto routing design linked to carbon reduction model” project (Grant No. RS-2022-00143619).

Institutional Review Board Statement

Not applicable.

Informed Consent Statement

Not applicable.

Data Availability Statement

Data are contained within the article.

Acknowledgments

The authors would like to give special thanks to Hum-Kyung Baek (an Executive Director at Doftech) for his technical support of this study. The views expressed in this paper are solely those of the authors and do not represent those of any official organization or research sponsor.

Conflicts of Interest

Author Sung-O Kang was employed by the company DofTech Engineering. The remaining authors declare that the research was conducted in the absence of any commercial or financial relationships that could be construed as a potential conflict of interest.

Abbreviations

3DThree Dimensions
APIApplication Programming Interface
ARSAuto-Routing Systems
AIArtificial Intelligence
BIMBuilding Information Modeling
BoMBill of Material
BPBypass Line
B2BBranch to Branch
CAGRCompound Annual Growth Rate
CAPEXCapital Expenditure
CADComputer Aided Design
CLNCross-domain Learning Network
CNNConvolutional Neural Network
CRAFTCharacter Region Awareness for Text Detection
CSVComma-Separated Values
CWSChilled Water Supply
CWRChilled Water Return
DBDatabase
DBMSData Base Management Systems
DDECSDifferential Evolution and Cuckoo Search
DEXPIData Exchange in The Process Industry
DTDigital Transformation
DWGDrawing
DWDistilled Water
E2EEquipment to Equipment
EPCEngineering Procurement and Construction
IRInformation Retrieval
ITInformation Technology
IPAIndependent Project Analysis
ISOIsometric
IDEIntegrated Development Environment
JPSJump Point Search
LTSLine Topology Set
LDLiquidated Damages
LWDPLocal Word Direction Pattern
MDBMMaximal Disjoint Ball De-composition
MIRMathematical Information Retrieval
MOOMulti-Objective Optimization
MRFMarkov Random Field
MROMaintenance, Repair and Operation
MSERMaximally Stable Extreme Region
P&IDPiping and Instrument Diagram
PREMAPart-based Recurrent Multi-view Aggregation Network
PProcess
SMEsSubject Matter Experts
SCHSchedule
TKTank
THKThickness
UIUser Interface
UUtility
WBSWork Breakdown Structure
X2BOPC to Branch

References

  1. KPMG. Russia and Ukraine Conflict: Economic Implications. Available online: https://kpmg.com/xx/en/home/insights/2022/03/russia-and-ukraine-conflict-chief-economist-team.html (accessed on 9 December 2023).
  2. Market Research. Oil and Gas EPC Market–Growth, Trends, COVID-19 Impact, and Forecasts (2022–2027). Available online: https://www.marketresearch.com/Mordor-Intelligence-LLP-v4018/Oil-Gas-EPC-Growth-Trends-32021354/ (accessed on 9 December 2023).
  3. Market Research. Oil and Gas EPC. Available online: https://www.marketresearch.com/Global-Industry-Analysts-v1039/Oil-Gas-EPC-33869288/ (accessed on 9 December 2023).
  4. Zaoui, F.; Souissi, N. Roadmap for digital transformation: A literature review. Procedia Comput. Sci. 2020, 175, 621–628. [Google Scholar] [CrossRef]
  5. McKinsey Digital. McKinsey Technology Trend Outlook 2023. Available online: https://www.mckinsey.com/capabilities/mckinsey-digital/our-insights/the-top-trends-in-tech (accessed on 21 September 2023).
  6. Digital Transformation Skills. Effective of Engineering Business Model Transformation. Available online: https://digitaltransformationskills.com/engineering-business-model-transformation/ (accessed on 9 December 2023).
  7. Muhammad Andry Rezky, A. Engineering–Procurement–Construction (EPC) mega project: Analysis of the dominant cost factors and viable solutions. In Proceedings of the 5th Sebelas Maret International Conference on Business, Economics and Social Sciences (SMICBES 2018), Bali, Indonesia, 17–19 July 2018; pp. 493–506. [Google Scholar]
  8. Caldas, C.; Gupta, A. Critical factors impacting the performance of mega-projects. Eng. Constr. Archit. Manag. 2017, 24, 920–934. [Google Scholar] [CrossRef]
  9. EY. Spotlight on Oil and Gas Megaprojects. Available online: https://aegex.com/images/uploads/white_papers/EY-spotlight-on-oil-and-gas-megaprojects.pdf (accessed on 9 December 2023).
  10. Kim, M.-H.; Lee, E.-B.; Choi, H.-S. Detail engineering completion rating index system (DECRIS) for optimal initiation of construction works to improve contractors’ schedule-cost performance for offshore oil and gas EPC projects. Sustainability 2018, 10, 2469. [Google Scholar] [CrossRef]
  11. Lee, J.Y. The Effect of EPC Firms on Employment and Policy of Engineering Industry. KENCA 2023, 24, 59–66. [Google Scholar] [CrossRef]
  12. Siddiqui, T. Evaluating Percentage Cost Volume of Engineering, Procurement & Construction to Add Value in EPC Petrochemical Projects. In Proceedings of the Abu Dhabi International Petroleum Exhibition and Conference, Abu Dhabi, United Arab Emirates, 9–12 November 2020; p. D011S024R003. [Google Scholar]
  13. Kim, M.-S.; Lee, E.-B.; Jung, I.-H.; Alleman, D. Risk assessment and mitigation model for overseas steel-plant project investment with analytic hierarchy process—Fuzzy inference system. Sustainability 2018, 10, 4780. [Google Scholar] [CrossRef]
  14. Texvyn. Piping Engineering Design. Available online: https://www.texvyn.in/post/introduction-piping-engineering-design (accessed on 9 December 2023).
  15. Brown, D.; Reddi, K.; Elgowainy, A. The development of natural gas and hydrogen pipeline capital cost estimating equations. Int. J. Hydrog. Energy 2022, 47, 33813–33826. [Google Scholar] [CrossRef]
  16. POSCO EnC. Indonesia Integrated Steel Mill Project. Available online: https://www.poscoenc.com/en/business_areas/project.aspx?brpt=151 (accessed on 9 December 2023).
  17. RISHABH Engineering. Advantages of 3D CAD Modeling in Engineering. Available online: https://www.rishabheng.com/blog/importance-of-3d-cad-modeling (accessed on 21 September 2023).
  18. Henke, M.; Gladilin, E. Virtual Laser Scanning Approach to Assessing Impact of Geometric Inaccuracy on 3D Plant Traits. Remote Sens. 2022, 14, 4727. [Google Scholar] [CrossRef]
  19. Indeed. Piping Designer Salary in the United States. Available online: https://www.indeed.com/career/piping-designer/salaries (accessed on 9 December 2023).
  20. KCMI. The Impact Demographic Changes on Long-Term Macroeconomic Prospects, 22–26, 2022. Available online: https://www.kcmi.re.kr/en/publications/pub_detail_view?syear=2023&zcd=002001017&zno=1752&cno=6217 (accessed on 11 December 2023).
  21. Ghobakhloo, M.; Iranmanesh, M. Digital transformation success under Industry 4.0: A strategic guideline for manufacturing SMEs. J. Manuf. Technol. Manag. 2021, 32, 1533–1556. [Google Scholar] [CrossRef]
  22. BAU. Digitization of the Construction Industry: Digital Transformation Takes Hold. Glass on Web, 6 February 2023. Available online: https://www.glassonweb.com/news/digitization-construction-industry-digital-transformation-takes-hold (accessed on 13 December 2023).
  23. CED Engineering.com. Process Piping Fundamentals, Codes and Standards. Available online: https://www.cedengineering.com/userfiles/Process%20Piping%20Fundamentals,%20Codes%20and%20Standards%20%20-%20Module%201.pdf (accessed on 18 December 2023).
  24. Cordella, L.P.; Vento, M. Symbol recognition in documents: A collection of techniques? Int. J. Doc. Anal. Recognit. 2000, 3, 73–88. [Google Scholar] [CrossRef]
  25. Nazemi, A.; Murray, I.; McMeekin, D.A. Mathematical information retrieval (MIR) from scanned pdf documents and MathML conversion. IPSJ Trans. Comput. Vis. Appl. 2014, 6, 132–142. [Google Scholar] [CrossRef]
  26. Saabni, R.; Asi, A.; El-Sana, J. Text line extraction for historical document images. Pattern Recognit. Lett. 2014, 35, 23–33. [Google Scholar] [CrossRef]
  27. Pham, T.-A.; Delalandre, M.; Barrat, S.; Ramel, J.-Y. Accurate junction detection and characterization in line-drawing images. Pattern Recognit. 2014, 47, 282–295. [Google Scholar] [CrossRef]
  28. Yan, J.; Gao, X. Detection and recognition of text superimposed in images base on layered method. Neurocomputing 2014, 134, 3–14. [Google Scholar] [CrossRef]
  29. Shi, C.; Wang, C.; Xiao, B.; Gao, S.; Hu, J. End-to-end scene text recognition using tree-structured models. Pattern Recognit. 2014, 47, 2853–2866. [Google Scholar] [CrossRef]
  30. Kulkarni, C.R.; Barbadekar, A.B. Text detection and recognition: A review. Int. Res. J. Eng. Technol. IRJET 2017, 4, 179–185. [Google Scholar] [CrossRef]
  31. Mittal, A.; Roy, P.P.; Singh, P.; Raman, B. Rotation and script independent text detection from video frames using sub pixel mapping. J. Vis. Commun. Image Represent. 2017, 46, 187–198. [Google Scholar] [CrossRef]
  32. Elyan, E.; Garcia, C.M.; Jayne, C. Symbols classification in engineering drawings. In Proceedings of the 2018 International Joint Conference on Neural Networks (IJCNN), Rio de Janeiro, Brazil, 8–13 July 2018; pp. 1–8. [Google Scholar]
  33. Kang, S.-O.; Lee, E.-B.; Baek, H.-K. A digitization and conversion tool for imaged drawings to intelligent piping and instrumentation diagrams (P&ID). Energies 2019, 12, 2593. [Google Scholar] [CrossRef]
  34. Yu, E.-S.; Cha, J.-M.; Lee, T.; Kim, J.; Mun, D. Features recognition from piping and instrumentation diagrams in image format using a deep learning network. Energies 2019, 12, 4425. [Google Scholar] [CrossRef]
  35. Elyan, E.; Jamieson, L.; Ali-Gombe, A. Deep learning for symbols detection and classification in engineering drawings. Neural Netw. 2020, 129, 91–102. [Google Scholar] [CrossRef]
  36. Guo, M.; Bei, W.; Huang, Y.; Chen, Z.; Zhao, X. Deep learning framework for geological symbol detection on geological maps. Comput. Geosci. 2021, 157, 104943. [Google Scholar] [CrossRef]
  37. Renton, G.; Balcilar, M.; Héroux, P.; Gaüzère, B.; Honeine, P.; Adam, S. Symbols detection and classification using graph neural networks. Pattern Recognit. Lett. 2021, 152, 391–397. [Google Scholar] [CrossRef]
  38. Naiemi, F.; Ghods, V.; Khalesi, H. A novel pipeline framework for multi oriented scene text image detection and recognition. Expert Syst. Appl. 2021, 170, 114549. [Google Scholar] [CrossRef]
  39. Kim, H.; Lee, W.; Kim, M.; Moon, Y.; Lee, T.; Cho, M.; Mun, D. Deep-learning-based recognition of symbols and texts at an industrially applicable level from images of high-density piping and instrumentation diagrams. Expert Syst. Appl. 2021, 183, 115337. [Google Scholar] [CrossRef]
  40. Xie, L.; Lu, Y.; Furuhata, T.; Yamakawa, S.; Zhang, W.; Regmi, A.; Kara, L.; Shimada, K. Graph neural network-enabled manufacturing method classification from engineering drawings. Comput. Ind. 2022, 142, 103697. [Google Scholar] [CrossRef]
  41. Tong, G.; Dong, M.; Sun, X.; Song, Y. Natural scene text detection and recognition based on saturation-incorporated multi-channel MSER. Knowl. Based Syst. 2022, 250, 109040. [Google Scholar] [CrossRef]
  42. Kohli, H.; Agarwal, J.; Kumar, M. An improved method for text detection using Adam optimization algorithm. Glob. Transit. Proc. 2022, 3, 230–234. [Google Scholar] [CrossRef]
  43. Liu, C.; Yang, C.; Qin, H.-B.; Zhu, X.; Liu, C.-L.; Yin, X.-C. Towards open-set text recognition via label-to-prototype learning. Pattern Recognit. 2023, 134, 109109. [Google Scholar] [CrossRef]
  44. Wen, R.; Tang, W.; Su, Z. Topology based 2D engineering drawing and 3D model matching for process plant. Graph. Models 2017, 92, 1–15. [Google Scholar] [CrossRef]
  45. Belov, G.; Czauderna, T.; Dzaferovic, A.; Garcia de la Banda, M.; Wybrow, M.; Wallace, M. An optimization model for 3D pipe routing with flexibility constraints. In Proceedings of the Principles and Practice of Constraint Programming: 23rd International Conference (CP 2017), Melbourne, VIC, Australia, 28 August–1 September 2017; pp. 321–337. [Google Scholar]
  46. Chen, J.; Ilies, H.T.; Ding, C. Graph-Based Shape Analysis for Heterogeneous Geometric Datasets: Similarity, Retrieval and Substructure Matching. Comput. Aided Des. 2022, 143, 103125. [Google Scholar] [CrossRef]
  47. Uchida, M.; Saito, S. Stylized line-drawing of 3D models using CNN with line property encoding. Comput. Graph. 2020, 91, 252–264. [Google Scholar] [CrossRef]
  48. Kim, Y.; Nguyen, C.H.P.; Choi, Y. Automatic pipe and elbow recognition from three-dimensional point cloud model of industrial plant piping system using convolutional neural network-based primitive classification. Autom. Constr. 2020, 116, 103236. [Google Scholar] [CrossRef]
  49. Sierla, S.; Azangoo, M.; Vyatkin, V. Generating an industrial process graph from 3d pipe routing information. In Proceedings of the 2020 25th IEEE International Conference on Emerging Technologies and Factory Automation (ETFA), Vienna, Austria, 8–11 September 2020; pp. 85–92. [Google Scholar]
  50. Kim, H.; Yeo, C.; Cha, M.; Mun, D. A method of generating depth images for view-based shape retrieval of 3D CAD models from partial point clouds. Multimed. Tools Appl. 2021, 80, 10859–10880. [Google Scholar] [CrossRef]
  51. Jin, J.; Xu, H.; Tang, Z.; Ji, P.; Xiong, Z. PREMA: Part-based Recurrent Multi-view Aggregation Network for 3D Shape Retrieval. In Proceedings of the 2021 2nd International Conference on Computer Science and Management Technology (ICCSMT), Shanghai, China, 12–14 November 2021; pp. 311–318. [Google Scholar]
  52. Nie, W.; Zhao, Y.; Nie, J.; Liu, A.-A.; Zhao, S. CLN: Cross-domain learning network for 2D image-based 3D shape retrieval. IEEE Trans. Circuits Syst. Video Technol. 2021, 32, 992–1005. [Google Scholar] [CrossRef]
  53. Fu, R.; Yang, J.; Sun, J.; Zhang, F.-L.; Lai, Y.-K.; Gao, L. RISA-Net: Rotation-invariant structure-aware network for fine-grained 3D shape retrieval. arXiv 2020. [Google Scholar] [CrossRef]
  54. Parisher, R.A. Pipe Drafting and Design, 4th ed.; Elsevier: Burlington, MA, USA, 2021; pp. 351–362. [Google Scholar]
  55. Pan, Y.; Noichl, F.; Braun, A.; Borrmann, A.; Brilakis, I. Automatic creation and enrichment of 3D models for pipe systems by co-registration of laser-scanned point clouds and photos. In Proceedings of the 2022 European Conference on Computing in Construction, Rhodes, Greece, 24–26 July 2022. [Google Scholar]
  56. Perez-Perez, Y.; Golparvar-Fard, M.; El-Rayes, K. Segmentation of point clouds via joint semantic and geometric features for 3D modeling of the built environment. Autom. Constr. 2021, 125, 103584. [Google Scholar] [CrossRef]
  57. Hou, J.; Luo, C.; Qin, F.; Shao, Y.; Chen, X. FuS-GCN: Efficient B-rep based graph convolutional networks for 3D-CAD model classification and retrieval. Adv. Eng. Inform. 2023, 56, 102008. [Google Scholar] [CrossRef]
  58. Zhang, C.; Pinquié, R.; Polette, A.; Carasi, G.; De Charnace, H.; Pernot, J.-P. Automatic 3D CAD models reconstruction from 2D orthographic drawings. Comput. Graph. 2023, 114, 179–189. [Google Scholar] [CrossRef]
  59. Hexagon. Intergraph Smart® 3D. Available online: https://hexagon.com/products/intergraph-smart-3d (accessed on 20 February 2024).
  60. AVEVA GROUP. AVEVA E3D™. Available online: https://www.aveva.com/ko-kr/products/e3d-design (accessed on 20 February 2024).
  61. Kang, J.Y.; Lee, B.S. Optimisation of pipeline route in the presence of obstacles based on a least cost path algorithm and laplacian smoothing. Int. J. Nav. Archit. Ocean. Eng. 2017, 9, 492–498. [Google Scholar] [CrossRef]
  62. Wu, L.; Tian, X.; Wang, H.; Liu, Q.; Xiao, W. Improved ant colony optimization algorithm and its application to solve pipe routing design. Assem. Autom. 2019, 39, 45–57. [Google Scholar] [CrossRef]
  63. Grabusts, P.; Musatovs, J.; Golenkov, V. The application of simulated annealing method for optimal route detection between objects. Procedia Comput. Sci. 2019, 149, 95–101. [Google Scholar] [CrossRef]
  64. Dong, Z.; Bian, X. Ship pipe route design using improved A* algorithm and genetic algorithm. IEEE Access 2020, 8, 153273–153296. [Google Scholar] [CrossRef]
  65. Min, J.-G.; Ruy, W.-S.; Park, C.S. Faster pipe auto-routing using improved jump point search. Int. J. Nav. Archit. Ocean. Eng. 2020, 12, 596–604. [Google Scholar] [CrossRef]
  66. Sierla, S.; Azangoo, M.; Fay, A.; Vyatkin, V.; Papakonstantinou, N. Integrating 2D and 3D digital plant information towards automatic generation of digital twins. In Proceedings of the 2020 IEEE 29th International Symposium on Industrial Electronics (ISIE), Delft, The Netherlands, 17–19 June 2020; pp. 460–467. [Google Scholar]
  67. Luo, M.; Hou, X.; Yang, J. Surface optimal path planning using an extended Dijkstra algorithm. IEEE Access 2020, 8, 147827–147838. [Google Scholar] [CrossRef]
  68. Gunawan; Hamada, K.; Kunihiro, K.; Utomo, A.S.A.; Ahli, M.; Lesmana, R.; Cornelius; Kobayashi, Y.; Yoshimoto, T.; Shimizu, T. Automated pipe routing optimization for ship machinery. J. Mar. Sci. Appl. 2022, 21, 170–178. [Google Scholar] [CrossRef]
  69. Lin, Y.; Bian, X.-y.; Dong, Z.-r. A discrete hybrid algorithm based on Differential Evolution and Cuckoo Search for optimizing the layout of ship pipe route. Ocean. Eng. 2022, 261, 112164. [Google Scholar] [CrossRef]
  70. Tsai, L.-T.; Chi, H.-L.; Wu, T.-H.; Kang, S.-C. AR-based automatic pipeline planning coordination for on-site mechanical, electrical and plumbing system conflict resolution. Autom. Constr. 2022, 141, 104400. [Google Scholar] [CrossRef]
  71. Lee, H.-T.; Choi, H.-M.; Lee, J.-S.; Yang, H.; Cho, I.-S. Generation of ship’s passage plan using data-driven shortest path algorithms. IEEE Access 2022, 10, 126217–126231. [Google Scholar] [CrossRef]
  72. Skretas, A.; Gyftakis, S.; Marcoulaki, E. A demonstration of sustainable pipeline routing optimization using detailed financial and environmental assessment. J. Clean. Prod. 2022, 362, 132305. [Google Scholar] [CrossRef]
  73. Vivaldini, K.C.; Galdames, J.P.; Pasqual, T.B.; Sobral, R.M.; Araújo, R.C.; Becker, M.; Caurin, G.A. Automatic routing system for intelligent warehouses. arXiv 2023, arXiv:2307.06893. [Google Scholar] [CrossRef]
  74. Ha, J.; Roh, M.-I.; Kim, K.-S.; Kim, J.-H. Method for pipe routing using the expert system and the heuristic pathfinding algorithm in shipbuilding. Int. J. Nav. Archit. Ocean. Eng. 2023, 15, 100533. [Google Scholar] [CrossRef]
  75. Kim, Y.; Lee, K.; Nam, B.; Han, Y. Application of reinforcement learning based on curriculum learning for the pipe auto-routing of ships. J. Comput. Des. Eng. 2023, 10, 318–328. [Google Scholar] [CrossRef]
  76. Wang, W. Automatic pipes counting system based on digital image processing technology. In Proceedings of the International Conference on Image Processing and Pattern Recognition in Industrial Engineering, Xi’an, China, 20 August 2010; pp. 471–476. [Google Scholar]
  77. Tan, W.C. Automated identification of components in raster piping and instrumentation diagram with minimal pre-processing. In Proceedings of the IEEE International Conference on Automation Science and Engineering, Fort Worth, TX, USA, 21–25 August 2016; pp. 1301–1306. [Google Scholar]
  78. Kim, H.J.; Shrestha, A.; Sapkota, E.; Pokharel, A.; Pandey, S.; Kim, C.S.; Shrestha, R. A Study on the Effectiveness of Spatial Filters on Thermal Image Pre-Processing and Correlation Technique for Quantifying Defect Size. Sensors 2022, 22, 8965. [Google Scholar] [CrossRef] [PubMed]
  79. Lucidchart. What Are Pipingand Instrumentation Diagrams? Available online: https://www.lucidchart.com/pages/tutorial/p-and-id (accessed on 18 December 2023).
  80. Glumov, N.; Kolomiyetz, E.; Sergeyev, V. Detection of objects on the image using a sliding window mode. Opt. Laser Technol. 1995, 27, 241–249. [Google Scholar] [CrossRef]
  81. Nguyen, T.-T.; Nguyen, D.-V.V.; Le, T. Developing a prescription recognition system based on CRAFT and Tesseract. In Proceedings of the Computational Collective Intelligence: 13th International Conference, ICCCI 2021, Rhodes, Greece, 29 September–1 October 2021; Proceedings 13. pp. 443–455. [Google Scholar]
  82. Smith, R.W. History of the Tesseract OCR engine: What worked and what didn’t. In Proceedings of the Document Recognition and Retrieval XX, Burlingame, CA, USA, 4 February 2013; p. 865802. [Google Scholar]
  83. Theisen, M.F.; Flores, K.N.; Balhorn, L.S.; Schweidtmann, A.M. Digitization of chemical process flow diagrams using deep convolutional neural networks. Digit. Chem. Eng. 2023, 6, 100072. [Google Scholar] [CrossRef]
  84. KIMRAY. How to Read Oil and Gas P&ID Symbols. Available online: https://kimray.com/training/how-read-oil-and-gas-pid-symbols (accessed on 15 December 2023).
  85. Autodesk. About Off-Page Connectors (OPCs). Available online: https://help.autodesk.com/view/PLNT3D/2024/ENU/?guid=GUID-3DA97A53-0C0A-4867-B1D4-4B48C0CB2BF3 (accessed on 15 December 2023).
  86. Kim, H.-C.; Lee, G.-H. A Development of Offshore plant Piping Process Monitoring System Based on 3D CAD Model. J. Korea Acad.-Ind. Coop. Soc. 2020, 21, 58–65. [Google Scholar] [CrossRef]
  87. Xu, L.; Geng, G.; Shi, M.; Lin, S. Pipe network 3D visualization service architecture. In Proceedings of the 2008 IEEE Congress on Services-Part I, Honolulu, HI, USA, 6–11 July 2008; pp. 495–502. [Google Scholar]
  88. Di Battista, G.; Kangassalo, H.; Tamassia, R. Definition libraries for conceptual modeling. Data Knowl. Eng. 1989, 4, 245–260. [Google Scholar] [CrossRef]
  89. Park, S.-E.; Choi, S.-W.; Lee, E.-B. Development of digital rules for optimal auto-routing design of pipe. In Proceedings of the Life-Cycle of Structures and Infrastructure Systems (IALCCE 2023), Milan, Italy, 2–6 July 2023; pp. 3332–3339. [Google Scholar] [CrossRef]
  90. Eyeshot. Devdept. Available online: https://www.devdept.com/products (accessed on 20 February 2024).
  91. Ghosh, R.; Garcia-Luna-Aceves, J. Automatic routing using multiple prefix labels. In Proceedings of the 2012 IEEE Global Communications Conference, Santa Cruz, CA, USA, 3 December 2012; pp. 20–25. [Google Scholar]
  92. Bian, X.; Lin, Y.; Dong, Z. Auto-routing methods for complex ship pipe route design. J. Ship Prod. Des. 2022, 38, 100–114. [Google Scholar] [CrossRef]
  93. Noto, M.; Sato, H. A method for the shortest path search by extended Dijkstra algorithm. In Proceedings of the Smc 2000 Conference Proceedings. 2000 IEEE International Conference on Systems, Man, and Cybernetics. ‘Cybernetics Evolving to Systems, Humans, Organizations, and Their Complex Interactions’, Nashville, TN, USA, 8–11 October 2000; pp. 2316–2320. [Google Scholar]
  94. Zhou, P.; Xie, Z.; Zhou, W.; Tan, Z. A Heuristic Integrated Scheduling Algorithm Based on Improved Dijkstra Algorithm. Electronics 2023, 12, 4189. [Google Scholar] [CrossRef]
  95. Microsoft. Learn C#. Available online: https://dotnet.microsoft.com/en-us/learn/csharp (accessed on 15 December 2023).
  96. Microsoft. Versions Compatibility. Available online: https://learn.microsoft.com/en-us/dotnet/framework/migration-guide/version-compatibility (accessed on 15 December 2023).
  97. Microsoft. Windows. Available online: https://www.microsoft.com/en-us/windows/get-windows-11 (accessed on 15 December 2023).
  98. Nvidia. RTX 4060. Available online: https://www.nvidia.com/en-us/geforce/ (accessed on 16 December 2023).
  99. AWS. What Is IDE (Integrated Development Environment?). Available online: https://aws.amazon.com/what-is/ide/?nc1=h_ls (accessed on 16 December 2023).
  100. Microsoft. Visual Studio. Available online: https://visualstudio.microsoft.com/ (accessed on 16 December 2023).
  101. Citrix. Reference Architecture for on-Premises Deployments. Available online: https://docs.citrix.com/en-us/xenmobile/server/advanced-concepts/xenmobile-deployment/reference-architecture-on-prem.html (accessed on 16 December 2023).
  102. Menascé, D.A.; Gomaa, H. A method for design and performance modeling of client/server systems. In Proceedings of the IEEE Transactions on Software Engineering, Fairfax, VA, USA, 11 November 2000; Volume 26, pp. 1066–1085. [Google Scholar]
  103. Grajewski, M.; Hermann, M.; Oleschuk, R.; Verpoorte, E.; Salentijn, G.I. Leveraging 3D printing to enhance mass spectrometry: A review. Anal. Chim. Acta 2021, 1166, 338332. [Google Scholar] [CrossRef]
  104. Amazon. What Is an API? Available online: https://aws.amazon.com/ko/what-is/api/ (accessed on 21 February 2024).
  105. TechTarget. What Is a Software Development Kit (SDK)? Available online: https://www.techtarget.com/whatis/definition/software-developers-kit-SDK (accessed on 11 March 2024).
  106. Progress Software. Integration Tools to Get the Most out of Data. Available online: https://www.progress.com/datadirect-connectors (accessed on 11 March 2024).
  107. Bonomolo, M.; Di Lisi, S.; Leone, G. Building Information Modelling and Energy Simulation for Architecture Design. Appl. Sci. 2021, 11, 2252. [Google Scholar] [CrossRef]
  108. Butpheng, C.; Yeh, K.-H.; Xiong, H. Security and Privacy in IoT-Cloud-Based e-Health Systems-A Comprehensive Review. Symmetry 2020, 12, 1191. [Google Scholar] [CrossRef]
  109. Autodesk. Navisworks. Available online: https://www.autodesk.co.kr/products/navisworks/overview?term=1-YEAR&tab=subscription (accessed on 15 December 2023).
  110. Bowman, D.A.; Kruijff, E.; LaViola, J.J.; Poupyrev, I. An introduction to 3-D user interface design. Presence 2001, 10, 96–108. [Google Scholar] [CrossRef]
  111. Qian, X.-L.; Ren, T.; Wang, C.-E. A survey of pipe routing design. In Proceedings of the 2008 Chinese Control and Decision Conference, Yantai, China, 2–4 July 2008; pp. 3994–3998. [Google Scholar]
  112. Valero-Carreras, D.; Alcaraz, J.; Landete, M. Comparing two SVM models through different metrics based on the confusion matrix. Comput. Oper. Res. 2023, 152, 106131. [Google Scholar] [CrossRef]
  113. AVEVA. Engineering the Plant of the Future. Available online: https://www.powermag.com/wp-content/uploads/2021/11/whitepaper-engineering-the-plant-of-the-future-en.pdf (accessed on 22 February 2024).
  114. Khaleel, M.; Ahmed, A.A.; Alsharif, A. Artificial Intelligence in Engineering. Brill. Res. Artif. Intell. 2023, 3, 32–42. [Google Scholar] [CrossRef]
  115. United-Bim. What Are BIM Dimensions–3D, 4D, 5D, 6D, and 7D BIM. Available online: https://www.united-bim.com/what-are-bim-dimensions-3d-4d-5d-6d-7d-bim-explained-definition-benefits/ (accessed on 19 February 2024).
Figure 1. The overall research processes.
Sustainability 16 02770 g001
Figure 2. Development process of piping auto-routing model.
Sustainability 16 02770 g002
Figure 3. The extraction process of drawing data is applied with digital image processing.
Sustainability 16 02770 g003
Figure 4. Process of configuring a line topology set (LTS).
Sustainability 16 02770 g004
Figure 5. A sample diagram of a P&ID for LTS. LTS1 is shown as orange dashed lines, connecting between vessels. LTS2 is represented by green dashed lines as bypass lines. LTS3 is depicted as blue dashed lines, serving as branch lines. LTS4 is illustrated with purple arrows, indicating lines leading to other diagrams.
Sustainability 16 02770 g005
Figure 6. Process of arranging plant information in a 3D model.
Sustainability 16 02770 g006
Figure 7. Equipment drawings and 3D layout data inputted in Excel file format for 3D modeling.
Sustainability 16 02770 g007
Figure 8. Optimal piping route design algorithm for the ARS.
Sustainability 16 02770 g008
Figure 9. Line priority logic diagram during piping design.
Sustainability 16 02770 g009
Figure 10. The process of the interference avoidance algorithm.
Sustainability 16 02770 g010
Figure 11. Result of auto-routing implementation in ARS.
Sustainability 16 02770 g011
Table 1. Overview of the prior literature on auto-routing.
CategoryResearch GoalProposed MethodsYearAuthors
Digital
Image
Processing
To discuss recognition strategiesRepresentation, description, classification2000Cordella et al. [24]
To generate MathML images from extracted math imagesMathematical Information Retrieval2014Nazemi et al. [25]
To automatically extract text lines from imagesSeam Carving Method2014Saabni et al. [26].
To approach junction detection and characterizationJunction Detection and Characterization2014Pham et al. [27]
To detect novel text using color clusteringColor Clustering Algorithm2014Yan et al. [28]
To detect and recognize text in natural imagesEnd-to-End Scene Text Recognition2014Shi et al. [29]
To identify and compare stages in text detection and recognitionStepwise and Integrated Method2017Kulkarni et al. [30]
To detect and recognize text in video framesRecurrent Neural Network (RNN)2017Mittal et al. [31]
To detect symbols in drawings for semi-automatic and heuristic methodsSemi-automatic and heuristic methods2018Elyan et al. [32]
To recommend a new system for data-based digital drawingAutomatically Digitized Drawings2019Kang et al. [33]
To detect P&ID information for the use of deep-learning technologyAlex-Net and Connect Text Proposal Network2019Yu et al. [34]
To process and analyze complex engineering drawings.Advanced Bounding-box Detection and GAN2020Elyan et al. [35]
To detect geological map symbols and real-time legendDeep CNN and GNN2021Guo et al. [36]
To propose an extract and classify method in floorplan imagesRegion Adjacency Graph and GNN2021Renton et al. [37]
To detect curved and vertical texts from a real-life imageCNN and Local Word Direction Pattern2021Naiemi et al. [38]
To recognize the symbols of different sizes in high-density P&IDGFL Method and Tesseract2021Kim et al. [39]
To increase processing by replacing the manual inspection processRaster Pre-Processing and GNN2022Xie et al. [40]
To detect natural text and recognize an incorporated multi-channelMC-MSER2022Tong et al. [41]
To solve reuse information to search contentOpenCV based J&M Model2022Kohli et al. [42]
To discover a novel character from historical documentsLabel to Prototype Learning2023Liu et al. [43]
Plant 3D Model
layout
To solve the 2D and 3D matching problem in a plantCalc matching degree 2–3 dimensions2017Wen et al. [44]
To solve the 3D pipe routing problem under thermal expansionMini Zinc model2017Belov et al. [45]
To develop a specific geometric representationMaximal Disjoint Ball Decomposition2020Chen et al. [46]
To generate stylized line images from 3D modelsConvolutional Neural Network2020Uchida et al. [47]
To recognize the object from a laser-scanned point cloud modelElbow recognition method2020Kim et al. [48]
To integrate P&ID and 3D CAD into a digital plant modelPCF source information2020Sierla et al. [49]
To remove a bottleneck in 3D reconstruction3D shape retrieval from Point Cloud2021Kim et al. [50]
To enhance the discriminative ability of shape representationPart-based Recurrent Multi-view2021Jin et al. [51]
To retrieve 3D shapes based on 2D imagesCross-domain Learning Network2021Nie et al. [52]
To alleviate piping vibrationWave Approach and Genetic Algorithms2021Fu et al. [53]
To provide the application of 3D modeling techniquesOrthographic view pictorial rendering2021Parisher et al. [54]
To manage and maintain a system for use in 3D piping systemsRazer Scan Point Cloud2022Pan et al. [55]
To enhance the semantic labeling accuracyMarkov Random Field2022Peraz-perez et al. [56]
To classify and retrieve 3D CAD manufacturing reuseBoundary representation and GCN2023Hou et al. [57]
To reconstruct ready-to-use 3D CAD modelPattern matching and loop detection2023Zang et al. [58]
3D tools for use in onshore plants Intergraph SmartPlant3D (SP3D)2023Hexagon [59]
3D tools for offshore and power plantsEverything3D (E3D)2023AVEVA [60]
Auto
Routing
Systems
To propose a technique for automatic obstacle avoidanceLeast Cost Path and Laplacian algorithm2017Kang et al. [61]
To improve ACO for a semi-submersible production platformImproved ant colony algorithms2019Wu et al. [62]
To find the shortest route between objectivesSimulated annealing2019Grabusts et al. [63]
To seek the near-optimal paths for constraints and objectivesA-Star and Generic algorithm2020Dong et al. [64]
To require a lower search for pipe routing.Jump Point Search2020Min et al. [65]
To identify tank and pump from P&ID and 3D CADGraph matching algorithm2020Sierla et al. [66]
To solve the surface of the optimal routing planDelaunay triangulation2020Luo et al. [67]
To find the shortest route of the cost of pipingDijkstra and Genetic algorithm2022Gunawan et al. [68]
To optimize the ship pipe route quickly and accuratelyDiscrete Hybrid Differential Evolution2022Lin et al. [69]
To compare the new layout plan with the existing pipelinesAR and Grid-based path-planning2022Tsai et al. [70]
To propose a navigable area for the shortest-distance passageA-star algorithm2022Lee et al. [71].
To propose a design framework for the optimal routing of a pipelineMulti-objective optimization2022Skretas et al. [72]
To briefly present routing systems applied on smart warehousesDijkstra algorithm2023Vivaldini et al. [73]
To construct and enhance the design of a ship’s pipe routingATM and AEM2023Ha et al. [74]
To develop a methodology for pipe-routing modificationsReinforcement Learning2023Kim et al. [75]
Table 2. Line topology set database table.
IDLine NoSize1 TypeFromToPID No
LTS1200-P12-24116-CU06-H2002 E2EC-103/S01V-247/S02PID-013
LTS2200-P12-24116-CU06-H (3 BP)2004 B2BTEE1TEE2PID-013
LTS3200-P12-24117-CU06-H200B2BTEE3TEE4PID-013
LTS4200-P12-24120-CU06-H2005 X2BOPCTEE5PID-013
1 Type: line topology type; 2 E2E: equipment to equipment; 3 BP: bypass line; 4 B2B: branch to branch; 5 X2B: OPC to branch.
Table 3. The representative data type of 3D model information.
CategoryInput DataDescription
Tag noNumberAssign a tag number for the equipment
ParameterDiameterA horizontal line segment from one end to the other end in a circular shape
LengthHeight of an object
Head ratioRatio of top and body of equipment
Support typeSupport structure used for maintaining facility stability
Leg/skirt sizeSize or length of a facility leg
Support heightSize or length of facility support
Number of legsNumber of legs supporting the bottom of the facility
CV areaWhether a control valve is installed around the facility (Y/N)
Platform viewWhether a safety platform is installed at the top of the facility (Y/N)
FoundationWhether facility supporting foundation is installed (Y/N)
MH countAccess structure for maintenance of facilities
Instrument typeType of instruments installed on facilities
Instrument thickThickness of instrument housing installed on facilities
WeightFacility weight
PositionAxisPosition in a 3D space of facilities
Angle(degree)The degree to which the facility is slanted
ColorFacility color
TransparentFacility transparency
WBSLevel 1~5Work priority of the facility
Table 4. Sorting by cost priority in line information.
Line NumberCost
Priority
From
Equipment
From_LineTo EquipmentTo_LineMain LineFluid TypeLine_
Length
U01-1 CWS-1024235.98RACK-01 RACK-01 U01-CWS-10242 U985
U01-P-1025235.98RACK-01 RACK-01 U01-P-10253 P1250
U01-P-1022163.04RACK-01 RACK-01 U01-P-1022P554
U01-4 CWR-1023103.79RACK-02 U01-CWR-1025U01-CWS-1024U970
U01-CWS-1023103.79 U01-CWS-1024RACK-02 U01-CWS-1024U760
U01-CWS-1026103.79 U01-CWS-12045 TK-245 U01-CWS-1024U698
U01-CWR-1027103.79TK-245 U01-CWR-1025U01-CWS-1024U855
1 CWS: Chilled water supply; 2 U: utility; 3 P: process; 4 CWR: chilled water return; 5 TK: Tank.
Table 5. Sorting by length difference in line information.
Line NumberCost
Priority
From
Equipment
From_LineTo
Equipment
To_LineMain LineFluid TypeLine_
Length
U01-P-1025235.98RACK-01 RACK-01 U01-P-1025P1250
U01-CWS-1024235.98RACK-01 RACK-01 U01-CWS-1024U985
U01-P-1022163.04RACK-01 RACK-01 U01-P-1022P554
U01-CWR-1023103.79RACK-02 U01-CWR-1025U01-CWS-1024U970
U01-CWS-1023103.79 U01-CWS-1024RACK-02 U01-CWS-1024U760
U01-CWS-1026103.79 U01-CWS-1204TK-245 U01-CWS-1024U698
U01-CWR-1027103.79TK-245 U01-CWR-1025U01-CWS-1024U855
Table 6. Applying cost priority to the branch line.
Line NumberCost
Priority
From
Equipment
From_LineTo
Equipment
To_LineMain LineFluid TypeLine_
Length
U01-P-1025235.98RACK-01 RACK-01 U01-P-1025P1250
U01-CWS-1024235.98RACK-01 RACK-01 U01-CWS-1024U985
U01-P-1022163.04RACK-01 RACK-01 U01-P-1022P554
U01-CWR-1023103.79RACK-02 U01-CWR-1025U01-CWS-1024U970
U01-CWR-1027103.79TK-245 U01-CWR-1025U01-CWS-1024U855
U01-CWS-1023103.79 U01-CWS-1024RACK-02 U01-CWS-1024U760
U01-CWS-1026103.79 U01-CWS-1204TK-245 U01-CWS-1024U698
Table 7. Development environment of auto-routing system (ARS).
Programming Language C# (.NET Framework 4.8)
Operation System Windows 11By Microsoft
HardwareCPUAMD Ryzen 5 7600X RGB
(5.3 GHz, 32 MB L3 Cache, 6core)
By Advanced Micro Devices (AMD)
Graphic cardNVIDIA GeForce RTX 4060
(8GB GDDRX)
By NVIDIA
1 IDE Visual StudioBy Microsoft
3D engine Eyeshot By devDept Software
Database MSSQL 2016By Microsoft
Server infra on-premise
1 IDE: Integrated Development Environment.
Table 8. Comparison of the information on SMEs between ARS-BoM and AB-BoM.
Expert CodeAffiliationAreas of ExpertiseYear of Experience
AD companyProcess engineering25
BD companyElectrical and control12
CD companyMechanical engineering17
DP companyMechanical engineering11
EP companyMechanical engineering12
FP companyMechanical engineering17
GP companyProcess engineering22
Table 9. Piping BoM for as-built construction.
1 DWG_NOItem TypeLine_NOFluidPipe 2 THKQ’tyWeight (kg)
ID-3 DW-020103-01PIPEU01-CWR-1025DW4 SCH10S2M10.09
ID-DW-020103-01PIPEU01-CWS-1024DWSCH10S1M3.2
ID-DW-020103-02FITTING-DWSCH10S6EA4.6
ID-DW-020103-02PIPEU01-CWR-1023DWSCH4022M119
1 DWG: drawing; 2 THK: thickness; 3 DW: distilled water; 4 SCH: schedule.
Table 10. Performance evaluation results for the ARS.
Testing TargetFactorPerformance EvaluationMatching Accuracy (%)
AB-BoMARS-BoM
PipeWeight (kg)247,33844,61798.9
Quantity (m)18,82515,98184.9
FittingWeight (kg)31,54231,45999.7
Quantity (EA)6936582283.9
Table 11. Performance evaluation results for ARS—case 2.
Testing TargetFactorPerformance Evaluation for RefineryMatching Accuracy (%)
AB-BoMARS-BoM
PipeWeight (kg)368,748364,88499.0
Quantity (m)67,95367,52899.4
FittingWeight (kg)29,18728,89899.0
Quantity (EA)5401526897.5
Table 12. Comparison of the time required for 3D modeling between the engineer and the ARS.
Time Required for 3D Modeling
Per Facility (h)Total Time for 11,150 Facilities (h)Total Time for 11,150 Facilities (day)
Manual design by engineers0.557524
ARS0.171928
Table 13. Comparison of the time required for pipeline routing between engineers and the ARS.
Time Required for 3D Modeling
Per Facility (h)Total Time for 11,150 Facilities (h)Total Time for 11,150 Facilities (day)
Manual design by engineers0.5172772
ARS-452
Disclaimer/Publisher’s Note: The statements, opinions and data contained in all publications are solely those of the individual author(s) and contributor(s) and not of MDPI and/or the editor(s). MDPI and/or the editor(s) disclaim responsibility for any injury to people or property resulting from any ideas, methods, instructions or products referred to in the content.

