

Coupling and Coordination Relationship of Economic–Social–Natural Composite Ecosystem in Central Yunnan Urban Agglomeration
Abstract
1. Introduction
2. Materials and Methods
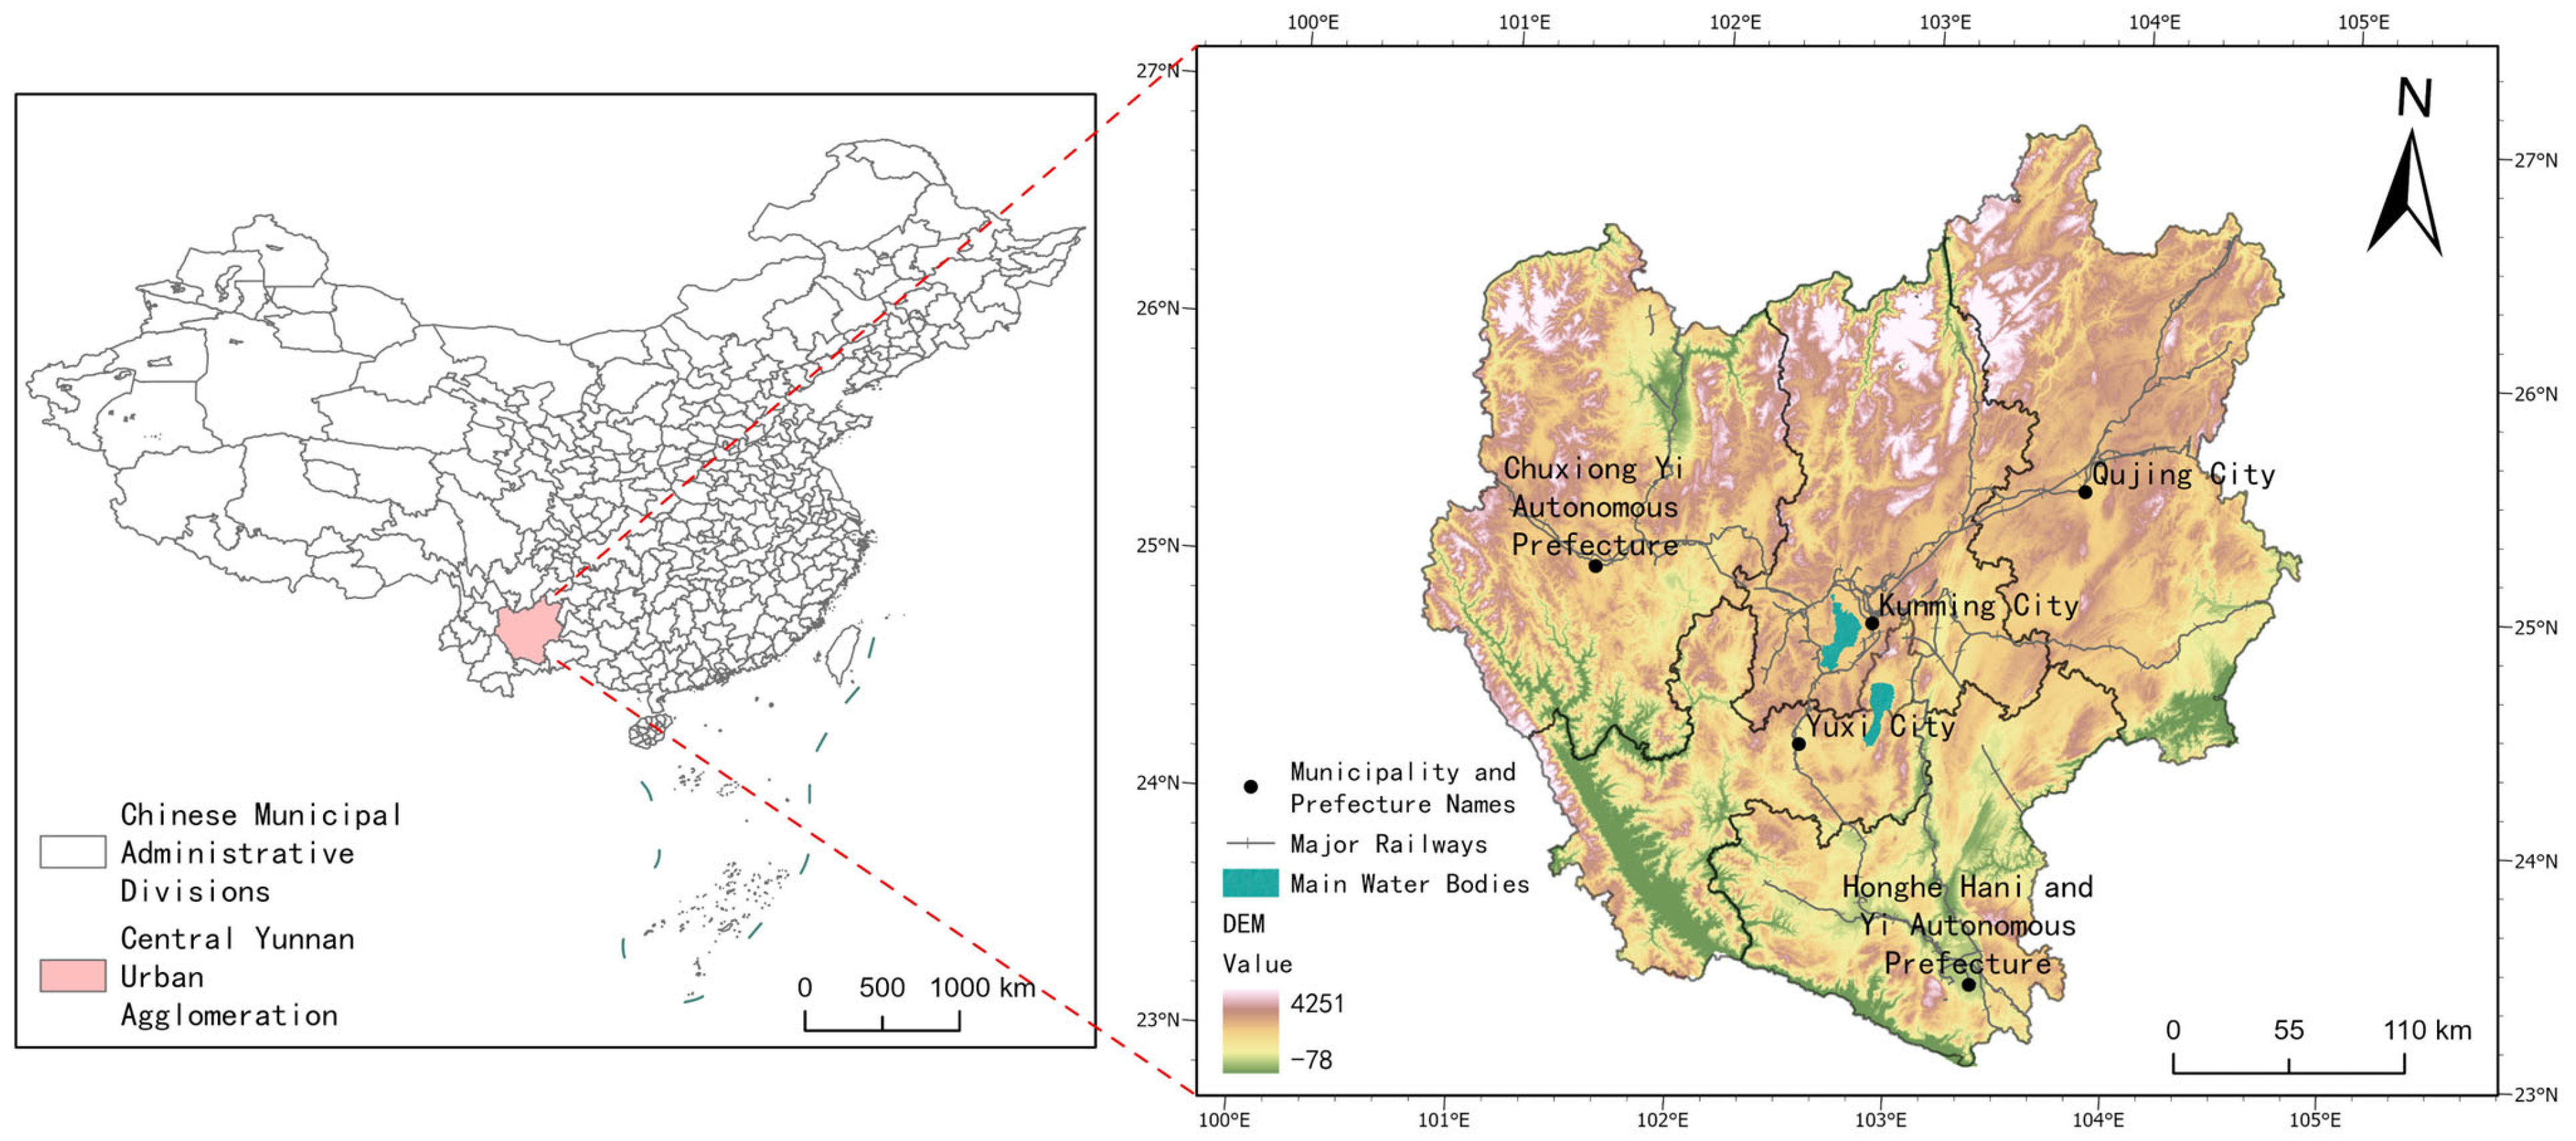
2.1. Overview of the Study Area
2.2. Data Sources
2.3. Construction of Indicator System and Determination of Weights
2.4. Methods for Assessing the Level of Development of Subsystems
2.4.1. Methodology for Assessing the Level of Economic and Social Development
2.4.2. Methodology for Evaluating the Level of Ecological Services of Natural Subsystems
- Water conservation services
- 2.
- Soil conservation services
- 3.
- Carbon sequestration services
- 4.
- Habitat quality
- 5.
- Integrated ecosystem services
2.4.3. Coupling Coordination Model
3. Results
3.1. Spatio-Temporal Differentiation Characteristics of Economic–Social–Ecological Subsystem Development
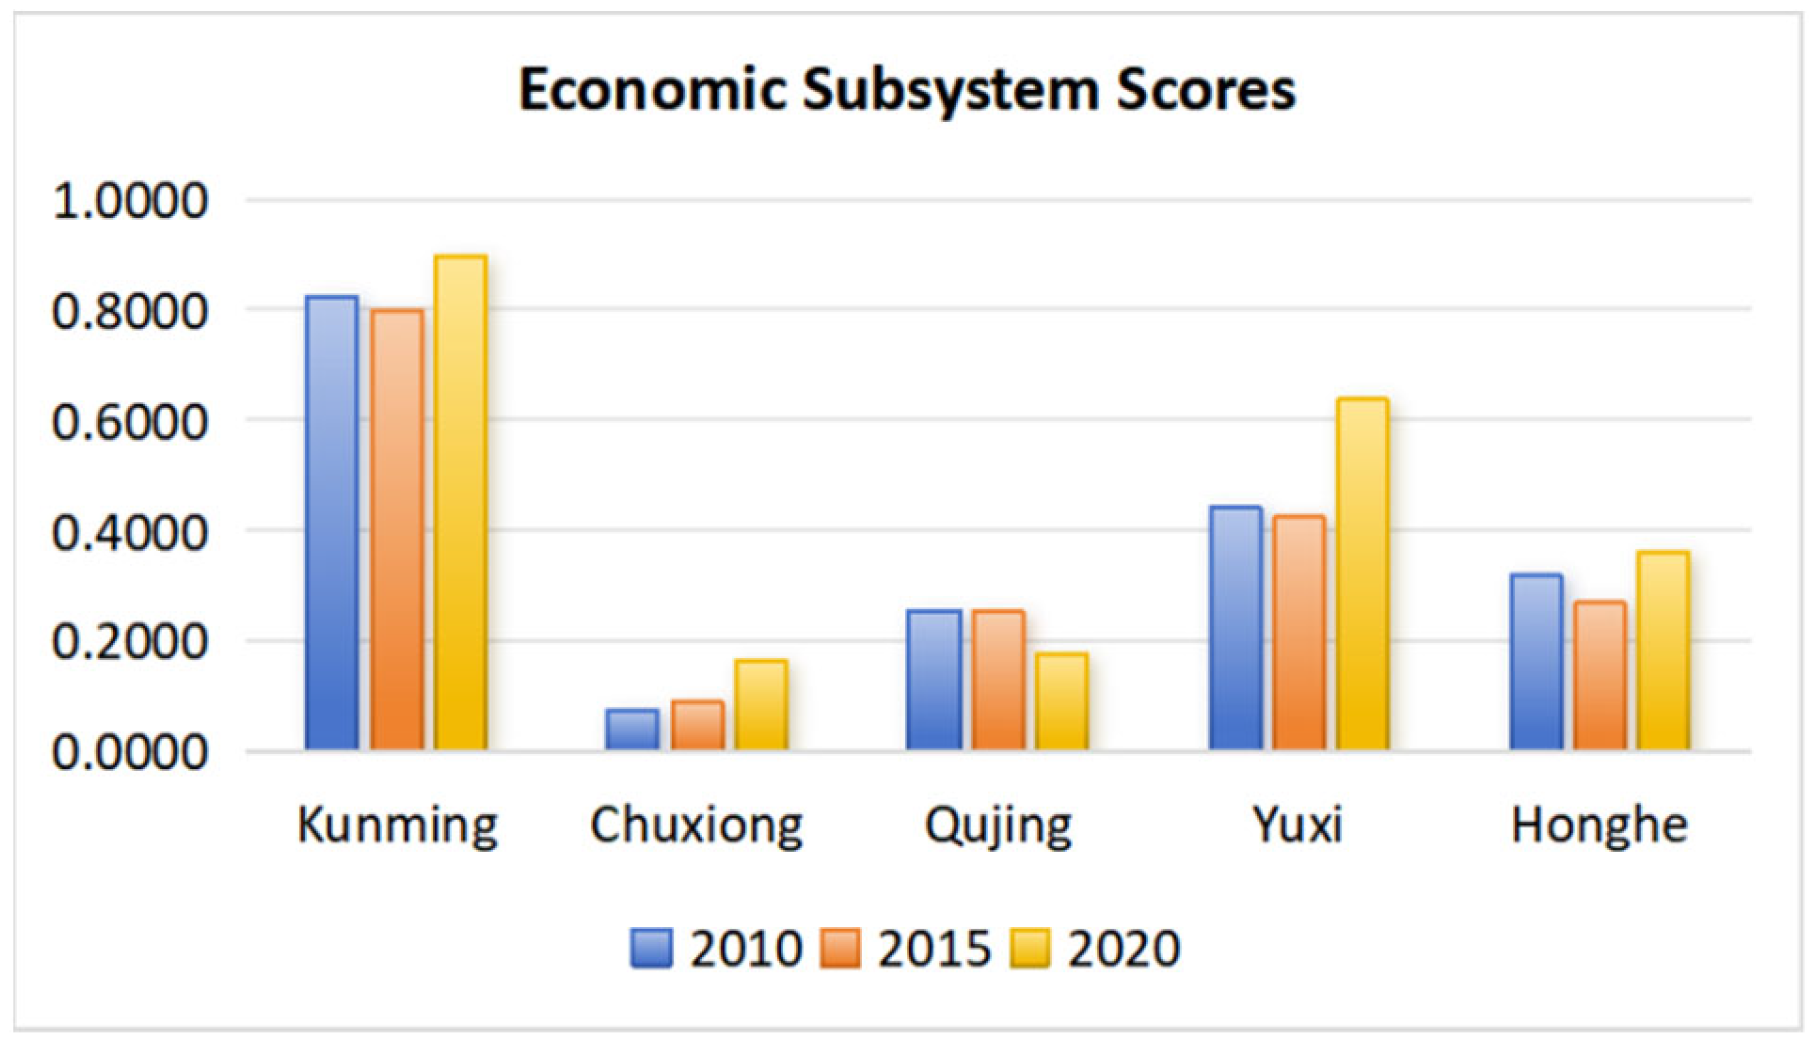
3.1.1. Spatio-Temporal Differentiation Characteristics of Economic Subsystem Development
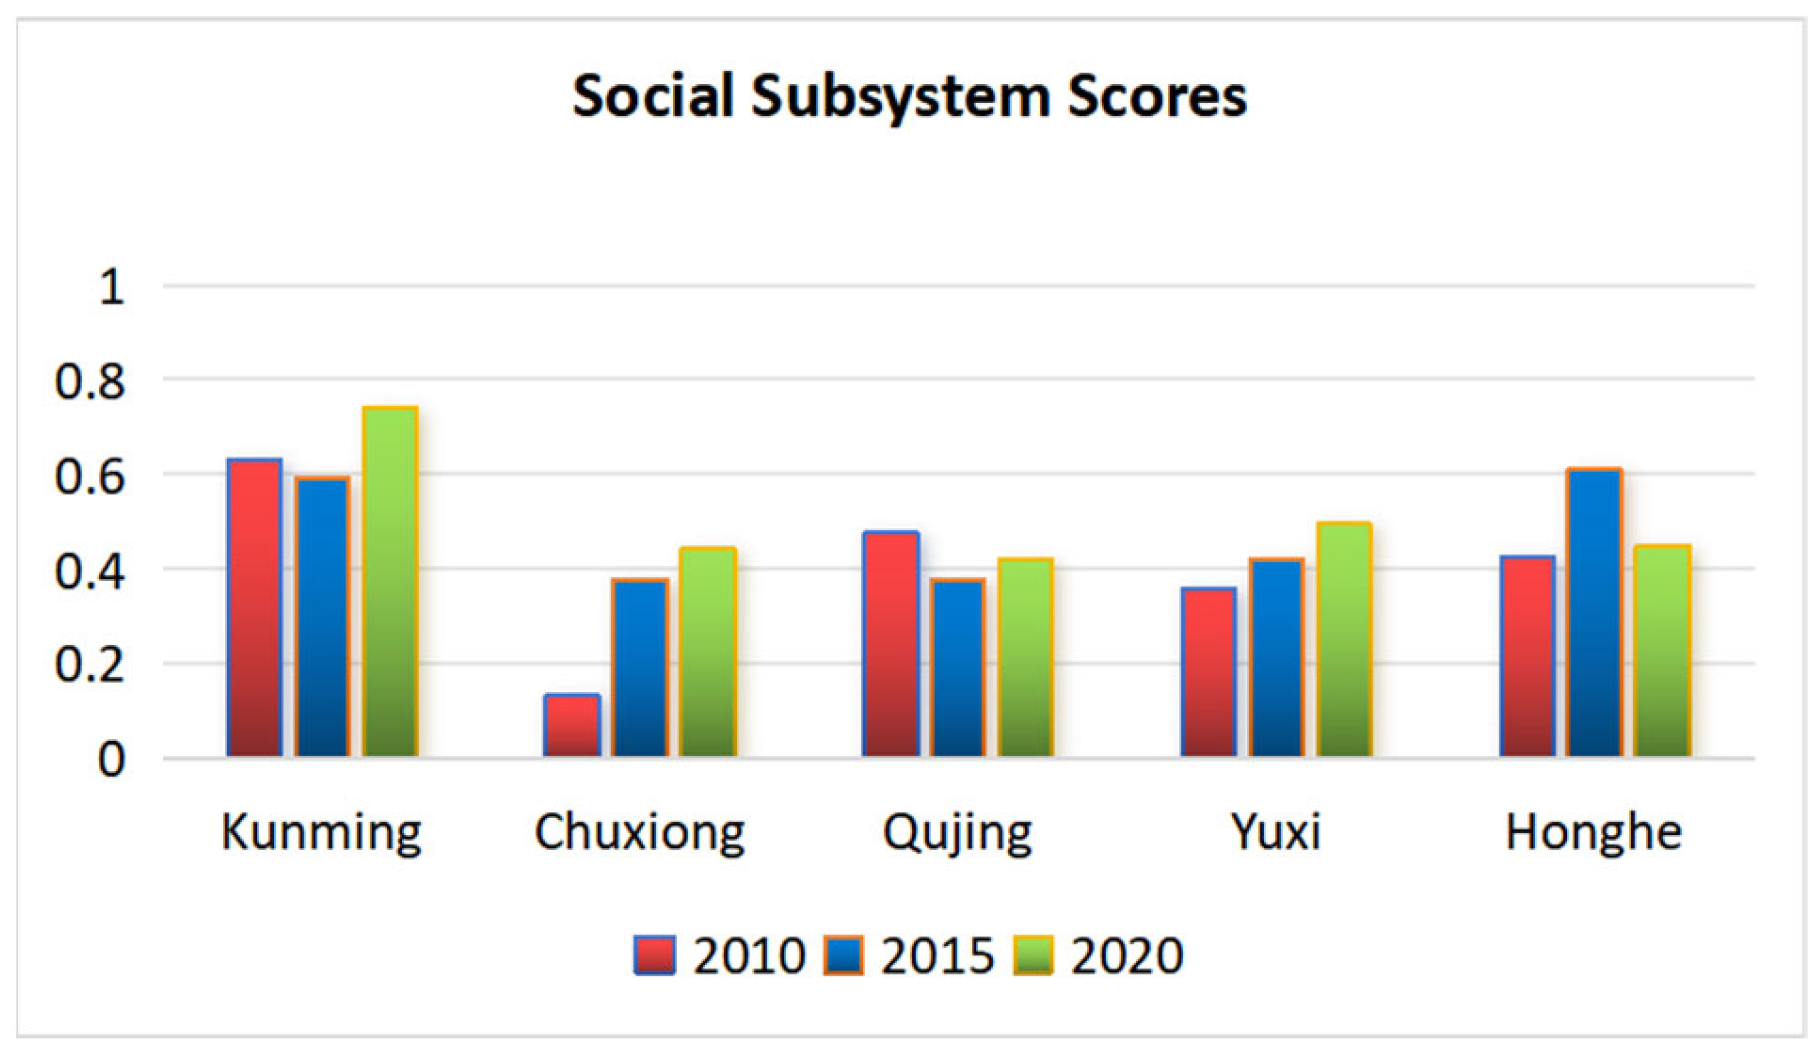
3.1.2. Spatio-Temporal Differentiation Characteristics of Social Subsystem Development
3.1.3. Spatio-Temporal Differentiation Characteristics of Natural Subsystem Development
- (i).
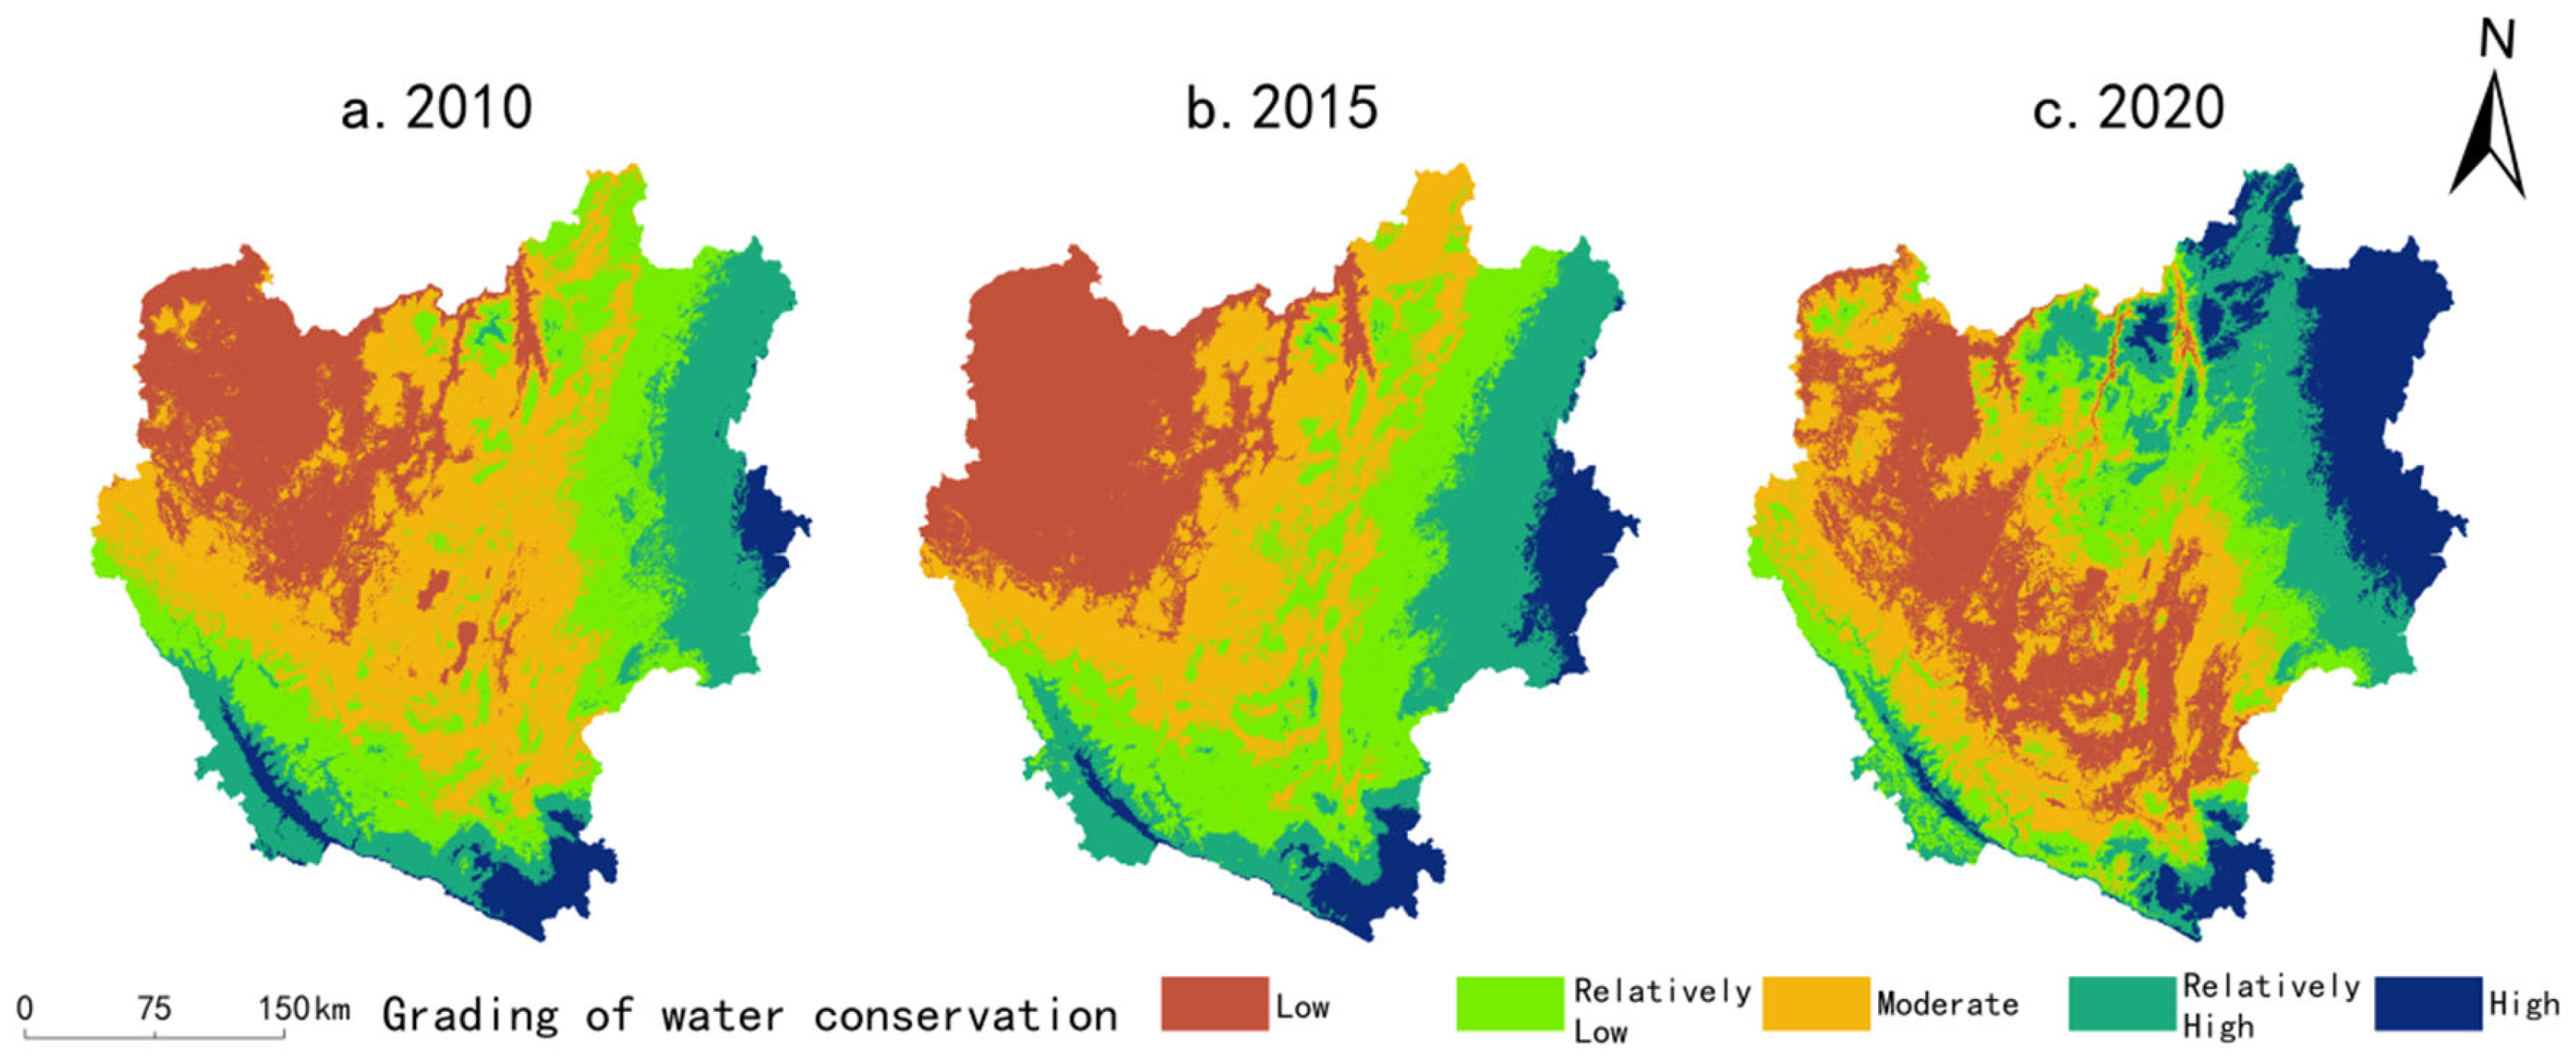
- Water conservation services
- (ii).
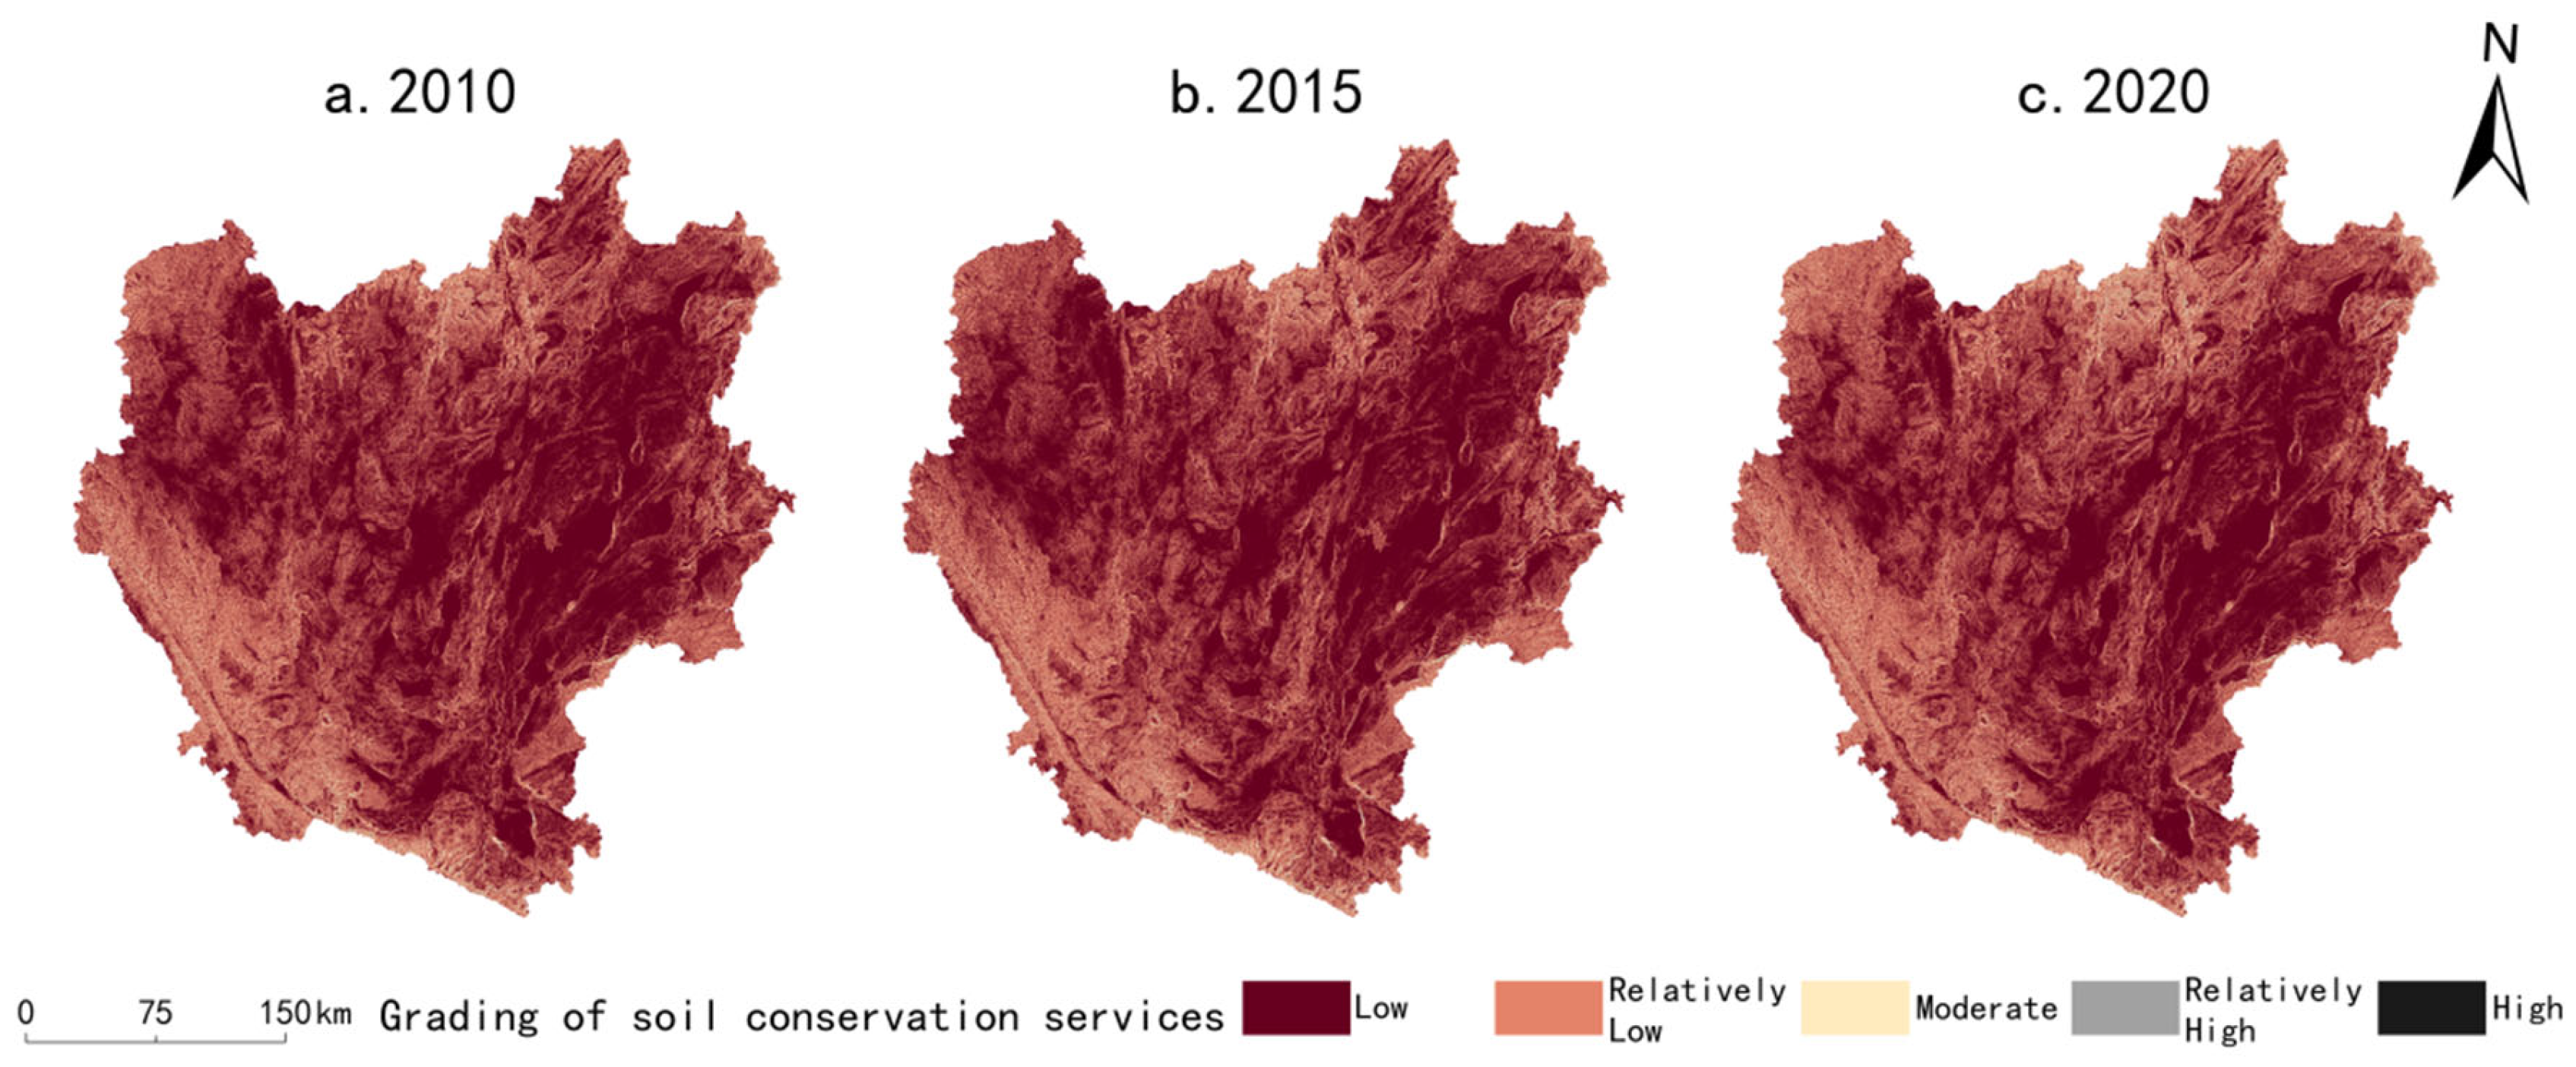
- Soil conservation services
- (iii).
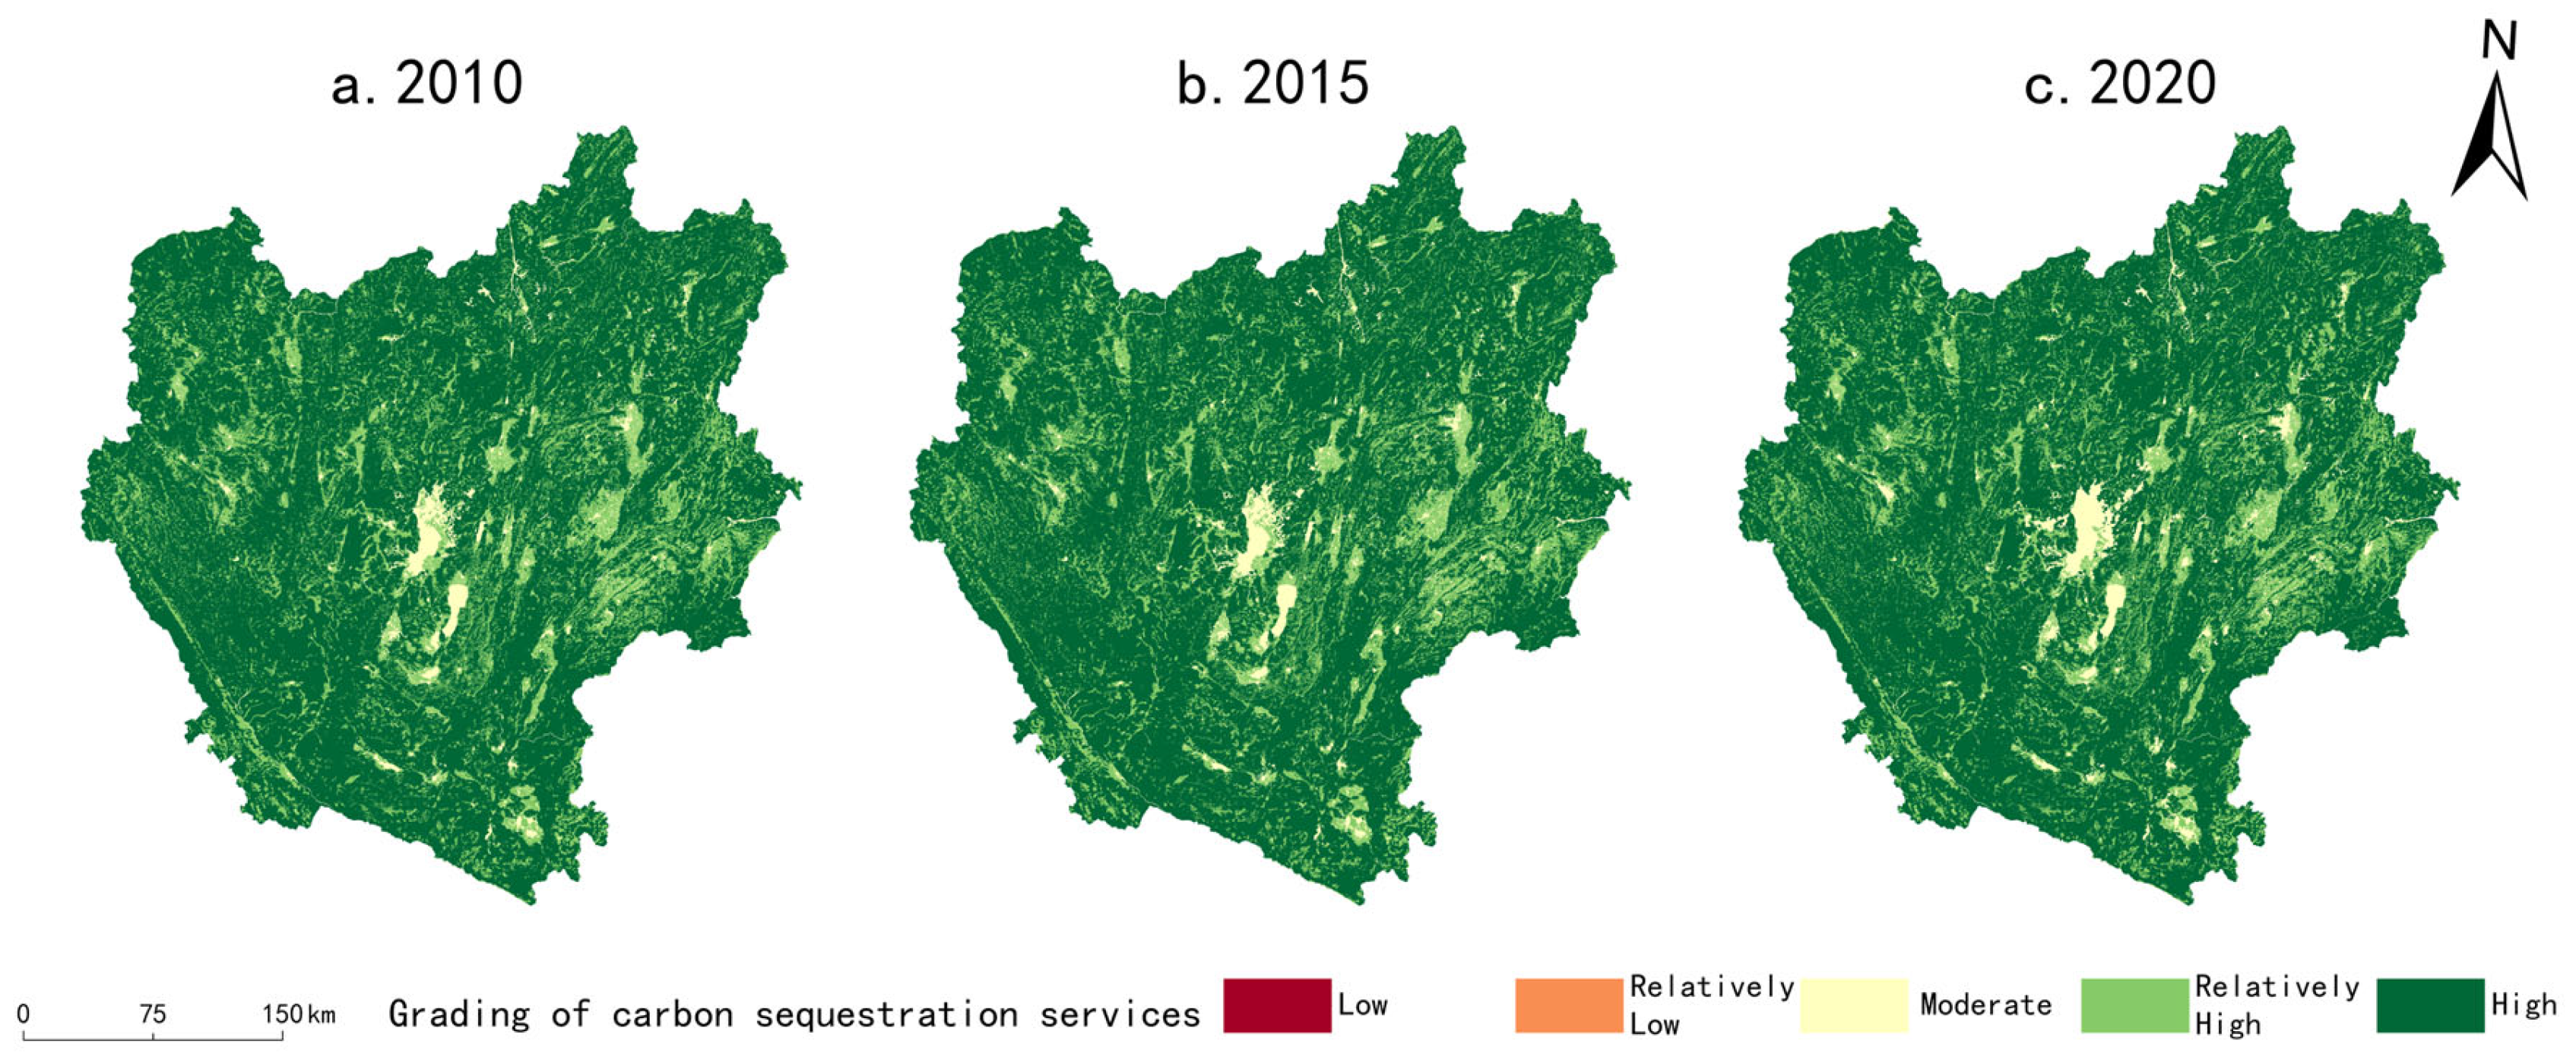
- Carbon sequestration services
- (iv).
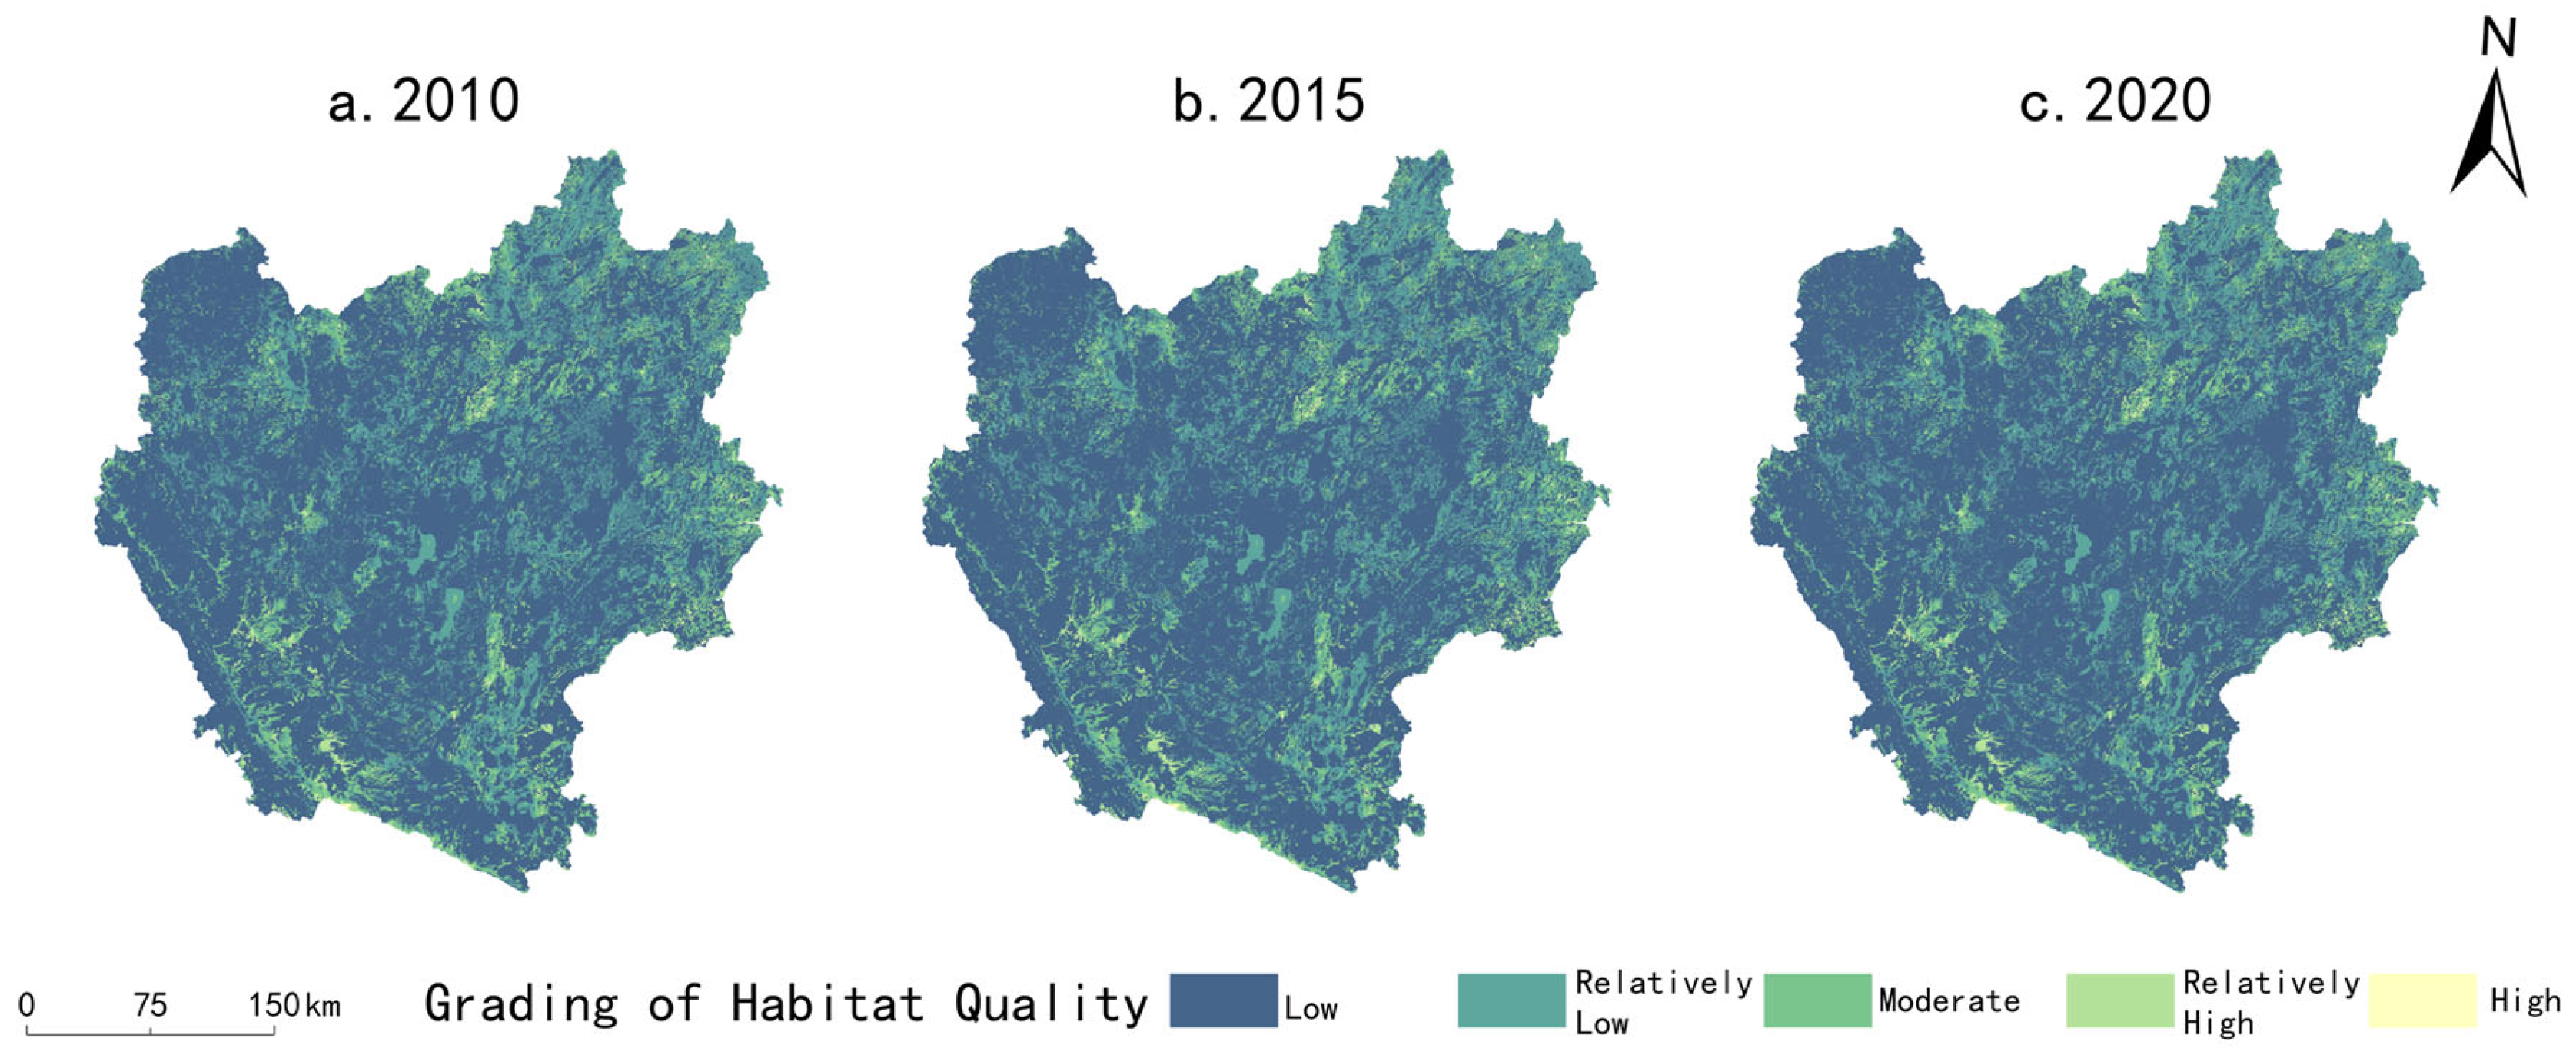
- Habitat quality
- (v).
- Integrated ecosystem services
3.2. Coupling and Coordination Relationships in Composite Ecosystems
3.2.1. Status of Development of Coupling in Composite Ecosystems
3.2.2. Characteristics of Spatial and Temporal Variability in Coordination in Composite Ecosystems
4. Discussion
4.1. Discussion
4.2. Future Prospects
5. Conclusions
- (i).
- From 2010 to 2020, the economic subsystem score of the Central Yunnan Urban Agglomeration increased from 0.3825 in 2010 to 0.4463 in 2020, representing a growth rate of 16.7%. Similarly, the social subsystem score increased from 0.4043 in 2010 to 0.5094 in 2020, indicating an overall upward trend for both subsystems. In terms of spatial distribution, they displayed a pattern of outward expansion, radiating from the core city of Kunming City. Nevertheless, low-level areas still exist in large numbers, especially in Chuxiong Prefecture. The overall level of the social subsystem is better than that of the economic subsystem, but the lack of sub-centers and the uneven development of the municipalities and states are more evident.
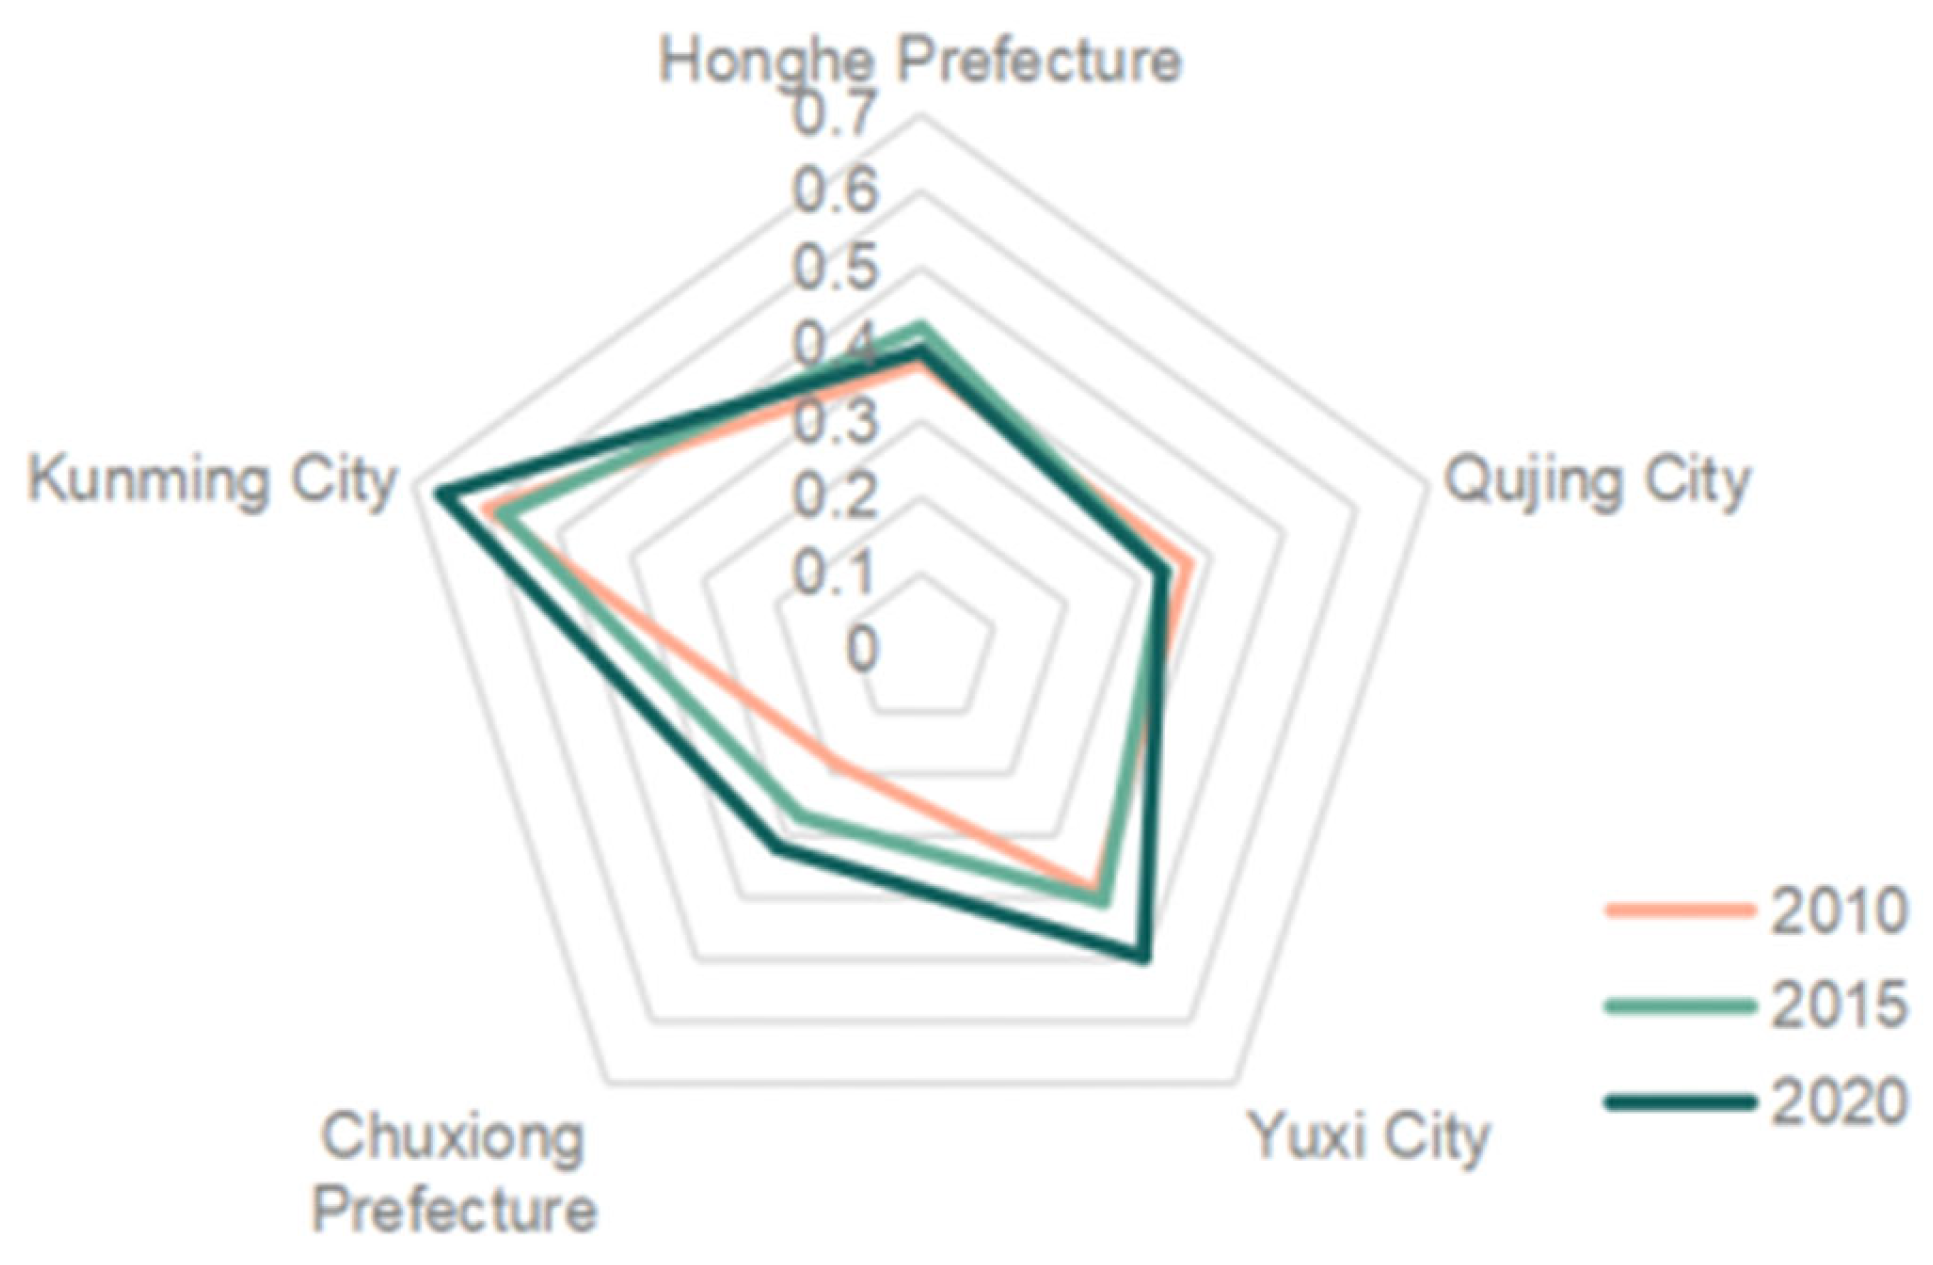
- (ii).
- From 2010 to 2020, water conservation and soil conservation services in the central Yunnan urban agglomeration experienced fluctuating trends of increases and then decreases. Carbon sequestration services remained relatively stable, whereas habitat quality services showed a declining trend. The areas of extremely high importance for ecosystem service functions were primarily distributed in the southwest edge and northeast region of the study area, while areas of high and moderate importance were mainly distributed in the northwest and southwest regions, respectively. Areas of general importance were primarily located in the central region of the study area. In the future, source prevention should be prioritized as the fundamental strategy for natural resource conservation.
- (iii).
- From 2010 to 2020, the coupling degree of the composite ecosystem within the central Yunnan urban agglomeration consistently exceeded 0.8, signifying a high level of overall coupling. The interactions between economic, social, and ecological subsystems are strong and significant. Changes in the two-by-two relationships of the three subsystems were largely consistent with the trend of changes in the coupling of the composite ecosystem.
- (iv).
- Between 2010 and 2020, the mean coupling coordination of the composite ecosystem in the Central Yunnan Urban Agglomeration increased from 0.5934 in 2010 to 0.6398 in 2020, indicating an overall upward trend. Only Kunming City achieved an intermediate barely coordinated status, and barely coordinated and primary coordinated are the main types of urban agglomeration coordination. The lagging subsystems in each municipality were mainly the economic and ecological subsystems.
Author Contributions
Funding
Institutional Review Board Statement
Informed Consent Statement
Data Availability Statement
Conflicts of Interest
References
- Wang, R.; Ouyang, Z. Social-Economic-Natural Complex Ecosystem and Sustainability. Bull. Chin. Acad. Sci. 2012, 27, 337–345+403–404+254. [Google Scholar]
- Zhao, J.; Shi, D. A Framework of China’s High-quality Economic Development. Res. Econ. Manag. 2019, 40, 15–31. [Google Scholar]
- Jiang, T.; Yuan, J. An Analyzing Model System on Population, Resources, Environment and Economics. Syst. Eng. Theory Pract. 2002, 12, 67–72. [Google Scholar]
- Lin, Y.; Yang, P. Research on Rural Human Settlement Environment Based on Composite Ecosystem Theory. In Proceedings of the Spatial Governance for High-Quality Development: Proceedings of the 2021 China Urban Planning Annual Conference, Chengdu, China, 25 September 2021; Volume 16, pp. 1419–1428. [Google Scholar]
- Ma, H.; Yang, J.; Li, Z. Evolution and Driving Mechanism of Temporal and Spatial Patterns of Regulation Services of Urban Complex Ecosystem in Taiyuan. Sci. Geogr. Sin. 2021, 41, 463–472. [Google Scholar]
- Ding, K.; Han, X. Rural landscape planning in hilly areas based on complex ecosystem theory. Ecol. Environ. Sci. 2018, 27, 1335–1342. [Google Scholar]
- Zhou, C.; Feng, X. Analysis and Forecast of Coupling Coordination Development among the Regional Economy-Ecological Environment-Tourism Industry—A Case Study of Provinces Along the Yangtze Economic Zone. Econ. Geogr. 2016, 36, 186–193. [Google Scholar]
- Wang, S.; Fang, C.; Wang, Y. Quantitative investigation of the interactive coupling relationship between urbanization and eco-environment. Acta Ecol. Sin. 2015, 35, 2244–2254. [Google Scholar]
- Fang, C.; Zhou, C. Theoretical analysis of interactive coupled effects between urbanization and eco-environment in mega-urban agglomerations. Acta Ecol. Sin. 2016, 71, 531–550. [Google Scholar] [CrossRef]
- Li, T.; Liao, P. Urbanization Quality over Time and Space as Well as Coupling Coordination of Land, Population and Industrialization in Chongqing. Econ. Geogr. 2015, 35, 65–71. [Google Scholar]
- Li, H.; Yuan, Y. Assessment of Regional Green Finance and Coupled Coordinated Development of the Ecological Environment. Stat. Decis. 2019, 35, 161–164. [Google Scholar]
- Shan, W.; Jin, X. “Production-Living-Ecological” Function Evaluation and Coupling Coordination Analysis of Land Use in Jiangsu Province. Resour. Environ. Yangtze Basin 2019, 28, 1541–1551. [Google Scholar]
- Liu, Y.; Li, R. Analysis of Coupling Degrees of Urbanization and Ecological Environment in China. Journal of Natural Resources. 2005, 1, 105–112. [Google Scholar]
- Liu, F.; Xu, H. Analysis on Spatial- temporal Coupling Coordinate Degree among Population, Land and Economy Urbanization: Based on China Provincial Panel Data. Urban Dev. Stud. 2014, 21, 7–11. [Google Scholar]
- Hu, X.; Hong, W. Coupling Degrees of Land Ecosystem Services and Urbanization of Fuzhou City. Sci. Geogr. Sin. 2013, 33, 1216–1223. [Google Scholar]
- Cong, X.; Huang, Y. Spatial and Temporal Evolution of Coupled Coordination Degree of Ecotourism and Tourism Environment of Jilin Province. Sci. Geogr. Sin. 2019, 39, 496–505. [Google Scholar]
- Sun, H.; Huang, Z. The Spatial Characteristics and Drive Mechanism of Coupling Relationship between Urbanization and Eco-Environment in the Pan Yangtze River Delta. Econ. Geogr. 2017, 37, 163–170+186. [Google Scholar]
- Wang, S.; Cui, Z. Coupling relationship between urbanization and ecological resilience in the Pearl River Delta. Acta Geogr. Sin. 2021, 76, 973–991. [Google Scholar] [CrossRef]
- Zhang, P.; Yang, D. The Coupled Coordination Relationship between Land Urbanization and Population Urbanization—A Case Study of the Central Plains Economic Region. Econ. Geogr. 2017, 37, 145–154. [Google Scholar]
- Chen, Y.; Tian, W. The Coupled Relationship and Spatial Differences between Population Urbanization and Land Urbanization: A Case Study of the Central Plains Urban Agglomeration. Ecol. Econ. 2019, 35, 104–110. [Google Scholar]
- Lin, Y.; Zhao, J. Identification of Territory Space Pattern and Spatio-temporal Evolution Analysis of Urban Agglomeration in Central Yunnan. Trans. Chin. Soc. Agric. Mach. 2019, 50, 176–191. [Google Scholar]
- Zhang, R.; Jiao, H. Coupling and Coordinating between Economic Development and Ecological Environment in the Pan Yangtze River Delta. Resour. Environ. Yangtze Basin 2015, 24, 719–727. [Google Scholar]
- Pan, T.; Wu, S. Spatiotemporal variation of water source supply service in Three Rivers Source Area of China based on InVEST model. Chin. J. Appl. Ecol. 2013, 24, 183–189. [Google Scholar] [CrossRef]
- Liu, G.; Li, G. Study on change in carbon storage and its spatial pattern in Mata Watershed from 1999 to 2016 based on InVEST model. Arid Zone Res. 2021, 38, 267–274. [Google Scholar]
- Zhang, X.; Zhou, J. Analysis on spatial and temporal changes of regional habitat quality based on the spatial pattern reconstruction of land use. Acta Geogr. Sin. 2020, 75, 160–178. [Google Scholar]
- Pan, X.; Shi, P. Ecological risk assessment and identification of priority areas for management and control based on the perspective of ecosystem services equilibrium: A case study of Lanzhou. Acta Sci. Circumstantiae 2020, 40, 724–733. [Google Scholar]
- Yang, L.; Zhang, X. Coupling coordination and interaction between urbanization and eco-environment in ChengYu urban agglomeration, China. Chin. J. Appl. Ecol. 2021, 32, 993–1004. [Google Scholar]
- Zhang, N.; Yang, X. Research on the coupling coordination of water-energy-food system and its temporal and spatial characteristics. China Environ. Sci. 2022, 42, 4444–4456. [Google Scholar]
- Jiang, L.; Bai, L. Coupling and Coordinating Degrees of Provincial Economy, Resources and Environment in China. J. Nat. Resour. 2017, 32, 788–799. [Google Scholar]
- Wang, X. Evolution of Ecosystem Services of Weihe River Basin in ShaanXi Qinling Mountain Based on InVEST Model. Master’s Thesis, Northwest University, Xi’an City, China, 2022. [Google Scholar]
- Yu, H.; Wang, Y. Spatio-temporal variations of ecosystem service value and its spatial heterogeneity mechanism in the Dongjiang River Basin, China. Chin. J. Appl. Ecol. 2023, 34, 2498–2506. [Google Scholar] [CrossRef]
- Yang, L.; Liu, F. Study on temporal and spatial evolution of production-living-ecological space in central Yunnan urban agglomeration based on LUCC. Shanghai Land Resour. 2023, 44, 28–35. [Google Scholar]
- Xiang, D.; Jiang, X. Economic Development of Urban Agglomeration in Central Yunnan Based on Inclusive Green Growth. J. Kunming Univ. Sci. Technol. (Soc. Sci.) 2023, 23, 96–103. [Google Scholar]
- Yan, Y.; Yao, L. Revaluation of ecosystem services in inland river basins of China: Based on meta-regression analysis. Acta Geogr. Sin. 2019, 74, 1040–1057. [Google Scholar]
- Xiang, X.; Zhang, Y. The characteristics of the water-energy-food input-output nexus among China’s national industries. Resour. Sci. 2022, 44, 595–607. [Google Scholar] [CrossRef]
- Zhai, C.; Wang, S. Spatio-temporal difference evolution and scenario simulation of multidimensional well-being in Poyang Lake area based on system dynamics. Acta Ecol. Sin. 2021, 41, 2954–2967. [Google Scholar]
- Zhu, J.; Li, Z. Coupling Coordination Development of Industry-Population-Space in City Cluster of Yangtze River-Delta Region. China Popul. Resour. Environ. 2015, 25, 75–82. [Google Scholar]
- Dong, Z.; Han, Y. Spatiotemporal Evolution and Driving Factors of Urban Quality Development in a Complex Ecosystem: Taking the Seven Major Urban Agglomerations along the Yellow River Basin as Examples. Hum. Geogr. 2021, 36, 96–107. [Google Scholar]


| Data | Source | Preprocessing |
|---|---|---|
| Meteorological data such as temperature, precipitation, actual water pressure, etc. | Weather Science Data Center (http://data.cma.cn (accessed on 7 July 2023)) | To account for inter-annual fluctuations in the data, local annual average meteorological data were selected for the calculations. |
| Potential evapotranspiration | Annual mean potential evapotranspiration was calculated using the Modified-Hargreaves method with refined interpolation. | |
| DEM data | Geospatial Data Cloud (https://www.gscloud.cn (accessed on 8 July 2023)) | The ASTER GDEM 30 m resolution data of the urban agglomeration in central Yunnan were obtained and cropped and spliced by ArcGIS. The watershed boundary was obtained by ArcGIS hydrological analysis. |
| Soil depth data, soil type data, and other soil data such as organic carbon content | Earth System Science Data Sharing Platform, Cold and Arid Regions Science Data Center, China Soil Dataset Based on World Soil Database | PAWC and saturated hydraulic conductivity were calculated using soil properties from the SPAW Hydrology model. |
| Land use data | Center for Resource and Environmental Sciences and Data, Chinese Academy of Sciences (http://www.resdc.cn (accessed on 3 July 2023)) | The time span included 2000, 2015, and 2020, and the resolution was 100 m × 100 m. After data processing and with reference to the national county-level land use status classification system, a land use classification map of the urban agglomeration in central Yunnan was generated. |
| Target Level | System Level | Criterion Level | Indicator Level | Unit | Attribute | Weight |
|---|---|---|---|---|---|---|
| Composite Ecosystem | Economic Subsystem | Economic Development | Per Capita GDP | Yuan | + | 0.1101 |
| Per Capita Disposable Income | Yuan | + | 0.1107 | |||
| Per Capita Local Fiscal Revenue | Yuan | + | 0.1100 | |||
| Per Capita Fixed Asset Investment | Ten thousand yuan | + | 0.1100 | |||
| Economic Structure | The Proportion of the Secondary Sector in GDP | % | + | 0.1121 | ||
| The Proportion of the Tertiary Sector in GDP | % | + | 0.1123 | |||
| Economic Vitality | Fiscal Self-Sufficiency Ratio | % | + | 0.1100 | ||
| Per Capita Retail Sales of Consumer Goods | Yuan per person | + | 0.1100 | |||
| Total Social Labor Productivity | Yuan per person | + | 0.1108 | |||
| Social Subsystem | Population Factors | Permanent Resident Population | people | + | 0.0910 | |
| Natural Population Growth Rate | % | + | 0.0919 | |||
| Living Standards | Average Wages of Urban Non-profit Unit Employees | Yuan | + | 0.0909 | ||
| Per Capita Net Income of Rural Residents | People per square kilometer | + | 0.0910 | |||
| Registered Urban Unemployment Rate | % | − | 0.0917 | |||
| Infrastructure | Per Capita Road Area | m² | + | 0.0850 | ||
| International Internet Coverage Rate | % | + | 0.0912 | |||
| Gas Penetration Rate | % | + | 0.0925 | |||
| Public Services | Number of Teachers per Ten Thousand People | People | + | 0.0900 | ||
| Number of Health Facilities per Ten Thousand People | Count | + | 0.0900 | |||
| Comprehensive Social Health Insurance Coverage Rate | % | + | 0.0900 | |||
| Natural Subsystem | Water Conservation | Annual Water Production | mm | + | 0.2078 | |
| Soil Conservation | Soil Conservation Quantity | T·hm−2·a−1 | + | 0.2301 | ||
| Carbon Sequestration Services | Carbon Storage per Unit Area | t·hm−2·a−1 | + | 0.3313 | ||
| Habitat Quality | Habitat Quality | + | 0.4328 |
| Serial Number | 1 | 2 | 3 | 4 | 5 | 6 | 7 | 8 | 9 | 10 |
|---|---|---|---|---|---|---|---|---|---|---|
| Main Class | Dysfunctional recession class | Transition class | Coordinated development class | |||||||
| Coordination Degree | 0–0.09 | 0.1–0.19 | 0.2–0.29 | 0.3–0.39 | 0.4–0.49 | 0.5–0.59 | 0.6–0.69 | 0.7–0.79 | 0.8–0.89 | 0.9–1.00 |
| Coordination Degree Level | Extreme disorder | Severe disorder | Intermediate disorder | Mild disorder | On the verge of becoming disordered | Barely coordinated | Primary coordination | Intermediate coordination | Good coordination | High-quality coordination |
| Coupling Degree | 2010 | 2015 | 2020 |
|---|---|---|---|
| Kunming City | 0.9368 | 0.9426 | 0.9264 |
| Chuxiong Prefecture | 0.8145 | 0.8362 | 0.9199 |
| Yuxi City | 0.9958 | 0.9983 | 0.9729 |
| Qujing City | 0.9687 | 0.9833 | 0.9323 |
| Honghe Prefecture | 0.9929 | 0.9453 | 0.9947 |
| 2010 | 2015 | 2020 | |||||||
|---|---|---|---|---|---|---|---|---|---|
| Subsystem Pairwise Coupling Degree | Economic–Social | Social–Natural | Economic–Natural | Economic–Social | Social–Natural | Economic–Natural | Economic–Social | Social–Natural | Economic–Natural |
| Kunming City | 0.9913 | 0.9524 | 0.8702 | 0.9889 | 0.9630 | 0.8728 | 0.9954 | 0.9317 | 0.8748 |
| Chuxiong Prefecture | 0.9600 | 0.8928 | 0.8841 | 0.7832 | 0.9984 | 0.9184 | 0.8859 | 0.9937 | 0.9029 |
| Yuxi City | 0.9943 | 0.9997 | 0.8921 | 0.9999 | 0.9982 | 0.8898 | 0.9921 | 0.9868 | 0.8823 |
| Qujing City | 0.9534 | 0.9922 | 0.8977 | 0.9803 | 0.9999 | 0.8949 | 0.9133 | 0.9997 | 0.9200 |
| Honghe Prefecture | 0.9896 | 0.9986 | 0.8967 | 0.9213 | 0.9754 | 0.9137 | 0.9938 | 0.9946 | 0.8861 |
| Region | Coordination Degree | Coordination Degree Level | Lagging Subsystem |
|---|---|---|---|
| Kunming City City | 0.7824 | Intermediate coordination | Natural Subsystem |
| Chuxiong Prefecture Prefecture | 0.5419 | Barely coordination | Economic Subsystem |
| Yuxi City | 0.6947 | Primary coordination | Natural Subsystem |
| Qujing City City | 0.5564 | Barely coordination | Economic Subsystem |
| Honghe Prefecture Prefecture | 0.6235 | Primary coordination | Economic Subsystem |
Disclaimer/Publisher’s Note: The statements, opinions and data contained in all publications are solely those of the individual author(s) and contributor(s) and not of MDPI and/or the editor(s). MDPI and/or the editor(s) disclaim responsibility for any injury to people or property resulting from any ideas, methods, instructions or products referred to in the content. |
© 2024 by the authors. Licensee MDPI, Basel, Switzerland. This article is an open access article distributed under the terms and conditions of the Creative Commons Attribution (CC BY) license (https://creativecommons.org/licenses/by/4.0/).
Share and Cite
Yang, A.; Zhao, J.; Lin, Y.; Chen, G. Coupling and Coordination Relationship of Economic–Social–Natural Composite Ecosystem in Central Yunnan Urban Agglomeration. Sustainability 2024, 16, 2758. https://doi.org/10.3390/su16072758
Yang A, Zhao J, Lin Y, Chen G. Coupling and Coordination Relationship of Economic–Social–Natural Composite Ecosystem in Central Yunnan Urban Agglomeration. Sustainability. 2024; 16(7):2758. https://doi.org/10.3390/su16072758
Chicago/Turabian StyleYang, Anran, Junsan Zhao, Yilin Lin, and Guoping Chen. 2024. "Coupling and Coordination Relationship of Economic–Social–Natural Composite Ecosystem in Central Yunnan Urban Agglomeration" Sustainability 16, no. 7: 2758. https://doi.org/10.3390/su16072758
APA StyleYang, A., Zhao, J., Lin, Y., & Chen, G. (2024). Coupling and Coordination Relationship of Economic–Social–Natural Composite Ecosystem in Central Yunnan Urban Agglomeration. Sustainability, 16(7), 2758. https://doi.org/10.3390/su16072758