Article

Unveiling the Drivers of Global Logistics Efficiency: Insights from Cross-Country Analysis

1
College of Engineering and Architecture, Gulf University for Science & Technology, Mubarak Al-Abdullah 32093, Kuwait
2
Sabanci Business School, Sabanci University, Istanbul 34956, Turkey
3
Faculty of Management, Istanbul Technical University, Istanbul 34367, Turkey
4
Faculty of Economics and Administrative Sciences, Izmir Katip Celebi University, Izmir 35000, Turkey
5
School of Business, Ibn Haldun University, Istanbul 34480, Turkey
*
Author to whom correspondence should be addressed.
Sustainability 2024, 16(7), 2683; https://doi.org/10.3390/su16072683
Submission received: 18 December 2023 / Revised: 11 March 2024 / Accepted: 18 March 2024 / Published: 25 March 2024

Abstract

:
This study presents a novel approach to assess countries’ relative logistics performance differentials and identifies the underlying drivers using a data envelopment analysis (DEA) approach. The findings offer strategic insights and provide nations with valuable guidance in navigating the dynamic landscape of global logistics competitiveness. Recognizing the pivotal role of logistics in fostering economic activity and contributing to sustainability, we utilize the Logistics Performance Index (LPI) within the DEA model to gauge efficiencies at the country level and scrutinize influencing factors. Our findings indicate that international shipment practices in the last decade, as well as tracking and tracing recently, no longer contribute to the competitiveness of the countries, despite their potential for improvement. The overall change in logistics efficiency during the last decade remained relatively marginal, primarily driven by the frontier-shift effect. However, notable disparities among the country performance groups, particularly in adopting technological advancements, are manifested in the frontier-shift effect. Countries with lower logistics performance should prioritize addressing structural challenges related to customs, infrastructure, quality of logistics services, and timeliness. Medium-performance countries, while benefiting from a focus on customs, tracking and tracing, and timeliness in the early 2010s, are advised to align their efforts with high-performance countries by emphasizing managerial aspects in recent times.

1. Introduction

Globalization is naturally forcing countries to think beyond their regional competitiveness. International trade has become the key to economic welfare in today’s unprecedentedly well-connected global economy. As countries increasingly face global competition, they seek ways to operate more efficiently globally. More efficient logistics operations positively and significantly affect a country’s competitiveness and sustainability by ensuring resilient, convenient, and low-priced mobility of goods and services. Furthermore, the logistics sector not only substantially contributes to a country’s economic performance and advancement, but also plays a crucial role in the environment and society [1]. Hence, the performance of logistics has a significant impact on both economic prosperity and sustainability [2]. On the other side, logistics operations involve the management of the efficient flow of goods, services, and information from the source to the final consumer [3]. These operations have become more critical in ensuring customer satisfaction and improving profitability and sustainability. Organizations have been increasingly paying attention to their logistics operations to enhance their delivery speed and timeliness, optimize their inventory controls, improve their procurement practices and carbon footprints, and boost the information flow within their supply chains.
Market conditions shift the competition among supply chains rather than organizations [4]. Therefore, today, organizations look beyond improving their infrastructures and seeking ways to integrate themselves into important supply chains. Today’s supply chains span multiple countries. Logistics operations efficiency, as a result, has now become an issue at the supply chain level rather than at the organizational level. Increasing logistics efficiency depends on several factors, such as using the latest technologies (image recognition, IoT, sensors, RFIDs, etc.), improving transportation infrastructure, increasing the adaptive capability to laws and regulations, and enlarging road and port capacities. While some of these factors can be managed by organizations participating in the supply chains, the others can only be improved at the country level. Physical infrastructure, laws, regulations, and the capacity of roads and ports determine the quality of logistics operations administered by governments. Therefore, logistics investments impact not only a specific firm, a supply chain, but also the entire country. Public resources finance many logistics infrastructure projects, and customs are regulated for public well-being. In return, the countries expect to increase their gross domestic product, public welfare, and competitiveness. Thus, logistics efficiency is critical at the country level to set the priority areas to invest in improving logistics performance.
The World Bank has developed the Logistics Performance Index (LPI), which provides a metric to assess countries’ logistics performance quantitatively and makes it possible to compare their customs regulations, logistics costs, and transportation infrastructure. LPI uses a questionnaire-based survey method to evaluate six dimensions of logistics related to a specific country. The dimensions reported in the index are as follows: (i) customs, (ii) infrastructure, (iii) international shipments, (iv) logistics competence, (v) tracking and tracing, and (vi) timeliness. The customs dimension refers to the efficiency of customs regulations clearance. The infrastructure dimension measures the transportation infrastructure, such as road capacity and railroad networks. International shipments measure the convenience of planning competitively priced shipments. Logistics competence touches upon the competence and quality of logistics services. The tracking and tracing dimension is related to the ability to control the time and place of transportation. Finally, timeliness refers to the compatibility of scheduled and expected delivery [5].
LPI is a powerful guideline for comparing the logistics performances of individual countries on any of the six dimensions. These dimensions are not independent of each other. For example, infrastructure and customs efficiency may significantly affect timeliness. Therefore, some of these dimensions may be precursors to the others [6,7]. In this study, we first qualitatively review each LPI dimension individually as antecedents and consequents. Therefore, LPI is used to compare the logistics efficiencies of individual countries.
This study investigates the factors driving the countries’ logistics performances relying on the LPI indicators of the World Bank. To figure out the factors making countries logistically perform well, we clustered them into three groups based on their logistics performances in 2010. The efficiency change along the observed time frame was found by calculating the Malmquist index from the same dataset, and its relation to the logistics drivers was discussed. Using the DEA approach, each country was first benchmarked with its peers in the same group, and the improvement dimensions of logistics performance indicators were identified. After these performance discrepancies were compensated in each group, all the countries were pooled into the same DEA model. These discrepancies among the logistics performance groups were considered the drivers of logistics performance efficiency.
This study is unique from several perspectives. Based on the best of our knowledge, it is one of the first studies using DEA to this extent to explore the drivers of logistics efficiency from the LPI dataset. The approach of extracting the logistics drivers from a DEA model and evaluating them at operational and structural levels separately according to three logistics performance levels of countries is quite novel in logistics. In terms of findings, this study also points out the difference between performance and efficiency. While performance may be defined as the degree of achievement of a country’s goal, efficiency refers to utilizing resources to achieve its goals [8]. From this perspective, the study is also one of the few research projects discussing both issues in the literature. Finally, many studies in the literature consider single-year LPI scores for logistics efficiency. However, this study captures the dynamically changing impact of logistics dimensions on performance using a Malmquist index (MI).
We organize the rest of the paper as follows. Section 2 provides the background and an extensive literature review on studies addressing countries’ logistics performance using LPI. Section 3 focuses on the methodology used, and the data collected, background information, and application of the proposed framework. The solution methodology and results are discussed in Section 4. Finally, Section 5 provides concluding remarks, managerial insights, and future research directions.

2. Background and Literature Review

The logistics networks are a crucial part of domestic and international trade with various operations, such as warehousing, brokerage, delivery, and terminal operations [6]. Martí et al. [7] analyzed the impact of LPI on developing countries’ trade performance. Their findings indicated that the components of LPI were critical for international trade in countries located in Africa, South America, and Eastern Europe. Uca et al. [9] showed that there were statistically significant relationships between countries’ economic performance and both “customs” and “logistics infrastructure”. Gungor et al. [10] examined the relationship between LPI data and the economies of Mediterranean countries and argued that countries can have higher levels of economic performance if they attach importance to “infrastructure” and “customs” dimensions. Widiyanto et al. [11] also indicated the importance of “logistics infrastructure” for foreign trade. Moreover, the extant papers showed that international shipments, logistics competence, and timeliness had a positive effect on the transportation sector [12,13]. In addition, the importance and positive effects of tracking and tracing for logistics operations are discussed in various research in the literature [14,15].
Efficient logistics operations also increase the competitiveness of countries. D’Aleo and Sergi [16] investigated the mediator role of LPI on the relationship between the Global Competitiveness Index (GCI) and gross domestic product (GDP). Their results showed that GCI pillars have an essential role in the economic growth of European countries through the mediation of logistics performance. Entrepreneurship and environmental awareness are furthermore important extents to competitiveness. Using LPI, Mesjasz-Lech [17] identified the difficulties faced by entrepreneurs in the transport and storage sector within the European Union. They performed a correlation analysis between entrepreneurship rate and logistics performance and found a significant link between LPI and entrepreneurial activity within the sector. Liu et al. [18] investigated the link between the logistics performance of Asian countries and environmental degradation. Their results showed that LPI indicators significantly impacted CO2 emissions. Successful logistics operations help countries enhance trade and attract more foreign direct investment (FDI). Coto-Millán et al. [19] inspected the impact of countries’ logistics performance on global economic growth. They estimated that a 1% increase in LPI might enhance the world economic growth between 0.011% and 0.034%. Luttermann et al. [20] studied the relationship between logistics performance, trade, and FDI. Performing a panel data analysis on 20 Asian countries, they found a significant association between logistics performance and FDI.
On the contrary, poor logistics performance negatively influences the country’s competitiveness. Inadequate infrastructures, weak custom regulations, poor quality of logistics services, and faulty interconnections make the logistics service networks vulnerable to uncertainties, leading to unpredictable transaction delays. The COVID-19 pandemic, the accidents in the bottleneck waterways, such as in the Suez Canal, and recent conflicts in different regions of the world have had a prominent impact on the overall coordination, organization, and planning of the logistics networks. Therefore, evaluating and understanding insights behind countries’ logistics performance is highly important. A country’s logistics performance may be evaluated based on several indicators of its transportation system, such as the railway usage rate, the length of the railways, and the use of waterways quantitatively. The World Bank reports LPI that provides detailed information on the logistics performance of over 160 countries based on the logistics experts’ opinions on a five-point scale. LPI survey data provide quantitative evidence about the easiness of custom procedures, available infrastructure, the quality of logistics services, timeliness of logistics transactions, barriers in front of international shipments, and availability of tracking and tracing tools for countries. Arvis et al. [6] evaluate the dimensions of LPI in two categories: the policy arrangements pointing out the main inputs for the supply chains (customs, infrastructure, and logistics services) and the supply chain performance indicators (timeliness, international shipments, and tracking and tracing).
Although most of the literature comprises micro-level studies, relatively fewer works focus on the logistics performance at the macro-level [1,21,22]. Many of these macro-level studies use the World Bank’s LPI dataset, an important source to assess and compare the logistics performance of the countries [6]. Table 1 summarizes the current literature on logistics performance assessed by LPI. The table lists the studies concerning their scope, data, the method used, and major outcomes.
Among the studies employing LPI in national or global contexts, it is common to investigate the factors affecting logistics performance. Önsel Ekici et al. [25] addressed how national resources could improve the logistics competitiveness of countries. They evaluated the relationship between logistics performance and competitiveness at the national level using Artificial Neural Network (ANN) and Cumulative Belief Degrees (CBDs). They found that the fixed broadband internet infrastructure was the most crucial factor in Turkey’s logistics performance. Using a similar approach, Kabak et al. [27] investigated the relationship between LPI and the competitiveness of a country. They found that the GCI pillars of the World Economic Forum (namely, “Business Sophistication”, “Financial Market Development”, “Infrastructure”, “Good Market Efficiency”, and “Higher Education and Training”) had a significant impact on improving a country’s logistics performance. Using GCI and LPI, Önsel Ekici et al. [22] proposed a framework for policymakers to improve countries’ logistics performance. Integrating tree-augmented naive Bayesian network (BN-TAN), partial least square (PLS), and importance-performance map analysis (IPMA) techniques, they found that countries should focus on digitalization and supply chain analytics to improve their logistics performances. Stojanović and Ivetić [28] investigated the relationship between the Incoterms score (IS) and LPI. Their results showed that LPI significantly impacted the national IS. In one of the recent studies, Göçer et al. [29] proposed a methodological framework using LPI and secondary data that include various online sources, news, and academic reports. They implemented it in Turkey to determine the optimum combination of strategies for improving the country’s overall logistics performance to enhance its competitiveness in world trade.
Efficiency evaluation has been one of the prominent topics in logistics literature. There is an abundance of studies focusing on the measurement of efficiency in different modes of transportation, such as air [30,31,32,33], freight [34,35,36,37], rail [38,39], and intermodal [40,41,42]. DEA has been frequently used to measure the logistics efficiency in the literature [13,14]. Although there are various studies on LPI in the literature, many of them have investigated logistics efficiencies for a specific country and period. In cross-country efficiency assessment using LPI, researchers applied different DEA models to measure the relative efficiency of each decision-making unit representing an individual country, as it allowed multiple inputs and outputs. Depleting this approach, the authors of [23] developed a hybrid logistics and environmental sustainability index.
Yu and Hsiao [24] proposed a meta-frontier DEA model with assurance regions (Meta-DEA–AR) to evaluate the LPI scores. They suggested possible directions for countries to adjust their resources to improve logistics efficiencies. To evaluate and compare the overall performance of green transportation and logistics practices in 112 selected countries, Lu et al. [26] developed an environmental logistics performance index (ELPI) using the DEA approach. Their findings depicted that ELPI and LPI were strongly correlated. Martí et al. [21] proposed a DEA-based approach to benchmark the countries’ logistics performance using LPI and some additional variables, such as income and geographical area. Their findings showed that high-income countries, mainly from the EU, performed the best. Rashidi and Cullinane [1] evaluated the sustainability of OECD nations’ operational logistics performance (SOLP). Their analysis revealed that the relationship between LPI and SOLP is statistically insignificant.

3. Research Methodology

In this study, a DEA model is developed to compare countries’ logistics efficiency and to investigate the factors affecting it. DEA is a prominent mathematical programming-based method initially proposed by Charnes et al. [43] to evaluate the relative efficiency of organizational units. The units, the countries in our case, are usually denoted as the decision-making units (DMUs) in the DEA terminology [44]. DEA has wide-ranging applications due to its advantages over traditional methods. First, DEA enables a peer group comparison among the many similar units by producing a comparable score for each unit and determining efficient and inefficient units. It reveals the sources and the levels of inefficiency for each of its inputs and outputs [45]. It can also handle multiple incomparable inputs and outputs expressed in different units of measurement. Another advantage of DEA over other traditional methods is that there is no need for any assumption about the form of the production function.

3.1. The BCC Model

Different DEA models serve diverse needs under different scenarios. CCR [43] and BCC [46] are commonly referenced models. In this study, we employ the CCR model to calculate the overall technical efficiency for MI and the BCC model to consider the pure technical efficiency assuming variable returns to scale.
The input-oriented DEA models aim to determine how much input is needed to achieve a designated output level for an inefficient organization to become DEA-efficient. In contrast, an output-oriented model seeks to determine the potential output for the given inputs of an inefficient firm to become DEA-efficient. In this study, we employ the output-oriented DEA model to determine how to increase countries’ logistics performance with their current inputs. The study explores which output variables need to be improved for the given inputs to increase logistics performance. An output-oriented DEA model, referred to as BCC in the literature, can be expressed as below for m outputs, n inputs, and k number of countries:
M a x   φ + ε i = 1 m s i + j = 1 m s j +
s u b j e c t   t o
r = 1 k x i r λ r + s i = x i o                   f o r   i = 1,2 , , n
r = 1 k y j r λ r s j + = φ y j o                 f o r   j = 1,2 , , m
r = 1 k λ r = 1
λ r , s j + , s i 0                 f o r   a l l   i , j , r
where φ is efficiency score for country o under investigation; xio and yjo are observed values of input i consumed and output j yielded by firm o, respectively; s j + and s i are the amounts of excess input i and deficit output j for country o; ε > 0 is a predefined non-Archimedean element; λr’ s are the dual variables utilized to construct an ideal composite country to dominate country r.
Equation (1) is the objective function that assesses the organization’s efficiency score ( φ ) being evaluated. Equation (2) indicates that the input level for i is a linear combination of the inputs consumed by benchmarked countries and the excess input of i. Equation (3) ensures that the optimal output of j is a linear combination of the outputs generated by benchmarked countries minus its slacks. The organization o is called efficient if φ =1 and s j + = s i = 0 for all i and j in the optimal solution of the model given in (1)–(5). The efficient country forms the efficiency frontier, a reference set, for country o.

3.2. Malmquist Index

Classical DEA methods measure the efficiency of DMUs for only a single time unit. However, in this research, we utilize the DEA-based Malmquist productivity index proposed by Färe et al. [47] to evaluate the efficiency change in a DMU between two time periods. The Malmquist index is calculated as the product of “Catch-up” and “Frontier-shift” terms. The catch-up term is the ratio of observed DMU efficiency score in period p 2 to the one on period p 1 , regarding period p 2 and p 1 frontiers, respectively. It measures the change in efficiency between periods p 1 and p 2 . On the other side, the frontier-shift term represents the change in the efficient frontiers for the DMU evaluated between periods p 1   and p 2 and calculated as the geometric mean of frontier-shift effects for periods p 1   and p 2 . The frontier-shift effect in each period is computed by the ratio of observed DMU efficiency score with respect to period p 1   and p 2 frontiers, respectively. The resulting output-oriented Malmquist index is given by Färe et al. [47] between periods p 1   and p 2 as follows for DMU k:
M I   = d p 2 x k p 2 , y k p 2 d p 1 ( x k p 1 , y k p 1 ) ×   d p 1 x k p 2 , y k p 2 d p 1 ( x k p 1 , y k p 1 ) × d p 2 x k p 2 , y k p 2 d p 2 ( x k p 1 , y k p 1 ) 1 2  
where d p 1 x k p 1 , y k p 1 and d p 2 ( x k p 1 , y k p 1 ) represent the distance functions of the inputs and outputs in period p 1   to the frontier p 1   a n d p 2 , respectively. The first component of Equation (6) represents the catch-up index and evaluates the technical efficiency change over two time periods. The second component of Equation (6) represents the frontier-shift index that evaluates the technology change over two time periods. The catch-up index specifies whether a DMU is getting closer to its frontier, and the frontier-shift index shows the frontier change between the two periods. MI > 1 indicates the increase in total product productivity of observed DMU from the period t   to t   + 1 . Similarly, MI = 1 and MI < 1 represent no change and decrease in total product productivity, respectively. Further discussion for the calculation of MI is given in [48].
There are several ways to calculate MI. Färe et al. [47] propose an input and output-oriented DEA model to calculate MI. In order to overcome some inadequacies of radial DEA models, non-radial and slack-based DEA models are proposed [49,50,51]. We utilize the output-oriented DEA model to calculate MI, as Tone (2004) [48] suggested. For each DMU, two LP models are solved to compute the efficiency scores in p 1   and p 2 , while two others calculate the inter-temporal efficiencies between periods p 1   and p 2 .

3.3. Measurement of the Input and Output Variables

The Logistics Performance Index (LPI), created by the World Bank, measures the trade logistics performance of countries, pointing out the challenges and opportunities. It also gives insight to governments on how they can improve logistics performance. LPI relies on six indicators to assess the logistics performance, namely, “customs”, “infrastructure”, “logistics competence”, “international shipments”, “tracking and tracing”, and “timeliness”. The World Bank LPI report categorizes international shipments, tracking/tracing, and timeliness as logistics performance outcomes, and customs, infrastructure, and logistics competence as supply chain inputs [6]. Similar to Martí et al. [21], we also consider “customs”, “infrastructure”, and “logistics competence” as input variables and “international shipments”, “tracking/tracing”, and “timeliness” as output variables in DEA analysis. The first indicator in LPI, customs, evaluates the efficiency and simplicity of customs procedures. Efficient customs procedures enhance the trade through reduced delays and costs, as well as streamlined processes. The second indicator, infrastructure, assesses not only the quality of transport and trade infrastructure, but also IT and telecommunications. Robust infrastructure reduces transit times and lowers logistics costs. Logistics competence refers to the quality of logistics services provided by the local providers, such as freight forwarders. International shipments indicator reflects the ease of arranging competitively priced international shipments, indicating the competitiveness and connectivity of the shipping market. Tracking and tracing indicator measures the capability to monitor goods in transit. Higher scores signal advanced tracking technologies that can contribute to supply chain performance and risk mitigation. Lastly, timeliness scores indicate the competence of the domestic logistics industry in terms of reaching a destination without delay [6]. The index provides a single score for each indicator.

3.4. Data and Sample

LPI benchmarks the logistics activities of 160 countries based on a survey with international logistics experts and operators on the ground (freight forwarders and carriers). The index includes qualitative and quantitative questions to analyze the logistics performance of a country [52]. The theoretical background of the index is available from LPI report of the World Bank (Arvis et al. [53]). The inputs and outputs in our models represent the critical elements in achieving a successful logistics operation. LPI assesses these inputs and output in a five-scale metric. The higher score represents a favorable condition for better logistics performance.
While the World Bank published LPI ratings six times between 2007 and 2018, only those published after 2010 use a consistent evaluation methodology that examines all six logistics performance dimensions. Therefore, this study selected 2010 and 2018 to evaluate the drivers for better logistics performance in 148 countries reported in both years.

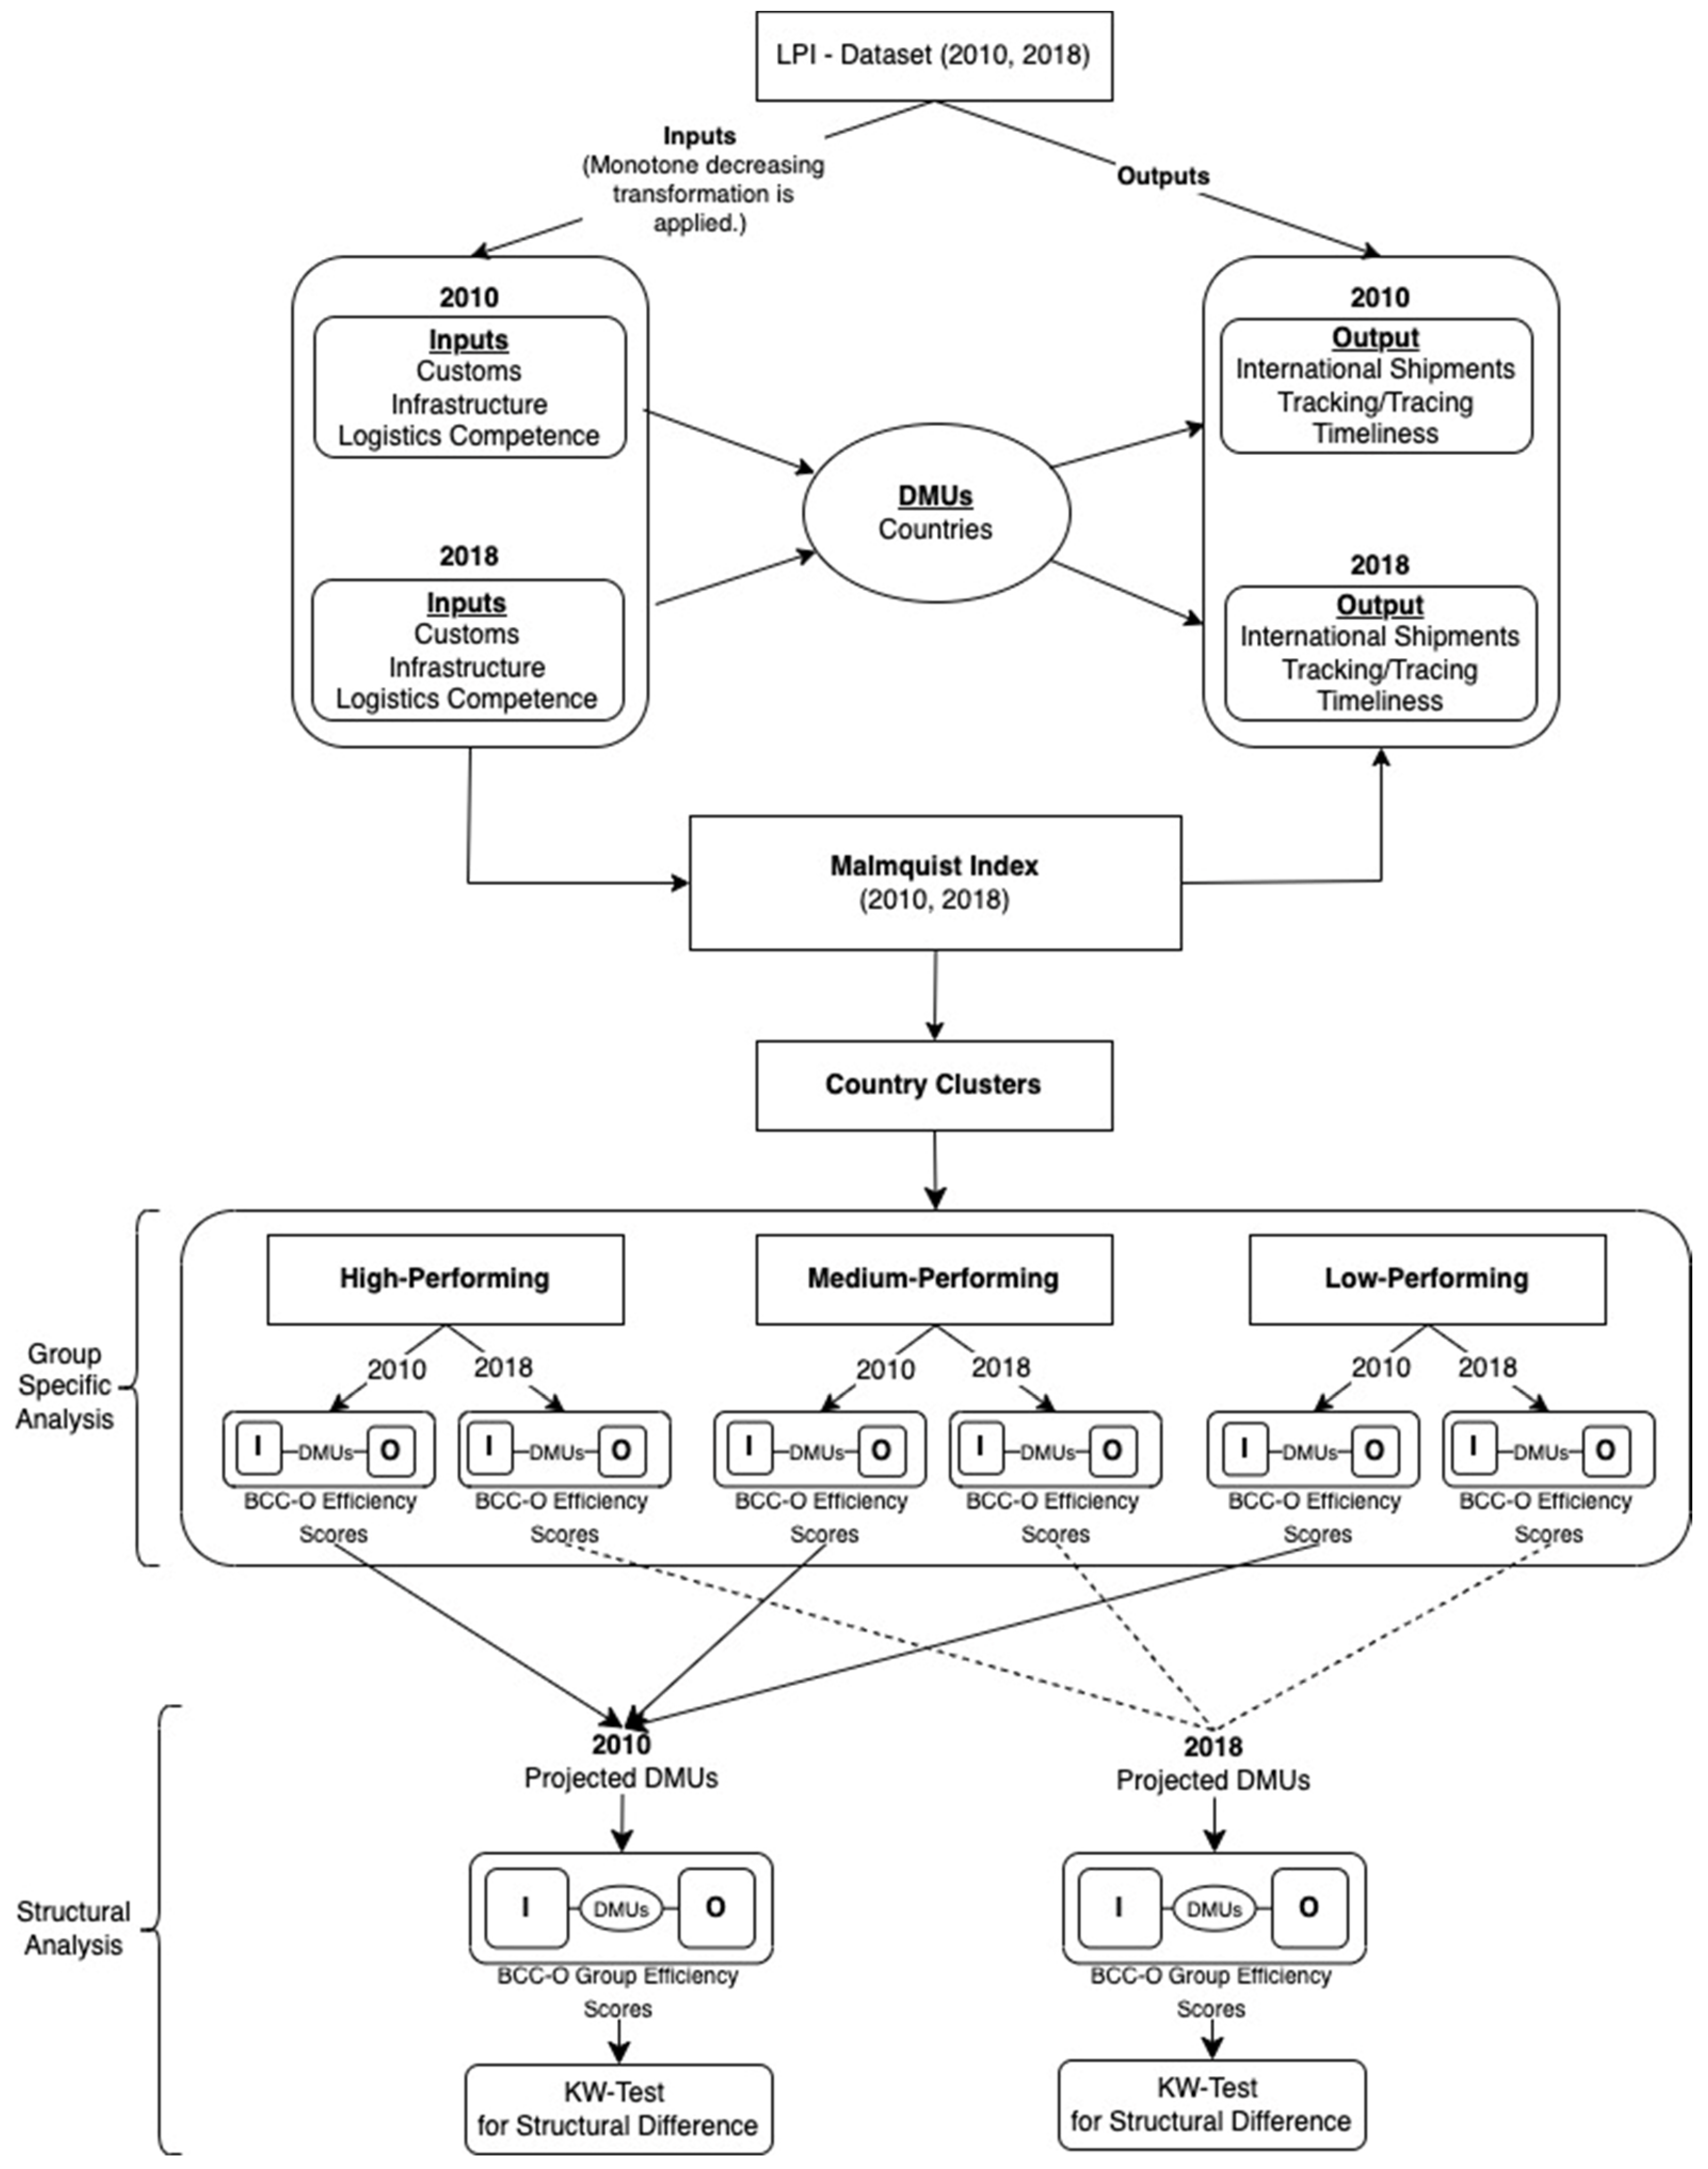
3.5. Research Framework

The research framework of the study is displayed in Figure 1. Using LPI dataset from 2010 and 2018, the study initially identifies the inputs and outputs from the list of LPI indicators to assess the logistics performance. In fact, LPI input indicators are the variables to augment for higher logistics performance. Therefore, to use LPI input indicators in our DEA models, a monotone decreasing transformation (subtracting the original values from the maximum score of five) is applied to each of the inputs, as suggested by Marti et al. [21]. Under this setting, DEA models aim to minimize the potential improvement possibilities of each modified input variable (equivalently, maximize original input variables). Hence, modified inputs in the DEA model represent the potential improvements, and their slacks point out possible shortcoming areas for enhancement.
The first step of the analysis is the calculation of the output-oriented MI using each DMU’s LPI indicators and investigates its efficiency progress from 2010 to 2018. Along with MI, catch-up and frontier-shift effects are assessed to evaluate the technical efficiency change and technology change, respectively.
In the second step, to split the countries into similar performance groups, the agglomerative clustering method is applied to the LPI dataset. As a linkage to measure distances across clusters, the complete-link criterion is selected to form similarly-sized clusters [54]. The criterion computes cluster proximities based on the distance between the farthest neighbors of each cluster, but it is susceptible to noise and outliers [55]. Therefore, the outliers should be screened using Tukey’s [56] outlier detection method. As a result, the countries are split up into three groups (high-, medium-, and low-performing) for the analysis. To avoid any discrimination problem involving DEA models, the number of countries in each group is selected at least as many as the maximum of m × n and 3(m + n) [57]. This study employs DEA models with three inputs (n) and three outputs (m); hence, the number of countries selected for each group satisfies the recommendation above in each subcategory.
The third step allows us to perform group specific analysis to identify the key improvement areas among the countries having similar logistics performance. For each logistics performance group, an output-oriented BCC-DEA model is developed and run to assess the country’s logistics efficiencies. These efficiency scores are the pure technical efficiencies indicating the conversion performance of inputs into outputs relative to best practices. Lack of knowledge and skill sets, mismanagement and other operational problems may lead to pure technical inefficiencies. The slacks in each logistics performance group indicate the deficiencies of the countries to reach their peer counterparts.
A fair benchmarking of the countries is only possible among those with similar logistics structures as assumed by DEA methodology. Country-level inefficiencies generally originate from managerial shortcomings or structural deficiencies. For each logistics performance group, common managerial shortcomings are analyzed and discussed in the third step. The fourth step investigates the logistics performances of the countries, verifying their structural differences according to group-based characteristics. For DEA, Brockett and Golany [58] and later Sueyoshi and Aoki [59] suggested two slightly different approaches to test efficiency differences for two and many groups of categories, respectively. Both approaches suggest eliminating the managerial/administrative shortcomings from the logistics performance groups. This is only possible by projecting the inefficient countries in each group into their efficiency frontier as if they are fully efficient. After updating the input and output values of each country, a new output-oriented BCC-DEA model is constructed and populated by the participation of all the countries belonging to all performance groups. This newly constructed DEA model consists only of the structural differences among the countries representing the frontiers of their performance groups. After solving the latest model, group-based average efficiency scores of the countries are calculated. These scores are tested using the Kruskal–Wallis rank test to verify whether there is any significant difference among the group efficiency scores [59]. If the test results indicate a significant difference among the performance groups, it is believed that statistically significant differences in the slacks between the logistics performance groups are the drivers of the logistics performance.

4. Analysis and Results

4.1. Country Clusters

Using 2010 LPI scores and logistics indicators for 148 countries assessed in both 2010 and 2018, the countries were split up into three performance groups (high-, medium-, and low-performing) through the agglomerative clustering method. The outliers were screened with Tukey’s rule, and two countries (Eritrea and Somalia) were identified as outliers. They were removed from the analysis. Therefore, only 146 countries are left for the remaining analysis. The high-performing logistics performance group includes 25 countries, all in the high-income category according to the World Bank classification. In addition to 15 European countries, five Asia-Pacific countries, two North American countries, Hong Kong, Taiwan, and UAE from the Middle East are included in this group. Other than Switzerland, Luxembourg, and Austria, the rest are coastal countries. Marti et al. [21] found the importance of income and geographical location on logistics performance. The characteristics of the countries in the high-performing group are also in line with their findings. The medium-performing group is the largest, with 77 countries dispersed worldwide. Fifty-one of them are classified under high and upper-middle income. Only nine low-income countries are listed in this group. They are overwhelmingly maritime African countries. The low-performing group consists of 44 countries from all over the world with low and middle income. Only one-third of them belong to the upper-middle income category.

4.2. Descriptive Analysis

Table 2 presents the descriptive statistics of LPI scores for the total and three sub-classifications: high-, medium-, and low-performing countries. Furthermore, the F-test results comparing the mean differences among the logistics performances of country groups in 2010 and 2018 are given in Table 2. In both years, out of 146 countries, 25, 77, and 44 are categorized under high-, medium-, and low-performing countries, respectively. As the descriptive statistics showed, the high LPI-scored countries performed better than the medium and low ones in both 2010 and 2018. As expected, their inputs and outputs differed significantly from those of medium- and low-performing countries. Moreover, highly significant F-test values for the groupwise differences of the total, input, and output scores also justify forming country logistics performance groups identified by the clustering approach above. Among outputs, timeliness is the best performance indicator achieved in all performance groups, even though it slightly decreased in 2018. Additionally, average input scores within each performance group merely differ. Although the best input indicator achieved for high-performing countries is infrastructure, the quality of logistics services is the highest for medium- and low-performing countries. This indicates that high-performing countries already have developed excellent infrastructure.

4.3. Malmquist Index

To evaluate the logistics performance efficiency progress between 2010 and 2018, the Malmquist productivity index was calculated. The results are summarized in Table 3, revealing a low catch-up (0.923 < 1.0) and relatively high frontier-shift (1.092 > 1.0) effects between 2010 and 2018. Altogether, the MI indicates a slight improvement in overall efficiency with a 1.008 (>1.0) index score. The catch-up effect represents an improvement in technical efficiency due to improved operations, and the frontier-shift effect denotes an efficiency improvement due to technological changes [57]. Thus, the overall efficiency of logistics operations (1.008) in the world between 2010 and 2018 mainly remained the same. However, logistics activities’ managerial and operational efficiency deteriorated, but technological advancements compensated for this decline.
The Kruskal–Wallis rank test results confirm weak statistically significant differences among the country groups for the catch-up effect (p-value < 0.10) but strong ones for the frontier-shift effect (p-value < 0.001). The biggest MI change occurs among low-performing countries, with a mean value of 1.057, followed by high (1.009) and medium (0.979) ones. However, the differences among the country groups for the MI are insignificant. For medium-performing countries, their overall MI score (0.979) indicates declining logistics performance in 2018 because of a lower catch-up effect (<1.0) without the presence of a strong enough frontier-shift effect.
Rank sum test results for statistically significant pairwise comparisons of the groups are indicated in Table 4. The only statistically significant difference in the catch-up effect is between low- and medium-performance countries at a 0.05 significance level. While all country performance groups have similar statistical catch-up effects, only the countries with low logistics performance have slightly better operational and managerial efficiency than the medium ones.
In terms of the frontier-shift effect, country performance groups have very similar mean efficiency scores, exhibiting their adoption of technological changes. However, they are statistically distinct from each other. As expected, frontier-shift scores improve along with the countries’ logistics performance. Specifically, new technologies, methods, and applications facilitate faster custom operations, communication, tracking, and tracing activities.
Information technology infrastructure is highly used for trade processing [53]. Therefore, logistics applications of the countries will benefit from this infrastructure.
High-performing countries are good at adopting these technological advances to improve performance; even low-income countries are not bad at implementing technology. Regardless of their income levels, the technology infrastructure gap among the countries is reduced noticeably faster [53]. Increased demand for E-business applications may also support technological advances. These differences in the frontier-shift effects among the country performance groups also deserve a further analysis of efficiency focusing on the country groups.

4.4. Efficiency Scores of Logistics Performance Groups and Group-Specific Issues

An output-oriented BCC-DEA model assessed the logistics performance efficiency in each group. Not only efficiency scores, but also the average deficiencies for the countries keeping them away from their group leaders, were identified and revealed in Table 5. The sources of inefficiencies for a country also shed light on the areas for peer performance leaders within the same logistics performance group. These signs of missing competencies, misconduct, and operational issues lead to pure technical inefficiencies. In comparing peer group-based efficiencies, the high-performing countries achieved the highest efficiency scores in 2010 and 2018. Low-performing countries achieve the second highest efficiency in both years. As a group, the efficiency of medium-performing countries was the lowest in both 2010 and 2018. From a technical viewpoint, this tendency may be related to the homogeneity of the groups. Compared to high- and low-performing countries, the medium-performing countries in our sample are the largest group of countries with diverse characteristics regarding income categories and geographic locations. Thus, their performances and resources vary. The medium-performing group in Table 5 has the highest number of inefficient countries in both 2010 and 2018. In addition, Table 5 provides a good direction for each group of countries to improve their performances based on their fellow group members. For logistically high-performing countries, the most important improvement suggestion was to enhance the quality of logistics services in their inputs to obtain better performance on international shipments in their outputs in 2010. However, this situation changed in 2018, and infrastructure and tracking/tracing became the most critical input and output factors to develop, while the average efficiency in this group went down from 0.970 to 0.953. For logistically medium-performing countries, the customs in their inputs were the most important factor in improving the timeliness performance in 2010. Nevertheless, this situation changed in 2018. The quality of logistics services and international shipments were the most critical factors to improve among inputs and outputs. Countries in this performance group are impacted by the quality and availability of physical infrastructure [53]. In this group, average efficiencies went down from 0.888 to 0.818, and the number of inefficient countries slightly increased. Furthermore, for logistically low-performing countries, the most important improvement area to practice in their inputs was the quality of logistics services to boost their tracking and tracing performance in 2010. However, international shipments for outputs in 2018 also became one of the most critical performance factors to improve. While average efficiency went down from 0.936 to 0.867, the number of inefficient countries dramatically increased.
Return to scale (RTS) measures the level of change in the outputs with respect to changes in the inputs. Increasing RTS (IRTS) is greater than one, and decreasing RTS (DRTS) is less than one. If RTS equals one, it is constant (CRTS). Table 5 reveals that most countries in each performance group are categorized as IRTS, implying that any improvement in the input factors will be highly appreciated in the output performance factors.

4.5. Logistics Performance versus Efficiency

The differences in rankings between clusters based on LPI scores and efficiency metrics stem from variations in how these scores are calculated. While the LPI score considers a weighted average of six dimensions, efficiency scores focus on the effectiveness of utilizing input variables to yield higher outputs. This comparison is shown in Table 6. The countries listed under the best for LPI and the most efficient at the same time each year denote the best performance and efficiency for the respective country. Germany, Singapore, the Czech Republic, and China fit into this definition in both 2010 and 2018. However, if the country is listed as the best for logistics performance but not listed as efficient, it probably has high logistics performance at the expense of poor resource utilization. Austria, Japan, Poland, Qatar, Montenegro, and Maldives in 2018 are some examples of such countries. On the contrary, Finland, Denmark, Hungary, and Slovenia, in 2018, were not among the top 5 logistics performance countries, but they managed their resources vigorously to achieve full efficiency. In essence, their ability to leverage input variables such as customs, infrastructure, and logistics quality and competence led them to commendable output outcomes like international shipments, tracking and tracing, and timeliness.
Korea, Yemen, and Sierra Leone are listed as the worst 5 countries in Table 6 in both 2010 and 2018 regarding their performance and logistics efficiency scores. This is probably the worst situation where there is no performance or efficiency at all. Table 6 also pinpoints a very interesting case of an African country, Rwanda. Even though Rwanda found its place among the worst low-performing countries in 2010, the country’s efforts worked and moved it to one of the peers of low-performing countries in terms of performance and efficiency in 2018.

4.6. Structural Differences between Logistics Groups: Drivers of Logistics Performance

A series of steps in Section 3.5 were conducted on the LPI dataset to investigate the structural differences. LPI indicators used in calculating country efficiencies for specific logistics performance groups were modified to project the countries to their efficiency frontiers. These new input and output variables eliminated the impact of managerial shortcomings within the logistics performance groups. Then, output-oriented BCC-DEA efficiency scores were calculated with the participation of all the countries representing the logistics performance groups. The results of the analysis are depicted in Table 7. The average efficiency scores of the high-, medium-, and low-performing countries were found as 0.95, 0.85, and 0.63, respectively, in 2010 and 0.88, 0.80, and 0.63 in 2018. The results also show that logistically high- and medium-performing countries’ efficiencies decreased from 2010 to 2018. However, logistically, low-performing countries’ efficiency levels stayed stable between 2010 and 2018.
The Kruskal–Wallis rank test was run to verify how significantly these scores were different from each other. These test results denote that efficiency scores for logistics performance groups were statistically different in 2010 and 2018 (p < 0.001), implying the presence of structural differences among the groups. All pairwise comparisons are also found to be statistically significant, as shown in Table 8. Therefore, we may infer that each logistics performance group has a unique characteristic that should be handled differently. Hereafter, these unique characteristics will be named as structural differences and considered as the drivers of logistics performance.
The LPI model measures the country’s logistics performances with six indicators and explains the performance differences by input and output utilization level. The DEA model assesses the efficiency of transforming the inputs into the outputs and identifies the sources of inefficiencies as the basis of the structural differences. These sources of structural differences were calculated and shown in Table 9 as the average shortages for the input and output variables for each group of countries. Their significance levels in 2010 and 2018 were checked through a t-test and displayed in Table 9. Logistically, high-performing countries have no statistically significant slacks in their inputs and outputs at p < 0.01. This also explains why they logistically perform well and use their inputs to yield the expected outputs in harmony. In contrast, low-performing countries have significant slacks in all dimensions of logistics performance indicators, and they need to improve both inputs and outputs for better logistics efficiency. Medium-performing countries came across significant output shortages in all dimensions in 2010 and 2018 and suffered to perform better efficiencies. Customs was the only major input indicator that should be improved in 2010 at a one-percent significance level for medium-performing countries. The slack analysis performed at a statistically one-percent significance level helps us to identify the characteristics of the logistics performance groups. High-performing countries are characterized by no slack in both input and output indicators. Medium-performing countries are identified by proper input utilization but output shortages. Low-performing countries are described by both poor input utilization and output yields. This is true for both 2010 and 2018, except for customs for medium-performing countries in 2010. These structural characteristics also point out areas for improvement for the countries to enhance their performance. Benchmarking with the high-performing countries, both low- and medium-performing countries, may find better means of converting inputs into better performance in international shipments, tracking and tracing, and timeliness in logistics operations.
An F-test is applied to each slack to compare the groupwise differences in Table 9. Surprisingly, the slacks of international shipments in 2010 and 2018 and tracking and tracing in 2018 are found to be indifferent among the performance groups at a one-percent significance level. Even though all other differences are statistically significant, international shipments in 2010 and 2018 and tracking and tracing in 2018 no longer create a competitive advantage for the performance groups. Therefore, categorically evaluating these two indicators according to performance groups makes no difference.
Multiple pairwise comparisons are conducted among the significantly different logistics dimensions to identify the distinguishing characteristics of the performance groups. The results of these post hoc tests are shown in Table 10. While high-performing countries differentiated themselves from medium-performing ones in terms of custom practices, tracking and tracing systems, and timely delivery performance in 2010, all these differences disappeared in 2018. No distinguishing characteristic regarding efficiencies exists any more between high- and medium-performing categories. In terms of all input slacks, in addition to timeliness shortages, the medium-performing group was significantly differentiated from the low-performing group in 2010 and 2018. The only gap for tracking and tracing systems in 2010 was eliminated in favor of low-performing countries in 2018. This is the result of the fast developments in information and communication infrastructure expressed by Arvis et al. [53].

5. Conclusions

International trade and efficient logistics operations are important to be competitive in the global markets. Logistics operations have a significant impact on economic welfare and growth, as well. However, necessary logistics infrastructure in terms of main highways, railroads, airways, and ports requires costly investment plans. Therefore, the logistics efficiency of a country is an important issue. This study introduces a new systematic approach to analyzing countries’ relative logistics performance. Relying on the LPI panel data, an output-oriented DEA model is developed to assess the logistics efficiency of the countries. Firstly, the countries are clustered according to their logistics performance and grouped into low-, medium-, and high-performing countries. Then, each country is benchmarked with the countries within the group to understand its strengths and weaknesses. Recognizing the structural differences among the groups, a new DEA model with the participation of all countries is constructed, removing the operational and managerial weaknesses of each one. The results of this new model are used to analyze what drives the logistics efficiency in each group of countries. In this vein, the study is unique in the logistics literature in analyzing the countries to explore their logistics drivers and performance, and assess their efficiency in converting logistics factors into performance. It is also one of the few studies capturing the dynamic nature of logistics using panel data.
The descriptive analysis of LPI reveals that timeliness is the highest performance indicator for all performance groups in both 2010 and 2018. It is noteworthy that the best input indicator for high-performing countries is infrastructure, and the quality of logistics services is the highest for medium- and low-performing countries. However, the quality of logistics services score for high-performing countries is much higher than the rest.
The DEA-based Malmquist productivity index evaluating the efficiency change between 2010 and 2018 confirms a slight increase in logistics efficiencies. Notably, the only exception is the medium-performing country group with a low MI score (0.979), indicating a decrease in its efficiency. However, the MI differences among the country groups are not statistically different. During the same period, the most notable finding is that overall productivity is motivated mainly by the global frontier-shift effect. The catch-up effect indicates lower operational and managerial efficiency, with no difference among the country groups. Only significant differences were observed on the frontier-shift effect, where high-, medium-, and low-performing countries were distinguished according to their adoption of technological changes. Therefore, the technological advancements in the sector drove logistics efficiency between 2010 and 2018, while operational and managerial practices deteriorated. Many recent advancements made newer technologies affordable and accessible for all countries, but each group benefited differently according to their capabilities. On the other side, high-performing countries found that the technological and structural improvements in logistics operations enhance their competitiveness, increase their share of global trade, and reach better economic welfare and growth.
In terms of logistics efficiencies indicating the utilization of the resources to yield a logistics performance, the high-performing country group still has the highest average score. Interestingly, the low-performing country group has a better efficiency score than the medium one. Based on recent developments, the easiness of accessing the newer technologies, the advantage of using the already tested approaches in the market, and taking into consideration the late-mover advantage may result in this conclusion for low-performing countries. On the other side, medium-performing countries seem to face stuck-in-the-middle syndrome. Some of them may invest in newer technologies as high-performing countries but need to be able to yield enough performance out of them in the presence of the other binding factors. The others may not undergo new investments, but their technologies and practices may be old and outdated. Groupwise inefficiencies point out that the most critical improvement suggestion for logistically high-performing countries was to enhance the quality of logistics services in their inputs to obtain better performance on international shipments in their outputs in 2010 and improve their infrastructure and tracking/tracing as the most critical input and output factors in 2018. For logistically medium-performing countries, the customs in their inputs were the most crucial factor in improving the timeliness performance in 2010 and the quality of logistics services and international shipments in 2018. Furthermore, for logistically low-performing countries, the essential improvement area to practice in their inputs was the quality of logistics services to boost their tracking and tracing performance in 2010 and international shipments for outputs in 2018.
Our analysis indicates significant structural differences among the logistics performance-based country groups, even eliminating operational and managerial inefficiencies belonging to each group. As expected, these differences are the leading drivers of logistics efficiencies. For example, high-performing countries have no statistically significant inefficiencies in their inputs and outputs. Thus, they are the leading logistics countries. In contrast, low-performing countries have significant slacks in all dimensions of logistics performance indicators. A groupwise comparison of the differences for each slack is considered to create a difference leading to competitiveness in the global arena. Since there is no statistically significant difference among the country groups, International shipment practices in both 2010 and 2018 and tracking and tracing in 2018 no longer contribute to the competitiveness of the countries, even though they have a potential for improvement. Low-performing countries should improve their structural problems related to customs, infrastructure, quality of logistics services, and timeliness in 2010 and 2018. However, these dimensions are the main drivers for logistics performance in medium- and high-performing countries. Even though the countries in the medium-performing group had some issues in 2010, they recovered them in 2018 and became compatible with the high-performing ones.
  • Managerial Implications:
LPI published by the World Bank is a valuable dataset for countries’ self-evaluation. It allows the countries to benchmark their logistics performances and efficiencies with their peers. A descriptive analysis of the LPI scores clearly states that timeliness is the most critical performance indicator for all countries, regardless of their logistics performance groups. The decision-makers of each country should do something to improve timeliness continuously. The other two distinctive characteristics of high-performing countries are their infrastructure and the quality of logistics services. Though other countries are doing their best on these factors, they still need to catch up with the countries in the high-performing group. The administrators of these countries should find effective means to enhance their capabilities in these two dimensions. Low-performing group countries have good efficiency scores in their own group. However, their overall logistics performance could be better. As an opportunity, the decision-makers of these countries may follow the tested pathways of high-performing countries to boost their performance. On the other side, there is little difference among the countries in handling international shipment practices. Therefore, any effort to enhance this logistics dimension may be considered an opportunity to create an advantage for any country.
  • Limitations and future studies:
While our study has substantial implications, it also has certain limitations. First, LPI assessed by the World Bank is only available until 2018. In fact, there are many recent global issues, such as the COVID-19 pandemic, regional catastrophes, and concerns about climate change. When the newer LPI index scores are available, evaluating their impact on the logistics performance of country groups may be interesting to explore in a further study. Second, input and output variables admitted to the DEA analysis may be extended with additional technical and social data to enhance the scope of the DEA. This may help clarify the differences among the logistics performance groups in terms of dynamics, competitiveness, or geographical properties of countries and explore the information behind the country’s logistics development direction. DEA models associated with the regression analysis may be developed as a further research direction to incorporate these interactions. Third, other than logistics performance, the countries may be classified according to their income categories and geographical locations to identify the factors impacting the logistics performance. Fourth, logistics performance may be investigated according to the logistics-specific tools and techniques focusing on the country’s economic and continental characteristics. This will provide a guideline for countries to improve their logistics performance.

Author Contributions

Conceptualization, E.B., E.E., F.K., M.F.A. and S.Z.; Methodology, E.B. and S.Z.; Software, E.B., E.E., M.F.A. and S.Z.; Validation, F.K.; Formal analysis, E.B. and S.Z.; Investigation, F.K. and M.F.A.; Data curation, E.B., E.E. and S.Z.; Writing—original draft, E.B., E.E., F.K. and M.F.A.; Writing—review & editing, E.B. and F.K.; Visualization, E.E.; Supervision, E.B., F.K. and S.Z.; Project administration, E.B. and F.K. All authors have read and agreed to the published version of the manuscript.

Funding

This research received no external funding, and the APC was funded by Graduate Studies and Research office at the Gulf University for Science and Technology.

Institutional Review Board Statement

Not applicable.

Informed Consent Statement

Not applicable.

Data Availability Statement

The data that support the findings of this study are openly available in The World Bank at [https://lpi.worldbank.org/international/global, accessed on 17 February 2023].

Conflicts of Interest

The authors declare no conflicts of interest.

References

  1. Rashidi, K.; Cullinane, K. Evaluating the sustainability of national logistics performance using Data Envelopment Analysis. Transp. Policy 2019, 74, 35–46. [Google Scholar] [CrossRef]
  2. Larson, P.D. Relationships between Logistics Performance and Aspects of Sustainability: A Cross-Country Analysis. Sustainability 2021, 13, 623. [Google Scholar] [CrossRef]
  3. De Souza, R.; Goh, M.; Gupta, S.; Lei, L. An Investigation into the Measures Affecting the Integration of ASEAN’s Priority Sectors (Phase 2): The Case of Logistics; REPSF Project No. 06/001d; ASEAN: Jakarta, Indonesia, 2007. [Google Scholar]
  4. Christopher, M. Logistics and supply chain management: Strategies for reducing cost and improving service (second edition). Int. J. Logist. Res. Appl. 1999, 2, 103–104. [Google Scholar] [CrossRef]
  5. International LPI. 2018. Available online: https://lpi.worldbank.org/international (accessed on 17 February 2023).
  6. Arvis, J.-F.; Mustra, M.; Panzer, J. Connecting to Compete: Trade Logistics in the Global Economy. World Bank. 2016. Available online: http://lpi.worldbank.org/international/global (accessed on 10 November 2022).
  7. Martí, L.; Puertas, R.; García, L. The importance of the Logistics Performance Index in international trade. Appl. Econ. 2014, 46, 2982–2992. [Google Scholar] [CrossRef]
  8. Mouzas, S. Efficiency versus effectiveness in business networks. J. Bus. Res. 2006, 59, 1124–1132. [Google Scholar] [CrossRef]
  9. Uca, N.; Civelek, M.E.; Çemberci, M. The effect of the components of logistics performance index on gross domestic product: Conceptual model proposal. Eurasian Bus. Econ. J. 2015, 1, 86–93. [Google Scholar] [CrossRef]
  10. Güngör, Ş.; Dursun, E.; Karaoğlan, A. Lojistik Faaliyetlerin Akdeniz Ülke Ekonomileri ile İlişkisi. J. Econ. Policy Res. 2019, 6, 91–106. [Google Scholar]
  11. Widiyanto, P.; Endri, E.; Sakti, R.F.J.; Setiawan, E.B.; Manfaluthy, M.; Suryaningsih, L.; Suryaningsih, P.; Ricardianto, K.; Kamar, K.; Limakrisna, N. The relationship between service quality, timeliness of arrival, departure flip ship logistics and people and customer satisfaction: A case in Indonesia. Acad. Entrep. J. 2021, 27, 1–10. [Google Scholar]
  12. Uvet, H. Importance of logistics service quality in customer satisfaction: An empirical study. Oper. Supply Chain Manag. Int. J. 2020, 13, 1–10. [Google Scholar] [CrossRef]
  13. Ho, J.S.Y.; Teik, D.O.L.; Tiffany, F.; Kok, L.F.; Teh, T.Y. Logistic service quality among courier services in Malaysia. Int. J. Trade Econ. Financ. 2012, 3, 113–117. [Google Scholar]
  14. Shamsuzzoha, A.H.M.; Helo, P.T. Real-time tracking and tracing system: Potentials for the logistics network. In Proceedings of the 2011 International Conference on Industrial Engineering and Operations Management, Kuala Lumpur, Malaysia, 22–24 January 2011. [Google Scholar]
  15. Shamsuzzoha, A.; Ehrs, M.; Tenkorang, R.A.; Nguyen, D.; Helo, P.T.P. Performance evaluation of tracking and tracing for logistics operations. Int. J. Shipp. Transp. Logist. 2013, 5, 31–54. [Google Scholar] [CrossRef]
  16. D’aleo, V.; Sergi, B.S. Does logistics influence economic growth? The European experience. Manag. Decis. 2017, 55, 1613–1628. [Google Scholar] [CrossRef]
  17. Mesjasz-Lech, A. Logistics performance of European Union markets: Towards the development of entrepreneurship in the transport and storage sector. Glob. J. Environ. Sci. Manag. 2019, 5, 122–130. [Google Scholar] [CrossRef]
  18. Liu, J.; Yuan, C.; Hafeez, M.; Yuan, Q. The relationship between environment and logistics performance: Evidence from Asian countries. J. Clean. Prod. 2018, 204, 282–291. [Google Scholar] [CrossRef]
  19. Millán, P.C.; Agüeros, M.; Hontañón, P.C.; Pesquera, M. Impact of logistics performance on world economic growth (2007–2012). World Rev. Intermodal Transp. Res. 2013, 4, 300–310. [Google Scholar] [CrossRef]
  20. Luttermann, S.; Kotzab, H.; Halaszovich, T. The impact of logistics performance on exports, imports and foreign direct investment. World Rev. Intermodal Transp. Res. 2020, 9, 27–46. [Google Scholar] [CrossRef]
  21. Martí, L.; Martín, J.C.; Puertas, R. A Dea-Logistics Performance Index. J. Appl. Econ. 2017, 20, 169–192. [Google Scholar] [CrossRef]
  22. Kabak, Ö.; Ülengin, F.; Önsel Ekici, Ş. Improving logistics performance by reforming the pillars of Global Competitiveness Index. Transp. Policy 2019, 81, 197–207. [Google Scholar] [CrossRef]
  23. Min, H.; Kim, I. Measuring supply chain efficiency from a green perspective. Manag. Res. Rev. 2011, 34, 1169–1189. [Google Scholar]
  24. Yu, M.-M.; Hsiao, B. Measuring the technology gap and logistics performance of individual countries by using a meta-DEA–AR model. Marit. Policy Manag. 2016, 43, 98–120. [Google Scholar] [CrossRef]
  25. Ekici, Ş.Ö.; Kabak, Ö.; Ülengin, F. Linking to compete: Logistics and global competitiveness interaction. Transp. Policy 2016, 48, 117–128. [Google Scholar] [CrossRef]
  26. Lu, M.; Xie, R.; Chen, P.; Zou, Y.; Tang, J. Green transportation and logistics performance: An improved composite index. Sustainability 2019, 11, 2976. [Google Scholar] [CrossRef]
  27. Kabak, Ö.; Ekici, Ş.Ö.; Ülengin, F. Analyzing two-way interaction between the competitiveness and logistics performance of countries. Transp. Policy 2020, 98, 238–246. [Google Scholar] [CrossRef]
  28. Stojanović, Đ.; Ivetić, J. Possibilities of using Incoterms clauses in a country logistics performance assessment and benchmarking. Transp. Policy 2020, 98, 217–228. [Google Scholar] [CrossRef]
  29. Göçer, A.; Özpeynirci, Ö.; Semiz, M. Logistics performance index-driven policy development: An application to Turkey. Transp. Policy 2022, 124, 20–32. [Google Scholar] [CrossRef]
  30. Cho, H.; Lee, J. Does transportation size matter for competitiveness in the logistics industry? The cases of maritime and air transportation. Asian J. Shipp. Logist. 2020, 36, 214–223. [Google Scholar] [CrossRef]
  31. Cui, Q.; Li, Y. Airline efficiency measures under CNG2020 strategy: An application of a Dynamic by-production model. Transp. Res. Part A Policy Pract. 2017, 106, 130–143. [Google Scholar] [CrossRef]
  32. Kotegawa, T.; Fry, D.; DeLaurentis, D.; Puchaty, E. Impact of service network topology on air transportation efficiency. Transp. Res. Part C Emerg. Technol. 2014, 40, 231–250. [Google Scholar] [CrossRef]
  33. Oum, T.H.; Fu, X.; Yu, C. New evidences on airline efficiency and yields: A comparative analysis of major North American air carriers and its implications. Transp. Policy 2005, 12, 153–164. [Google Scholar] [CrossRef]
  34. Kumar, A.; Anbanandam, R. Assessment of environmental and social sustainability performance of the freight transportation industry: An index-based approach. Transp. Policy 2022, 124, 43–60. [Google Scholar] [CrossRef]
  35. Cedillo-Campos, M.G.; Pérez-González, C.M.; Piña-Barcena, J.; Moreno-Quintero, E. Measurement of travel time reliability of road transportation using GPS data: A freight fluidity approach. Transp. Res. Part A Policy Pract. 2019, 130, 240–288. [Google Scholar] [CrossRef]
  36. Qu, W.; Rezaei, J.; Maknoon, Y.; Tavasszy, L. Hinterland freight transportation replanning model under the framework of synchromodality. Transp. Res. Part E Logist. Transp. Rev. 2019, 131, 308–328. [Google Scholar] [CrossRef]
  37. Rødseth, K.L. Productivity growth in urban freight transport: An index number approach. Transp. Policy 2017, 56, 86–95. [Google Scholar] [CrossRef]
  38. Smith, A.S.J.; Nash, C. Rail Efficiency: Cost Research and Its Implications for Policy; International Transport Forum Discussion Paper; International Transport Forum: Paris, France, 2014. [Google Scholar]
  39. Mandic, D.; Jovanovic, P.; Bugarinovic, M. Two-phase model for multi-criteria project ranking: Serbian Railways case study. Transp. Policy 2014, 36, 88–104. [Google Scholar] [CrossRef]
  40. Yan, B.; Zhu, X.; Lee, D.-H.; Jin, J.G.; Wang, L. Transshipment operations optimization of sea-rail intermodal container in seaport rail terminals. Comput. Ind. Eng. 2020, 141, 106296. [Google Scholar] [CrossRef]
  41. Heinold, A.; Meisel, F. Emission rates of intermodal rail/road and road-only transportation in Europe: A comprehensive simulation study. Transp. Res. Part D Transp. Environ. 2018, 65, 421–437. [Google Scholar] [CrossRef]
  42. Lai, Y.-C.; Barkan, C.P.; Önal, H. Optimizing the aerodynamic efficiency of intermodal freight trains. Transp. Res. Part E Logist. Transp. Rev. 2008, 44, 820–834. [Google Scholar] [CrossRef]
  43. Charnes, A.; Cooper, W.W.; Rhodes, E. Measuring the efficiency of decision making units. Eur. J. Oper. Res. 1978, 2, 429–444. [Google Scholar] [CrossRef]
  44. Apaydin, M.; Bayraktar, E.; Hossary, M. Achieving economic and social sustainability through hyperconnectivity: A cross-country comparison. Benchmarking Int. J. 2018, 25, 3607–3627. [Google Scholar] [CrossRef]
  45. Bayraktar, E.; Tatoglu, E.; Aydiner, A.S.; Delen, D. Business Analytics Adoption and Technological Intensity: An Efficiency Analysis. Inf. Syst. Front. 2023. [Google Scholar] [CrossRef]
  46. Banker, R.D.; Charnes, A.; Cooper, W.W. Some models for estimating technical and scale inefficiencies in data envelopment analysis. Manag. Sci. 1984, 30, 1078–1092. [Google Scholar] [CrossRef]
  47. Färe, R.; Grosskopf, S.; Norris, M.; Zhang, Z. Productivity growth, technical progress, and efficiency change in industrialized countries. Am. Econ. Rev. 1994, 84, 66–83. [Google Scholar]
  48. Tone, K. Malmquist productivity index. In Handbook on Data Envelopment Analysis; Springer: Berlin/Heidelberg, Germany, 2004; pp. 203–227. [Google Scholar]
  49. Tone, K. A slacks-based measure of super-efficiency in data envelopment analysis. Eur. J. Oper. Res. 2002, 143, 32–41. [Google Scholar] [CrossRef]
  50. Zhu, J. Data Envelopment Analysis with Preference Structure. J. Oper. Res. Soc. 1996, 47, 136–150. [Google Scholar] [CrossRef]
  51. Chen, Y. A non-radial Malmquist productivity index with an illustrative application to Chinese major industries. Int. J. Prod. Econ. 2003, 83, 27–35. [Google Scholar] [CrossRef]
  52. Beysenbaev, R.; Dus, Y. Proposals for improving the Logistics Performance Index. Asian J. Shipp. Logist. 2019, 36, 34–42. [Google Scholar] [CrossRef]
  53. Arvis, J.F.; Ojala, L.; Wiederer, C.; Shepherd, B.; Raj, A.; Dairabayeva, K.; Kiiski, T. Connecting to Compete 2018: Trade Logistics in the Global Economy; World Bank: Washington, DC, USA, 2018. [Google Scholar]
  54. Everitt, B.S.; Landau, S.; Leese, M. Cluster Analysis, 4th ed.; Hodder Arnold (A member of the Hodder Headline Group): London, UK, 2001; pp. 429–438. [Google Scholar]
  55. Tan, P.N.; Steinbach, M.; Kumar, V. Introduction to Data Mining; Pearson Education India: Noida, Uttar Pradesh, 2016; ISBN 9332586055. [Google Scholar]
  56. Tukey, J.W. Exploratory Data Analysis, 1st ed.; Pearson: Reading, MA, USA, 1977. [Google Scholar]
  57. Cooper, W.W.; Seiford, L.M.; Tone, K. Data Envelopment Analysis—A Comprehensive Text with Models, Applications, References and DEA-SoiverSofhuare; Springer: New York, NY, USA, 2000. [Google Scholar]
  58. Brockett, P.L.; Golany, B. Using rank statistics for determining programmatic efficiency differences in data envelopment analysis. Manag. Sci. 1996, 42, 466–472. [Google Scholar] [CrossRef]
  59. Sueyoshi, T.; Aoki, S. A use of a nonparametric statistic for DEA frontier shift: The Kruskal and Wallis rank test. Omega 2001, 29, 1–18. [Google Scholar] [CrossRef]
Figure 1. The research framework.
Sustainability 16 02683 g001
Table 1. A summarized review of LPI literature.
StudyScopeUsed DataMethodologyOutcomes
Min and Kim (2011) [23]All countriesLPI + EPIDEADevelop a new composite logistics and sustainability index
Millán et al. (2013) [19]All countriesLPIProduction functionGlobal economic growth impacts LPI
Martí et al. (2014) [7]Developing countries LPI + UN ComTradeGravity modelLPI is critical for international trade in African, South American, and Eastern European countries
Yu and Hsiao (2016) [24]All countriesLPIMeta-DEA–ARSuggestions to improve the countries’ logistics performances
Önsel Ekici et al. (2016) [25]TurkeyLPI + GCIANN + CBDsThe fixed broadband internet infrastructure is the most crucial factor in Turkey’s logistics performance
Martí et al. (2017) [21]All countriesLPI + income and geographical areaDEAThe EU countries perform the best
D’Aleo and Sergi (2017) [16]European countries LPI + GCILinear regressions + panel analysisLPI mediates the relationship between GCI and GDP
Liu et al. (2018) [18]Asian countries LPI + World Development IndicatorsGMMLPI impacts CO2 emissions
Lu et al. (2019) [26]All countriesLPIPanel analysisDevelop a new environmental LPI (ELPI)
Önsel Ekici et al. (2019) [22]All countriesLPI + GCIBN-TAN + PLS + IPMADigitalization and supply chain analytics improve LPI
Rashidi and Cullinane (2019) [1]OECD countries LPIDEAA new SOLP approach for a country’s logistics performance
Mesjasz-Lech (2019) [17]European UnionLPI + entrepreneurship rateCorrelation analysisThe link between LPI and entrepreneurial activities is significant
Kabak et al. (2020) [27]All countriesLPI + GCIBN +PLS + IPMAGCI components improve a country’s logistics performance
Stojanović and Ivetić (2020) [28]SerbiaLPI + GCI + ISCorrelation + Gravity modelLPI impacts the national IS
Göçer et al. (2022) [29]TurkeyLPI + various sources Linear programming + regression analysisOptimal logistics strategy selection
ANN: artificial neural networks, BN-TAN: tree-augmented naive Bayesian network, CBDs: cumulative belief degrees, DEA: data envelopment analysis, ELPI: environmental logistics performance index, EPI: environmental performance index, GDP: gross domestic product, GMM: generalized method of moment, IPMA: importance-performance map analysis, IS: Incoterms score, Meta-DEA–AR: meta-frontier data envelopment analysis with assurance regions, PLS: partial least square, SOLP: sustainable operational logistics performance.
Table 2. Descriptive statistics for LPI scores along with inputs and outputs.
20102018
AllHigh
Performing
Medium
Performing
Low
Performing
F-Test *AllHigh
Performing
Medium
Performing
Low
Performing
F-Test *
MeanSDMeanSDMeanSDMeanSDMeanSDMeanSDMeanSDMeanSD
Logistics performance index2.870.573.870.152.910.272.310.22380.472.870.573.870.172.880.372.430.24174.28
Inputs
    Customs2.590.613.700.212.590.352.070.17279.072.670.583.710.202.660.362.250.29171.30
    Infrastructure2.640.733.950.232.650.402.000.23287.092.720.673.950.232.710.422.230.28190.00
    Quality of logistics services2.760.633.880.222.780.352.200.21273.352.820.613.900.192.810.412.360.27165.59
Outputs
    International shipments2.850.473.510.222.920.302.440.24133.842.830.513.600.202.860.412.480.3476.70
    Tracking and tracing2.920.654.010.172.950.382.370.28214.132.900.613.960.182.920.402.430.33152.83
    Timeliness3.410.574.240.183.490.352.920.34139.823.240.574.150.203.280.422.830.28112.09
Total number of countries146257744 146257744
Note: * all the F-test values are significant at p < 0.01, SD: standard deviation.
Table 3. Kruskal–Wallis Rank test results for differences between performance groups.
Logistic
Performance
Catch-Up Effect
(2010–2018)
Frontier-Shift Effect (2010–2018)Malmquist Index
(2010–2018)
MeanSDKWMeanSDKWMeanSDKW
High0.9040.165 5.347 * 1.1140.029 30.176 ** 1.0090.193 4.450
Medium0.8960.1871.0910.0210.9790.207
Low0.9790.1901.0800.0131.0570.208
Overall0.9230.187 1.0920.024 1.0080.207
* p < 0.10; ** p < 0.001.
Table 4. Rank sum test results for pairwise comparisons between performance groups.
Pairwise ComparisonCatch-Up Effect
(2010–2018)
Frontier-Shift Effect (2010–2018)
Mean Rank DifferenceKWMean Rank DifferenceKW
Low-Medium18.3702.299 *23.9332.995 **
Low-High14.0311.32558.0175.478 **
Medium-High4.3390.44634.0833.501 **
Note: * p < 0.05; ** p < 0.001.
Table 5. The source of inefficiencies within the performance groups.
20102018
High
Performing
Medium
Performing
Low
Performing
High
Performing
Medium
Performing
Low
Performing
Input deficits
    Customs0.201 *0.698 **0.034 **0.343 **0.530 **0.526 **
    Infrastructure0.143 **0.597 **0.104 **0.370 **0.555 **0.647 **
    Quality of logistics services0.307 **0.485 **0.121 **0.360 **0.875 **0.852 **
Output deficits
    International shipments0.370 **0.777 **0.398 **0.410 **1.420 **1.051 **
    Tracking and tracing0.304 **0.920 **0.562 **0.442 **1.280 **0.994 **
    Timeliness0.238 **1.004 **0.242 **0.421 **1.390 **0.756 **
    Group Efficiencies
(Mean, SD)
0.970
(0.030)
0.888
(0.072)
0.936
(0.065)
0.953
(0.042)
0.818
(0.100)
0.867
(0.083)
No. of Efficient Countries6913552
No. of Inefficient Countries196831207242
Return to Scale (RTS)
Increasing (IRTS)217640247237
Constant (CRTS)412112
Decreasing (DRTS)002045
Note: * p < 0.05; ** p < 0.01; SD: Standard deviation.
Table 6. List of the countries according to LPI and efficiency scores.
LPI ScoresEfficiency Scores
2010201820102018
Best 5Worst 5Best 5Worst 5EfficientWorst 5EfficientWorst 5
High PerformingGermanySpainGermanyIrelandGermanySpainGermanyIreland
SingaporeUAESwedenTaiwanSingaporeUAESwedenLuxembourg
SwedenKoreaBelgiumKoreaSwedenKoreaBelgiumTaiwan
NetherlandsItalyAustriaLuxembourgNetherlandsItalyFinlandKorea/Rep
LuxembourgNew ZealandJapanNorwayLuxembourgNew ZealandDenmarkCanada
Switzerland
Medium PerformingCzech RepublicMoldovaCzech R.HaitiCzech R.IranCzech R.Yemen
ChinaIranPortugalGuineaChinaCongo D. R.ChinaHaiti
South AfricaUkraineChinaVenezuelaSouth AfricaEgyptPortugalSenegal
MalaysiaYemenPolandSenegalMalaysiaYemenHungaryVenezuela
PolandNigeriaQatarYemenPolandGuatemalaSloveniaSyrian Arab R.
Israel
Lebanon
Portugal
Oman
Low PerformingCameroonSierra LeoneCôte d’IvoireAfghanistanCameroonIraqCôte d’IvoireAfghanistan
NigerRwandaRwandaAngolaNigerCubaRwandaNiger
JamaicaCubaMontenegroNigerJamaicaSierra Leone Sierra Leone
Côte d’IvoireGuinea-BissauLao PDRSierra LeoneCôte d’IvoireNepal Cuba
PakistanIraqMaldivesLibyaPakistanSudan Papua New Guinea
Armenia
Bolivia
Gambia
Turkmenistan
Chad
Congo R.
Ghana
Montenegro
Note: the countries in bold designate the differences between LPI and efficiency ranking.
Table 7. Kruskal–Wallis rank test results for differences among logistics performance groups.
Logistics Performance Groups20102018
Pure Technical Efficiency (BCC)Pure Technical Efficiency (BCC)
MeanSDMeanSD
High0.9490.0500.8790.070
Medium0.8450.0890.8010.097
Low0.6290.0800.6290.068
Kruskal–Wallis Test94.539 *79.174 *
* p < 0.001; SD: standard deviation.
Table 8. Kruskal–Wallis rank sum test results for pairwise comparisons of BCC efficiency scores among logistics performance groups.
Pairwise
Comparison
20102018
Mean Rank
Difference
KWMean Rank
Difference
KW
Low-Medium 59.544 7.451 ** 57.974 7.254 **
Low-High 95.930 9.057 ** 84.771 8.003 **
Medium-High 36.386 3.738 ** 26.797 2.753 *
* p < 0.05; ** p < 0.001.
Table 9. The source of inefficiencies between performance groups.
20102018
AllHigh
Performing
Medium PerformingLow
Performing
F-TestAllHigh
Performing
Medium
Performing
Low
Performing
F-Test
Input shortages
    Customs0.378 ***0.0000.032 ***1.199 ***2537 ***0.124 ***0.0060.0060.398 ***2398 ***
    Infrastructure0.352 ***0.0000.018 *1.138 ***1942 ***0.117 ***0.015 *0.0070.367 ***1446 ***
    Quality of logistics services0.298 ***0.0000.0220.950 ***1196 ***0.173 ***0.029 *0.035 **0.498 ***288 ***
Output shortages
    International shipments0.084 ***0.0150.084 ***0.123 ***2.44 *0.097 ***0.084 **0.119 ***0.067 ***2.54 *
    Tracking and tracing0.114 ***0.0050.083 ***0.232 ***7.47 ***0.064 ***0.0310.057 ***0.094 ***1.99
    Timeliness0.347 ***0.0010.241 ***0.727 ***81.24 ***0.173 ***0.0270.069 ***0.437 ***178 ***
Note: * p < 0.1; ** p < 0.05; *** p < 0.01.
Table 10. Pairwise comparison of structural differences.
20102018
Low-Medium ξLow-High ξMedium-High ξLow-Medium ξLow-High ξMedium-High ξ
Input shortages
    Customs1.167 ***1.199 ***0.032 ***0.391 ***0.391 ***0.000
    Infrastructure1.121 ***1.138 ***0.018 *0.360 ***0.352 ***−0.008
    Quality of logistics services0.929 ***0.950 ***0.0220.463 ***0.468 ***0.005
Output shortages
    Tracking and tracing0.149 **0.231 ***0.082 ***
    Timeliness0.487 ***0.723 ***0.236 ***0.368 ***0.410 ***0.042 *
ξ: the not-equal variance assumption; * p < 0.1; ** p < 0.05; *** p < 0.01.
Disclaimer/Publisher’s Note: The statements, opinions and data contained in all publications are solely those of the individual author(s) and contributor(s) and not of MDPI and/or the editor(s). MDPI and/or the editor(s) disclaim responsibility for any injury to people or property resulting from any ideas, methods, instructions or products referred to in the content.

