Abstract
It is reported that the rapid rate of urbanization has negative impacts on the environment, society, and economic conditions in the capital of Pakistan, which need to be addressed for sustainability. This study attempts to quantify the level of urban sustainability by using a Multiple Linear Regression Analysis in a social context. Primary data were collected through a random sampling survey, while secondary data were collected from the Capital Development Authority, public documents, and past studies or case reports. These data were associated with land values, property rent, the availability of commercial space, social security, the sense of belonging, and the frequency of urban flooding. The major sources of secondary data were the revised master plan of the city (2020–2040), urban gazette data, land value registers, property dealers’ records of real estate, and government documents. The results of the analyses show that there is a strong correlation between the selected variables and the urban sustainability of the area. These results were expressed through the coefficient of regression and coefficient of correlation through regression statistics, including R = 0.801 for economic sustainability, R = 0.822 for urban sustainability, and R = 0.905 for social sustainability. The results reveal that the level of urban sustainability is at risk due to overpopulation and the degradation of the ecosystem. It is concluded that there is a need for the implementation of a revised master plan in the area for the sustainable development of the city.
1. Introduction
The rapid rate of land use, land cover change, and urban expansion are major causes of changes in landscapes, affecting the local environment, economy, and society, and the same case is reported in the capital city of Pakistan. Urban land use, urbanization, and sustainability are closely related to each other in environmental, economic, and social contexts [1]. This study attempts to identify the major environmental, economic, and social issues faced by the population that threaten the urban sustainability of the area. This study applies a social survey and an examination through regression analysis techniques to quantify the level of urban sustainability and its correlation with the environment, economy, and society. First, the analyses involved a primary survey to obtain the basics of the environmental, economic, and social issues faced by the population. After that, the sustainability measuring indicators were selected from past material and government documents as secondary data, including Capital Development Authority reports, the revised master plan of the city, and urban gazette data.
Urban sustainability is a broader term in multiple domains, mainly consisting of three pillars including economic, social, and environmental parameters for sustainability and its measurements in a city [2,3,4]. Previous studies on urban sustainability consider indicators from the physical environment, including land use land cover change, the variation in daily weather conditions, the air quality index, and the level of occurrence of natural disasters [5,6]. For economic sustainability measurements, researchers use land values in the area, employment opportunities, the sizes of houses, and house ownership data [7]. Similarly, to measure social sustainability, several studies have used the level of the sense of belonging, the level of maintenance of neighborhood facilities, provisions of neighborhood services, health care facilities, the presence of parks in a settlement, the availability of sports facilities, and solid waste management in the area [8,9]. However, there is still a debate in measuring sustainability using fixed indicators due to the complicated morphology and heterogeneous nature of different environmental and sustainability indicators.
Investigations have shown that cities around the world, including the capital of Pakistan, face multi-domain issues affecting their environment, sustainability, and spatial patterns [10]. This city has a strategic position and importance in the country as a capital; therefore, it is necessary to tackle the challenges regarding the sustainable development of the city in multiple domains. The multi-domain issues and strategies to achieve a sustainable city vary from time to time and from space to space [11]. However, this idea has gained more and more importance among thinkers, leaders, and managers to make the planet the home of humans. The fundamental goal for a sustainable city is the provision of services to its citizens at maximum livelihoods and equity [12], and this study is the first to make this attempt in a socio-economic context by using a regression analysis. Sustainability means maximum efficiency and improved quality of life without damaging the environment, society, economic stability, or equity [13].
The results of this study represent a snapshot of the current phases of development of the urban area of Islamabad, Pakistan for country development and prosperity based on public opinion and expressed through a Multi Linear Regression Analysis (MLRA). It is concluded that there is a dire need for research on social, economic, and environmental concerns for city sustainability and development. The current research provides a road map and opens the doors for further research by using other variables, such as environmental pollution and groundwater potential in different areas of Islamabad or other regions of the country, for regional development and sustainability.
2. Review of Literature
Cities around the world are expanded spatially and economically [14]. This trend is gradually increasing, and it is expected that about 70 percent of the world’s population will live in cities by 2050 [15]. On the other hand, slum areas also comprise significant living areas on earth, and 1.1 billion people are living in slums; this number is expected to increase by 2 billion in the next 30 years [16,17]. The rapid rates of population increases and urbanization are far beyond the capacity of urban areas to meet their demands and sustain their living conditions for a healthy environment. The rapid rate of urbanization, out-space housing infrastructure, road networking, and segregated residential colonies lead to slums or slums-like patterns in urban areas. Due to this phenomenon, public spaces, urban green spaces, cityscapes, and local services are limited, and air pollution, poor hygiene, solid waste material, and other related issues persist in cities around the world [18]. This will lead to challenges for city sustainability and also for the United Nations Sustainable Development Goals, particularly SDG-11, to make cities inclusive, safe, resilient, and sustainable for human settlement [19]. Therefore, it is very important to manage, monitor, and control unplanned urbanization for urban sustainable development.
In developing nations, populations have moved towards cities from the surrounding regions, mostly rural areas, which has led to inequalities and poverty in urban areas regarding their abilities to provide resources and ensure social equity [20]. This has created urban inequality, which is a problem for the poor and low dwellings [21]. Energy crises, solid waste, no access to public transportation, and insufficient public infrastructure are some of the indicators of this inequality for poor urban areas. Cities consume more energy to meet their needs and generate more carbon emissions, which contribute to climate change and natural hazards. It is estimated that a total of 60 to 80 percent of energy is consumed by cities, and cities contribute approximately 75 percent of carbon emissions around the world [22,23]. Due to this impact, urban areas and major cities are vulnerable to climate change and natural disasters, which lead to economic, social, and human losses. On planet Earth, urban areas cover only 3 percent of the land area but significantly contribute to the increase in natural disasters [24], i.e., climate change floods and pollution, along with other social and ecological disruptions. These phenomena will lead to inequalities, social and climatic gentrification, locational unrest, and insecurity for every individual at local, regional, national, and, international scales [25].
Urban sustainability demands a better future in an urban environment [26]. The world is becoming intelligent and efficient in every sphere of life, which demands a high level of living in every corner of a region [27]. Therefore, a healthy environment, pure air without any pollution, and land with all ecosystem services are needed for a sustainable city [28]. Transforming every city into a sustainable city is the agenda of every developed and developing nation to ensure the quality of its citizens; this is achieved by providing adequate housing, safe food and water, the provision of ecosystem services, green city spaces, accessible transportation, affordable energy, industrial development without carbon emissions or low carbon emissions, and environmental justice [29]. This scale of development will ensure a good standard of living and surely make a city a sustainable city. A sustainable city will have more resilience to cope with any natural disaster with a minimum loss of economic, societal, or ecological infrastructures [30].
Around the world, all the capital cities are becoming more and more developed in every phase, i.e., social, economic, political, and ecological circles [31]. This development may relate to sustainable land planning, infrastructure development, capital infrastructure, good governance, technology and innovation in transportation, management of mass transit, information technology, etc. Around the world, artificial intelligence has been adopted by several countries, even in the least developed nations [32], particularly in airports and the transportation, education, food and agriculture, and healthcare industries [33,34]. The basic agenda for this adoption is a sustainable environment and services for the betterment of humans.
Measuring economic and social sustainability is challenging [35]. Therefore, the current study uses a Multiple Regression Analysis by using different parameters of environmental, economic, and social concerns for sustainability measures. Regression analyses are already used for measuring sustainability around the world [36]. These economic parameters include job opportunities, land values in urban areas, the ownership of residents, and the sizes of houses. Meanwhile, social sustainability was measured by using parameters including medical facilities, the sense of belonging, urban green spaces in the area, and house rent paid by the residents in the city. Similarly, urban sustainability is considered an important parameter for a sustainable city. Several organizations, along with the Government of Pakistan, are taking multiple steps in planning and development to turn the city into a sustainable city. However, due to the over usage of natural resources by the population to meet the demands of locals, it is a challenging task for the government and relevant stakeholders.
3. Materials and Methods
3.1. Study Area
Islamabad, the capital of Pakistan, was selected as the study area. This city was built according to a German town plan known as the Dioxides principle (a city with grid pattern infrastructure) [37]. This grid pattern infrastructure has different sectors for settlements and residential and commercial spaces, including the Margalla hills (an area covered with forests and enriched biodiversity). The city has a high profile and social diversity in economic and social contexts due to its central importance in the country as a capital city. However, the rapid rate of urban expansion and urbanization causes different issues, including environmental instability, the degradation of local ecosystem, loss of urban green space, and pollution. Additionally, the increasing population needs more jobs, which creates a job deficiency in the area and an issue for economic stability. This city was built for the elite class of the country, but migration from the surrounding areas has caused social disintegration in the city, which is an issue for the local society and social sustainability of the area.
All of these characteristics make this study suitable for the assessment of environmental, economic, and social sustainability measurements. It has been noted that in the past few decades, the city has been losing its charm due to the rapid rates of population increase and urban expansion. This unplanned rate of urbanization challenges the area’s development and sustainability, which need to be addressed for regional sustainability and for the country’s development by keeping a balance between human activities and nature to achieve the UN’s goals for regional diversity. As a capital city, this area should be environmentally stable and economically and socially diverse. That is why this study provides some evidence for policy-making and developmental projects. Figure 1 shows the location of the study area in Islamabad, Pakistan.
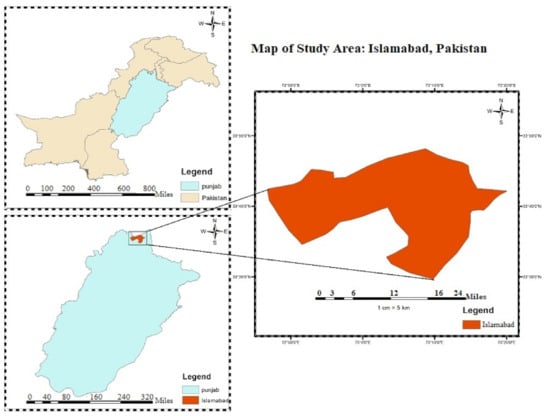
Figure 1.
Map of study area: Islamabad, Pakistan.
3.2. Methods
The Methods Section consists of different steps including the conceptualization of the topic, data collection, review of related documents, secondary data collection, and analyses of the results. Figure 2 provides a step-by-step overview of this framework of methodology.
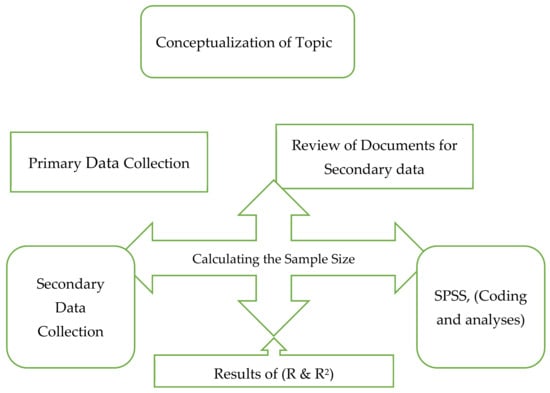
Figure 2.
Workflow of methods.
Data Collection: The data collection process of this research is based on two phases to examine the levels of sustainability in the study area. This study proposed to examine the city from a social aspect by analyzing society’s perception of urban sustainability. The primary data were collected through a random sampling survey to analyze the current challenges faced by the local population with an open-ended questionnaire. The questionnaire consisted of four parts. The first part was related to the socio-economic profile of the residents/interviewer, the second portion was related to environmental conditions in the area, the third portion was associated with economic conditions, and the fourth part was related to the social conditions of the area. This survey provides a snapshot/baseline of the major environmental, economic, and social issues faced by the locals. From these bases, relevant documents such as the revised master plan of the city, urban gazette, weather reports from the environmental protection agency, and projects of the Capital Development Authority (CDA) were studied, and urban sustainability indicators were selected.
After the selection of indicators for secondary data collection, urban sustainability questions were asked, which were related to the local weather conditions in the area, such as the occurrence of natural disasters, their frequency, changes in seasonal average temperature, and changes in weather patterns. Similarly, the data associated with economic sustainability were collected by asking the public’s opinion regarding the availability of jobs, land values and their prices in the past two decades in this area, sizes of their residencies, and house ownership. Social sustainability was judged by public opinion regarding the sense of belonging; sense of security in the area; the services available in the surroundings; accessibility to the roads, streets, and market; and provision of municipal services in the settlement.
Survey Methods: The total population of the city is 2.3 million according to the National Survey of Pakistan, as reported in [38]. A total of 400 respondents were interviewed from the population. The sample size was calculated through the below formulation, and the online calculator available at https://www.calculator.net/sample-size-calculator.html (accessed on 12 October 2023) or this calculation at a 95% confidence level was used, where “n” is population, “” is population portion, and n is sample size.
Source: [39].
The questionnaire was filled as primary data by asking the public’s opinion regarding the social conditions in the area, security issues, and facilities available in the settlement areas. This survey data with open-ended questions provides a snapshot of all issues associated with the environment, economy, and society in the urban area of Islamabad and explains the current scenarios of sustainability and its challenges.
Secondary Data Collection: Based on primary data collected from the survey, the secondary data, including the revised master plan (2020–2040) of the city, documents of Capital Development Authority (CDA), land value records, urban gazette data, and published material in the past, were studied. After a very comprehensive review of all of these documents, the variables for secondary data were selected, including land values (LVs) in the area from the capital urban gazette, housing rent (HR) from property real estate dealers, job opportunities (JOs) in the area from the Federal Board of Revenue, ownership of house and vehicle (OHV), and size of the residency (SR) for economic sustainability measures. A Likert scale with points (ranging from 1, strongly agree, to 5, strongly disagree) was used to quantify the public opinions, including their levels of satisfaction, ranging from strongly agree to strongly disagree. Statistical Software for Social Sciences (SPSS, Version 23) was used for further analyses. Their correlation with urban sustainability was examined through Multiple Linear Regression Analysis (MLRA) and regression equations.
For environmental sustainability or physical environmental sustainability, the level of occurrence of natural disasters (ONDs), change in weather pattern (CWP), and loss of urban green (LUG) were selected for regression analyses. These data were provided by documents from the Ministry of Climate Change and Environmental Coordination and past published papers. Similarly, the provision of neighborhood services (PNS); sense of belonging (SB) among the local dwellers; presence of parks and playgrounds (PP); easy access (AM) to markets, accessible roads, and street networks (ARS); and solid waste management (SWM) in the areas were selected as social sustainability indicators. For statistical examination, the Multiple Linear Regression Analysis (MLRA) was applied, and the results were expressed through the values of “R” and “R2” as the coefficient of regression and coefficient of correlation. The following regression equations were adopted for regression analysis in the overall assessment of the research.
In Equation (1), “∑US” represents urban sustainability, that is, the combination of all (economic, environmental, and social) sustainability indicators of the study area. Furthermore, to measure the level of sustainability of each pillar, every pillar was examined individually by different parameters associated with their nature. These equations include the formulation shown below.
The mathematical equation for economic sustainability (ES) is as follows:
In Equation (2), “∑ES” is economic sustainability, XLV is the sum of public opinion of land values, XJO is the sum of public opinion of job opportunities, XOHV is the ownership of a house, and XSR represents the size of residency. The investigations show that, due to the rapid rate of urbanization, the high demand for commercial spaces and land increases the land values, prices, and commercial rent in the area, which is alarming for the economic sustainability of the area.
The mathematical equation for urban sustainability (ENVIS) is as follows:
∑ENVIS is environmental sustainability in Equation (3), which is a combination of public opinion regarding the “XOND”, or the occurrence of natural disasters; “XCWP”, or the change in the weather pattern; and “XLUG”, which is associated with the public’s opinion regarding loss of urban green (LYG). It has been observed that, due to the high rate of conversion of natural land into built-up infrastructure, urban green space is lost in the region.
The mathematical equation for social sustainability (SS) is as follows:
In Equation (4), the formulation expresses the conceptualization of the social sustainability in the area. In the above equation, ∑SS represents social sustainability, which is measured by “XPNS”, or the provision of neighborhood services; Xpp, or the presence of parks; “XAM”, or access to the market; “XARS”, or accessible road and streets networks; and “XSWM”, or solid waste management in the area. For social sustainability, the provision of social services, including open public spaces and = accessibility to neighborhood services, green spaces, and parks, are the fundamental needs in an area, and this has been approved by previous research [40].
The significance and impact of the economic estimation of each independent variable on the dependent variable were expressed through the coefficient table and regression results. The coefficient table uses the values of R (correlation coefficient), R2 (coefficient of determination), and adjusted R2; the coefficient of regression was used to show the statistical results of the analysis. The values of R and R2 close to −1 and +1 show the relevant percentages of the used variables.
Finally, after a very careful investigation and comprehensive review of past studies, reports, and the revised master plan of the city, this research provides empirical evidence regarding the current scenarios of environmental, economic, and social indicators affecting the city’s sustainability and development. These results will be useful tools for maintaining the city’s landscape and its beauty and to boost the level of development to achieve the society’s well-being and United Nations Sustainable Development Goals.
4. Results
The results obtained from the investigations of environmental conditions and the socio-economic profile of the city express that unplanned urbanization is a critical issue for sustainability in the area. The migration pattern caused unpredicted spatial city expansion, which negatively impacted the environment, society, economy, and the local ecosystem. The results of this study were divided into four parts; part one provides the socio-economic profiles of the respondents, and the other three parts provide the results of each sustainability measuring variable.
Table 1 provides the socio-economic profile of the respondents; this study only considers the respondents that have been living in the city by birth or for more than 5 years, from the age of 20 years or above, with high education (at least graduate education). The reason for choosing these criteria was the knowledge about the sustainability and sustainable development of the area.

Table 1.
Socio-economic characteristics/profiles of respondents.
For ground truth, this study only selects data from residents or the public who have been living in the area for at least 5 years or more. For measuring economic sustainability, the regression model was adopted by using six variables, as described above in the equation, and the results show the following potential of all selected variables. Table 2 expresses the results of the analysis by showing the regression coefficient and correlation among the variables.
Table 2.
Regression summary of selected variables for economic sustainability.
Above Table 2, the values of R and R2 express the results of the multiple regression of six variables associated with economic variables. According to the results, there is a strong correlation between the selected variables and economic sustainability. This means that the high land values, high commercial space rent, and unavailability of economic opportunities in the city challenge the economic stability of the area. This is mainly caused by high demands of land for housing and land acquisition due to settlement for the increasing population. This effect boosts the housing market and increases the land values in the urban area, which is a crucial affordability issue for poor urban spaces and creates economic inequality and sustainability.
Table 3 expresses the results of each variable selected for the economic assessment of sustainability in the area. In the above table, all beta values obtained from the analysis are statistically significant, meaning the selected variables are the best-predicated parameters for economic sustainability in the area. Secondly, the increasing population and urban land use expansion without adopting any plan or pattern alters the environmental conditions of the area. This impacts the local ecosystem by decreasing the urban green infrastructure, alternating local ecosystem services, and increasing the occurrence of natural disasters such as urban floods and rapid rain bursts. For this assessment, this study used a combination of three variables, as shown above in Equation (3), and their results are expressed in Table 4 below.
Table 3.
Regression coefficients of economic sustainability variables.
Table 4.
Regression summary for environmental sustainability variables.
The above results in Table 4 express the overall suitability of the analysis based on the selected variables for the environment. The values of R and R2 represent the coefficient of regression and express 82% model suitability for the estimation of urban sustainability through the selected variables. The regression model illustrates that in the city, the occurrence of natural disasters due to changes in local weather patterns significantly impacts the local biodiversity and ecosystem in the area. This has led to the loss of urban green infrastructure and an increase in the daily average temperature in the region.
Table 5 expresses the coefficient values of each environmental variable, which shows statistically significant results. The increasing population also causes the conversion of natural land to urban built-up, which ultimately causes an alternation in the natural cycle of the ecosystem and the weather conditions of the region.
Table 5.
Regression coefficients of environmental sustainability variables.
Table 6 presents the regression summary of the social sustainability indicators. According to the results, the dependency of social sustainability on the selected variables by a ratio of 90%, according to the values of R, is the coefficient of correlation of regression. Similarly, the value of the coefficient of regression (R2) is 0.753, which is statically significant and shows a strong correlation among all six variables for the estimation of the social sustainability of the area. Table 6 expresses the summary of the regression coefficient for each social sustainability variable.
Table 6.
Regression summary for social sustainability variables.
The results in Table 7 show that, due to the expansion of urban areas, the concerned authorities are unable to provide social services to all urban dwellers. The increasing demands for social services also cause the deficiency of resources, which will challenge the social sustainability and development of the area. This includes solid waste management problems, congested road networks, and deficient parks and playgrounds in residential communities and settlement areas in the city. The rapid rate of urbanization affects the social stability in the area; people from all over the country moved here and settled in commercial spaces that require rent, which caused a loss of the sense of belonging, because most people moved to their homes during holidays and social events. The rapid rate of urbanization also creates complications for society in terms of a lack of public spaces, the poor quality of social services and their provisions, and social inequity in the capital city. This will challenge the social stability and social development of the area at risk. These social challenges include urban slums, congested roads and streets, beggars on the roads, and criminal activity in the area. These issues create social unrest in the city.
Table 7.
Regression coefficients of social sustainability variables.
From the results, it is estimated that the proposed hypothesis is true, and the selected variables are reliable to define the level of urban sustainability in the area. The results reveal that, due to the increasing population, the demand for urban housing has increased in the area. Different housing schemes worked in the city to generate profit by introducing housing schemes and developmental projects. These schemes degrade the local ecosystem by converting the natural habitat into urban built-up infrastructure. The increasing rate of migration from the surrounding areas also causes rapid urbanization in the region, which leads to a deficiency of social services, urban parks, and green infrastructure. The movement of people from all over the country who have diverse backgrounds and settle in commercial houses that require rent shows a lack of belongingness in the city.
Our analyses show that sustainability-associated issues need to be addressed for an area’s sustainable development. The concerned authorities should focus on the implementation of the master plan of the city to stop illegal housing schemes and ban deforestation in the Margalla Hills (forest area) for land acquisition. The migration rate towards the capital should be stopped to sustain the social stability of the city. Developmental projects should only be passed after a comprehensive environmental impact assessment review to protect the nature and ecosystem. Our study concluded that, if the area faces the same rate of urbanization in the next few years, it will be difficult for the concerned authorities to tackle the challenges and turn the city into a sustainable city.
5. Discussion
Sustainable urban expansion is considered an important element for development and planning. However, rapid urban expansion creates different challenges for sustainable urban development around the globe. The same situation is observed in the study area, Islamabad, Pakistan, and is also proven by previous research [41]. This study expressed that sustainability is fundamental for economic growth, environmental protection, and social equality for the provision of services and equity among communities for all individuals in the city. It has been noted that the rapid urbanization rate creates multiple issues for the sustainable development of urban areas, including environmental degradation, social issues, and economic instability in Islamabad, Pakistan. This study found that if the city faces the same situation in the next few decades, the urban area shall lose its charm and natural beauty, along with sustainability. Therefore, it is necessary to take serious steps to overcome these environmental, economic, and social issues in the area.
Sustainable urban development ensures economic prosperity and growth, social security and equity, health, ecosystem, and justice for all citizens of an area [42]. This can only be possible by adopting environmentally friendly strategic approaches to reduce the negative impacts of human activities on society and their dependency on nature and the ecosystem. Sustainable practices have diverse backgrounds and classifications in every field and area; that is why the definition of sustainability varies from area to area and from time to time [43]. Every area and every country have geographical scales and developmental levels; therefore, the nature of adoption is also varied. For our area, mitigation measures, including a ban on deforestation in the Margalla Hills and migration from surrounding areas, should be implemented, along with population control. However, city sustainability is more concerned with the environment, economy, and society, and our study shows this association by using the graph obtained from the regression analyses of the study.
Ground truthing is a suitable way to understand the social issues of any area. Different researchers use multiple dependent and independent indicators in social sciences to examine urban sustainability in urban areas around the world [44,45]. Therefore, these indicators vary from area to area and from region to region based on their geographical requirements and needs. After the evaluation of the current results, it was found that the environment is a major concern for sustainability in the area. This may include the physical environment, economic conditions of an area, or social values. However, regression analyses are the best for examining the relationship between dependent and independent variables.
To understand the correlation between the selected variables and area sustainability, the following graph, as a model, was adopted to represent the suitability and dependency of the selected variables and their correlations with the dependent variables. The graph in Figure 3 shows a smooth line expressing a strong correlation between dependent and independent variables in the regression analyses.
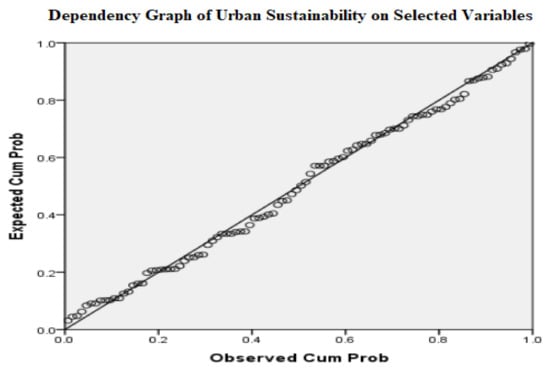
Figure 3.
Dependency graph of regression analysis.
Across the globe, sustainable development and sustainability are associated and linked with environmental and socio-economic well-being. In developing countries, it is still difficult to achieve sustainable development goals due to unplanned urbanization and population increase [46]. This urbanization impacts the urban environment and increases the demand of natural resources gradually to meet human needs. For regional sustainability, therefore, it is better to take cross-continent measures for global development and make the earth the home of humans. Multidisciplinary approaches should be adopted and followed to tackle the issues and achieve the UN’s goals in real spirit.
6. Conclusions
Our study concluded that the city faces economic, social, and environmental challenges due to the over-exploitation of natural resources by over-usage, traffic congestion in settlement areas, and the conversion of natural land to built-up infrastructure. Urban flux in Islamabad is also a major reason for its urban expansion and city sprawl, and it is challenging for city sustainability. This rapid city sprawl causes unplanned settlement and the overuse of nature and the ecosystem; the population increase and migration towards the city are also driving forces of city expansion in terms of area and size. The conversion of natural land and forests into housing colonies and urban networking are the major causes of this alternation, which leads to negative impacts on the environment and biodiversity loss in the area.
Several slum areas exist in city boundaries, mainly consisting of poor urbanities. These slum housing societies in the city cause traffic jams and traffic congestion, harming regional social integrity.
In the economic assessment of this area, this research found that the unavailability of planned and better transportation networking, lack of affordable housing, efficient/integrated public transport, and financial affordability in land values were additional indicators of threat to economic sustainability. As a capital city, the area also faced protests several times during political instability periods in the country, which are threats to social security in the city. Therefore, the area required proper planning, security, and political stability for the social integration of the region. On the other hand, deforestation in the Margalla Hills should be stopped to protect the local ecosystem and biodiversity for environmental protection.
This study provides ground-based evidence and the shortcomings of the current level of sustainability of the area. The results show some major issues by indicating their correlation with the urban sustainability of the area, and they will be very fruitful for city planning and development. Our study also opens the doors for other cities by selecting other sustainability indicators that are needed in a particular city or area. It has been found that the Capital Development Authority (CDA) enhanced its service catchment area to ensure sustainable development by providing services to the residents of Islamabad. The city needs the proper and practical implementation of a master plan to maintain its infrastructure for future generations. Deforestation in Margalla should be stopped urgently for the protection of local biodiversity. Reducing pollution and the emission of harmful gases; ensuring the quality of life, affordable housing, and low rent in commercial areas; and providing access to smart transportation and urban green infrastructure are fundamental steps to ensure the sustainable development of the city.
Author Contributions
Conceptualization, A.A. and M.M.A.; methodology, A.A.; software, A.A.; validation, A.A. and M.M.A.; formal analysis, A.A.; investigation, A.A.; resources, M.M.A.; data curation, A.A.; writing—original draft preparation, A.A.; writing—review and editing, A.A.; visualization, A.A.; supervision, M.M.A.; project administration, A.A.; funding acquisition, A.A. All authors have read and agreed to the published version of the manuscript.
Funding
This research received no external funding.
Data Availability Statement
Data is available on request to corresponding author via email.
Acknowledgments
The data used in the research, analyses, and writeup of this paper are solely part of the Ph.D. Thesis of Asad Aziz, Department of Geography, University of Gujrat, Pakistan.
Conflicts of Interest
The authors declare no conflicts of interest.
References
- Khan, M.S.; Ullah, S.; Sun, T.; Rehman, A.U.; Chen, L. Land-Use/Land-Cover Changes and Its Contribution to Urban Heat Island: A Case Study of Islamabad, Pakistan. Sustainability 2020, 12, 3861. [Google Scholar] [CrossRef]
- Pastor, R.; Fraga, A.; López-Cózar, L. Interoperable, Smart, and Sustainable Urban Energy Systems. Sustainability 2023, 15, 13491. [Google Scholar] [CrossRef]
- Purvis, B.; Mao, Y.; Robinson, D. Three pillars of sustainability: In search of conceptual origins. Sustain. Sci. 2019, 14, 681–695. [Google Scholar] [CrossRef]
- Mensah, J. Sustainable development: Meaning, history, principles, pillars, and implications for human action: A literature review. Cogent Soc. Sci. 2019, 5, 1653531. [Google Scholar] [CrossRef]
- Arshad, A.; Ashraf, M.; Sundari, R.S.; Qamar, H.; Wajid, M.; Hasan, M.-U. Vulnerability assessment of urban expansion and modelling green spaces to build heat waves risk resiliency in Karachi. Int. J. Disaster Risk Reduct. 2020, 46, 101468. [Google Scholar] [CrossRef]
- Lai, S.; Leone, F.; Zoppi, C. Spatial Distribution of Surface Temperature and Land Cover: A Study Concerning Sardinia, Italy. Sustainability 2020, 12, 3186. [Google Scholar] [CrossRef]
- Alabdulwahab, S. The Impact of a Sustainable Economic Development Focus on the Real Exchange Rate in Saudi Arabia. Sustainability 2023, 15, 13422. [Google Scholar] [CrossRef]
- Staniškienė, E.; Stankevičiūtė, Ž. Social sustainability measurement framework: The case of employee perspective in a CSR-committed organisation. J. Clean. Prod. 2018, 188, 708–719. [Google Scholar] [CrossRef]
- Dijkstra-Silva, S.; Schaltegger, S.; Beske-Janssen, P. Understanding positive contributions to sustainability. A systematic review. J. Environ. Manag. 2022, 320, 115802. [Google Scholar] [CrossRef]
- Hosseini, M.; Farashi, A.; Khani, A.; Farhadinia, M.S. Landscape connectivity for mammalian megafauna along the Iran-Turkmenistan-Afghanistan borderland. J. Nat. Conserv. 2019, 52, 125735. [Google Scholar] [CrossRef]
- Wang, Z. Research on Smart City Environment Design and Planning Based on Internet of Things. J. Sens. 2022, 2022, 2348573. [Google Scholar] [CrossRef]
- Malla, F.A.; Bandh, S.A. Chapter 2—Biofuels and sustainable development goals. In Environmental Sustainability of Biofuels; Hakeem, K.R., Ed.; Elsevier: Amsterdam, The Netherlands, 2023; pp. 13–26. Available online: https://www.sciencedirect.com/science/article/abs/pii/B9780323911597000102 (accessed on 9 February 2024).
- Wang, M. Chapter 40—Sustainable Development. In Lees’ Loss Prevention in the Process Industries, 4th ed.; Mannan, S., Ed.; Butterworth-Heinemann: Oxford, UK, 2012; pp. 2507–2521. [Google Scholar]
- Fernandes, D.; Machado, C. Chapter 9—Connecting ecological economics, green management, sustainable development, and circular economy: Corporate social responsibility as the synthetic vector. In Green Production Engineering and Management; Machado, C., Davim, J.P., Eds.; Woodhead Publishing: Sawston, UK, 2022; pp. 183–236. [Google Scholar]
- Shayan, N.F.; Mohabbati-Kalejahi, N.; Alavi, S.; Zahed, M.A. Sustainable Development Goals (SDGs) as a Framework for Corporate Social Responsibility (CSR). Sustainability 2022, 14, 1222. [Google Scholar] [CrossRef]
- Soma, H.; Sukhwani, V.; Shaw, R. An approach to determining the linkage between livelihood assets and the housing conditions in urban slums of Dhaka. J. Urban Manag. 2022, 11, 23–36. [Google Scholar] [CrossRef]
- Bikis, A.A.-O. Urban Air Pollution and Greenness in Relation to Public Health. J. Environ. Public Health 2023, 2023, 1687–9813. [Google Scholar] [CrossRef] [PubMed]
- Wang, W.; Zhang, S.; Zhang, L.; Liu, Q. Government subsidy policies and corporate social responsibility. IEEE Access 2020, 8, 112814–112826. [Google Scholar] [CrossRef]
- Nation, U. Goal 11: Make cities inclusive, safe, resilient and sustainable. In Goal 11: Make Cities Inclusive, Safe, Resilient and Sustainable; Nation, U., Ed.; United Nation: New York, NY, USA, 2015. [Google Scholar]
- Xu, R.; Yue, W.; Wei, F.; Yang, G.; Chen, Y.; Pan, K. Inequality of public facilities between urban and rural areas and its driving factors in ten cities of China. Sci. Rep. 2022, 12, 13244. [Google Scholar] [CrossRef] [PubMed]
- Kuddus, M.A.; Tynan, E.; McBryde, E. Urbanization: A problem for the rich and the poor? Public Health Rev. 2020, 41, 1. [Google Scholar] [CrossRef] [PubMed]
- Crane, M.; Lloyd, S.; Haines, A.; Ding, D.; Hutchinson, E.; Belesova, K. Transforming cities for sustainability: A health perspective. Natl. Libr. Med. 2023, 147, 1873–6750. [Google Scholar] [CrossRef]
- Meng, X. Rural–Urban Migration, Urban Poverty and Inequality, and Urbanization in the People’s Republic of China. In Internal Migration, Urbanization and Poverty in Asia: Dynamics and Interrelationships; Jayanthakumaran, K., Ed.; Springer: Singapore, 2019; pp. 77–107. Available online: https://www.researchgate.net/publication/334551990_Rural-Urban_Migration_Urban_Poverty_and_Inequality_and_Urbanization_in_the_People’s_Republic_of_China (accessed on 9 February 2024).
- He, C.; Huang, Q.; Bai, X.; Robinson, D.T.; Shi, P.; Dou, Y.; Zhao, B.; Yan, J.; Zhang, Q.; Xu, F.; et al. A Global Analysis of the Relationship Between Urbanization and Fatalities in Earthquake-Prone Areas. Int. J. Disaster Risk Sci. 2021, 12, 805–820. [Google Scholar] [CrossRef]
- González-Marín, P.; Vásquez-Vera, H.; López-Gay, A.; Peralta, A.; Solana-Solana, M.; Fernández, A. Gentrification and its association with health inequalities in Barcelona (2011–2017). Front. Environ. Health 2023, 2, 1202149. [Google Scholar] [CrossRef]
- Roggema, R. The future of sustainable urbanism: A redefinition. City Territ. Arch. 2016, 3, 22. [Google Scholar] [CrossRef]
- Lu, H.; Shang, Z.; Ruan, Y.; Jiang, L. Study on Urban Expansion and Population Density Changes Based on the Inverse S-Shaped Function. Sustainability 2023, 15, 10464. [Google Scholar] [CrossRef]
- Bănică, A.; Kourtit, K.; Nijkamp, P. Natural disasters as a development opportunity: A spatial economic resilience interpretation. Rev. Reg. Res. 2020, 40, 223–249. [Google Scholar] [CrossRef]
- Ibiwumi, S.; Evangelisca, A. Sustainable Housing in Developing Countries: A Reality or a Mirage. In Sustainable Housing; Amjad, A., Asaad, A., Eds.; IntechOpen: Rijeka, Croatia, 2022; p. 6. [Google Scholar]
- Abdul, L.; Yu, T.-F. Resilient Urbanization: A Systematic Review on Urban Discourse in Pakistan. Urban Sci. 2020, 4, 76. [Google Scholar] [CrossRef]
- Paulin, A. Governing the Public Apparatus Through Technology. In Smart City Governance; Paulin, A., Ed.; Elsevier: Amsterdam, The Netherlands, 2019; pp. 141–142. [Google Scholar]
- Demaidi, M.N. Artificial intelligence national strategy in a developing country. AI Soc. 2023, 7, 1–13. [Google Scholar] [CrossRef]
- Paulin, A. (Ed.) Chapter 2—Digitalized Governance—An Embezzled Opportunity? In Smart City Governance; Elsevier: Amsterdam, The Netherlands, 2019; pp. 39–60. [Google Scholar]
- Batty, M. Foreword: The landscape of smart cities. In Untangling Smart Cities; Mora, L., Deakin, M., Eds.; Elsevier: Amsterdam, The Netherlands, 2019; pp. ix–xi. [Google Scholar]
- Razia, S.; Abu Bakar Ah, S.H. A call to action: Unpacking the challenges to implementing social sustainability initiatives in a developing country city. Heliyon 2023, 9, e19085. [Google Scholar] [CrossRef] [PubMed]
- Mirghaderi, S.-H.; Ghiri, Z. Measuring sustainable development: Linear regression approach. Int. J. Sustain. Dev. 2019, 22, 110. [Google Scholar] [CrossRef]
- Khattak, M.M.H.; Din, S.U.; Khan, M.Z.; Habib, M.F. Examining equity of walking accessibility to green spaces: A case study of Islamabad. Ain Shams Eng. J. 2023, 14, 102556. [Google Scholar] [CrossRef]
- Abbas, G. Digital Census: Pakistan registers record 249.5 million population. In Digital National Survey of Pakistan; Pakistan, D.N.S.O., Ed.; Pakistan Today: Islamabad, Pakistan, 2023; Available online: https://www.pakistantoday.com.pk/2023/05/22/pakistans-first-digital-census-records-249-5-million-population/ (accessed on 10 February 2024).
- Calculator. Net. Sample Size Calculator. Find Out The Sample Size 2023. Available online: https://www.calculator.net/sample-size-calculator.html?type=1&cl=95&ci=5&pp=50&ps=1500000&x=Calculate (accessed on 24 November 2023).
- Doğu, F.U.; Aras, L. Measuring Social Sustainability with the Developed MCSA Model: Güzelyurt Case. Sustainability 2019, 11, 2503. [Google Scholar] [CrossRef]
- Rees, W.E. Ecological footprints and appropriated carrying capacity: What urban economics leaves out. Int. Inst. Environ. Dev. 1992, 4, 121–130. [Google Scholar] [CrossRef]
- Aziz, A.; Anwar, M.M.; Majeed, M.; Fatima, S.; Mehdi, S.S.; Mangrio, W.M.; Elbouzidi, A.; Abdullah, M.; Shaukat, S.; Zahid, N.; et al. Quantifying Landscape and Social Amenities as Ecosystem Services in Rapidly Changing Peri-Urban Landscape. Land 2023, 12, 477. [Google Scholar] [CrossRef]
- Yang, F.; Wen, X.; Aziz, A.; Luhach, A.K. The need for local adaptation of smart infrastructure for sustainable economic management. Environ. Impact Assess. Rev. 2021, 88, 106565. [Google Scholar] [CrossRef]
- Buzási, A.; Jäger, B.S. Exploratory Analysis of Urban Sustainability by Applying a Strategy-Based Tailor-Made Weighting Method. Sustainability 2021, 13, 6556. [Google Scholar] [CrossRef]
- Aziz, A.; Anwar, M.M.; Abdo, H.G.; Almohamad, H.; Al Dughairi, A.A.; Al-Mutiry, M. Proximity to Neighborhood Services and Property Values in Urban Area: An Evaluation through the Hedonic Pricing Model. Land 2023, 12, 859. [Google Scholar] [CrossRef]
- Kalfas, D.; Kalogiannidis, S.; Chatzitheodoridis, F.; Toska, E. Urbanization and Land Use Planning for Achieving the Sustainable Development Goals (SDGs): A Case Study of Greece. Urban Sci. 2023, 7, 43. [Google Scholar] [CrossRef]
Disclaimer/Publisher’s Note: The statements, opinions and data contained in all publications are solely those of the individual author(s) and contributor(s) and not of MDPI and/or the editor(s). MDPI and/or the editor(s) disclaim responsibility for any injury to people or property resulting from any ideas, methods, instructions or products referred to in the content. |
© 2024 by the authors. Licensee MDPI, Basel, Switzerland. This article is an open access article distributed under the terms and conditions of the Creative Commons Attribution (CC BY) license (https://creativecommons.org/licenses/by/4.0/).