Article

Do Innovation and Entrepreneurship Support Policies Promote Urban Green Transformation?—The Mediating Role of Fiscal Technology Expenditure

International Business School, Jinan University, Guangzhou 510632, China
*
Author to whom correspondence should be addressed.
Sustainability 2024, 16(7), 2622; https://doi.org/10.3390/su16072622
Submission received: 30 January 2024 / Revised: 17 March 2024 / Accepted: 19 March 2024 / Published: 22 March 2024
(This article belongs to the Section Economic and Business Aspects of Sustainability)

Abstract

:
This article takes the establishment of two batches of mass entrepreneurship and innovation demonstration bases in 2016 and 2017 as a quasi-natural experiment. It utilizes panel data from 284 cities in China from 2010 to 2021 to construct a multiple time point difference-in-difference (DID) model. This study finds that innovation and entrepreneurship support policies can effectively promote urban green transformation. The robustness of the model is ensured through parallel trend tests, placebo tests, difference-in-difference-in-difference models, PSM-DID, and other methods. A mechanism analysis reveals that fiscal technology expenditure partially mediates the process of innovation and entrepreneurship support policies affecting urban green transformation. A heterogeneity analysis indicates that innovation and entrepreneurship support policies have only a significant positive impact on the green transformation of eastern cities, (sub-)provincial cities, and cities with high green total factor productivity, suggesting that the effectiveness of innovation and entrepreneurship support policies may be influenced by the size of the urban economy. This article provides a theoretical basis and policy recommendations for better leveraging the effects of innovation and entrepreneurship support policies to address the dual challenges of economic and green transformation jointly.

1. Introduction

Since the reform and opening-up policy in China, there has been a remarkable surge in economic development and energy consumption. In 2009, China became the world’s leading energy consumer. As of 2021, China’s primary energy consumption reached 158.53 EJ, representing approximately 26.6% of global consumption [1,2]. Presently, over 40% of China’s territory is occupied by resource-dependent cities, many of which have entered mature or declining periods [3]. Continually exploiting natural resources has even led some cities to the brink of resource depletion and urban decay [4]. The economic growth of China has been significantly reliant on an extensive development model in the past decades [5]. Compared to developed countries, the secondary sector has played a more substantial role than the tertiary sector in economic development [6]. Notably, the manufacturing industry holds a significant share in the industrial structure, characterized by high energy consumption and low efficiency. This poses challenges to achieving sustainable economic development and imposes substantial constraints on existing growth patterns [7], underscoring the urgent need to address the issue of an unbalanced industrial structure.
On the other hand, there is a growing concern about the ecological imbalances and public health hazards stemming from environmental pollution. Research indicates that emissions such as sulfur dioxide, particulate matter, and industrial wastewater have a notable adverse impact on public and infant health [8]. Moreover, air pollution negatively affects the well-being of residents [9] and may even trigger psychological health issues like anxiety and depression [10]. The subsequent decline in subjective well-being further exacerbates the overall health of residents, creating a detrimental cycle [11].
Given the dual challenges of an unbalanced industrial structure and environmental pollution, green transformation has emerged as a crucial path for achieving sustainable development and modernizing the Chinese economy. Green transformation entails a shift from an extensive development model centered around natural resources (characterized by high input, consumption, and pollution) to a technology-centric intensive development model (characterized by low input and consumption and zero pollution) [12]. Traditional economic growth models, such as the Solow and endogenous growth models, assume technological progress as the decisive factor for sustainable economic development. However, these models often overlook energy constraints and environmental performance, resulting in an inadequate and incomplete assessment of economic development quality [13]. In 1992, the Asian Productivity Organization (APO) introduced the concept of green total factor productivity (GTFP), providing a metric that balances economic development and environmental protection.
Existing research indicates that enhancing green total factor productivity and driving urban green transformation involves crucial pathways such as green technological innovation [14], digital economic development [15], and the development of green finance [16]. Some scholars have also demonstrated the positive impact of foreign direct investment (FDI) on a clean production, improving the green total factor productivity [17]. However, the existing literature primarily focuses on the effects of environmental regulations, sustainable development, and green credit policies on urban green transformation, with limited attention paid to innovation and entrepreneurship support policies. This paper aims to fill this gap by focusing on the impact of innovation and entrepreneurship support policies on urban green transformation.
As a vital component of environmental governance, the government’s fiscal expenditures typically range from 20% to 45% of the gross domestic product [18]. Both fiscal expenditures [19] and education expenditures [20] are crucial in influencing urban green transformation. The composition of fiscal expenditures significantly affects both the economy and environmental pollution [18]. Increased funding for research and innovation (i.e., fiscal technology expenditures) can promote the dissemination of clean technologies, enhance resource efficiency, reduce pollution output, and facilitate urban green transformation [21]. This paper introduces fiscal technology expenditures as a variable and examines its potential mediating role.
The potential contributions of this paper include (1) confirming the promoting effect of innovation and entrepreneurship support policies on urban green transformation; (2) in terms of mechanisms, revealing the partial mediating role of fiscal technology expenditures; (3) examining the “spillover effects” of innovation and entrepreneurship support policies in the field of environmental protection, exploring synergistic solutions that consider both economic development and environmental governance; and (4) practically providing a reference for fiscal decision making and policy optimization, helping fiscal authorities invest in urban green development.
The remainder of this paper proceeds as follows. Section 2 provides the policy background, surveys the existing literature, and presents the study’s hypotheses. Section 3 explains the research design, covering the data sources and processing, the variable definition, the descriptive statistics, and the model establishment. Section 4 presents and interprets the empirical results and the robustness checks. Section 5 investigates the heterogeneity effects. Section 6 summarizes the paper’s key findings, including conclusions, a comparative analysis with similar studies, and policy implications. Section 7 discusses the limitations of this study and future research directions.

2. Policy Background, Literature Review, and Hypothesis Proposal

2.1. Policy Background

Innovation and entrepreneurship have emerged as crucial factors for achieving modern economic development [22]. They serve as significant drivers of economic growth [23], promoting the development of new economies and nurturing new dynamics. The State Council, focusing on mass entrepreneurship and innovation, has implemented pilot demonstrations in crucial reform areas to establish replicable and scalable mass entrepreneurship and innovation demonstration models. In 2016, the General Office of the State Council issued the “Implementation Opinions on Building Mass Entrepreneurship and Innovation Demonstration Bases” (hereinafter referred to as “Implementation Opinions”). This document announced the establishment of 28 initial mass entrepreneurship and innovation demonstration bases, including 17 regional bases, 4 universities and research institute bases, and 7 enterprise bases. These bases have implemented various measures, such as reforming approval systems, improving business systems, strengthening intellectual property protection, promoting the flow of innovative and entrepreneurial talents, and increasing financial and tax support. Subsequently, in 2017 and 2020, two additional lists of national mass entrepreneurship and innovation demonstration bases were released, covering 184 locations [24,25,26]. This further strengthened the implementation of the “mass entrepreneurship and innovation” concept at the local level, promoting the characteristic, functional, and professional development of mass entrepreneurship and innovation demonstration bases.

2.2. Innovation and Entrepreneurship Support Policies and Urban Green Transformation

Innovation is crucial in achieving green transformation and improving green technology conversion efficiency [12]. Firstly, the construction of mass entrepreneurship and innovation demonstration bases can promote green technological innovation by alleviating financing constraints [27], implementing intellectual property systems [28], and guiding technology strategies [29]. Green technological innovation, in turn, can reduce chemical energy consumption, improve resource efficiency, and enhance GTFP [14]. Secondly, establishing the bases significantly enhances pilot cities’ green technological innovation capabilities and promotes regional innovation input and output capacities [30], effectively promoting GTFP [31]. Thirdly, enhancing innovation, technology fiscal expenditure growth, and increased innovation intensity in pilot cities can drive industrial transformation and upgrade [32]. In conjunction with the aforementioned green technological innovation, industrial structural upgrading precisely constitutes the two pathways for propelling urban green transformation [33]. Lastly, the rise of factors such as human capital, knowledge stock, and financial development brought about by innovation support policies can positively impact GTFP [34]. Implementing innovation and entrepreneurship support policies significantly improves the inclusive financial level of pilot cities [35], directly raising GTFP and driving urban green transformation [16].
Entrepreneurial activities are a crucial driving force for achieving high-quality economic development. Since implementing the policies, the entrepreneurial activity level in pilot cities has significantly increased. According to data from the National Development and Reform Commission [36], after the pilot demonstration bases were established, the fiscal expenditure, especially the proportion of fiscal technology expenditure, showed an upward trend in multiple cities, surpassing other cities in the country. Increased entrepreneurial activity has various positive impacts on urban green transformation. Firstly, as a representative indicator of urban entrepreneurial activities, the improvement in entrepreneurial activity implies a substantial increase in knowledge spillover intensity between cities [37]. Knowledge and technology exchange between innovation entities, such as enterprises and universities, increases, breaking down barriers to relevant knowledge and enriching knowledge abundance and recombination, which stimulates the R&D capabilities of innovation entities and enhances innovation levels [38], thereby promoting urban green development [39]. Secondly, the increase in small- and medium-sized enterprises intensifies competition among existing enterprises, forcing them to upgrade products, innovate technologies, accelerate product replacement, and commercialize green innovation results [40]. This promotes market competition and resource integration and forms a positive interaction mechanism between entrepreneurial activity and resource allocation efficiency [41], thereby improving local GTFP [42]. Thirdly, enhancing the entrepreneurial ecosystem can drive the transformation and upgrading of traditional industries, and industrial structural progress can improve urban ecological efficiency [43]. Additionally, entrepreneurial capabilities, an essential element in constructing smart cities, play an indispensable role in promoting GTFP in urban green transformation [44].
In summary, this paper proposes the following hypothesis:
H1: 
Innovation and entrepreneurship support policies can promote urban green transformation.

2.3. The Mediating Role of Fiscal Technology Expenditure

2.3.1. Innovation and Entrepreneurship Support Policies and Fiscal Technology Expenditure

Increasing fiscal technology expenditure is a crucial means of achieving the goals of innovation and entrepreneurship support policies. Taking the mass entrepreneurship and innovation demonstration bases as an example, these government-designated areas have been granted numerous fiscal and administrative privileges to support technological enterprises. This includes increased central budget investments, special construction funds, support for establishing and developing government-guided funds, and measures to facilitate entrepreneurial investment and developing innovative small- and medium-sized enterprises. This creates diverse measures to enhance innovation and entrepreneurship support. The pilot bases also explore tax support policies that encourage entrepreneurship and innovation, increasing fiscal technology expenditure [45]. Based on data from the “China Urban Statistical Yearbook”, several cities have shown an increasing trend of fiscal spending after starting the pilot, especially in fiscal technology expenditure, surpassing other cities in the country.

2.3.2. Fiscal Technology Expenditure and Urban Green Transformation

The effectiveness of urban green transformation is closely related to fiscal expenditure efficiency, fiscal expenditure structure, and fiscal expenditure tools [46]. Existing research suggests that fiscal technology expenditure promotes urban green transformation through three main pathways: promoting green technological innovation, enhancing human capital, and improving energy structure and efficiency.
Firstly, the long cycle of green technological innovation requires substantial financial support. Government fiscal technology support is crucial in driving green technological innovation [47], especially given its non-traditional and uncertain characteristics. A lack of government support may discourage enterprises, which tend to avoid risks and increase output, from engaging in voluntary green technological innovation [48,49]. Kemfert and other scholars argue that without technological innovation, a reduction in pollutant emissions would significantly decrease output [50]. However, when technological innovation is present, the magnitude of the output decline is somewhat mitigated [50]. Increased fiscal technology expenditure can promote green technological innovation and indirectly reduce pollution emissions, particularly in the eastern region, where the effects of green innovation are more pronounced [20,51].
Secondly, increased fiscal technology expenditure helps strengthen social security for innovative talents, facilitating the flow of entrepreneurial and innovative talents. Investing in research funds to build overseas talent offshoring bases also contributes to establishing a sound mechanism for the bidirectional flow of research personnel, raising human capital. The enhancement of human capital can stimulate enterprises to contemplate sustainable development, reconsider their energy consumption strategies, diminish non-green energy usage, gravitate toward the adoption of energy-efficient and environmentally friendly technologies, and foster R&D in energy-saving, emission reduction, and green technologies [52,53], which promotes energy conservation, emission reduction, and green technology development [54], leading to sustainable resource utilization and contributing to urban green transformation [55].
Meanwhile, fiscal technology expenditure optimizes energy consumption structure and enhances energy efficiency. In China’s green transformation, increased fiscal technology expenditure is vital in improving the ecological environment. This expenditure significantly improves the ecological environment by promoting the growth of renewable energy [20,56]. The energy structure is predominantly based on traditional fossil fuels, with coal as a representative, and negatively correlates with GTFP [57]. On the other hand, the utilization of renewable energy has a positive impact on GTFP [58]. For industrialized countries and emerging economies, cumulative government technology expenditure promotes the growth of renewable energy [59], directly reducing emissions and promoting labor and technology-driven production activities [60]. This lays a crucial foundation for transitioning to a sustainable green economy [61].
Based on Section 2.3.1 and Section 2.3.2, this paper proposes the following hypothesis:
H2: 
Fiscal technology expenditure mediates between innovation and entrepreneurship support policies and urban green transformation.

3. Research Design

3.1. Sample Selection, Data Preprocessing, and Data Sources

In 2016, the State Council of China established the first batch of 28 mass entrepreneurship and innovation demonstration bases. Subsequently, in 2017 and 2020, two additional batches comprising a total of 184 such bases were announced. The pilot bases include regional demonstration bases, university and research institute demonstration bases, and enterprise demonstration bases. The third batch of pilot cities, introduced in 2020, faced a brief implementation period, compounded by the lingering effects of the COVID-19 pandemic after 2020. Throughout the pandemic, numerous cities experienced prolonged lockdowns, causing disruptions to the vibrancy of urban innovation and entrepreneurship, financial expenditures on technology, and overall macroeconomic development to varying extents. These circumstances created challenges for accurately assessing the effects of policies. Adding to this challenge, the National Bureau of Statistics of China (NBS) has not yet disclosed data for 2022 and 2023, posing difficulties for relevant analyses. Consequently, this study opted for the experimental group to be composed of cities where the first and second batches of announced bases are located. Since the locations of universities, research institutes, and enterprise demonstration bases coincide with those of regional demonstration bases, after screening and deduplication, a total of 51 cities were compiled as the experimental group. The remaining 233 cities served as the control group.
A panel dataset spanning from 2010 to 2021 was compiled, comprising data from 284 cities. Samples with substantial missing values were excluded, and linear interpolation was applied to address minor missing values. A 1% winsorization was performed to trim the extreme values. To mitigate potential heteroscedasticity issues, a logarithmic transformation was applied to all variables in the regression.
The data utilized were sourced from the “China Statistical Yearbook”, “China Urban Statistical Yearbook”, “China Energy Statistical Yearbook”, and “China Environmental Statistical Yearbook”.

3.2. Variable Structure

3.2.1. Dependent Variable: Green Total Factor Productivity (GTFP)

Data envelopment analysis (DEA) is a linear programming method that evaluates the performance of decision-making units (DMUs) by integrating multiple inputs and outputs [62]. DEA is more objective than the stochastic frontier analysis (SFA) model, which requires pre-specifying the production function and the inefficiency term [63]. Traditionally, DEA models do not consider environmental factors when measuring total factor productivity (TFP). Scholars have recently improved this method by incorporating undesirable outputs and calculated indicators such as green efficiency and GTFP, which examine economic efficiency more comprehensively from the perspective of sustainable development [64].
The GML index is the Malmquist index calculated through the global DEA model considering undesirable outputs. The global DEA model is based on the production frontier composed of all the cities’ data in all the years; that is, all the data have only one frontier. The Malmquist index is a productivity index constructed by measuring the changes in efficiency, and it measures the changes in efficiency as ratios.
DEA models usually include the CCR (Charnes–Cooper–Rhodes model) and BBC (Banker–Charnes–Cooper model) with radial measures [65], and the SBM (slacks-based measure) model with non-radial measures [66,67]. However, radial measures are more accurate only when all the inputs or outputs behave similarly. When there is excess input or insufficient output, that is, there is non-zero slack in the input or output, radial DEA will overestimate the efficiency value of the DMUs. At the same time, oriented DEA must ignore the changes in input or output, and the results calculated do not conform to the objective reality (Wang Bing, 2010). In the presence of slack, radial measures tend to overestimate efficiency [68]. Tone (2001) constructed a new DEA model, namely the SBM model, a non-radial and non-oriented DEA model [69]. “Radial” requires that the inputs or outputs change proportionally when evaluating efficiency, while “oriented” requires that the model selection be based on inputs (assuming outputs are constant) or outputs (assuming inputs are constant) when evaluating efficiency. Compared with the CCR and BBC, the slacks-based measure (SBM) has a larger input (output) vector ratio, is more accurate, and considers slack. However, the SBM model proposed by Tone (2001) has a drawback: the efficiency value calculated can be kept only in the interval (0, 1], and an efficient DMU takes the value of 1, while regions less than one are regarded as invalid states. Therefore, we cannot compare the efficient DMUs based on this. To address this limitation, Tone (2002) furtherly constructed a super-efficiency SBM model, which allows efficiency values greater than one and provides a condition for efficient DMU comparisons [70].
The SBM-GML model uses the SBM model to calculate the global Malmquist–Luenberger productivity index (GML), solves the slack variable problem, and overcomes the linear programming measurement time–distance function problem. Following the method of He et al. [71], this study used the super SBM model to estimate the efficiency of DMUs with undesirable outputs and the GML index to measure the changes in the GTFP of each city over time. In referring to [66,72,73], the input indicators of labor and energy factors include the number of employees in the urban area and the city-level energy consumption. In contrast, the input indicators of capital factors include the city’s capital stock and the building area in the urban area. GDP was used as the expected output variable, and industrial sulfur dioxide, industrial wastewater, and industrial dust emissions were used as undesirable output variables. The details are shown in Table 1.
Using each prefecture-level city as a decision-making unit, the super SBM model consists of n DMUs with α input indicators, β1 expected outputs, and β2 unexpected outputs. Therefore, the SBM is formulated as follows:
m i n ρ = 1 m i = 1 α     x i ¯ x i k 1 β 1 + β 2 ω = 1 β 1     y w ¯ y ω k + μ = 1 β 2     p u ¯ p u k
subject to
x i ¯ j = 1 , k n     x i j λ j , i = 1,2 , , α
y ω ¯ j = 1 , k n     y ω j λ j , ω = 1,2 , , β 1
p u ¯ j = 1 , k n     p u j λ j , u = 1,2 , , β 2
λ j 0 , x i ¯ x i k , y ω ¯ y ω k , p u ¯ p u k ; j = 1,2 , , n j k
where x i k , y ω k , and p u k are the input, expected output, and unexpected output, respectively; λ is the weight of the indicators; ρ is the GTFP value of the DMUs; and when 0 ≤ ρ < 1, the DMU is considered inefficient, while ρ ≥ 1 indicates efficiency.
The GML index is the rate of change in GTFP from periods t to t + 1 and requires further processing. Following the approach of Lyu et al. [15], we set the GTFP of each city in 2010 to 1 and subsequently multiplied the GML of each year to obtain the GTFP for all cities from 2010 to 2021.

3.2.2. Core Explanatory Variable: DID

The core explanatory variable in this study is the interaction term DID:
D I D = t r e a t e d × p o s t
where treated is a dummy variable representing the implementation of the national mass entrepreneurship and innovation demonstration base policy. If a city implemented the base pilot in 2016 or 2017, treated is set to 1; otherwise, it is set to 0. post is a dummy variable representing pre- and post-policy implementation, with 0 indicating pre-implementation and 1 indicating post-implementation.

3.2.3. Mediating Variable: Fiscal Technology Expenditure

This study selected fiscal technology expenditure as a mediating variable to further explore its role in the impact of entrepreneurship and innovation support policies on urban green transformation.

3.2.4. Control Variables

Drawing on the work of Chai et al. and Xie et al. [74,75], we selected GDP per capita, average wages of employed staff, public budget expenditure, degree of marketization, and population density as control variables. The degree of marketization, following the practices of Fan Gang and others [76,77,78], evaluates the relative degree of the marketization of each prefecture-level city from five aspects: government-market relationship, development of non-state-owned economy, development of product market, development of factor market, and development of market intermediary organizations and legal system environment. Each aspect comprises 19 indicators or sub-indicators, which are synthesized into five “aspect indices” for marketization progress. These five aspect indices are then combined into a relative index of marketization progress.

3.3. Descriptive Statistics

Table 2 reports the sample’s descriptive statistics results, indicating reasonable variable metrics with no extreme outliers.

3.4. Model Establishment

To explore the impact of implementing innovation and entrepreneurship support policies on urban green transformation, this study, referencing Tian et al. [79], employed a comprehensive model for investigation. The specific steps are outlined as follows.
  • Model Construction
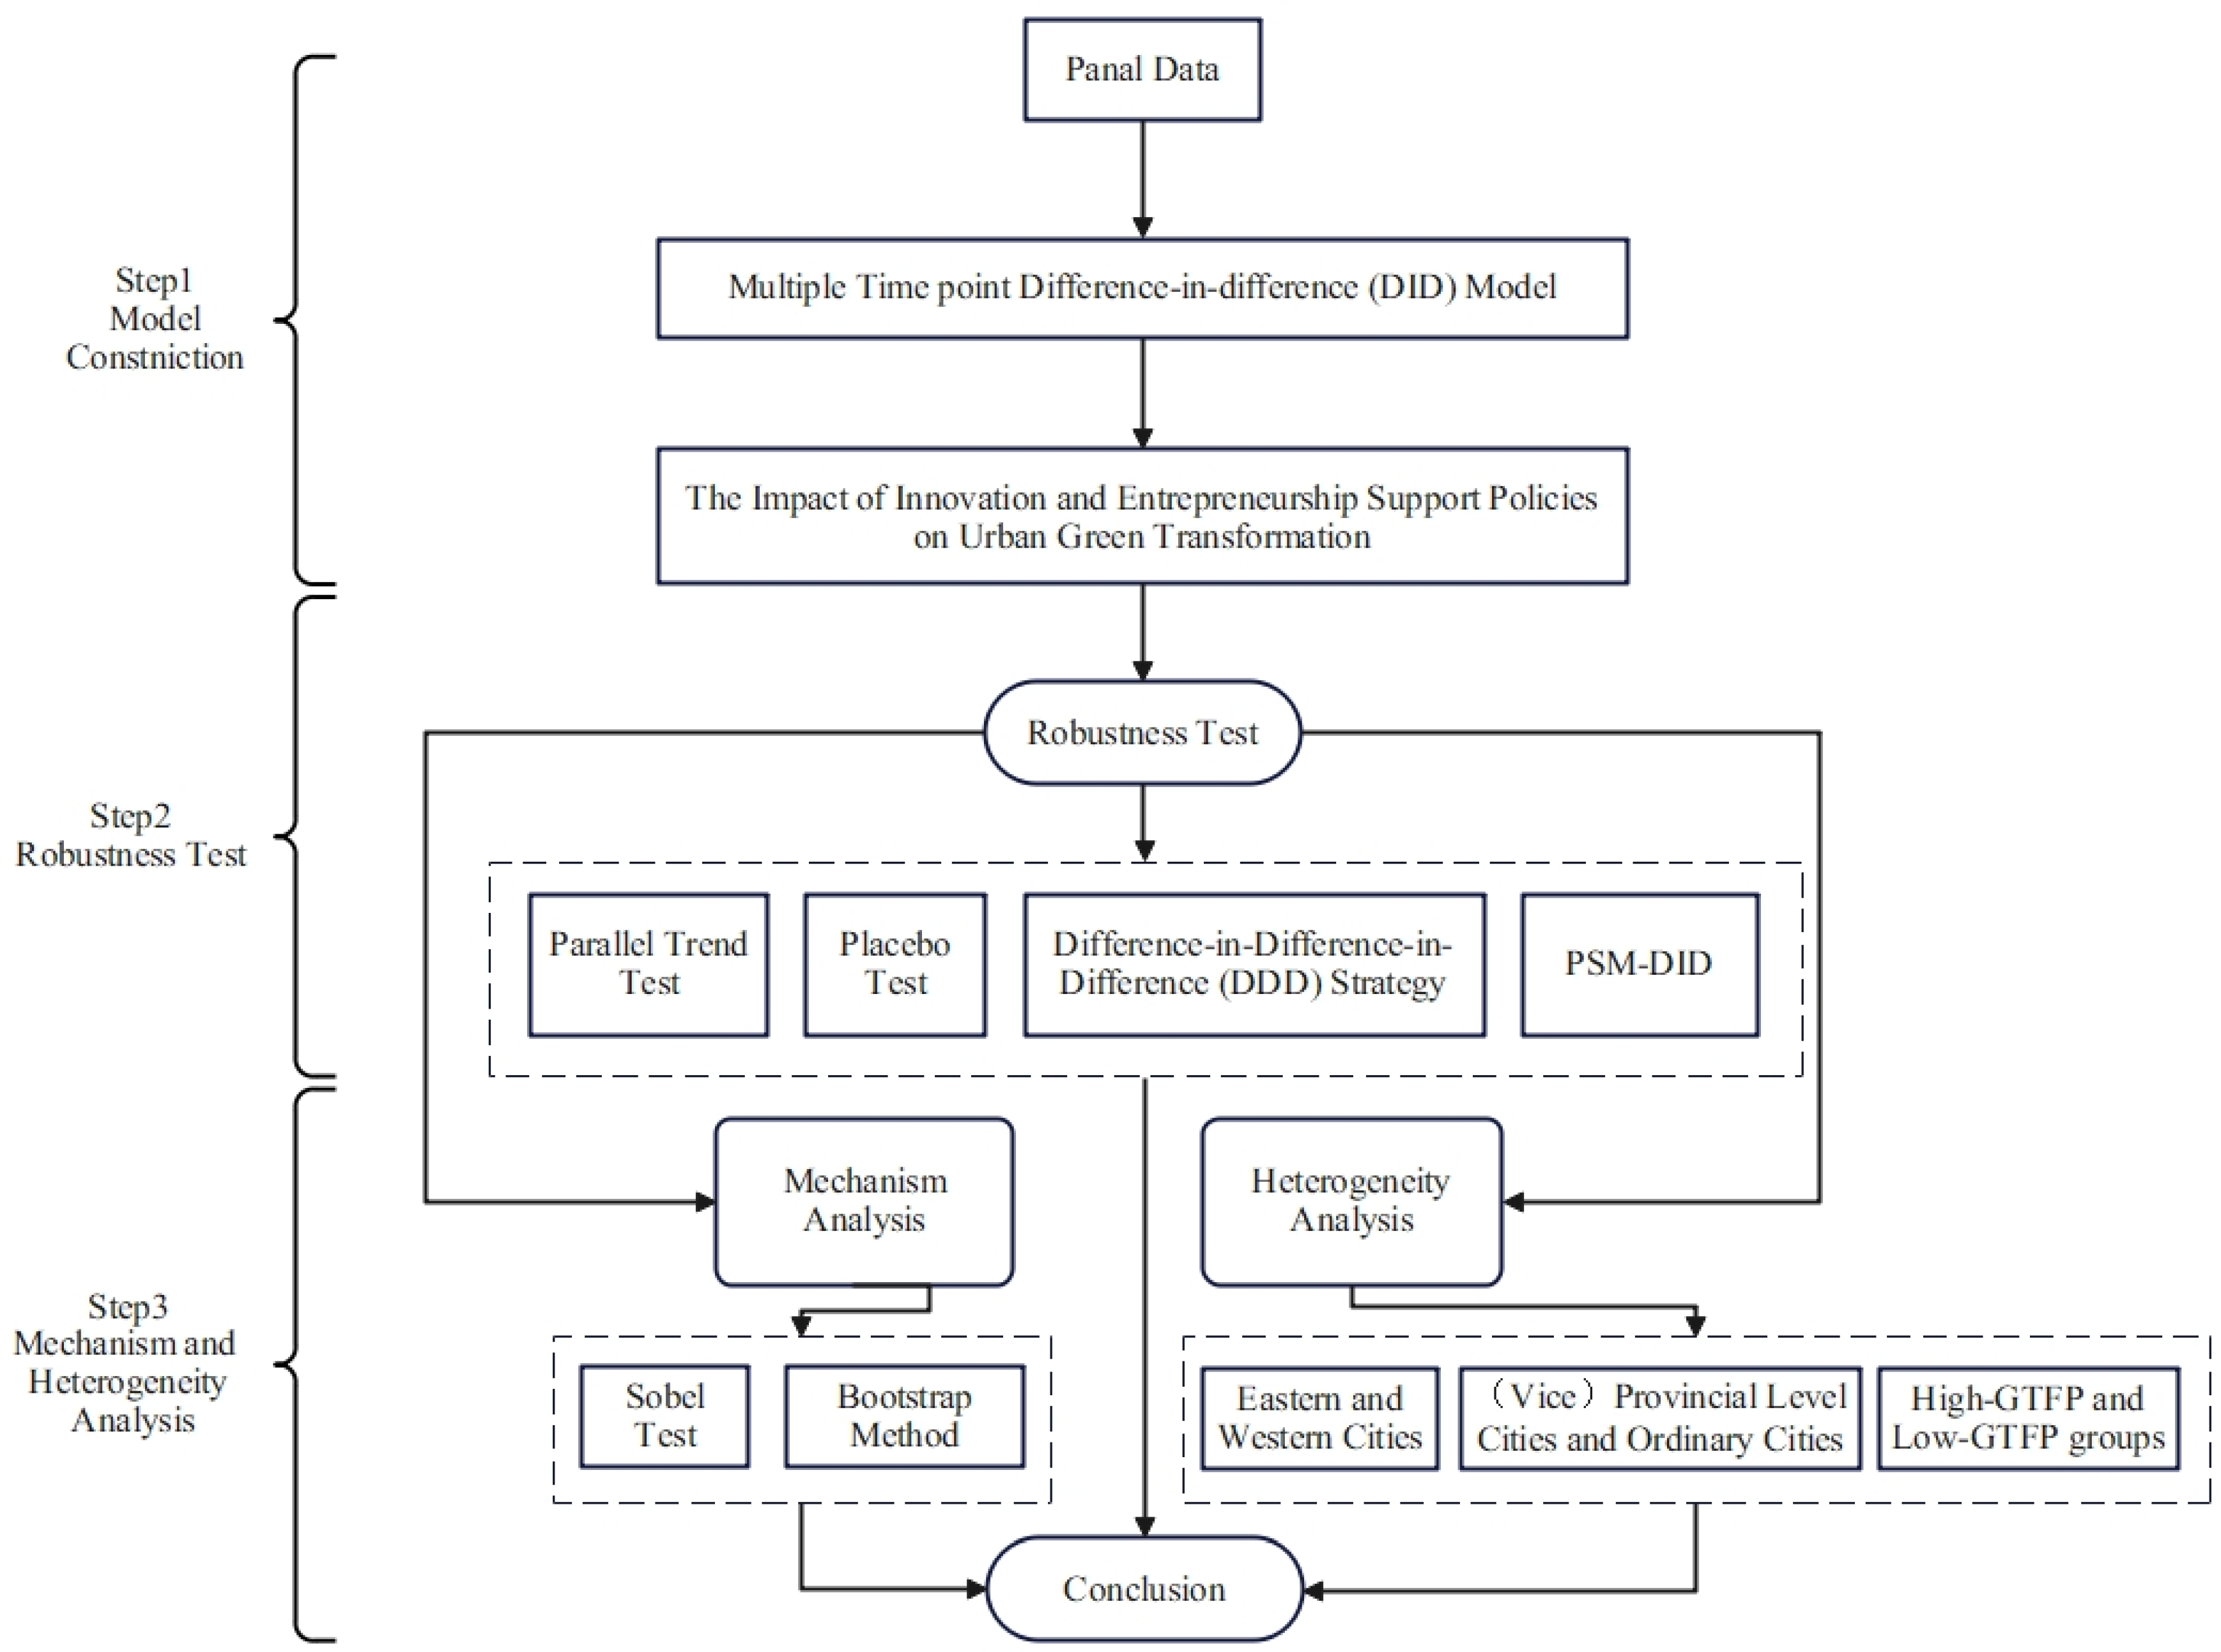
This research regards the establishment of mass entrepreneurship and innovation demonstration bases as a quasi-natural experiment. The pilot cities receive various policy preferences. Therefore, the establishment of mass entrepreneurship and innovation demonstration bases may impact urban green transformation, while non-pilot cities are unaffected. Since the demonstration bases were established in several phases, this study adopted a multi-time point difference-in-difference (DID) approach to examine the policy effects. Finally, to mitigate the influence of inherent differences between cities on the results, a combination of propensity score matching and the difference-in-difference strategy (PSM-DID) was employed for further verification.
2.
Robustness Testing
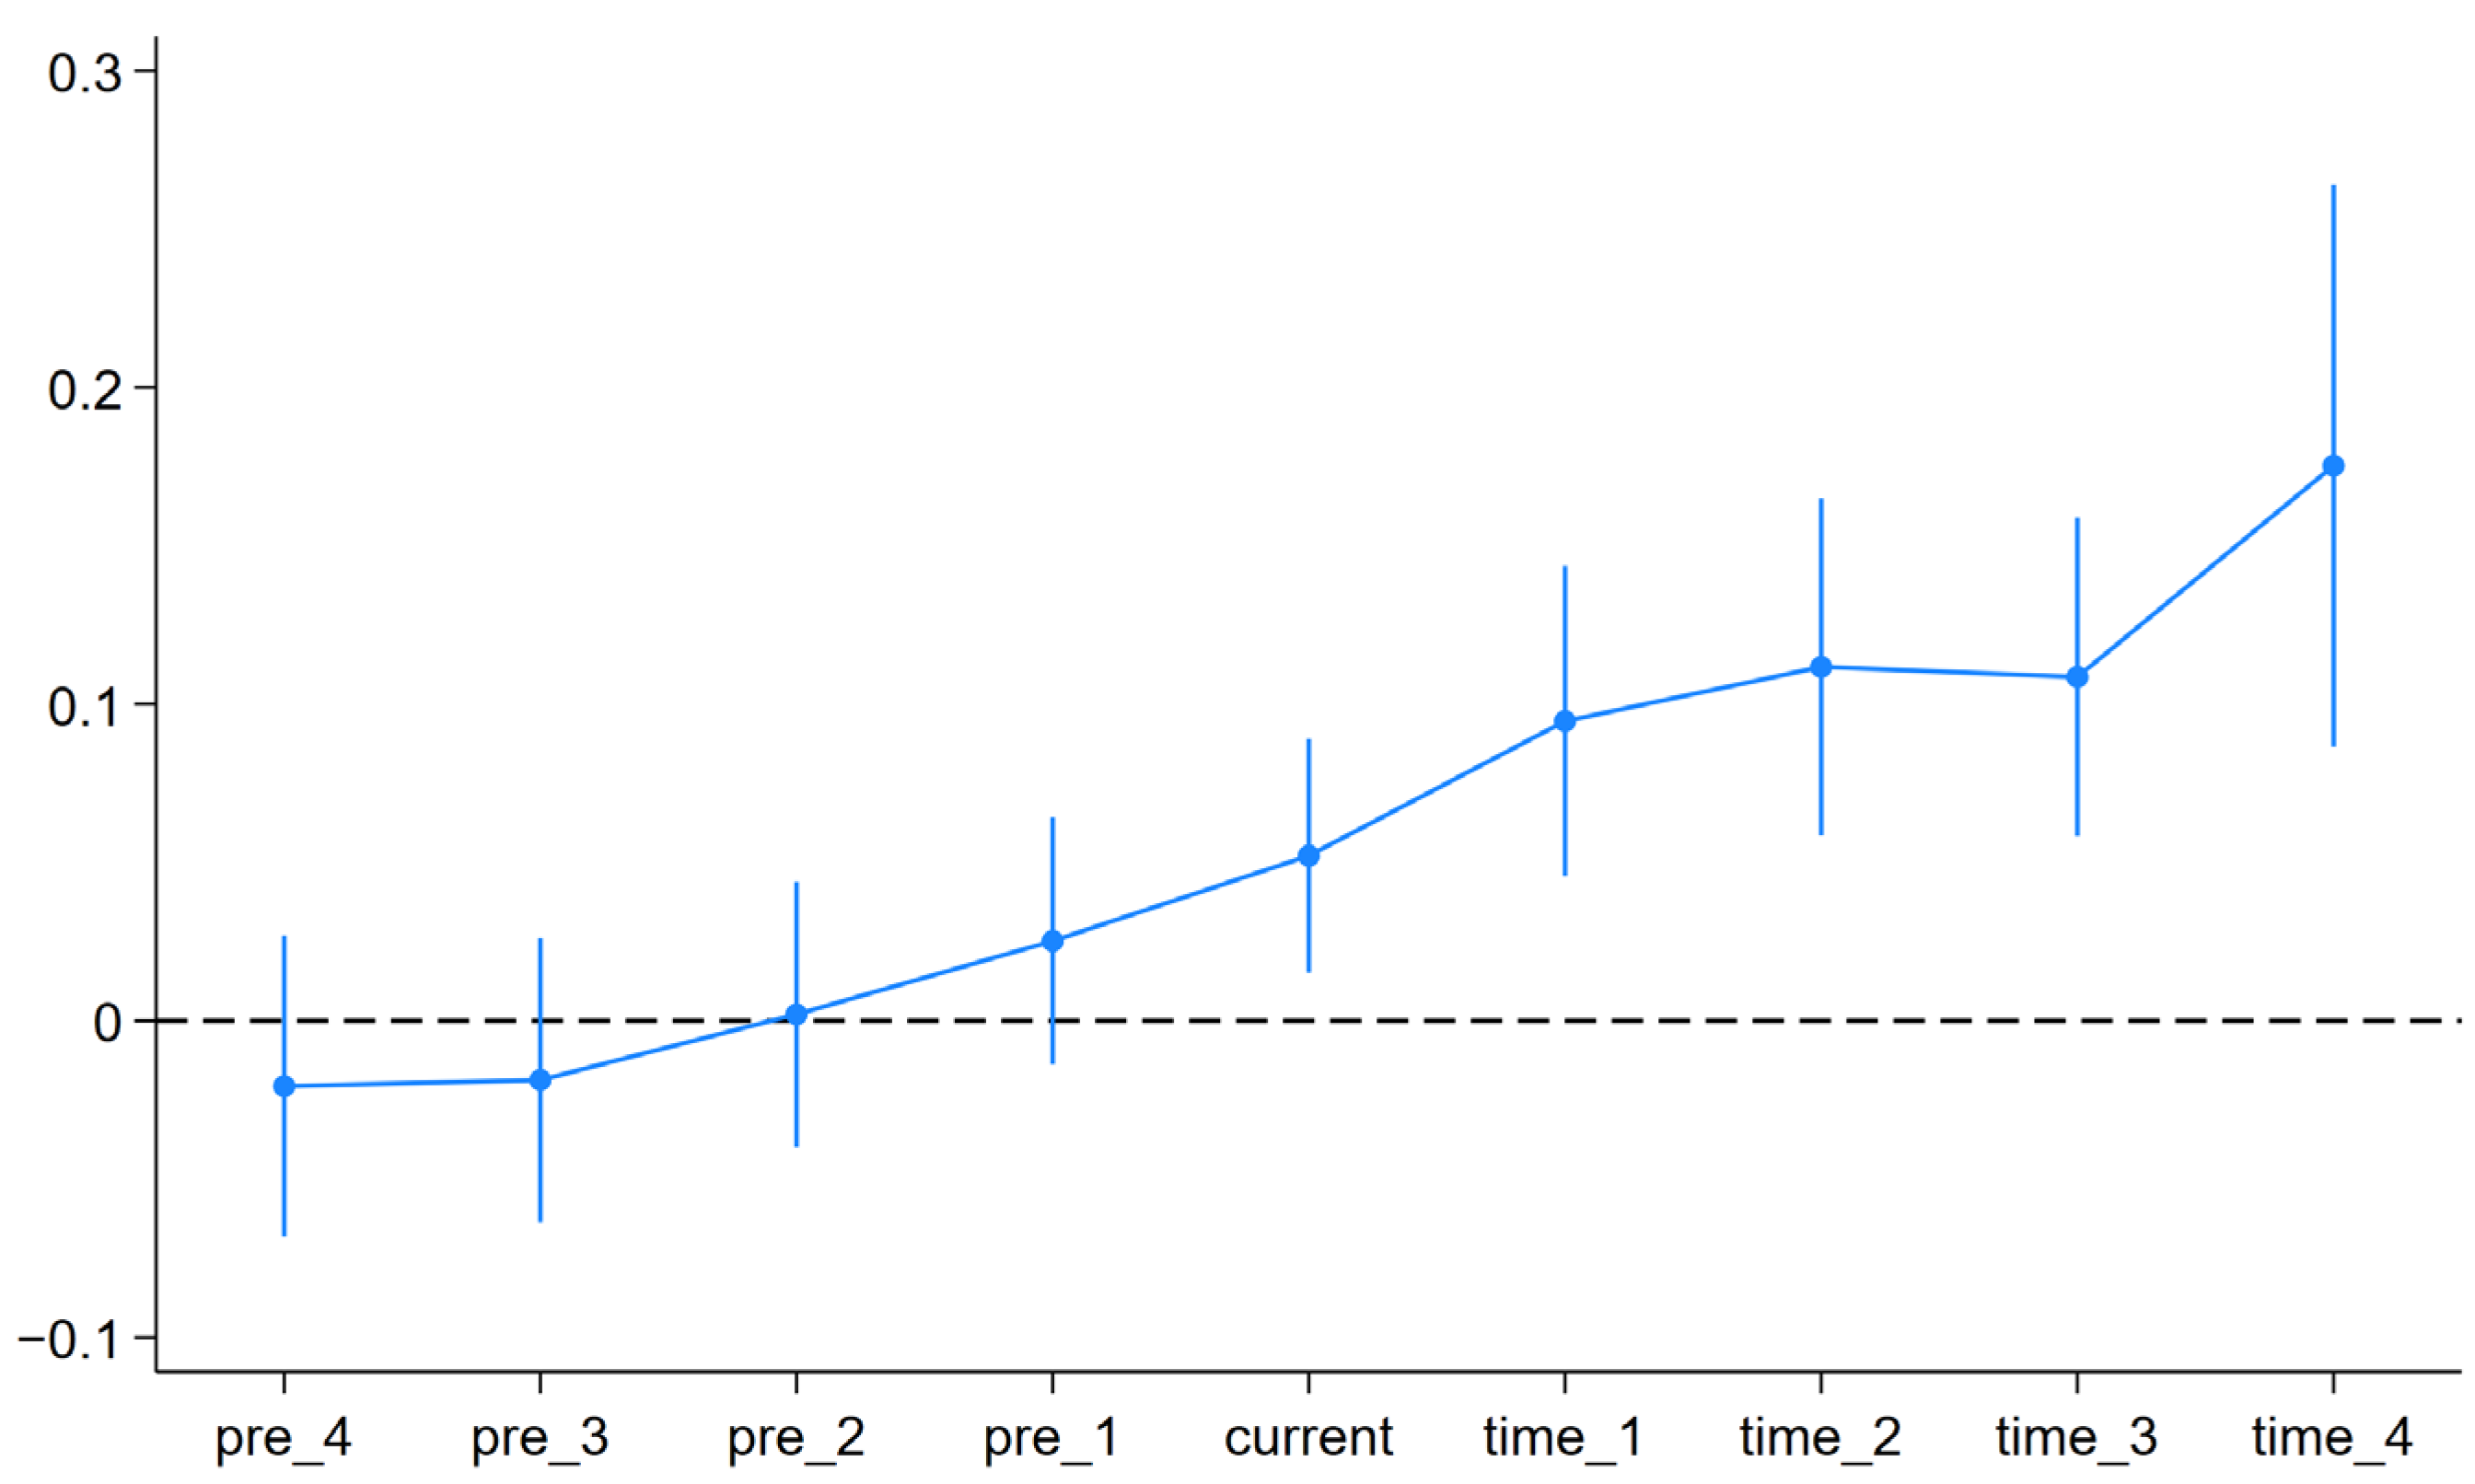
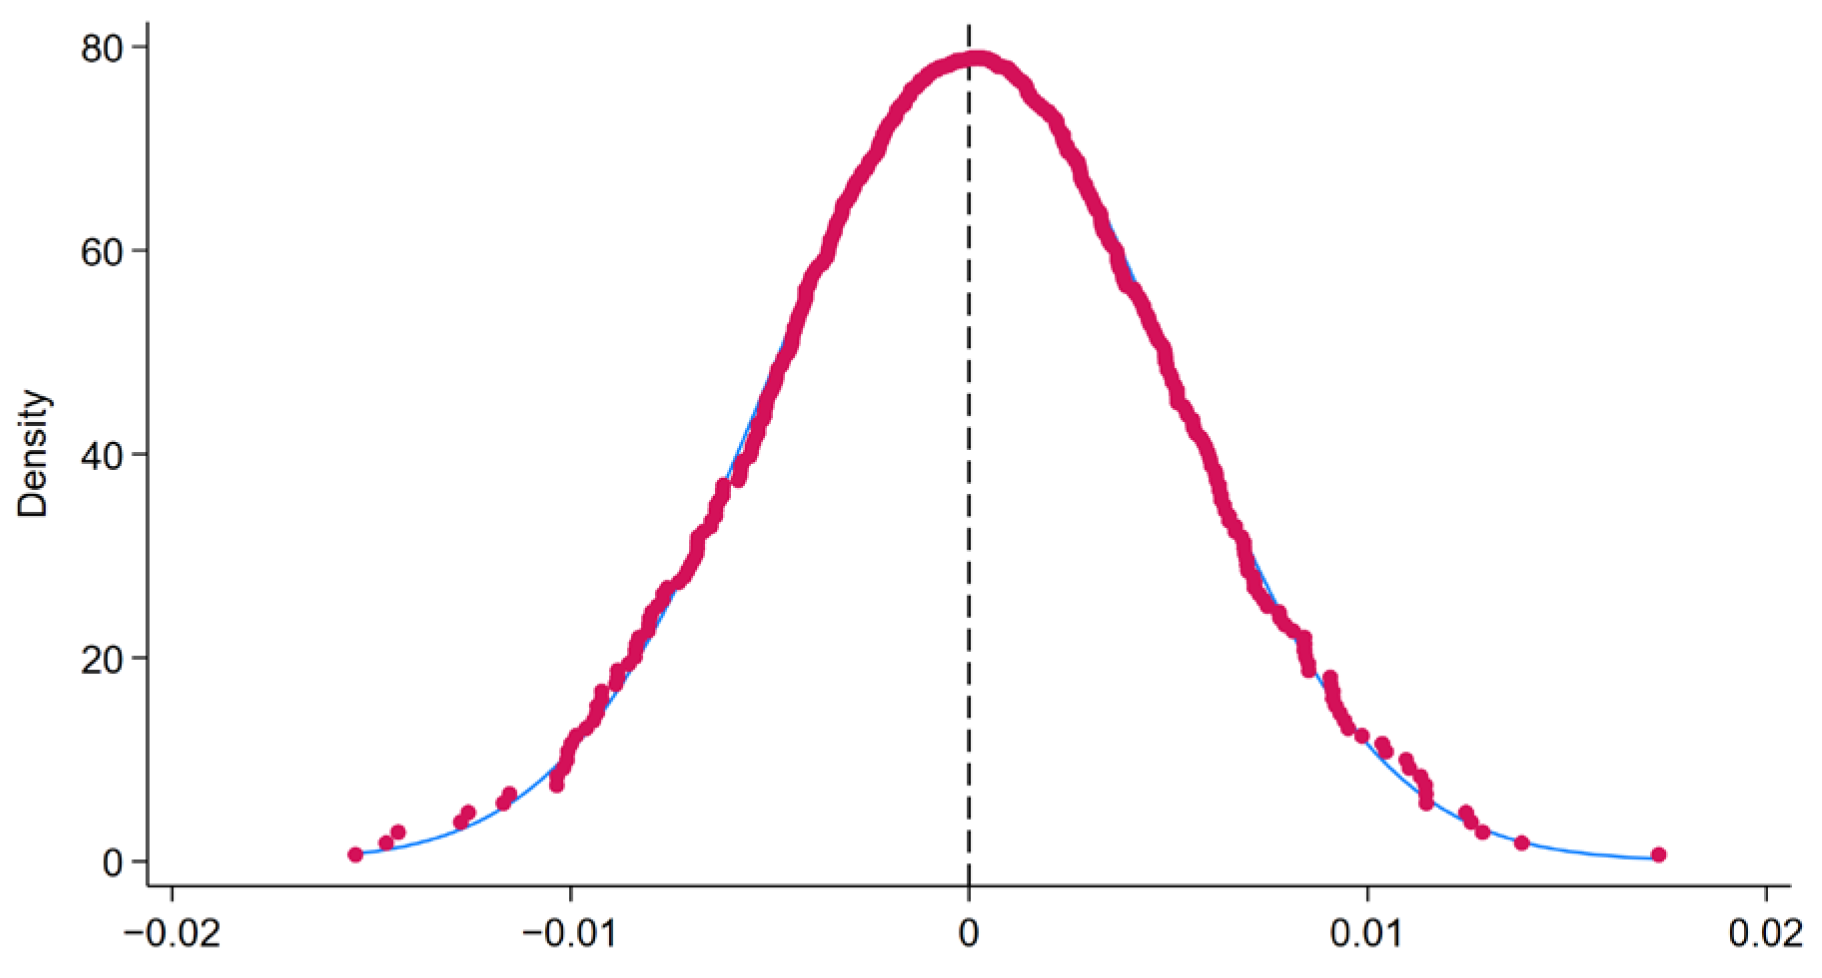
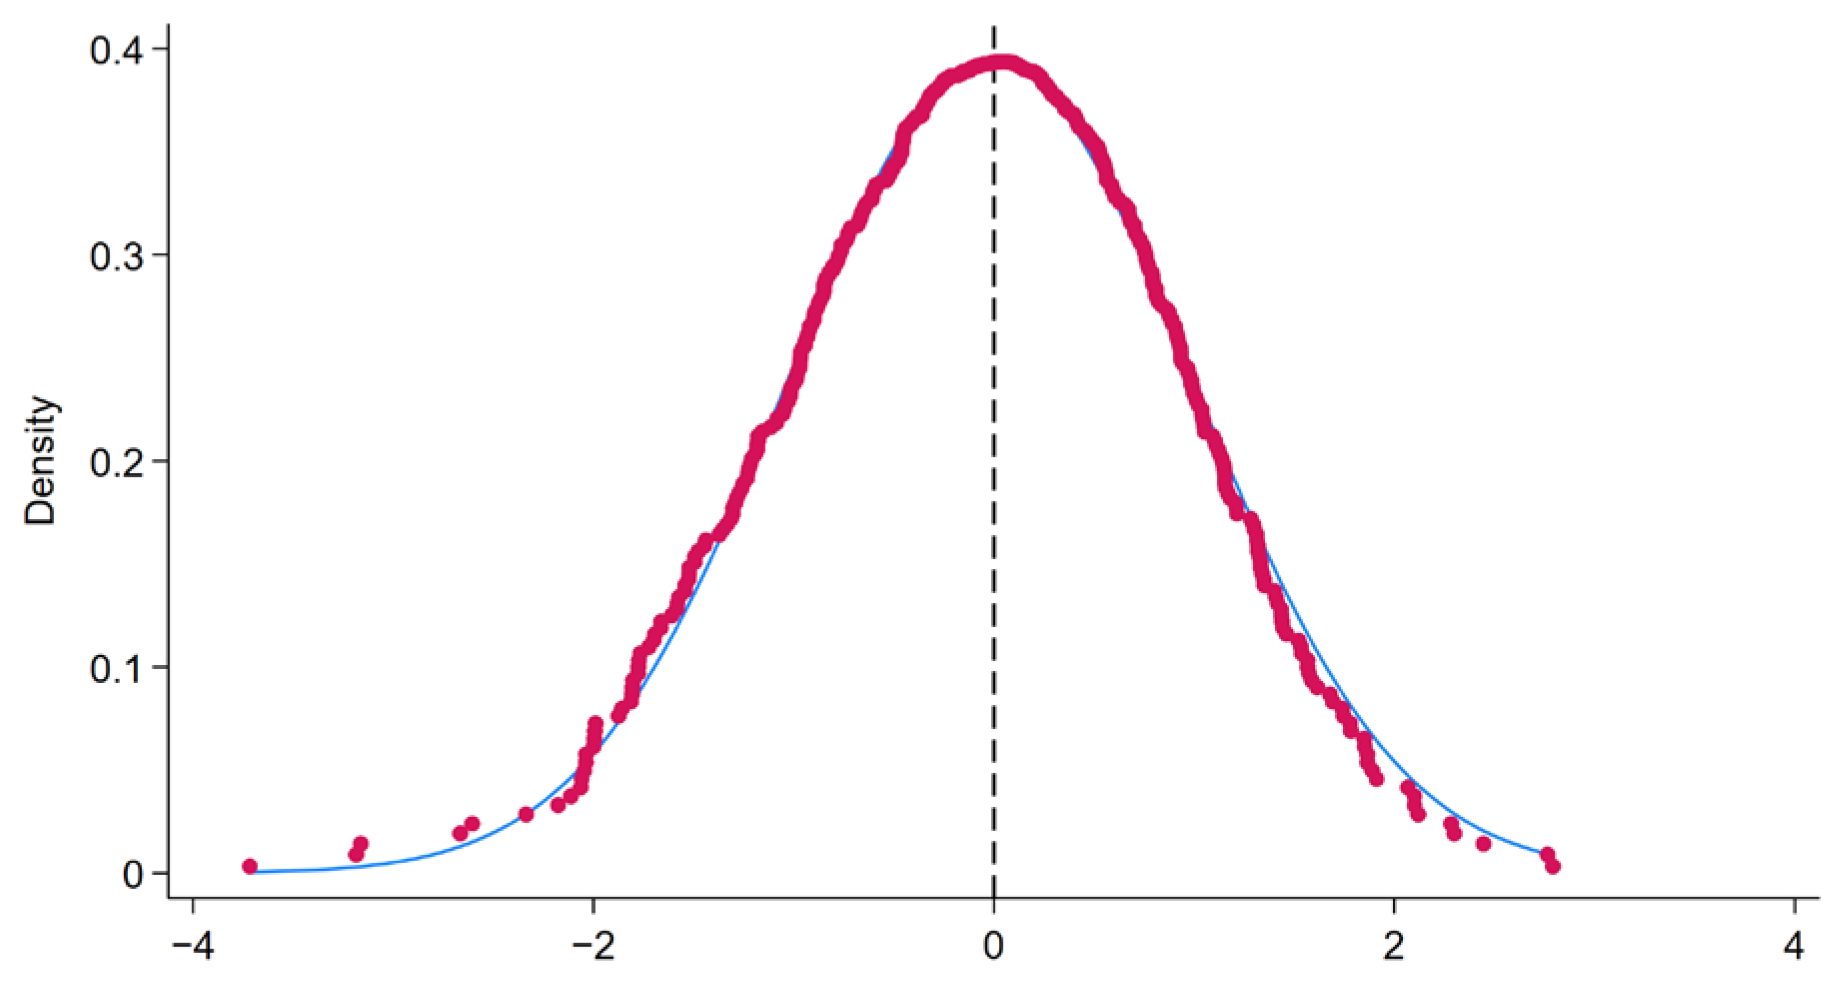
Initially, the effectiveness of the multi-time point DID was examined through parallel trend testing. Subsequently, robustness tests were conducted using placebo tests, the difference-in-difference-in-difference strategy (DDD), and the PSM-DID, among other methods. Additional robustness tests, including lagged regressions, winsorization, and replacing dependent variables, were performed to examine the regression results’ robustness further.
3.
Mechanism and Heterogeneity Analyses
As the “Implementation Opinions” call for policies to be implemented through fiscal expenditure on science and technology, this study investigated the mediating role of fiscal technology expenditure to explore further the mechanism by which the establishment of innovation and entrepreneurship support policies affects urban green transformation. Additionally, to analyze the differences in policy implementation effects, three groups were established based on geographical location (eastern and western cities), administrative level ((vice) provincial-level and ordinary cities), and GTFP levels (high and low). This aimed to analyze the variations in green transformation under the policy across different regions, administrative levels, and GTFP groups.
The specific steps are illustrated in Figure 1.

3.4.1. Direct Effects of Innovation and Entrepreneurship Support Policies on Urban Green Transformation

This study employed a multi-time point DID model to investigate the impact of the national mass entrepreneurship and innovation demonstration base policy on urban GTFP. The estimated model is as follows:
G T F P i t = α + β 1 × D I D i t + C n × C o n t r o l s + u i + Y t + ε
where GTFPit represents the green total factor productivity of city i in year t. The term α denotes the intercept, while DIDit is a dummy variable that signifies whether city i has implemented the mass entrepreneurship and innovation demonstration base pilot in year t. The row vector C n represents the coefficients for control variables, and C o n t r o l s is a column vector representing six control variables. The terms ui and Yt capture the individual and time effects, respectively, and ε represents the random disturbance term. The estimated coefficient β 1 reflects the relative impact of supportive policies for innovation and entrepreneurship on GTFP.

3.4.2. Mediating Effect of Fiscal Technology Expenditure

Building on Equation (7), the following model was established to test the mediating effect of fiscal technology expenditure:
t g o v i t = α + β 2 × D I D i t + C n × C o n t r o l s + u i + Y t + ε
G T F P i t = α + β 3 × D I D i t + β 4 × t g o v i t + C n × C o n t r o l s + u i + Y t + ε
where tgovit represents fiscal technology expenditure for city i in year t; if β2, β3, and β4 are all significantly positive, the partial mediating role of fiscal technology expenditure can be confirmed. Other variables are the same as specified in Equation (7) and are not reiterated here.

4. Empirical Result Analysis

4.1. Benchmark Regression

The initial step involves conducting the Houseman test, with results rejecting the null hypothesis at a 1% significance level (χ2(8) = 157.82; Prob > χ2 = 0.0000), indicating the selection of a fixed effects model. Simultaneously, all variables exhibited variance inflation factor (VIF) values below 5 in the multicollinearity test, indicating the absence of multicollinearity issues. Regression results are presented in Table 3, where columns (1) and (2) report the outcomes of random effects and fixed effects models. Columns (3), (4), and (5) present models controlling for time-individual bidirectional fixed effects. To address heteroscedasticity and autocorrelation concerns, standard errors in columns (3), (4), and (5) employ heteroscedastic robust, time-clustered robust, and province-clustered robust standard errors, respectively. All regression outcomes support Hypothesis H1.
Given regional disparities in geographical and economic development among provinces, local governments formulate tailored policies to promote local innovation and entrepreneurship at different stages of urban development. These policies encompass regional university talent cultivation programs, support policies for high-tech small and micro enterprises, and more. To control for temporal trends in each province, a province–time interaction fixed effects regression was conducted on columns (3), (4), and (5), with standard errors remaining heteroscedastic robust, time-clustered robust, and province-clustered robust, respectively. As indicated in columns (6), (7), and (8), the results remain significant.

4.2. Mechanism Analysis

If innovation and entrepreneurship policies can promote urban green transformation, what is the pathway through which the policies impact urban GTFP? Based on previous theoretical analysis, fiscal technology spending may act as an intermediary. In other words, innovation and entrepreneurship policies intensify fiscal technology spending, thereby propelling urban green transformation. Following the method of sequentially testing regression coefficients, as outlined by Wen et al. [80], we confirmed the main effect β1 of innovation and entrepreneurship support policies on urban green transformation using regression (7) in Table 3, and Table 4 reports the regression results for Equations (8) and (9), revealing significant positive coefficients for both β2 and β4, thus confirming Hypothesis H2.

4.3. Robustness Checks

4.3.1. Parallel Trend Test

The DID model necessitates that the experimental and control groups exhibit similar trends in GTFP changes to satisfy the parallel trend assumption, avoiding the influence of other factors on policy effect identification. This study introduced dummy variables representing the pre- and post-implementation policy years in pilot areas for parallel trend testing. As illustrated in Figure 2, during the initial four years of the mass entrepreneurship and innovation demonstration bases pilot, the 95% confidence intervals of dummy variable estimate coefficients all encompass zero, indicating no significant differences in green total factor productivity between the control and experimental group cities. In the year of the mass entrepreneurship and innovation demonstration bases pilot, policy effects gradually become evident, with the estimate coefficients of policy dummy variables deviating from zero and exhibiting an increasing trend, suggesting that the implementation of innovation and entrepreneurship support policies enhances GTFP in pilot cities, and policy effects expand year by year.

4.3.2. Placebo Test

This study employed a placebo test by constructing a virtual placebo treatment group to eliminate the impact of other random factors. Initially, all 284 cities in the sample were randomly assigned as experimental and control groups. Regression coefficients and t-statistics were computed based on randomly generated experimental or control groups using Equation (7), and the process was repeated through 500 iterations. As depicted in Figure 3 and Figure 4, both the distribution of the regression coefficients and t-value estimates converge around zero and approximate a normal distribution. This observation indicates that the policy effects of the pilot demonstration bases for mass entrepreneurship and innovation are not incidental.

4.3.3. Difference-in-Difference-in-Difference (DDD) Strategy

Although the difference-in-difference model satisfies the assumption of parallel trend and passes the placebo test, other policies might still influence the GTFP in pilot and non-pilot cities between 2010 and 2021. For instance, since 2016, 25 cities, including Baoding in Hebei, Nanchang in Jiangxi, and Haidian in Beijing, have received support from the Ministry of Science and Technology to implement innovative city pilot policies. These policies share similarities with the mass entrepreneurship and innovation base policies, promoting innovation in pilot cities and potentially causing bias in policy identification. Therefore, this study introduced a dummy variable indicating whether the city implemented an innovative city pilot in the same year and conducted robustness testing using the difference-in-difference-in-difference method. As shown by the regression results in Table 5, the difference-in-difference-in-difference cross-term remains significant, indicating a positive impact of the mass entrepreneurship and innovation base policy on GTFP in pilot cities after excluding the influences of other policies.

4.3.4. PSM-DID

Given the variations among cities in economic development, local environmental protection policies, and financial support levels, the selection of mass entrepreneurship and innovation pilot cities may be influenced by certain factors. The national inclination may prioritize cities with higher economic development levels and favorable scientific and technological innovation conditions as mass entrepreneurship and innovation bases. This violates the ideal assumption of random sample allocation, leading to endogeneity issues and selection bias. This study employed the propensity score matching and PSM-DID methods to address these concerns, selecting control cities with similar characteristics for robust testing. GDP per capita, the average wages of on-duty workers, public budget expenditures, marketization degree, fixed-asset capital stock, and population density were covariates. The study utilized nearest neighbor matching with 1:1, 1:2, and 1:4 ratios, caliper matching, and kernel matching methods. Table 6 reports the PSM-DID regression results, with all DID coefficients being significantly positive, further confirming the robustness of the model.

4.3.5. Sobel Test and Bootstrap Method

Drawing on references such as Wen et al. [80,81], the robustness of the mediating model was examined using the Sobel test and Bootstrap method.
In the Sobel test, Z = 2.274 with P > |z| = 0.023, indicating that the mediating effect is significant statistically.
In the Bootstrap test with 1000 samples, the 95% confidence interval for the indirect effect was (0.0017228, 0.0007862), and for the direct effect, it is (0.0699187, 0.0072754). Both intervals did not contain zero, indicating a significant partial positive mediation effect of fiscal technology expenditure in the context of innovation and entrepreneurship support policies and green urban transformation.

4.4. Other Robustness Tests

4.4.1. Controlling Province–Time Interaction Fixed Effects

To account for the different natural, social, and economic conditions of each province in different years and the impact of provincial political turnover on accounting conservatism [82] and corporate decision making such as corporate investment [83], we introduced province–time interaction fixed effects to enhance the robustness of our results [84]. Since the province–time interaction fixed effects already capture the time variation, we did not need to include time fixed effects separately. The regression results are presented in Table 7. To further ensure that our model reflects reality and maintains its robustness, the other methods discussed in Section 4.4 were also conducted based on the province–time interaction fixed effects.

4.4.2. Lag Regression

Due to the time lag in the path of “mass entrepreneurship and innovation demonstration bases—fiscal technology spending—urban green transformation”, implementing innovation and entrepreneurship policies in the previous period can affect fiscal technology spending and urban green transformation only in the next period. This provides a basis for addressing potential bidirectional causality issues. The interaction term representing policy implementation was lagged by two periods, and the mediating variable fiscal technology spending lagged by one period. Regression was then conducted on Equations (7)–(9), with results reported in Table 8, columns (1), (2), and (3). The regression results are consistent with those presented earlier, robustly supporting the research hypotheses.

4.4.3. Changing in Dependent Variable

In selecting the industrial representative pollutant, sulfur dioxide emission intensity, as the dependent variable, measured as the ratio of GDP (in thousand yuan) to SO2 (in tons) to represent the urban green transformation, regression was performed again on Equations (7)–(9). The results are also significant, as shown in Table 9.

4.4.4. Using Subsamples

We used the cities that participated in the pilot program of Mass Entrepreneurship and Innovation Demonstration Bases in 2017 as the treatment group. For the control group, we selected cities that did not join the program. Then, we reran the regression using these sample. The results are still significant, and the specific results are shown in Table 10.

5. Heterogeneity Analysis

Heterogeneity in the innovation effect is observed across different regions in the country. In non-resource-based eastern cities characterized by higher economic development, abundant science and technology enterprises, and ample green innovation resources, the promotional impact of green innovation on GTFP is more pronounced [85]. Given that green innovation is a crucial pathway through which fiscal technology expenditures influence urban green transformation, is there also heterogeneity in the promoting effects of fiscal technology expenditures and innovation and entrepreneurship support policies on urban green transformation?
In following the work of Chai et al. [29,86], the sample was divided based on the following criteria: (a) in using the Hu Huanyong Line (also known as the Aihui–Tengchong Line or the Heihe–Tengchong Line, the Hu Huanyong Line is an imaginary line that divides China into two parts with contrasting population densities that stretches from the city of Heihe in the northeast to Tengchong in the south, diagonally across China; the eastern portion, which is further subdivided into north and south halves, is home to 94% of China’s population and covers 43% of its total area, whereas the western portion, which constitutes 57% of China’s territory, is home to only 6% of the country’s population 1; the line was proposed by Chinese population geographer Hu Huanyong in 1935 and called a “geo-demographic demarcation line”) as a basis, the sample was divided into eastern and western cities; (b) based on administrative levels, the sample was divided into (vice) provincial-level cities and ordinary cities; and (c) based on whether the GTFP of the city is greater than the median, the cities were divided into high-GTFP and low-GTFP groups. Subsequently, grouping regression was performed for these three criteria to study the heterogeneous impact of innovation and entrepreneurship support policies on fiscal technology spending and GTFP.
The regression results indicate that regardless of whether the sample belongs to eastern or western cities, (vice) provincial-level cities, or ordinary cities, and whether GTFP is higher than the median, implementing the demonstration base policy significantly increases fiscal technology spending at the prefecture-level city. However, only in eastern cities, (vice) provincial-level cities, and cities with high GTFP do innovation and entrepreneurship support policies significantly impact urban green transformation.
In observing the regression coefficients, it was found that in eastern cities, (vice) provincial-level cities, and cities with high GTFP, the coefficient of the demonstration base policy on fiscal technology spending is higher than in western cities, ordinary cities, and cities with low GTFP. This is consistent with the empirical conclusions of previous scholars [29,87]. One possible explanation is that eastern cities, (vice) provincial-level cities, and cities with high GTFP have stronger fiscal capacities to support innovation and entrepreneurship, enabling a better expansion of fiscal technology spending and effectively promoting urban green transformation. This further confirms the mediating role of fiscal technology spending in innovation, entrepreneurship, and urban green transformation. Specific regression results are presented in Table 11.

6. Research Conclusions, Discussion, and Policy Recommendations

6.1. Conclusions and Discussion

Innovation and entrepreneurship have always been hot topics for local economic development [88]. As the main body of the market economy, enterprises are the key engines for urban green transformation, which is the only way to achieve high-quality and sustainable development [89]. Previous studies on urban green sustainable development primarily focused on the effects of environmental policies, while the research on innovation and entrepreneurship support policies have also stayed at the economic level. This paper breaks out of the mindset that environmental and economic development are mutually opposed by innovatively studying the policy spillover effects of innovation and entrepreneurship policies at the environmental level and obtaining rich conclusions.
This study focused on the pilot projects of two batches of innovation and entrepreneurship demonstration bases in 2016 and 2017. In utilizing panel data from 284 prefecture-level cities in China spanning from 2010 to 2020, a multi-time point difference-in-difference (DID) model was employed to investigate the impact of innovation and entrepreneurship policies on urban green transformation. The empirical results indicate the following key findings: (1) generally speaking, supportive policies for innovation and entrepreneurship enhance urban green total factor productivity, suggesting a positive effect on urban green transformation; (2) fiscal and technological expenditures play partial mediating roles in the mechanism, fostering green technological innovation, improving human capital, and enhancing energy structure, thereby driving urban green transformation; and (3) the impact of innovation and entrepreneurship supportive policies on green transformation varies across cities, with a significant positive effect observed in eastern, (vice) provincial-level cities, and cities with high GTFP.
The research conclusions of this paper also have extensive connections with previous studies from different countries. Firstly, from the perspective of the policy’s main effect, there is prior evidence to imply that innovation and entrepreneurship have potential environmental effects. Our research results are consistent with those of studies such as those by Gu et al., who used a double-threshold regression model to verify that regional innovation can expand the effect of industrial digitalization on the efficiency of urban green development [90]. Burch et al. pointed out that small- and medium-sized enterprises can flexibly fill the local gaps and have great potential in urban sustainable transformation [91]. Secondly, from the perspective of the mediation path, in past studies, the sustainable policies implemented by the urban government mainly relied on non-governmental organizations to provide advice and assistance to enterprises [92], lacking a direct driving force from the government; different from the Western-style small government, this study focused on the Chinese-style big government scenario, and the role of government action in promoting the coordinated development of economy and environment. Thirdly, from the perspective of urban heterogeneity, this paper found that for the western, non-provincial cities and low-GTFP cities in China, the innovation and entrepreneurship policies have no noticeable effect on urban green transformation, because, on the one hand, there is a lot of overlap between the three categories of western, non-provincial cities and low-GTFP cities, and these economically underdeveloped cities have limited government fiscal capacities and low fiscal science and technology expenditures; on the other hand, the gradual decline of urban green innovation efficiency from eastern to western cities pointed out by Wang et al. may be another reason [93], and a low green innovation efficiency may hinder the transmission of fiscal science and technology expenditure to promote urban green transformation.

6.2. Policy Recommendations

This study provides theoretical support for better government involvement in urban green transformation. Based on the research findings, the following policy recommendations are proposed.
  • Strengthening Implementation of Supportive Innovation and Entrepreneurship Policies.
To promote urban green transformation, intensifying the implementation of supportive innovation and entrepreneurship policies is recommended. Specifically, the government may consider establishing dedicated funds to support green technological innovation and sustainable development projects. By providing fiscal support and tax incentives and encouraging and attracting more innovative enterprises to engage in R&D and practices in the green sector, cities can achieve green transformation more rapidly and effectively. Additionally, it is suggested that the government establish a more flexible policy framework to adapt to different cities’ diverse needs and characteristics, ensuring that policies can achieve more significant effects nationwide.
2.
Increasing Fiscal Technological Expenditure for Green Innovation.
In pursuing green innovation, the government should consider increasing fiscal technological expenditure. Establishing special funds to support R&D projects of high-tech small and micro enterprises and universities is recommended, ensuring that these projects receive sufficient support in the early stages and providing a solid technological foundation for urban green transformation. Furthermore, it is essential to refine and optimize support policies for demonstration bases further, offering more financial support and tax incentives to innovative enterprises, thus becoming a driving force for urban green transformation.
3.
Considering Regional Differences in Policy Formulation.
Given the urban heterogeneity in green transformation resulting from the construction of national innovation and entrepreneurship demonstration bases, the central government, in formulating policies, should comprehensively consider regional disparities. Differentiated policy measures could be adopted for western, non-provincial-level cities and cities with lower GTFP, such as further reducing the tax burden on innovative enterprises and streamlining approval processes to enhance their competitiveness in green transformation.

7. Limitations and Future Research Directions

Although this study considered the impact and mechanism of innovation and entrepreneurship support policies on urban green transformation, some limitations still provide opportunities for further research on relevant topics.
First, the statistical data have timeliness, and the sample data of this paper only go up to 2021. The statistical data of 2022 need to be queried after the publication of the China Statistical Yearbook 2023 in 2024 (not yet publicized), which will have a specific adverse impact on the current academic research and the government’s flexible adjustment of policies to achieve the best results. However, it is regrettable that obtaining relevant data is beyond the scope of this study.
Second, regarding variable selection, this paper considered only fiscal technology expenditure as one mediator. Still, there are many other factors at work, such as the innovation and entrepreneurship policies, that have been verified to promote the technological innovation of small- and medium-sized enterprises [94], and technological innovation has always been the driving force of green transformation [12]. These factors are likely to play mediating roles in the process of innovation and entrepreneurship support policies promoting urban green transformation.
Third, this study is based on GTFP and studied the driving factors of urban green transformation from a static perspective. Due to the lack of dynamic evaluation indicators for green transformation in the academic field, we were unable to conduct a quantitative study on urban green transformation from a dynamic perspective.
It is suggested that future researchers use the latest authoritative data to verify this paper’s findings further. They can also develop dynamic evaluation indicators for green transformation and assess relevant factors from a dynamic perspective. Moreover, they can explore other mediating variables that affect urban green transformation under the theme of innovation and entrepreneurship. Depending on the different mediating variables, they can provide more targeted suggestions for the government’s decision making on urban green transformation.

Author Contributions

Conceptualization, J.W.; data collection and processing, J.W.; model construction, J.W.; literature organization, Y.L.; writing—original draft preparation, Y.L.; writing—review and editing, J.W., Y.L. and G.B.; charting and typography, Y.L. and J.W.; modifying, G.B.; supervision, G.B.; research framework improvement, G.B.; finalization, G.B. All authors have read and agreed to the published version of the manuscript.

Funding

This research received no external funding.

Data Availability Statement

The data presented in this study are available from the corresponding author upon request.

Conflicts of Interest

The authors declare no conflicts of interest.

References

  1. National Bureau of Statistics of China. China Statistical Yearbook 2022. Available online: http://www.stats.gov.cn/sj/ndsj/2022/indexch.htm (accessed on 1 October 2023).
  2. Dale, S. BP Statistical Review of World Energy 2022, 71th. Available online: https://www.bp.com/content/dam/bp/business-sites/en/global/corporate/pdfs/energy-economics/statistical-review/bp-stats-review-2022-full-report.pdf (accessed on 21 October 2023).
  3. Yu, J.; Li, J.; Zhang, W. Identification and classification of resource-based cities in China. J. Geogr. Sci. 2019, 29, 1300–1314. [Google Scholar] [CrossRef]
  4. Mao, W.; Wang, W.; Sun, H.; Yao, P.; Wang, X.; Luo, D. Urban industrial transformation patterns under natural resource dependence: A rule mining technique. Energy Policy 2021, 156, 112383. [Google Scholar] [CrossRef]
  5. Zhang, G.; Zhang, P.; Zhang, Z.G.; Li, J. Impact of environmental regulations on industrial structure upgrading: An empirical study on Beijing-Tianjin-Hebei region in China. J. Clean. Prod. 2019, 238, 117848. [Google Scholar] [CrossRef]
  6. Hao, Y.; Zheng, S.; Zhao, M.; Wu, H.; Guo, Y.; Li, Y. Reexamining the relationships among urbanization, industrial structure, and environmental pollution in China—New evidence using the dynamic threshold panel model. Energy Rep. 2020, 6, 28–39. [Google Scholar] [CrossRef]
  7. Agency, I.E. Key World Energy Statistics; International Energy Agency: Paris, France, 2007.
  8. Lu, Z.-N.; Chen, H.; Hao, Y.; Wang, J.; Song, X.; Mok, T.M. The dynamic relationship between environmental pollution, economic development and public health: Evidence from China. J. Clean. Prod. 2017, 166, 134–147. [Google Scholar] [CrossRef]
  9. Zheng, S.; Wang, J.; Sun, C.; Zhang, X.; Kahn, M.E. Air pollution lowers Chinese urbanites’ expressed happiness on social media. Nat. Hum. Behav. 2019, 3, 237–243. [Google Scholar] [CrossRef]
  10. Xu, F.; Luo, X.-L.; Zhou, D. Air pollution, residents’ happiness, and environmental regulation: Evidence from China. Environ. Sci. Pollut. Res. 2022, 29, 64665–64679. [Google Scholar] [CrossRef]
  11. Diener, E.; Chan, M.Y. Happy people live longer: Subjective well-being contributes to health and longevity. Appl. Psychol. Health Well-Being 2011, 3, 1–43. [Google Scholar] [CrossRef]
  12. Zhai, X.; An, Y. The relationship between technological innovation and green transformation efficiency in China: An empirical analysis using spatial panel data. Technol. Soc. 2021, 64, 101498. [Google Scholar] [CrossRef]
  13. Lee, C.-C.; Lee, C.-C. How does green finance affect green total factor productivity? Evidence from China. Energy Econ. 2022, 107, 105863. [Google Scholar] [CrossRef]
  14. Wang, H.; Cui, H.; Zhao, Q. Effect of green technology innovation on green total factor productivity in China: Evidence from spatial durbin model analysis. J. Clean. Prod. 2021, 288, 125624. [Google Scholar] [CrossRef]
  15. Lyu, Y.; Wang, W.; Wu, Y.; Zhang, J. How does digital economy affect green total factor productivity? Evidence from China. Sci. Total Environ. 2023, 857, 159428. [Google Scholar] [CrossRef]
  16. Jiakui, C.; Abbas, J.; Najam, H.; Liu, J.; Abbas, J. Green technological innovation, green finance, and financial development and their role in green total factor productivity: Empirical insights from China. J. Clean. Prod. 2023, 382, 135131. [Google Scholar] [CrossRef]
  17. You, J.; Xiao, H. Can FDI facilitate green total factor productivity in China? Evidence from regional diversity. Environ. Sci. Pollut. Res. 2022, 29, 49309–49321. [Google Scholar] [CrossRef]
  18. López, R.; Galinato, G.I.; Islam, A. Fiscal spending and the environment: Theory and empirics. J. Environ. Econ. Manag. 2011, 62, 180–198. [Google Scholar] [CrossRef]
  19. Zhang, Q.; Zhang, S.; Ding, Z.; Hao, Y. Does government expenditure affect environmental quality? Empirical evidence using Chinese city-level data. J. Clean. Prod. 2017, 161, 143–152. [Google Scholar] [CrossRef]
  20. Wei, L.; Lin, B.; Zheng, Z.; Wu, W.; Zhou, Y. Does fiscal expenditure promote green technological innovation in China? Evidence from Chinese cities. Environ. Impact Assess. Rev. 2023, 98, 106945. [Google Scholar] [CrossRef]
  21. Sandberg, M.; Klockars, K.; Wilén, K. Green growth or degrowth? Assessing the normative justifications for environmental sustainability and economic growth through critical social theory. J. Clean. Prod. 2019, 206, 133–141. [Google Scholar] [CrossRef]
  22. Szabo, Z.K.; Herman, E. Innovative entrepreneurship for economic development in EU. Procedia Econ. Financ. 2012, 3, 268–275. [Google Scholar] [CrossRef]
  23. Galindo, M.-Á.; Méndez, M.T. Entrepreneurship, economic growth, and innovation: Are feedback effects at work? J. Bus. Res. 2014, 67, 825–829. [Google Scholar] [CrossRef]
  24. State Council of the People’s Republic of China. Implementation Opinions of the General Office of the State Council on Building Demonstration Bases for Mass Entrepreneurship and Public Innovation. Available online: https://www.gov.cn/zhengce/content/2016-05/12/content_5072633.htm (accessed on 7 March 2024).
  25. State Council of the People’s Republic of China. Implementation Opinions of the General Office of the State Council on the Construction of the Second Batch of Demonstration Bases for Mass Entrepreneurship and Mass Innovation. Available online: https://www.gov.cn/zhengce/content/2017-06/21/content_5204264.htm (accessed on 7 March 2024).
  26. State Council of the People’s Republic of China. Notice of the General Office of the State Council on the Construction of the Third Batch of Demonstration Bases for Mass Entre-Preneurship and Mass Innovation. Available online: https://www.gov.cn/zhengce/content/2020-12/24/content_5572999.htm (accessed on 7 March 2024).
  27. Xu, J.; Cui, J. Low-Carbon Cities and Firms Green Technological Innovation. China Ind. Econ. 2020, 12, 178–196. [Google Scholar] [CrossRef]
  28. Jin, P.; Yin, D.; Jin, Z. Urban Heterogeneity, Institution Supply and Innovation Quality. J. World Econ. 2019, 42, 99–123. [Google Scholar] [CrossRef]
  29. Guo, F.; Yang, S.; Chai, Z. Can the Construction of Innovation and Entrepreneurship Demonstration Bases Promote Urban Green Technological In-novation? Test Based on the Difference-in-Difference Model. Sci. Sci. Manag. S. T 2023, 44, 143–161. [Google Scholar]
  30. Guo, J.; Xing, H.; Gong, H. An Empirical Study on the Influence of the Regional Demonstration Bases forInnovation and Entrepreneurship on Regional Innovation Ability. Chin. J. Manag. 2020, 33, 14–26. [Google Scholar] [CrossRef]
  31. Lee, C.-C.; Zeng, M.; Wang, C. Environmental regulation, innovation capability, and green total factor productivity: New evidence from China. Environ. Sci. Pollut. Res. 2022, 29, 39384–39399. [Google Scholar] [CrossRef] [PubMed]
  32. Yang, L.; Gong, J. Can the Construction of National Demonstration Base for Entrepreneurship and Innovation Promote Upgrading of Industrial Structure? J. Cap. Univ. Econ. Bus. 2023, 25, 37–53. [Google Scholar] [CrossRef]
  33. Du, K.; Cheng, Y.; Yao, X. Environmental regulation, green technology innovation, and industrial structure upgrading: The road to the green transformation of Chinese cities. Energy Econ. 2021, 98, 105247. [Google Scholar] [CrossRef]
  34. Liu, S.; Hou, P.; Gao, Y.; Tan, Y. Innovation and green total factor productivity in China: A linear and nonlinear investigation. Environ. Sci. Pollut. Res. 2020, 29, 12810–12831. [Google Scholar] [CrossRef] [PubMed]
  35. Yang, L.; Gong, J. Innovation and Entrepreneurship Digital Inclusive Financeand Economic Growth: Quasi Natural Experiment Based on the Establishment of National Innovation and Entrepreneurship Demonstration Base. East China Econ. Manag. 2022, 36, 51–62. [Google Scholar] [CrossRef]
  36. National Development and Reform Commission. The National Development and Reform Commission Holds a Press Conference to Introduce the Relevant Situation of the Demonstration Base for Innovation and Entrepreneurship. Available online: https://www.ndrc.gov.cn/fzggw/jgsj/zys/sjdt/201702/t20170224_970532.html (accessed on 7 March 2024).
  37. Liu, J.; Wei, Z.; Hu, B. The road to green: The impact of national urban agglomeration construction on urban green development. Ind. Econ. Res. 2023, 4, 27–39. [Google Scholar] [CrossRef]
  38. Xiao, Z.; Tan, R.; Shi, J.; Li, Y. Impacts of environmental regulations and inter-provincial knowledge spillovers on regional green innovation performance. J. Harbin Eng. Univ. 2023, 44, 496–504. [Google Scholar]
  39. Lin, L.; Wu, L.; Yu, Y. Foreign Direct Investment and Firm Eco-innovation: Industrial Linkage and Knowledge Spillover. Bus. Econ. Adm. 2023, 5, 61–78. [Google Scholar] [CrossRef]
  40. Noseleit, F. Entrepreneurship, structural change, and economic growth. J. Evol. Econ. 2013, 23, 735–766. [Google Scholar] [CrossRef]
  41. Zhan, Y.; Li, S. Smart City Construction Entrepreneurial Vitality and High-quality Economic Development: Analysis Based on the GTFP Perspective. J. Financ. Econ. 2022, 48, 4–18. [Google Scholar] [CrossRef]
  42. Cheng, Y.; Lv, K.; Zhu, S. How does digital financial inclusion promote green total factor productivity in China? An empirical analysis from the perspectives of innovation and entrepreneurship. Process Saf. Environ. Prot. 2023, 174, 403–413. [Google Scholar] [CrossRef]
  43. Zhao, X.; Shang, Y.; Song, M. Industrial structure distortion and urban ecological efficiency from the perspective of green entrepreneurial ecosystems. Socio-Econ. Plan. Sci. 2020, 72, 100757. [Google Scholar] [CrossRef]
  44. Jiang, H.; Jiang, P.; Wang, D.; Wu, J. Can smart city construction facilitate green total factor productivity? A quasi-natural experiment based on China’s pilot smart city. Sustain. Cities Soc. 2021, 69, 102809. [Google Scholar] [CrossRef]
  45. Yu, L.; Jin, H. Research on the Policy Effect and Spatial Spillover Effect of National Innovation and Entrepreneurship Demonstration Base Construction. Economist 2021, 10, 90–99. [Google Scholar] [CrossRef]
  46. Catalano, M.; Forni, L. Fiscal Policies for a Sustainable Recovery and a Green Transformation; World Bank: Washington, DC, USA, 2021. [Google Scholar]
  47. Peng, F.; Zhou, S.; Ding, T.; Wu, H. Impact of fiscal expenditure stress on green transformation risk: Evidence from China education authority reform. Econ. Chang. Restruct. 2023, 56, 4565–4601. [Google Scholar] [CrossRef]
  48. Guellec, D.; Van Pottelsberghe De La Potterie, B. The impact of public R&D expenditure on business R&D. Econ. Innov. New Technol. 2003, 12, 225–243. [Google Scholar]
  49. Hall, B.H.; Helmers, C. Innovation and diffusion of clean/green technology: Can patent commons help? J. Environ. Econ. Manag. 2013, 66, 33–51. [Google Scholar] [CrossRef]
  50. Kemfert, C. Induced technological change in a multi-regional, multi-sectoral, integrated assessment model (WIAGEM): Impact assessment of climate policy strategies. Ecol. Econ. 2005, 54, 293–305. [Google Scholar] [CrossRef]
  51. Raihan, A.; Pavel, M.I.; Muhtasim, D.A.; Farhana, S.; Faruk, O.; Paul, A. The role of renewable energy use, technological innovation, and forest cover toward green development: Evidence from Indonesia. Innov. Green Dev. 2023, 2, 100035. [Google Scholar] [CrossRef]
  52. Zhai, X.; An, Y. Analyzing influencing factors of green transformation in China’s manufacturing industry under environmental regulation: A structural equation model. J. Clean. Prod. 2020, 251, 119760. [Google Scholar] [CrossRef]
  53. Mubarik, M.S.; Naghavi, N. Human capital, green energy, and technological innovations: Firm-level analysis. In Econometrics of Green Energy Handbook: Economic and Technological Development; Springer: Cham, Switzerland, 2020; pp. 151–164. [Google Scholar]
  54. Ahmed, Z.; Asghar, M.M.; Malik, M.N.; Nawaz, K. Moving towards a sustainable environment: The dynamic linkage between natural resources, human capital, urbanization, economic growth, and ecological footprint in China. Resour. Policy 2020, 67, 101677. [Google Scholar] [CrossRef]
  55. Tong, H.; Wang, Y.; Xu, J. Green transformation in China: Structures of endowment, investment, and employment. Struct. Chang. Econ. Dyn. 2020, 54, 173–185. [Google Scholar] [CrossRef]
  56. Zhu, Y.; Liu, Z.; Feng, S.; Lu, N. The role of fiscal expenditure on science and technology in carbon reduction: Evidence from provincial data in China. Environ. Sci. Pollut. Res. 2022, 29, 82030–82044. [Google Scholar] [CrossRef]
  57. Rath, B.N.; Akram, V.; Bal, D.P.; Mahalik, M.K. Do fossil fuel and renewable energy consumption affect total factor productivity growth? Evidence from cross-country data with policy insights. Energy Policy 2019, 127, 186–199. [Google Scholar] [CrossRef]
  58. Bekun, F.V. Mitigating emissions in India: Accounting for the role of real income, renewable energy consumption and investment in energy. Int. J. Energy Econ. Policy 2022, 12, 188–192. [Google Scholar] [CrossRef]
  59. Wu, D.; Song, W. Does green finance and ICT matter for sustainable development: Role of government expenditure and renewable energy investment. Environ. Sci. Pollut. Res. 2023, 30, 36422–36438. [Google Scholar] [CrossRef] [PubMed]
  60. Jin, Y.; Tang, Y.M.; Chau, K.Y.; Abbas, M. How government expenditure mitigates emissions: A step towards sustainable green economy in belt and road initiatives project. J. Environ. Manag. 2022, 303, 113967. [Google Scholar] [CrossRef] [PubMed]
  61. Zhang, D.; Mohsin, M.; Rasheed, A.K.; Chang, Y.; Taghizadeh-Hesary, F. Public spending and green economic growth in BRI region: Mediating role of green finance. Energy Policy 2021, 153, 112256. [Google Scholar] [CrossRef]
  62. Zhu, J. Data envelopment analysis vs. principal component analysis: An illustrative study of economic performance of Chinese cities. Eur. J. Oper. Res. 1998, 111, 50–61. [Google Scholar] [CrossRef]
  63. Chen, Y.; Miao, J.; Zhu, Z. Measuring green total factor productivity of China’s agricultural sector: A three-stage SBM-DEA model with non-point source pollution and CO2 emissions. J. Clean. Prod. 2021, 318, 128543. [Google Scholar] [CrossRef]
  64. Sueyoshi, T.; Yuan, Y.; Goto, M. A literature study for DEA applied to energy and environment. Energy Econ. 2017, 62, 104–124. [Google Scholar] [CrossRef]
  65. Liu, W.; Meng, W.; Li, X.; Zhang, D. DEA models with undesirable inputs and outputs. Ann. Oper. Res. 2010, 173, 177–194. [Google Scholar] [CrossRef]
  66. Li, Y.; Chen, Y. Development of an SBM-ML model for the measurement of green total factor productivity: The case of pearl river delta urban agglomeration. Renew. Sustain. Energy Rev. 2021, 145, 111131. [Google Scholar] [CrossRef]
  67. Li, X.; Shu, Y.; Jin, X. Environmental regulation, carbon emissions and green total factor productivity: A case study of China. Environ. Dev. Sustain. 2022, 24, 2577–2597. [Google Scholar] [CrossRef]
  68. Zhou, P.; Ang, B.; Wang, H. Energy and CO2 emission performance in electricity generation: A non-radial directional distance function approach. Eur. J. Oper. Res. 2012, 221, 625–635. [Google Scholar] [CrossRef]
  69. Tone, K. A slacks-based measure of efficiency in data envelopment analysis. Eur. J. Oper. Res. 2001, 130, 498–509. [Google Scholar] [CrossRef]
  70. Tone, K. A slacks-based measure of super-efficiency in data envelopment analysis. Eur. J. Oper. Res. 2002, 143, 32–41. [Google Scholar] [CrossRef]
  71. He, X.; Liang, Y.; Liang, D.; Deng, H. The impact of China’s information infrastructure construction policy on green total factor productivity: Moving towards a green world. Environ. Sci. Pollut. Res. 2023, 30, 103017–103032. [Google Scholar] [CrossRef]
  72. Song, M.; Du, J.; Tan, K.H. Impact of fiscal decentralization on green total factor productivity. Int. J. Prod. Econ. 2018, 205, 359–367. [Google Scholar] [CrossRef]
  73. Tian, Y.; Feng, C. The internal-structural effects of different types of environmental regulations on China’s green total-factor productivity. Energy Econ. 2022, 113, 106246. [Google Scholar] [CrossRef]
  74. Wang, Y.; Zhong, M. Research on Impact and Mechanism of Ecological Civilization Demonstration Area Construction on Green Total Factor Productivity. Mod. Financ. Econ.-J. Tianjin Univ. Financ. Econ. 2023, 43, 89–107. [Google Scholar] [CrossRef]
  75. Yu, D.; Li, X.; Yu, J.; Li, H. The impact of the spatial agglomeration of foreign direct investment on green total factor productivity of Chinese cities. J. Environ. Manag. 2021, 290, 112666. [Google Scholar] [CrossRef]
  76. Fan, G.; Wang, X.; Zhang, L. Report on the Marketization Process in Various Regions of China. China Mark. 2001, 6, 58–61. [Google Scholar]
  77. Ma, L.; Wang, L.; Zhang, Q. Pecking Order of Mixed Ownership: The Logic of Market. China Ind. Econ. 2015, 7, 5–20. [Google Scholar] [CrossRef]
  78. Li, W.; Yu, M. Equity structure and corporate innovation in privatized firms. Manag. World 2015, 4, 112–125. [Google Scholar] [CrossRef]
  79. Tian, C.; Li, X.; Xiao, L.; Zhu, B. Exploring the impact of green credit policy on green transformation of heavy polluting industries. J. Clean. Prod. 2022, 335, 130257. [Google Scholar] [CrossRef]
  80. Wen, Z.; Zhang, L.; Hou, J.; Liu, H. Testing and application of the mediating effects. Acta Psychol. Sin. 2004, 5, 614–620. [Google Scholar]
  81. Wen, Z.; Ye, B. Analyses of Mediating Effects: The Development of Methods and Models. Adv. Psychol. Sci. 2014, 22, 731–745. [Google Scholar] [CrossRef]
  82. Bu, D.; Zhang, C.; Lin, P.T.; Hu, F. Political uncertainty, institutions and accounting conservatism: Evidence from the provincial leader turnover in China. Span. J. Financ. Account./Rev. Española Financ. Contab. 2020, 49, 395–426. [Google Scholar] [CrossRef]
  83. Chen, Y. Does political turnover affect corporate investment? Evidence from China. Emerg. Mark. Rev. 2022, 51, 100865. [Google Scholar] [CrossRef]
  84. Giesselmann, M.; Schmidt-Catran, A.W. Interactions in fixed effects regression models. Sociol. Methods Res. 2022, 51, 1100–1127. [Google Scholar] [CrossRef]
  85. Zhao, X.; Nakonieczny, J.; Jabeen, F.; Shahzad, U.; Jia, W. Does green innovation induce green total factor productivity? Novel findings from Chinese city level data. Technol. Forecast. Soc. Chang. 2022, 185, 122021. [Google Scholar] [CrossRef]
  86. Xie, D.; Hu, S. Green Finance, Maturity Mismatch and Green Total Factor Productivity. Soft Sci. 2023, 37, 56–62+70. [Google Scholar] [CrossRef]
  87. Chen, X.; Lu, H. Tax and Fee Reduction Government Intervention and Green Total Factor ProductivityAnalysis Based on Dynamic Panel Threshold Model. Commer. Res. 2023, 2, 49–56. [Google Scholar] [CrossRef]
  88. Thompson, M. Playing with the rules of the game: Social innovation for urban transformation. Int. J. Urban Reg. Res. 2019, 43, 1168–1192. [Google Scholar] [CrossRef]
  89. Ma, Y.; Thornton, T.F.; Mangalagiu, D.; Lan, J.; Hestad, D.; Cappello, E.A.; Van der Leeuw, S. Co-creation, co-evolution and co-governance: Understanding green businesses and urban transformations. Clim. Chang. 2020, 160, 621–636. [Google Scholar] [CrossRef]
  90. Gu, R.; Li, C.; Yang, Y.; Zhang, J. The impact of industrial digital transformation on green development efficiency considering the threshold effect of regional collaborative innovation: Evidence from the Beijing-Tianjin-Hebei urban agglomeration in China. J. Clean. Prod. 2023, 420, 138345. [Google Scholar] [CrossRef]
  91. Burch, S.; Andrachuk, M.; Carey, D.; Frantzeskaki, N.; Schroeder, H.; Mischkowski, N.; Loorbach, D. Governing and accelerating transformative entrepreneurship: Exploring the potential for small business innovation on urban sustainability transitions. Curr. Opin. Environ. Sustain. 2016, 22, 26–32. [Google Scholar] [CrossRef]
  92. Bradford, J.; Fraser, E.D. Local authorities, climate change and small and medium enterprises: Identifying effective policy instruments to reduce energy use and carbon emissions. Corp. Soc. Responsib. Environ. Manag. 2008, 15, 156–172. [Google Scholar] [CrossRef]
  93. Wang, K.-L.; Zhang, F.-Q.; Xu, R.-Y.; Miao, Z.; Cheng, Y.-H.; Sun, H.-P. Spatiotemporal pattern evolution and influencing factors of green innovation efficiency: A China’s city level analysis. Ecol. Indic. 2023, 146, 109901. [Google Scholar] [CrossRef]
  94. Zhao, K.; Wu, W.; Ye, J. The impact of “Mass Entrepreneurship and Innovation” policy on SMEs’ innovation: Using quasi-natural experiments. Bull. Econ. Res. 2023, 75, 348–365. [Google Scholar] [CrossRef]
Figure 1. Model establishment (source: drawn by the authors).
Sustainability 16 02622 g001
Figure 2. Parallel trend test.
Sustainability 16 02622 g002
Figure 3. Placebo test results for coefficients.
Sustainability 16 02622 g003
Figure 4. Placebo test results for t-values.
Sustainability 16 02622 g004
Table 1. Selection of GTFP indicators.
Variable TypeVariable NameData Source
Input IndicatorsEmployed Population in Districts (10,000 people)China Urban Statistics Yearbook
Urban Capital Stock (Ten thousand RMB; The base year used for the chained index was 2006)China Statistical Yearbook
Built-Up Area in Districts (square kilometers)China Urban Statistics Yearbook
Energy Consumption in Prefecture-Level Cities (10,000 tons of standard coal)China Energy Statistics Yearbook
China Environmental Yearbook
Desirable OutputGDP (Ten thousand RMB)China Urban Statistics Yearbook
Undesirable OutputIndustrial Sulfur Dioxide Emissions (tons)China Urban Statistics Yearbook
Industrial Wastewater Emissions (tons)
Industrial Particulate Matter Emissions (tons)
Table 2. Descriptive statistics.
Variable TypeVariable NameVariable DefinitionObsMeanStd. Dev.MinMax
Core Explanatory VariableDIDPolicy Implementation34080.07950.27101
Dependent VariableGTFPGreen Total Factor Productivity34081.0070.1390.3224.059
Control VariablesGDPPer Capita Regional Gross Domestic Product (RMB)339553,28434,3005304467,749
wageAverage Wages of On-Duty Employees (RMB)339358,36022,2934958201,504
govLocal General Public Budget Expenditure in Districts (Ten Thousand RMB)33842.347 × 1066.175 × 10624,3758.431 × 107
marketDegree of Marketization294311.712.3954.68319.69
capitalStock of Fixed Asset Capital (Ten Thousand RMB)34088.221 × 1079.205 × 1075.038 × 1069.936 × 108
densityPopulation Density (Ten Thousand People/km2)34063801256130915,055
Mediating VariablestgovTotal Science and Technology Expenditure in the City (Ten Thousand RMB)3404117,525379,7277535.550 × 106
Table 3. Benchmark regression results.
(1)(2)(3)(4)(5)(6)(7)(8)
DID0.1000 ***0.0976 ***0.0716 ***0.0716 ***0.0716 ***0.0562 ***0.0562 ***0.0562 ***
(19.1988)(18.8480)(10.5040)(8.2180)(4.7505)(6.2351)(5.9235)(3.2240)
ln GDP−0.0316 ***−0.0563 ***−0.0298 ***−0.0298 **−0.0298 *0.0151 ***0.0151 ***0.0151 *
(−4.9587)(−6.8522)(−2.9928)(−2.4502)(−1.7738)(3.7423)(3.8674)(1.7862)
ln wage0.0659 ***0.1105 ***−0.0378 **−0.0378−0.03780.1001 ***0.1001 **0.1001 **
(7.6428)(10.0022)(−2.5050)(−1.5467)(−1.6513)(7.1495)(3.0169)(2.7074)
ln gov0.0095 ***−0.0068 *−0.0035−0.0035−0.00350.0249 ***0.0249 ***0.0249 ***
(2.9996)(−1.8811)(−0.9987)(−1.1260)(−0.4881)(9.1078)(5.3219)(3.7174)
ln market0.01940.0893 ***−0.0994 ***−0.0994 ***−0.0994 **−0.0073−0.0073−0.0073
(1.2771)(4.4225)(−4.0633)(−3.5394)(−2.3837)(−0.8489)(−1.7915)(−0.4109)
ln capital−0.0189 ***−0.0606 ***−0.0945 ***−0.0945 ***−0.0945 ***−0.0311 ***−0.0311 ***−0.0311 ***
(−3.8458)(−7.7045)(−10.3911)(−13.3427)(−5.1664)(−9.4841)(−8.4073)(−4.2331)
ln density0.00400.0079 **0.0077 **0.0077 *0.00770.00110.00110.0011
(1.2880)(2.2539)(1.9963)(2.1156)(0.9209)(0.4711)(0.6874)(0.1608)
Constant−0.2622 ***0.2810 ***2.6379 ***2.6379 ***2.6379 ***−1.0405 ***−1.0405 **−1.0405 **
(−4.2133)(3.3742)(12.1696)(8.1030)(5.8395)(−7.6709)(−2.6630)(−2.7372)
Urban Fixed EffectsNOYESYESYESYESYESYESYES
Time Fixed EffectsNONOYESYESYESYESYESYES
N34083408340834083408334833483348
R2 0.24850.68660.68660.68660.41750.41750.4175
F 147.250349.7413113.270614.280039.893439.65956.9927
Note: The values reported in parentheses are the adjusted robust t-values. *, **, and *** indicate significance at the 10%, 5%, and 1% levels, respectively.
Table 4. Mechanism regression results.
(1)(2)
VariablesFiscal Science and Technology ExpenditureGTFP
DID0.277 ***0.0699 ***
(0.0311)(0.00681)
ln tgov 0.00622 **
(0.00265)
Constant−13.68 ***2.723 ***
(1.645)(0.226)
Control VariablesYESYES
Urban Fixed EffectsYESYES
Time Fixed EffectsYESYES
N34083408
R20.6870.922
Note: The values reported in parentheses are the robust heteroskedasticity-adjusted t-values. **, and *** indicate significance at the 5% and 1% levels, respectively.
Table 5. DDD regression results.
(1)(2)(3)(4)(5)
DDD Random EffectsDDD Fixed EffectsDDD Heteroskedasticity-Robust StandardDDD Time-Clustered Robust StandardDDD Province-Clustered Standard
DDD0.0904 ***0.1137 ***0.1007 ***0.1007 ***0.1007 ***
(9.0123)(11.0285)(7.9319)(5.5186)(3.4392)
Constant−0.3459 ***0.2088 **2.4323 ***2.4323 ***2.4323 ***
(−5.5275)(2.5599)(11.5988)(7.9034)(5.3489)
Control VariablesYESYESYESYESYES
Urban Fixed EffectsYESYESYESYESYES
Time Fixed EffectsYESYESYESYESYES
N34083408340834083408
R2 0.28340.69960.69960.6996
F 136.858249.6380156.493715.7502
Note: The values reported in parentheses are the adjusted robust t-values. **, and *** indicate significance at the 5% and 1% levels, respectively.
Table 6. PSM-DID results.
Variable(1)(2)(3)(4)(5)
ln GTFP1:11:21:4CaliperKernel
DID0.0330 ***0.0412 ***0.0433 ***0.0413 ***0.0497 ***
(3.9893)(4.7828)(5.6853)(5.7542)(6.7418)
ln GDP−0.0048−0.0134−0.0301−0.0450 ***−0.0448 ***
(−0.1883)(−0.5112)(−1.4325)(−4.5863)(−4.5438)
ln wage0.07860.02900.0002−0.0209−0.0192
(1.5699)(0.5926)(0.0051)(−1.4704)(−1.3315)
ln gov−0.0098−0.0097−0.0089−0.0033−0.0033
(−1.2649)(−1.2798)(−1.3436)(−0.9726)(−0.9489)
ln market−0.1666 ***−0.2064 ***−0.1346 ***−0.1017 ***−0.1033 ***
(−2.7105)(−3.2800)(−2.6792)(−4.1781)(−4.2524)
ln capital−0.2403 ***−0.2252 ***−0.1884 ***−0.0669 ***−0.0703 ***
(−11.4633)(−10.7639)(−10.0676)(−7.6978)(−7.9156)
ln density−0.0026−0.0023−0.00030.00380.0048
(−0.2678)(−0.2428)(−0.0335)(1.0118)(1.2601)
Constant4.2418 ***4.6747 ***4.2536 ***2.1508 ***2.1858 ***
(7.3337)(8.1255)(8.9511)(10.4779)(10.4836)
Control VariablesYESYESYESYESYES
Urban Fixed EffectsYESYESYESYESYES
Time Fixed EffectsYESYESYESYESYES
N11721142149532893311
R20.74290.74160.73050.64640.6471
F33.199734.018432.583432.194733.8596
Note: The values reported in parentheses are the adjusted robust t-values. *** indicate significance at the 1% level.
Table 7. Regression results after controlling province–time interaction fixed effects.
(1)(2)(3)
Variablesln GTFPln tgovln GTFP
ln tgov 0.0126 ***
(0.00405)
DID0.0680 ***0.229 ***0.0755 ***
(0.00681)(0.0299)(0.00859)
Constant1.311 ***0.8710.833 *
(0.317)(1.867)(0.459)
Control VariablesYESYESYES
Urban Fixed EffectsYESYESYES
Province–Time Interaction Fixed EffectsYESYESYES
N334833483348
R20.7340.9490.710
Note: The values reported in parentheses are the adjusted robust t-values. *, and *** indicate significance at the 10% and 1% levels, respectively.
Table 8. Lag regression results.
(1)(2)(3)
Variablesln GTFPL1. ln tgovln GTFP
L1. ln tgov 0.00993 ***
(0.00353)
L2. DID0.0588 ***0.199 ***0.0568 ***
(0.00783)(0.0354)(0.00771)
Constant1.335 ***2.2961.313 ***
(0.418)(2.327)(0.416)
Control VariablesYESYESYES
Urban Fixed EffectsYESYESYES
Province–Time Interaction Fixed EffectsYESYESYES
N279027902790
R20.7930.9510.794
Note: The values reported in parentheses are the adjusted robust t-values. *** indicates significance at1% level. L1 and L2 denote a one-period lag and a two-period lag.
Table 9. Regression results with changed dependent variable.
(1)(2)(3)
Variablesln SO2 Intln tgovln SO2 Int
ln tgov 0.0937 ***
(0.0265)
DID0.264 ***0.277 ***0.239 ***
(0.0450)(0.0311)(0.0452)
Constant2.160−13.68 ***3.638 *
(1.879)(1.645)(1.975)
Control VariablesYESYESYES
Urban Fixed EffectsYESYESYES
Province–Time Interaction Fixed EffectsYESYESYES
N312434083124
R20.9210.9220.921
Note: The values reported in parentheses are the adjusted robust t-values. *, and *** indicate significance at the 10% and 1% levels, respectively.
Table 10. Regression results using subsamples.
(1)(2)(3)
Variablesln SO2 Intln tgovln SO2 Int
ln tgov 0.00702 **
(0.00337)
DID0.0440 ***0.154 ***0.0429 ***
(0.00764)(0.0322)(0.00756)
Constant0.839 ***−0.3490.842 ***
(0.297)(1.884)(0.298)
Control VariablesYESYESYES
Urban Fixed EffectsYESYESYES
Province–Time Interaction Fixed EffectsYESYESYES
N320432043204
R20.7130.9410.714
Note: The values reported in parentheses are the adjusted robust t-values. ** and *** indicate significance at the 5% and 1% levels
Table 11. Heteroskedasticity test regression results.
(1)(2)(3)(4)(5)(6)(7)(8)(9)(10)(11)(12)
East_BenchmarkWest_BenchmarkEast_TechexpenWest_TechexpenProcity_BenchmarkNonprocity_BenchmarkProcity_TechexpenNonprocity_TechexpenGTFPaboveavg_BenchmarkGTFP_Belowavg_BenchmarkGTFPaboveavg_TechexpenGTFP_Belowavg_Techexpen
VARIABLESln_GTFPln_GTFPln_tgovln_tgovln_GTFPln_GTFPln_tgovln_tgovln_GTFPln_GTFPln_tgovln_tgov
DID0.0793 ***−0.00140.2771 ***0.2679 ***0.2036 ***0.00290.4421 ***0.1943 ***0.1098 ***−0.00660.3150 ***0.1930 ***
(10.7432)(−0.1308)(8.3681)(3.9670)(17.8946)(0.4586)(8.9833)(5.3530)(11.3489)(−1.2960)(6.5755)(3.3378)
Constant2.5558 ***1.5445 ***−13.5418 ***−14.0542 ***1.8695 ***1.6617 ***−14.8966 ***−13.5803 ***1.9335 ***1.3155 ***−15.4524 ***−8.4981 ***
(11.8014)(8.2405)(−8.0875)(−7.3783)(9.7060)(8.6432)(−8.2135)(−7.5602)(7.4318)(6.3505)(−5.9982)(−2.8495)
Urban Fixed EffectsYESYESYESYESYESYESYESYESYESYESYESYES
Time Fixed EffectsYESYESYESYESYESYESYESYESYESYESYESYES
N334828563348285630123192301231921645168816451688
R20.68860.64000.92240.88330.73720.64210.91850.89730.74230.65740.94090.9226
F51.075220.175391.801371.419986.528623.979880.540784.222434.310510.755842.569021.2346
Note: The values reported in parentheses are the adjusted robust t-values. *** indicates significance at the 1% levels.
Disclaimer/Publisher’s Note: The statements, opinions and data contained in all publications are solely those of the individual author(s) and contributor(s) and not of MDPI and/or the editor(s). MDPI and/or the editor(s) disclaim responsibility for any injury to people or property resulting from any ideas, methods, instructions or products referred to in the content.

