Article

Spatial Analysis of Bike-Sharing Ridership for Sustainable Transportation in Houston, Texas

1
Urban Planning and Environmental Policy, Texas Southern University, Houston, TX 77004, USA
2
Department of Public Affairs and Planning, University of Texas at Arlington, Arlington, TX 76019, USA
3
Management Information Systems, University of Massachusetts at Lowell, Lowell, MA 01854, USA
*
Author to whom correspondence should be addressed.
Sustainability 2024, 16(6), 2569; https://doi.org/10.3390/su16062569
Submission received: 27 February 2024 / Revised: 15 March 2024 / Accepted: 18 March 2024 / Published: 21 March 2024

Abstract

:
This study aims to analyze bike-sharing information and related urban factors to promote bike-sharing utilization in Houston, Texas. The research was initiated with a descriptive analysis, where the hourly and daily variations in bike demand are investigated, thereby revealing the time-related patterns of bike tours. The models included data on socio-demographics, public transportation availability, land use patterns, tree canopy coverage, bike routes, and job density within 0.25-mile and 0.5-mile buffer zones around each bike-sharing station. Stepwise regression was utilized to examine the effects of urban factors on bike-sharing ridership, and the explanatory power of the model was enhanced by selecting meaningful variables. The analysis found that tree canopy coverage was a significant factor in influencing bike-sharing ridership. Expansion of tree coverage can help make biking a sustainable mode of transportation. These findings have the potential to guide the development of practical policies that aim to promote sustainable urban mobility through bike-sharing programs.

1. Introduction

Bike-sharing programs have been recognized as both popular and sustainable travel mode in urban areas worldwide [1]. In these areas, short-term bicycle rentals are provided for a fee at designated locations. These programs have gained significant attention for addressing the first- and last-mile connectivity challenges in urban mobility, as well as in tackling issues such as traffic congestion, air pollution, and limited parking space. Furthermore, they promote physical activity and enhance public health, making them a source of numerous benefits and an avenue toward a sustainable transportation ecosystem.
While cities in the United States and Europe with bike-sharing systems benefit from dense populations, well-established pedestrian infrastructure, and robust public transportation, thereby offering multiple transportation options, this study specifically assesses the viability of bike-sharing systems in Houston—a car-centric major city.
In Houston, Texas, the BCycle bike-sharing program offers a fleet of bicycles that are available at docking stations, allowing people to check out or return a bike through the city for 24 h a day and 7 days a week. Similar to many other cities, individuals can check out a bike from any available dock location and ride it to their destination. Since BCycle’s introduction in 2012, it has experienced rapid expansion at an estimated growth rate of 1000% over the past 10 years [2]. Despite the rapid infrastructure expansion, this system has incurred financial losses, leading to the suspension of several stations. From an urban planning standpoint, it is crucial to thoroughly examine the factors leading to these outcomes. We can then utilize these insights to improve Houston’s bike-sharing services in the future.
Fundamentally, the key element in assessing the current operating system is gaining an understanding of the user behavior patterns in bike sharing and the characteristics of the neighborhoods surrounding bike stations. Consequently, our research questions can be framed as follows: What are the user patterns of bike sharing? What are the key neighboring characteristics impacting a bike-sharing program? To address these questions, we employed the bike-sharing dataset distributed by the City of Houston along with various urban parameters encompassing population and employment data, transportation infrastructure, land use characteristics, and tree canopy density. Furthermore, this research involved constructing a statistical model through stepwise regressions to explore the prospective bike-share demands in Houston. Thus, this study makes some important contributions to the literature by recognizing these findings as valuable insights pertaining to the vibrant Houston bike-sharing program.

2. Previous Studies

Disparities in travel behaviors between individuals who are not part of bike-sharing programs and those who are members lead to an even distribution of supply and demand at bike-share stations [3]. Individuals who are not members of bike-sharing programs tend to start and end their trips at the same station, predominantly employing bike-sharing programs for leisurely and recreational activities, especially during weekends. On the other hand, program members are more inclined to use bike sharing for their daily commutes to work during weekdays, where they check out and return bikes at different stations. Members of the bike-share program typically embark on shorter distances and cover less ground in contrast to non-members [3,4,5,6,7]. For example, the travel route preferences of bike-share members in Phoenix, AZ were influenced by real-time GPS data, showing a higher sensitivity to factors such as route length, as well as the presence of high-volume and high-speed roads. Conversely, members of the programs demonstrated a higher level of familiarity in navigating alternative routes, whereas non-members showed less awareness, increasing their chances of encountering one-way road segments that may lead to extend their trip duration [5]. A study revealed that individuals who opted for a 24 h bike-sharing membership in Colorado tended to ride at a slower pace or take longer breaks during their trips. In contrast, annual members experienced fewer stops and engaged in more consistent, routine trips [3]. Mateo-Babiano et al. [8] found short trips taken by CityCycle members in Brisbane, Australia and on off-road bikeways near stations promote a greater use of bike-share services. They suggest that the presence of membership can influence travel behaviors.
From an urban planning perspective, land use is clearly associated with the efficiency of bike-sharing infrastructure and its operation. Noland et al. [9] identified positive correlations between residential land use and bike-sharing trips that occur on weekends and holidays, as well as those between central business land use and weekday trips related to shared bicycle usage. However, their findings indicated an insignificant association between bike-share trips and recreational land use, which aligns with the conclusions of the study by Caspi [10] on Philadelphia’s bike-share system. In the Minneapolis–St. Paul, Minnesota area, a higher population density and greater proportion of commercial land use were found to be positively associated with the number of bike-sharing trips taken by annual members. As for the greenery effect, a positive association was found between greenways and bike-share usage in Charlotte, North Carolina [11], as well as between tree density and e-scooter volume in Calgary, Canada [12]. Roadside trees provide comfort to cyclists by cooling temperatures, especially on the hottest days [13,14], thereby cleaning the air with lower fine particle concentrations [15,16] and creating a more attractive cycling environment [17]. Lusk et al. [18] emphasized the multiple benefits of tree canopies in designing sidewalks, cycle tracks, and roadside trees when they conducted a visual preference survey in Boston, Massachusetts. In Brisbane, Australia, people tend to cycle more for transport in neighborhoods with more tree coverage [17].
Additionally, positive correlations have been observed between bike-share demands and economic indicators, such as the number of employments within a 0.25-mile station buffer and food businesses within a 0.125-mile station buffer [19,20]. Economic variables such as jobs and businesses promote bike-share ridership as found in Montreal, Canada [21], Barcelona and Seville, Spain [22], and Nanjing, China [23]. However, in the three-largest Texan cities, population or employment density was not associated with bike-share demand within 400 m buffer station areas in Houston and Austin although less statistically compelling results were observed in San Antonio [1]. The findings implied that these variables might not be the primary factors influencing the location of bike-share stations as they could be more strongly influenced by specific purposes related to recreational and leisure trips.
Bike-sharing infrastructures and the accessibility of public transportation as multimodal transportation strategies are recognized as influential factors in promoting bike-share programs at the local level. Alcorn and Jiao [1] found a favorable correlation between bike-share usage and the convenience of accessing bike-sharing facilities. In the case of New York City, Noland et al. [9] observed a higher frequency of bike-share trips in proximity to subway stations, as well as in areas with an abundance of bicycle lanes and ample bicycle parking facilities. Similarly, positive correlations between subway stations and both loop trips and origin–destination trips were found in Seoul, Korea [24]. However, Zhao et al. [23] found that increasing the number of nearby stations could reduce the origin–destination bike-share trips in Nanjing, China because of sustainable public transit systems.
Wang and Lindsey [20] found that the existence of on-street bike lanes exhibited a positive correlation with the usage of bike-share services in Minneapolis–St. Paul. However, this correlation was not observed in the regions with a low density of bike-share services, thereby emphasizing the importance of investing in both bike-share systems and bicycle infrastructure. Caspi [10] identified positive correlations between bike-sharing ridership and cycling infrastructure, bus stops, and transit stops in Philadelphia. However, such correlations were not identified for trolley stops and regional train stations. Similarly, Faghih-Imani and Eluru [4] found a negative correlation between bike-share usage and the length of railway lines near bike-share stations in New York City.
Schoner et al. [25] reported an association between an increase in the number of bike-share docks and an increase in Chicago bike-share memberships. In a closer examination of the effects of bike-share docks in Chicago, Hyland et al. [6] showed that the expansion of the number of docks within a range of 0.8 km to 4.8 km likely enhances the utilization of bike-share services. However, the introduction of new stations within a 0.8 km range had the opposite effect as it led to a reduction in demand on the existing docks. Regardless of the location of bike-share and bicycle facilities, statistical analysis has demonstrated that the inclusion of a one-mile bike lane to the bike-sharing infrastructure in Houston has led to an average increase of 38 daily riders per week. Furthermore, the inclusion of a new station in the bike-sharing infrastructure was found to induce an average of 16 additional daily trips per week [26].
Bike-sharing can be associated with modal shifts at the micro level, either in single trips or multiple trips. That is, it can be defined as the use of bicycles for commuting trips, as well as the transitions from public transportation to bicycles or from personal cars to bicycles [27]. There have been numerous previous studies related to such modal shifts. In the case of using a shared bicycle without any transportation, the primary purpose is to cover short distances that are not suitable for public transportation, thereby aiming to reduce travel time, and there were more instances of using privately owned bicycles rather than shared bicycles [28]. The integration of public transportation and shared bicycles represents an ideal scenario for pursuing sustainable transportation, where the aim is to maximize the efficiency of each mode. This combination not only reduces travel time by walking to and from public transportation, but it also helps with avoiding waiting and congestion, thus fostering sustainable transportation practices [29,30]. The combination of cars and shared bicycles was relatively less common compared to other options, but factors such as parking availability, traffic congestion, and high travel costs encouraged this combination [31]. Appendix A shows a summary of the literature that is closely aligned with the focus of this study.
Presently, there is a limited body of studies that has comprehensively explored the urban environments surrounding bike-sharing stations, especially tree canopy coverage. In addition, under the assumption that the variation in time between weekends and weekdays influences the utilization of shared bicycles, it is necessary to conduct an examination of how urban environments influence the demand for shared bicycle usage during weekends and weekdays. By comprehending these potential factors, it becomes feasible to encourage a greater number of bike-sharing riders, thereby promoting sustainable transportation at the local level for a long run. Thus, this study aims to investigate the spatial patterns of bike-sharing ridership between weekends and weekdays by considering aspects such as land use, population and employment density, greening space, and transportation infrastructure. In addition, it was conducted to help predict trip generations related to the ridership of shared bicycles in the car-oriented city of Houston and to investigate the inadequate ridership environment of shared bicycles as a foundational investigation through which to promote more ridership, thereby contributing to future policy-making processes.
The remainder of this paper is as follows. Section 2 provides overviews of the relevant literature. In Section 3, the study area and data are explained. Section 4 describes the research methodology that was used to build statistical models. The research results are discussed in Section 5. Section 6 presents a discussion regarding research limitations and future studies, and this is followed by the conclusion in Section 7.

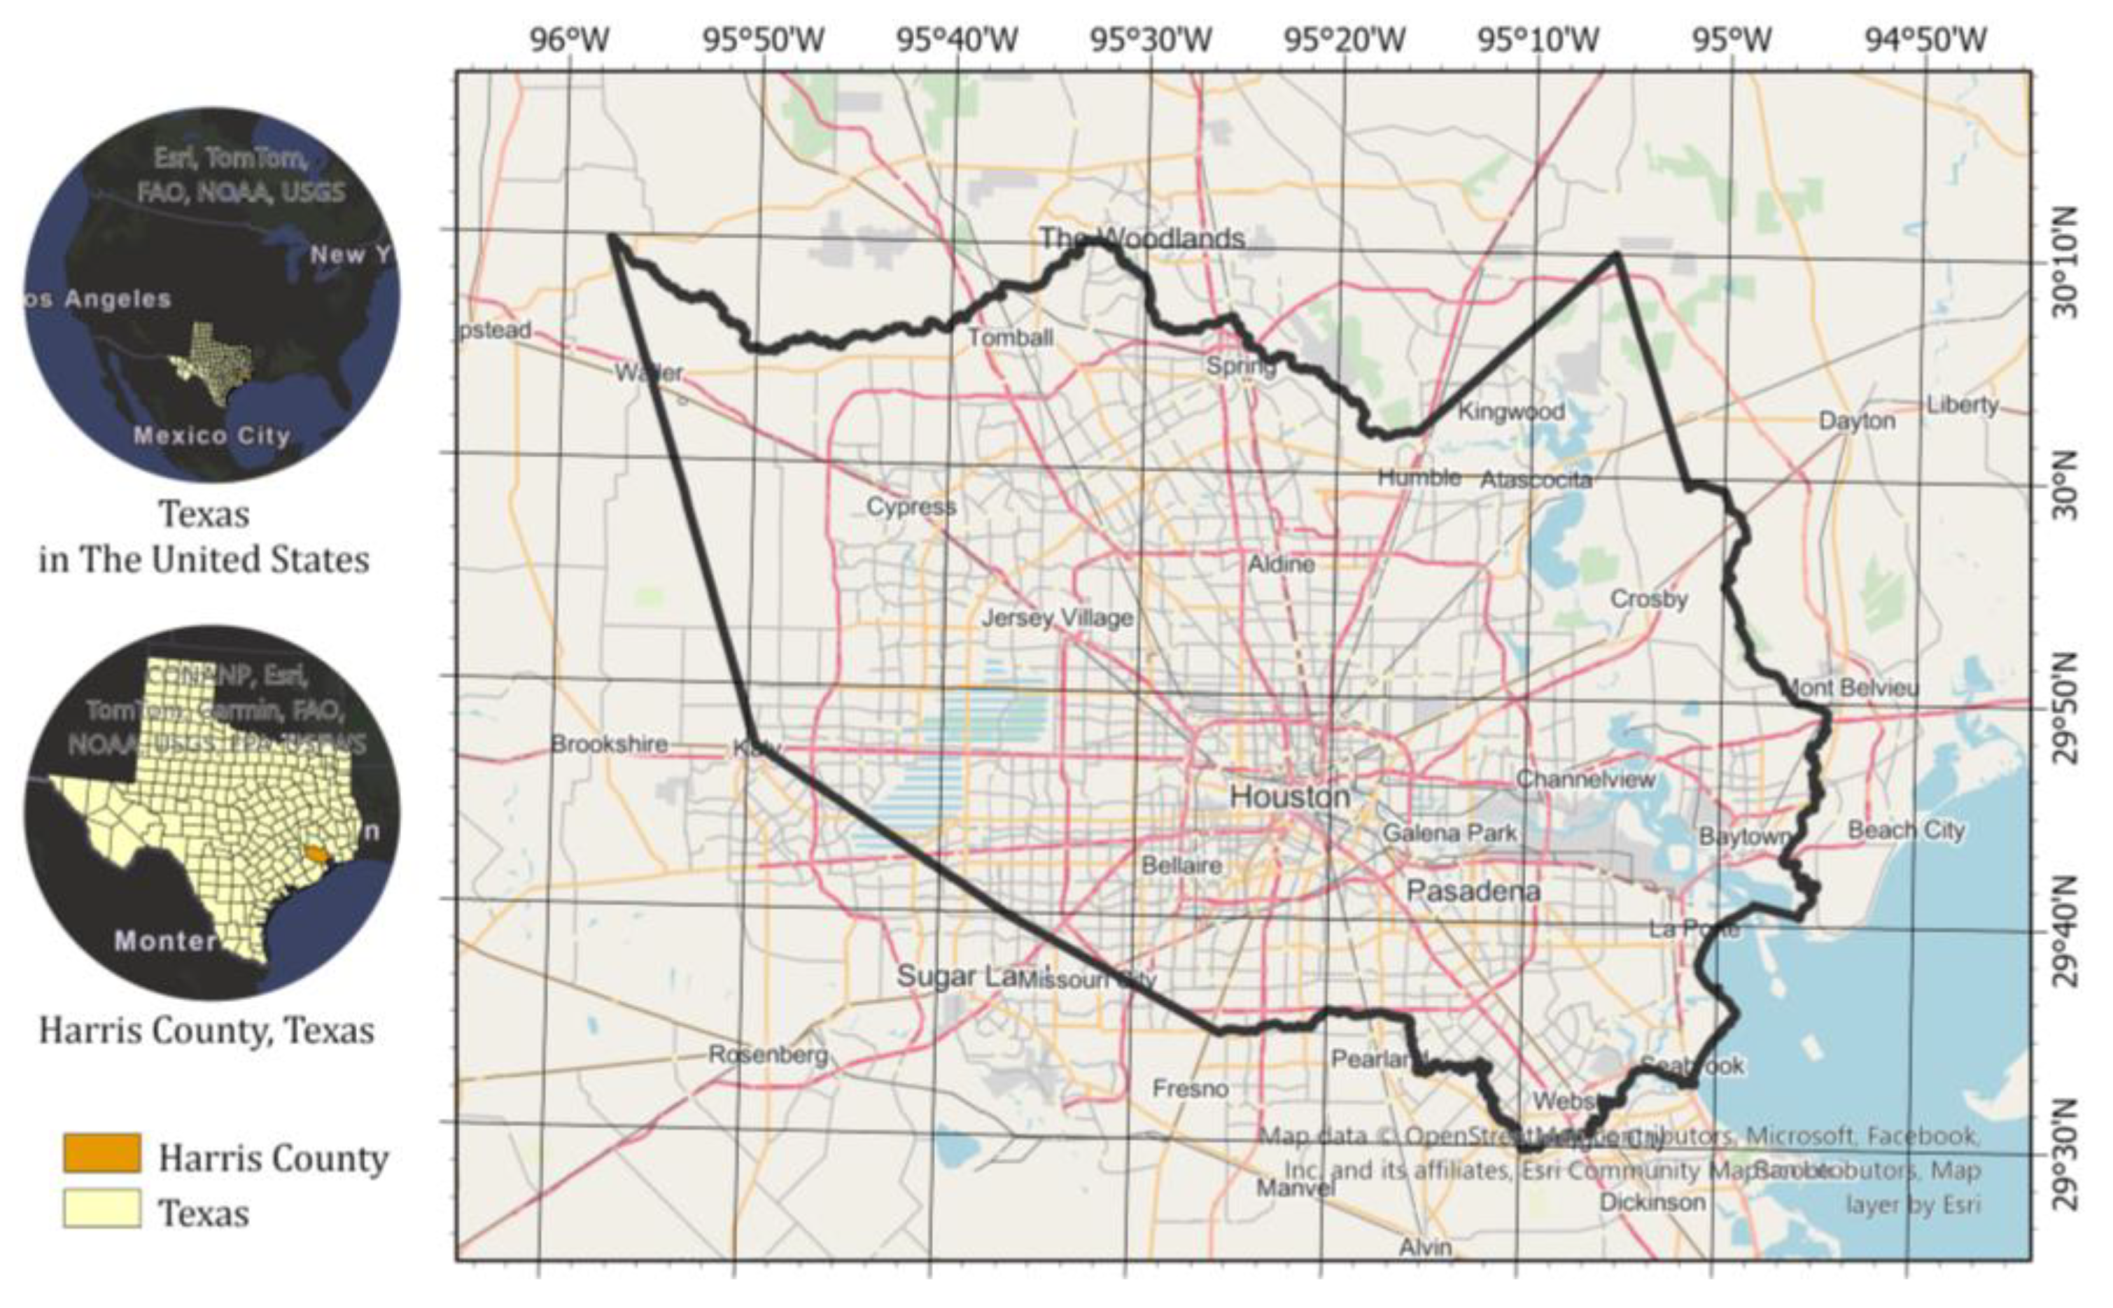
3. Data with the Study Area

This study conducted a statistical analysis using the dataset collected from multiple sources, including population data from the Census Bureau, employment data from Data Axle, and a variety of GIS datasets. To examine the attributes associated with a bike-sharing station and the usage patterns of its clientele, this study tailored the datasets to specific buffer sizes of 0.25- and 0.5-mile distances in Houston, which were specifically designed for this analysis. Figure 1 represents its geographical location.

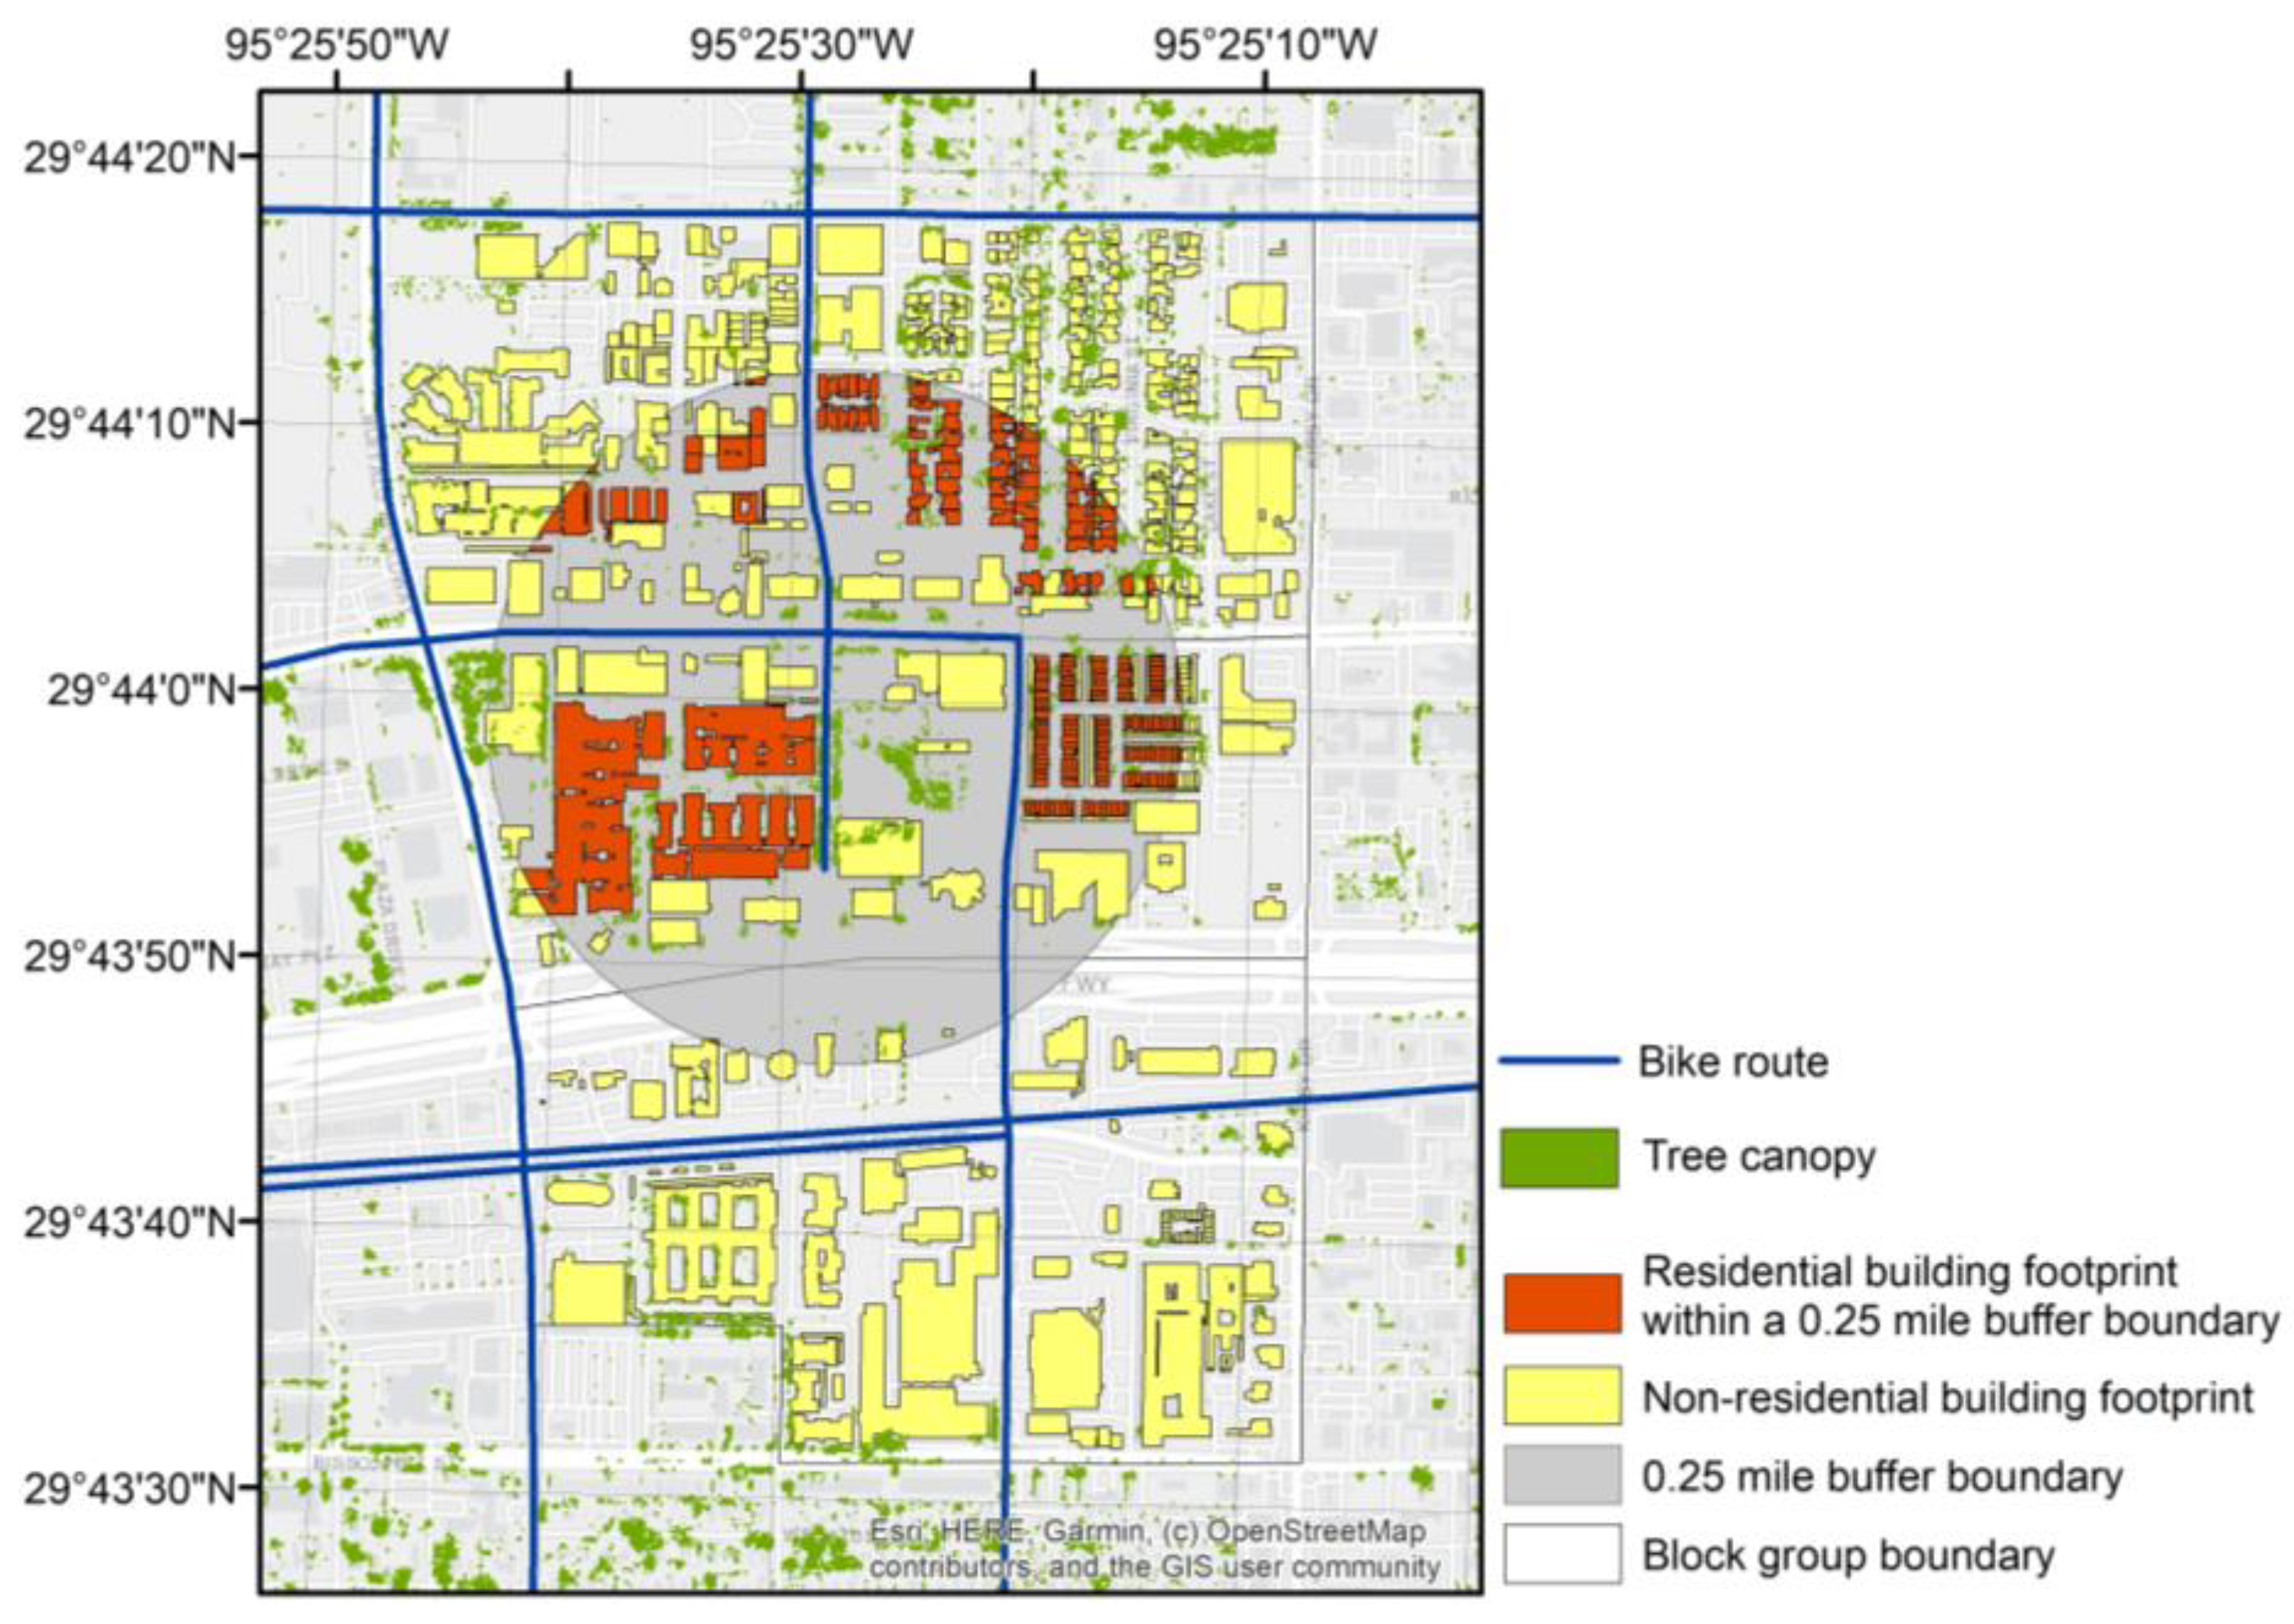
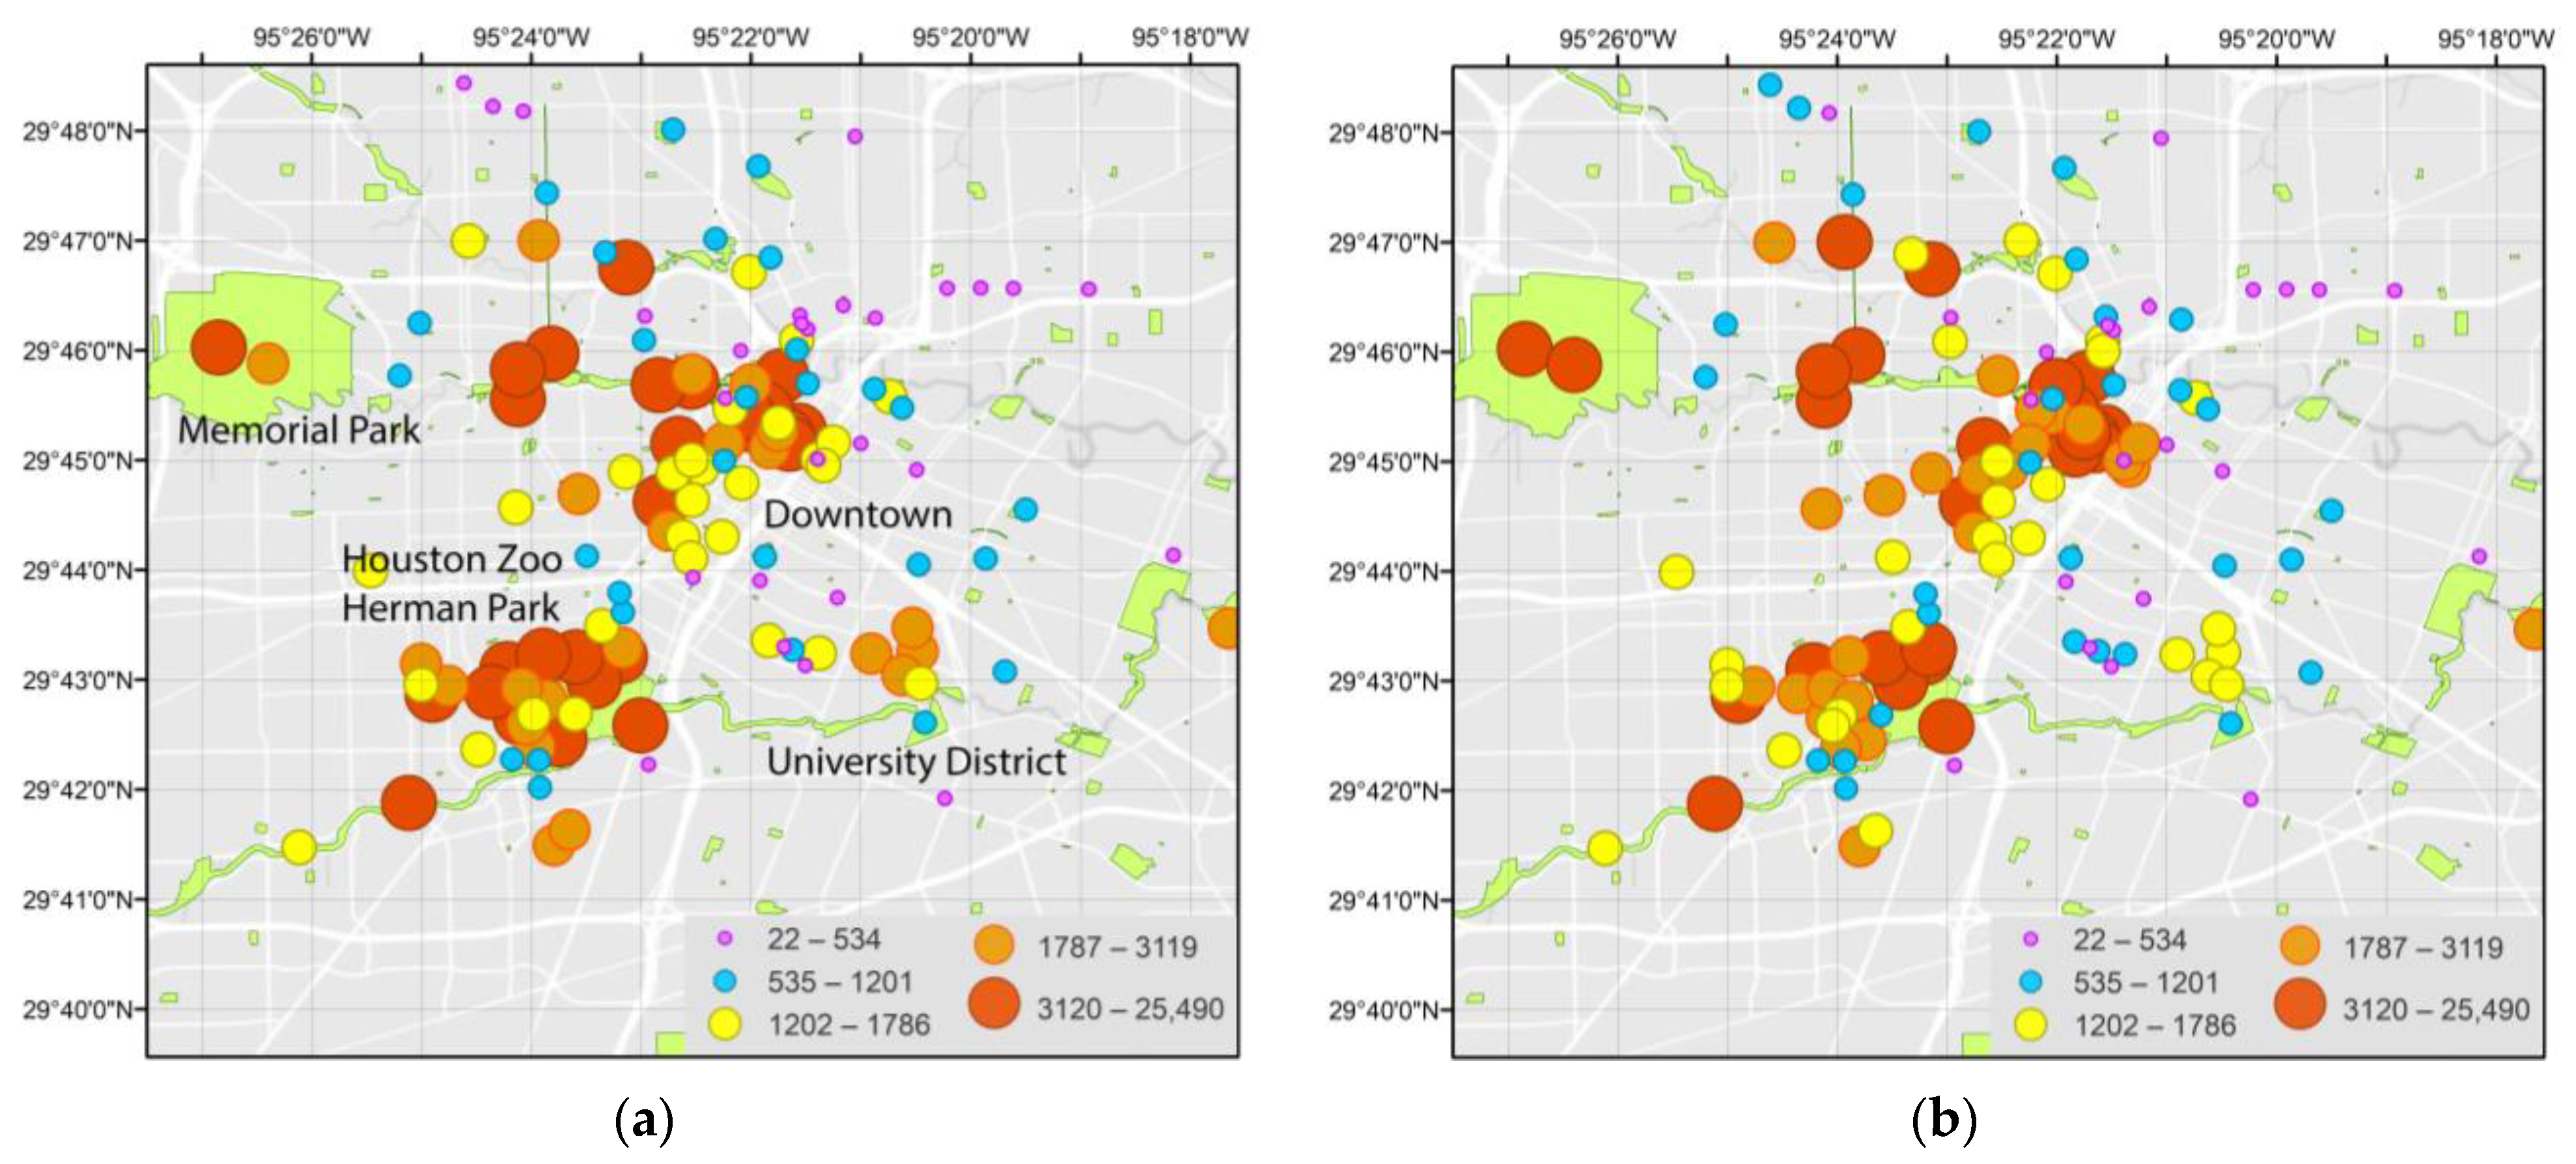
3.1. The 0.25- and 0.5-Mile Buffer Zones

To analyze the environmental factors surrounding each bike station, this study employed two different buffer sizes from each station: 0.25- and 0.5-mile distances. The variables within these buffers served different research objectives.
A 0.25-mile distance is commonly utilized as a measure of walkability and pedestrian access. This distance equates to approximately 400 m, which is considered a reasonable walking distance for individuals. It also serves as a standard for assessing the proximity of amenities like parks, schools, public transportation, and other easily accessible destinations by foot.
On the other hand, a 0.5-mile distance, which is influenced by the concept of transit-oriented development (TOD), is employed to establish zones of indifference for public transportation [32]. This distance serves as another benchmark for walking distances. Consequently, these two buffers around each bicycle station were used as spatial units to investigate bike-sharing ridership.

3.2. Variables

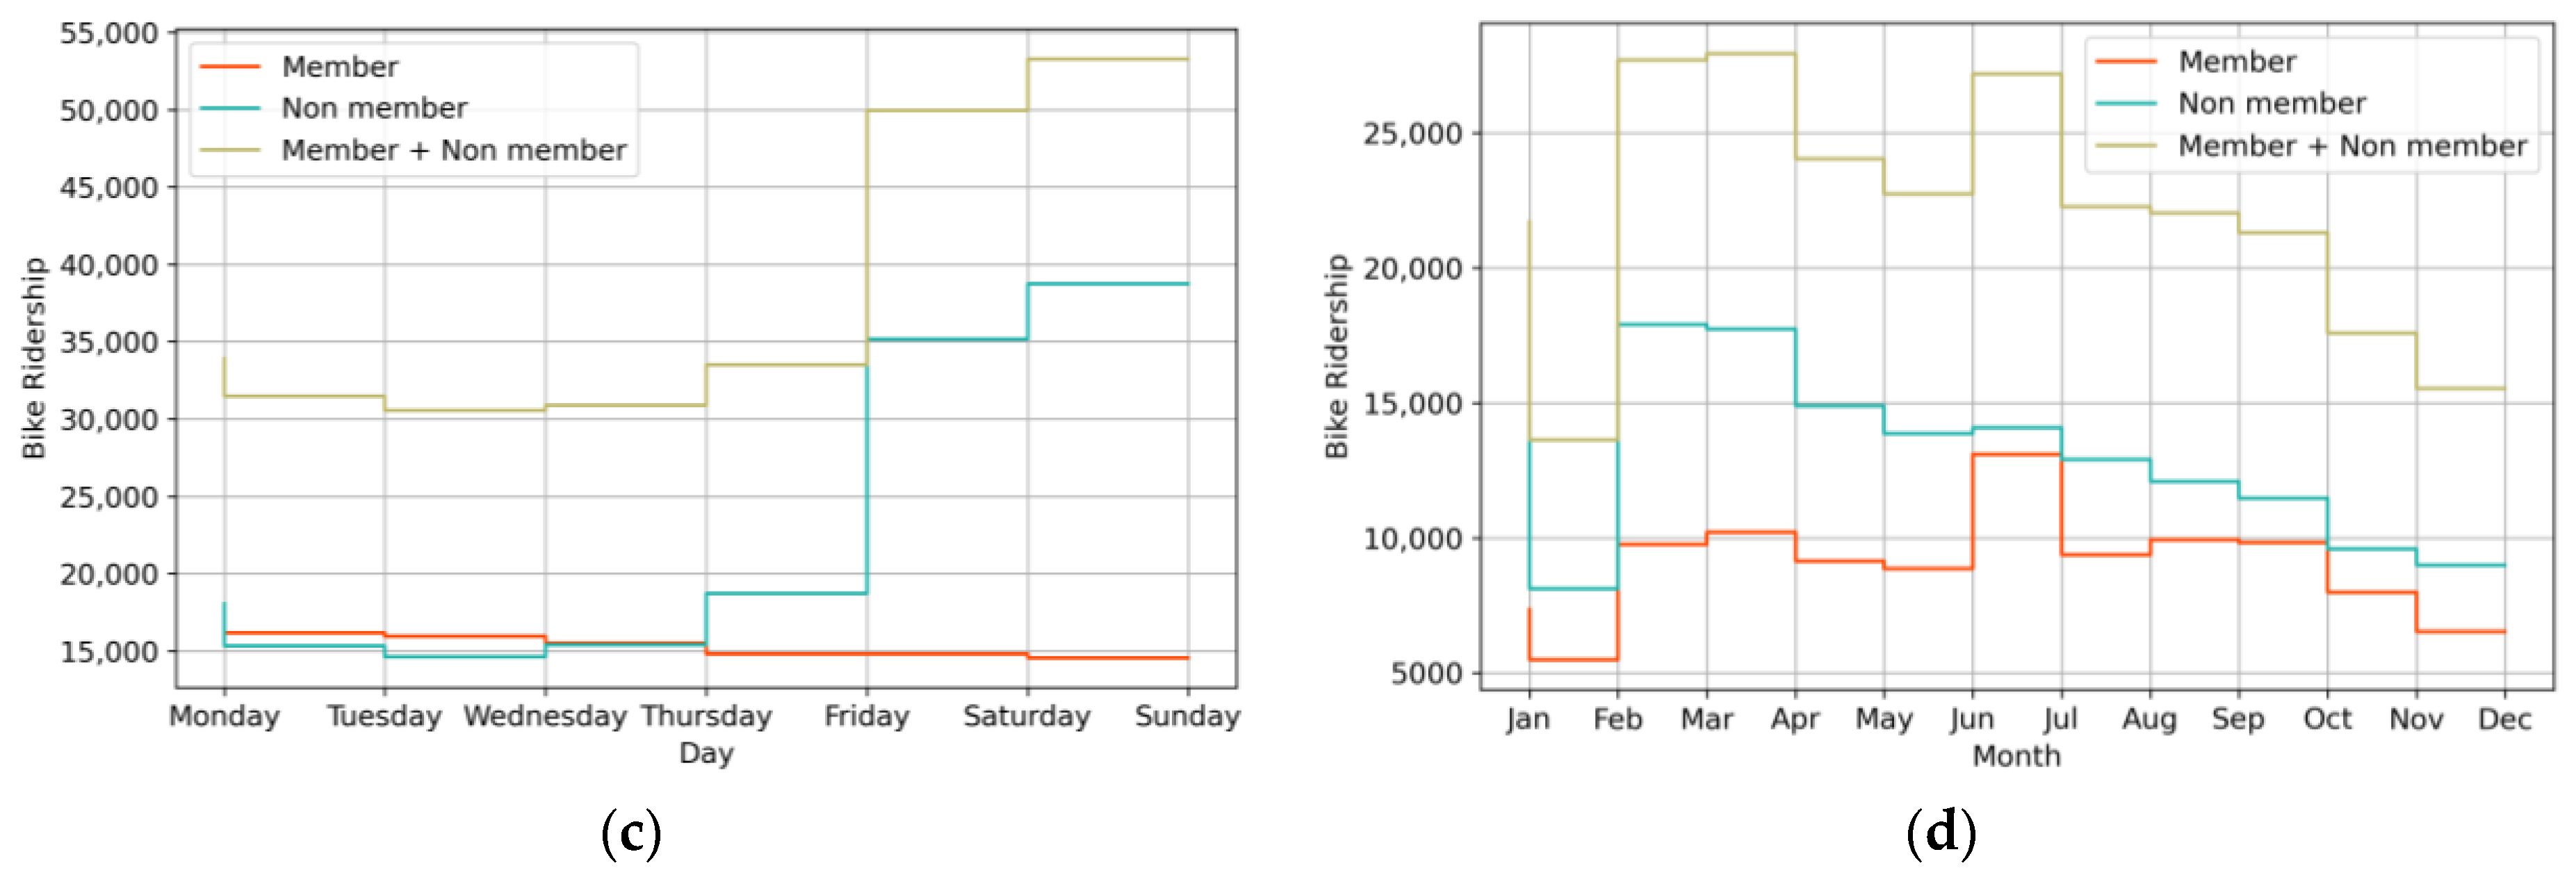
3.2.1. Bike-Share Ridership

Individuals can ride the bicycles of the BCycle Program by either purchasing a membership or opting for single rides through the program’s mobile application or website. On gaining access to the system, users can rent a bike from and return it to any station within the network. In this study, trip records from the 2021 BCycle database were obtained, including station identification and coordinates; check-in and check-out stations and times; trip duration and distance; trip routes; and user types. After clearing the blank and duplicate data, we gathered a total of 278,028 trip records from 144 bicycle stations.
The data are restructured into five different forms. The first form divides ridership into members and non-members and calculates total ridership by time period. The second form divides ridership into weekends and weekdays and calculates ridership by time period. The third form calculates ridership by the day of the week. The fourth form calculates ridership by month. These four data sets were used to conduct a descriptive analysis. Finally, the final form involved calculating the total ridership separately for weekends and weekdays at each station for the purpose of statistical modeling.

3.2.2. Index of Residential Space Use

We hypothesized that there is a positive correlation between population density and ridership rate. To investigate this relationship, we estimated the population count by taking into account the proportion of the building volume classified as residential use, which is referred to as the index of residential space use (RSU). This index helps predict the local population density within a buffer zone surrounding each station.
To build this index, we employed a census population at the block group level with building volume and land-use data. Through the examination of the Geographic Information System (GIS) building footprints—as well as through the utilization of data obtained by Light Detection and Ranging (LiDAR), which is a remote sensing technology—we derived estimates for the volume of each building. Subsequently, we superimposed land use data onto the buildings and identified the existence of residential properties within the buffer zones of 0.25- and 0.5-mile distances. Please refer to Figure 2 for a visual representation of this process.
Next, we calculated the index by employing the ratio of the total volume of buildings within each buffer, whether fully contained within or intersecting with multiple block groups, to the total volumes of residential buildings within the corresponding buffer:
Index   of   residential   space   use = i = 1 n R e s i d e n t i a l   b u i l d i n g   v o l u m e i i n   a   b u f f e r t o t a l   b u i l d i n g   v o l u m e i × P o p o l a t i o n i

3.2.3. Estimated Employment

A bike-sharing program has been proposed as a potential solution for creating a sustainable commuting system within the context of micromobility [33,34]. Thus, we hypothesized that a bike-sharing ridership program would experience increased usage in downtown areas on weekdays as individuals choose cycling for short-distance transportation.
Based on this assumption, we utilized the annual business data provided by DataAxle to estimate the total number of employments within a buffer zone. These data contained various characteristics of the individual local business, along with their geographical coordinates as specified by latitude and longitude. After mapping the locations of all businesses in 2021 using the geocoding module in the GIS domain, this study estimated the total number of employments by aggregating the counts for all business within each buffer area.

3.2.4. Total Length of Bike Lanes

We assumed that an increase in the density of well-connected bikeways will lead to higher bicycle usage. Therefore, the total length of bike lanes designated by the City of Houston was used to examine the demand for bike-share riders at each station. In this study, a variable for the total length of bikeways was created by overlaying the 2022 bikeway data obtained from the City of Houston in each 0.25- and 0.5-mile buffer zone.

3.2.5. Number of Bus Stops

Bike sharing offers a convenient and effective means for individuals residing or working near train stations or public transit stops to access local transportation hubs. In particular, bike sharing can address the challenge of first- and last-mile connectivity by making it easier for individuals to complete the initial and final segments of their journeys to or from public transit stops. It can also reduce reliance on private vehicles while increasing the overall utilization of public transportation. This study employed bus stops as public transit options. Although Houston Metro offers light rail service, its route coverage is limited. On the other hand, Metro bus routes extend to nearly all areas. Therefore, the number of bus stops in each buffer area was used to explain the contribution of bike sharing in addressing first- and last-mile transportation needs.

3.2.6. Estimated Parking Lots

Parking lots near bike stations can enhance first- and last-mile connectivity, which is similar to what was described earlier. They can encourage the use of bike-share systems by providing an alternative transportation option for people who might otherwise be reluctant to walk long distances to reach a bike-share station. This can help increase the adoption of bike-sharing systems and encourage more people to use sustainable modes of transportation. Therefore, the ratio of the area of parking lots within each buffer was used in this study.

3.2.7. Estimate Tree Canopy Coverage

A bike-share program is important not only for sustainable transportation, but also for recreation. It gives individuals access to recreational and cultural opportunities that may have a positive impact on their quality of life. For recreational purposes, well-maintained bike lanes with shaded areas offer an optimal option for recreation with leisurely or vigorous cycling, especially in Houston, Texas. To explain the practical contribution, we estimated tree canopy coverage using LiDAR data and aerial imagery. In this study, tree canopy areas were identified as objects with a height of three meters or more, and this was achieved by integrating the vegetation data extracted from aerial imagery with the height measurements obtained from LiDAR.

3.2.8. Land Use

Land use patterns are closely related to bike-sharing activities [23]. First, bike-sharing activities can provide a valuable amenity for both residents and visitors, thereby granting convenient access to engaging and vibrant urban activities across a variety of locations that encompass commercial, residential, and recreational land uses. We used the land use data provided by Harris County Appraisal District, while excluding the undeveloped and unknown land uses, to gain a previse understanding of the role that the existing land uses play in driving bike-share demand. To do so, the proportion of land use contained within each buffer was calculated and used as a variable.
Table 1 summarizes the descriptive statistics of all the variables extracted in the 0.25- and 0.5-mile buffer zones.

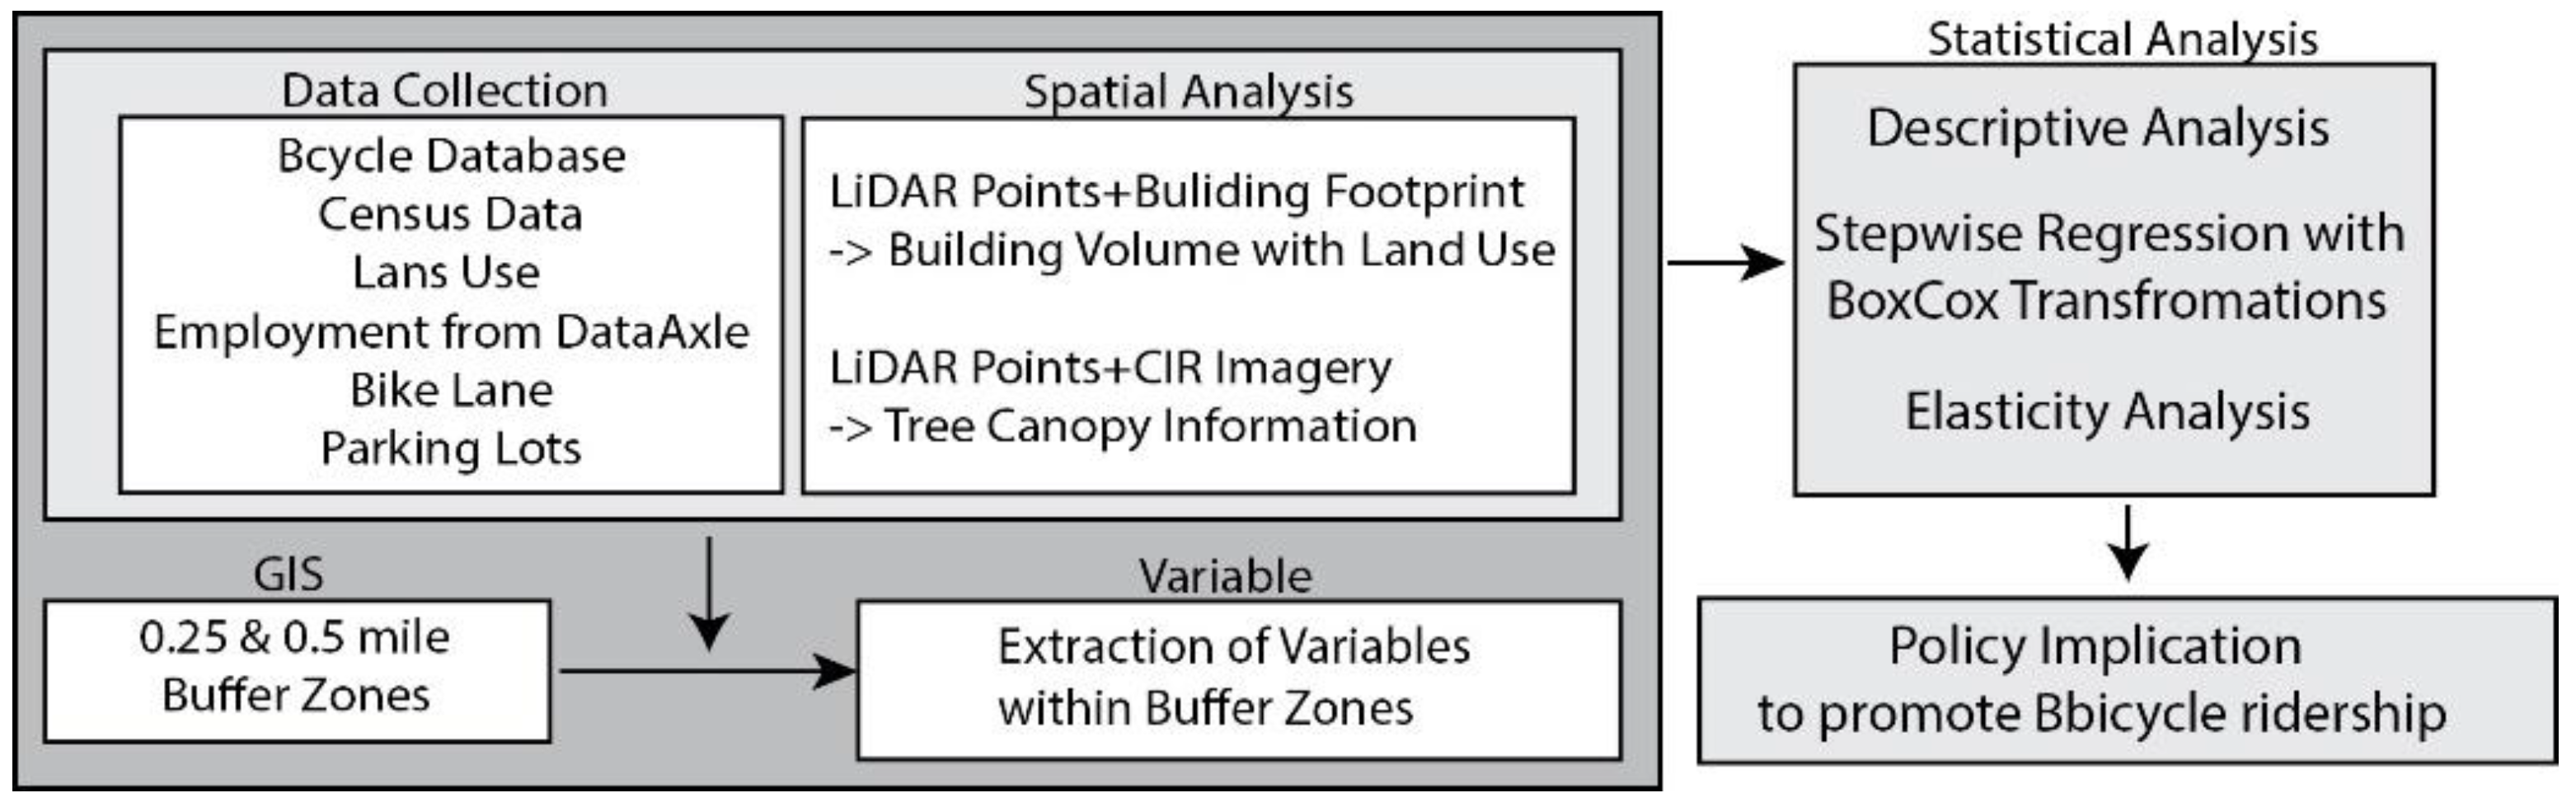
4. Research Methodology

To understand how the demand for bike-sharing ridership at stations changes with respect to membership and time-related variables, this study commenced with a descriptive analysis of the BCycle dataset. Then, we employed backward and forward stepwise regressions to identify the significant features that had a dominant impact on the demand for bike-sharing ridership in Houston. These methods allowed us to explore the relationships, which encompassed linear associations, between the variables and bike demand. Stepwise regression can efficiently facilitate the selection of variables that are most relevant to the number of ridership instances, thereby serving as the dependent variable in a statistical model. This approach allows us to statistically identify significant variables through the process of eliminating insignificant ones from a full model or adding significant ones to improve the model from the null model, even if it requires removing insignificant variables [35].
In relation to the spatial autocorrelation effect of bike-sharing ridership, the Moran’s I value was 0.102 with a p-value of 0.696, indicating that there was no statistically significant spatial correlation.
To develop these statistical models, the two dependent variables, namely the numbers of bike trips during weekdays and weekends, were employed separately in the models owing to their expected differences in travel behavior. In addition, Box–Cox transformation was adopted to convert the skewed distribution of dependent variables into a normal distribution because the dependent variables involved a right-skewed distributed pattern. Thus, the Box–Cox transformation used in this study helped to stabilize variance and make the data more symmetric, which is often a prerequisite for statistical analyses.
y i ( λ ) = y i λ 1 λ i f λ 0 ln y i i f λ = 0 ,
where λ = 0.0001, which is a transformation parameter.
y i ( λ ) = β 0 + β 1 x 1 + β 2 x 2 + + β n x n + ε ,
where y i ( λ ) = the dependent variable, which is the total number of bike-share ridership instances utilized at a station; β 0   = intercept; β 1 ,   β 2 , ,   β n   = coefficients of the independent variables selected by the stepwise regression process; x 1 ,   x 2 , ,   x n = independent variable; and ε = a residual term.
Figure 3 shows a flowchart that was used to understand a general research procedure from data collection to policy implication.

5. Results

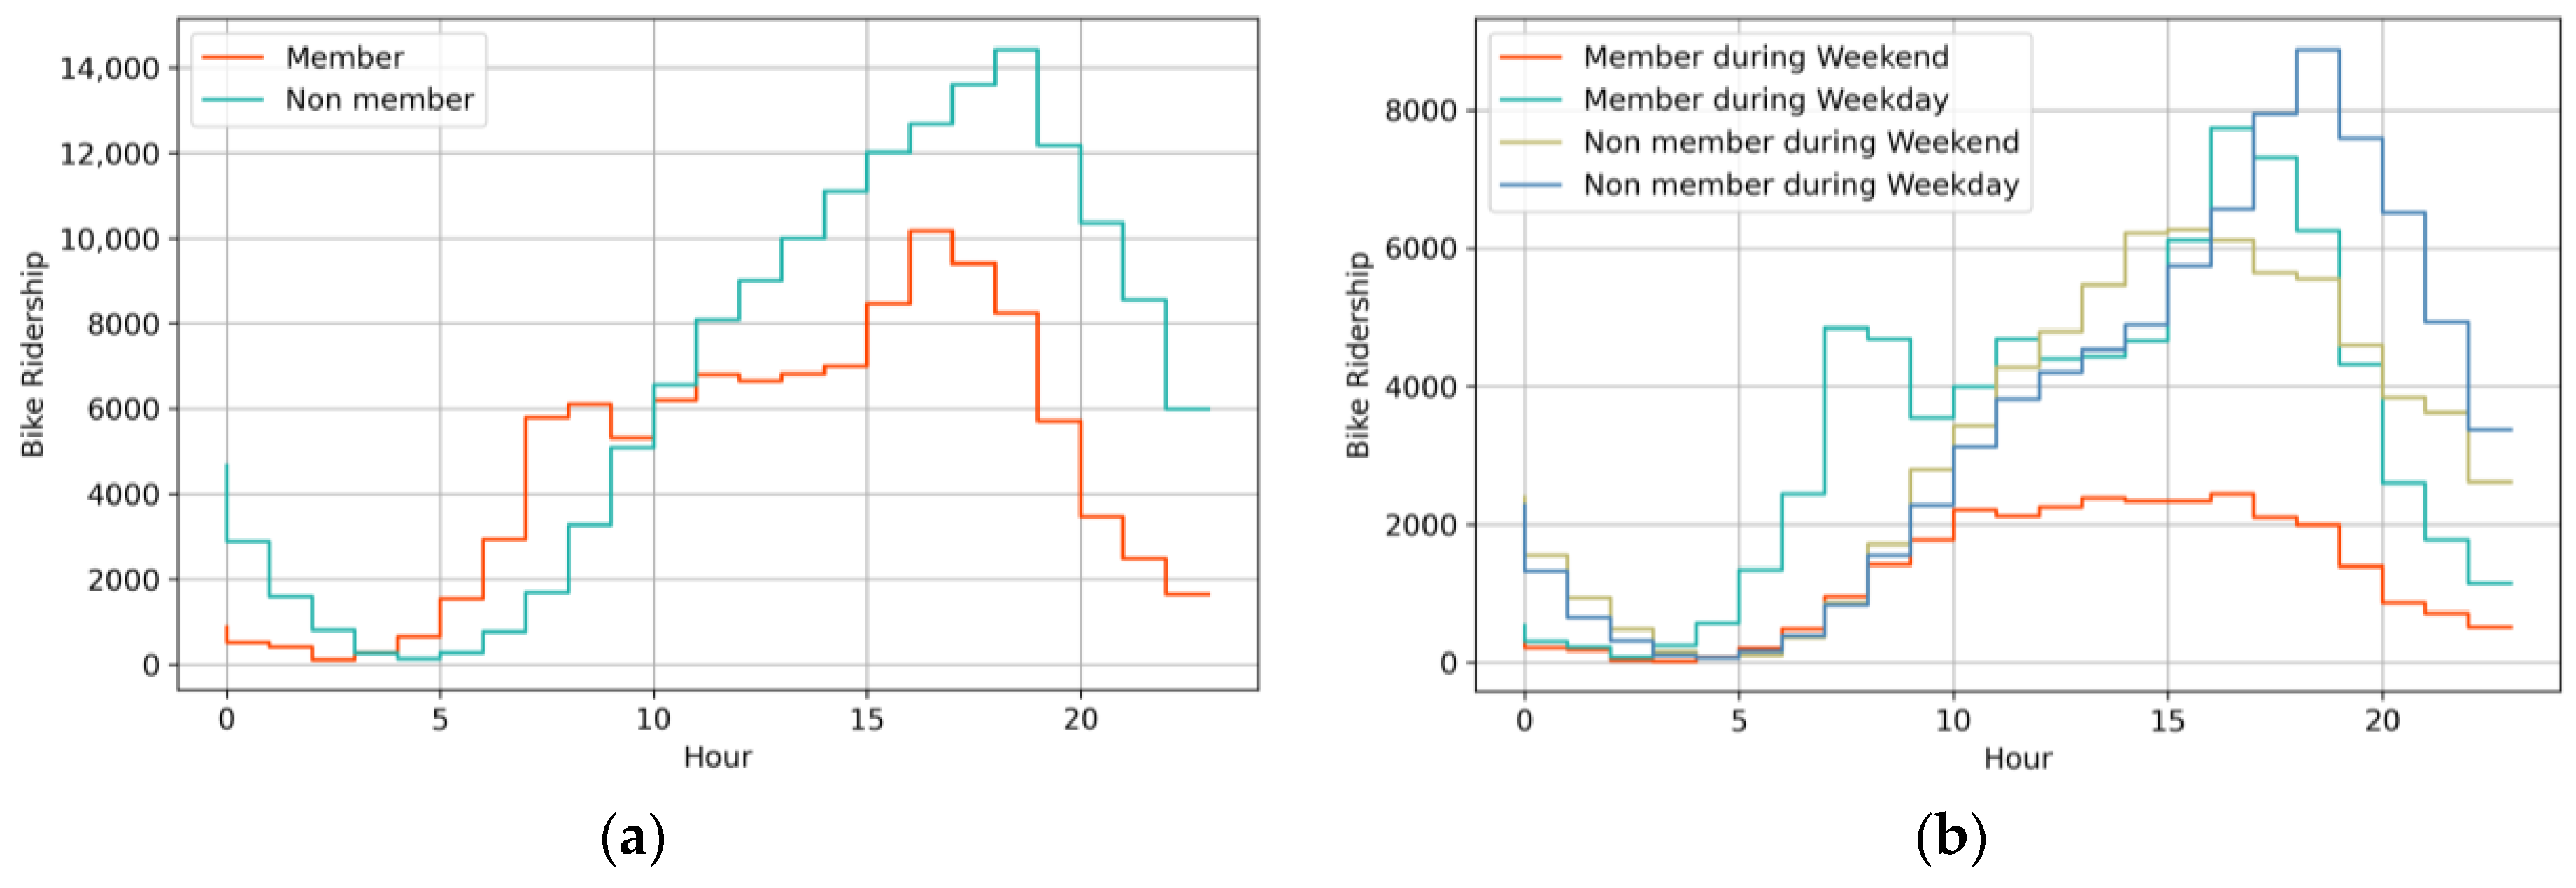
5.1. Descriptive Analysis

Figure 3 presents the temporal patterns of the bike-sharing trip instances. First of all, about 60% of the trips were taken by individuals who opted for one-time rides through the bike-sharing service, whereas those with monthly or yearly subscriptions accounted for approximately 40% of the total trips.
Based on the information presented in Figure 4a, a decline was observed in the volume of trips between the evening and early morning periods, which was in line with our expectations. Moreover, there was a notable surge in bike rentals by registered members by around 9 am, suggesting that the service may be increasingly utilized for commuting or morning recreational activities. Subsequently, the number of non-member ridership instances experienced a rapid and continuous rise, thereby surpassing the rate of member rentals and reaching its peak at 7 pm.
Figure 4b shows the clear usage distinctions between bike-share members and non-members. Members tended to utilize the service more prominently during weekday mornings and evenings, with reduced usage during weekends. In contrast, non-members exhibited a more consistent service usage pattern, one that was characterized by significant activity during weekday afternoons and weekends, where the peak was reached between 3 pm and 7 pm on weekends and from 6 pm to 8 pm on weekdays.
Furthermore, Figure 4c sheds light on the preferences of the non-members, thereby emphasizing their inclination toward weekend usage. This group accounted for a substantial portion of the total weekend trips, amounting to 71%, and it also made up 28% of the overall trips, which encompassed both weekdays and weekends.
Lastly, Figure 4d highlights that non-members favored the spring season, with the highest number of trips occurring in March and April. However, the ridership of bike sharing by non-members decreased after May, likely due to the hot weather conditions in Houston. The ridership of members remained relatively constant, except for July, which may require further investigation.
Figure 5 illustrates the spatial distribution of the bike-share ridership at stations within the Houston Beltway. It indicates that the spatial distribution of bike-share ridership exhibited similar patterns between weekdays and weekends, except for in the university district. It is evident that there was a high concentration of ridership in downtown areas and parks. However, the university district experienced more ridership during weekdays than on weekends. This suggests that there is a higher level of activity in the university district on weekdays as opposed to weekends. However, during summer and winter breaks, it is expected that the number of users will decrease significantly.

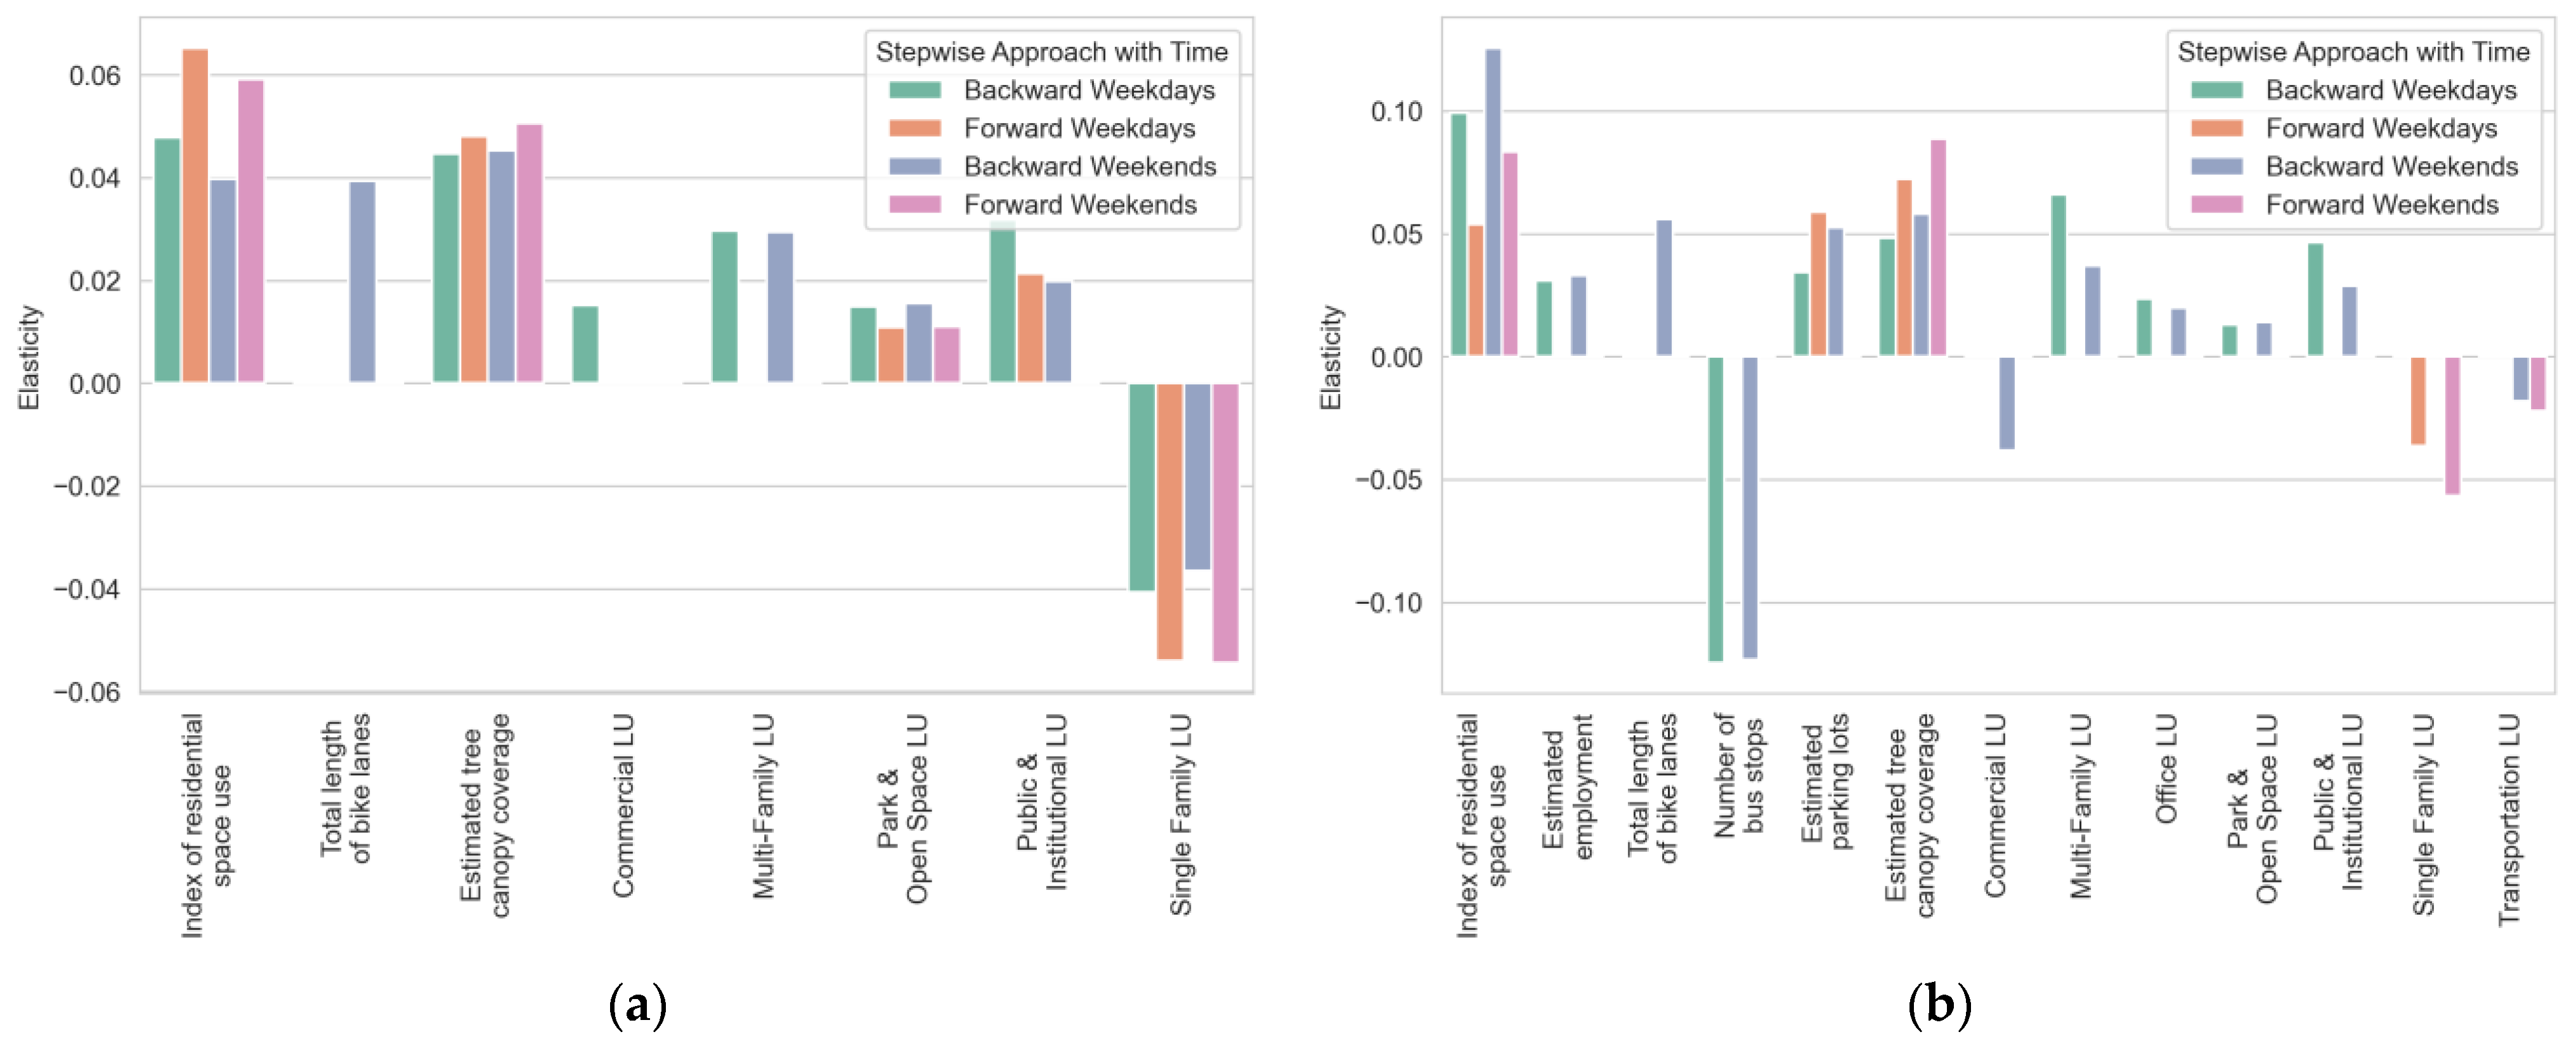
5.2. Statistical Results

Table 2 and Table 3 offer concise summaries of the statistical results derived from the stepwise regressions for both the 0.25-mile and 0.5-mile buffer analyses. As for R2s, there was an insignificant difference between weekends and weekdays. However, we observed a slight variation, which was influenced by the choice of stepwise regression, as well as the buffer sizes (particularly the 0.25-mile and 0.5-mile options).
One consistent and statistically significant variable that explained bike-sharing ridership across all models was the estimated tree canopy coverage. This variable emerged as a key factor driving high bike-share demand in all models, and this was regardless of whether it was a weekday or weekend. This implies that the natural surroundings, which are characterized by the presence of a tree canopy, shape user preferences near bike-sharing stations. Tree canopies were presumed to create a cooler and more pleasant environment through offering shaded areas that are more likely to attract people for recreational activities. Population defined by the index of residential space use (RSU) consistently emerged as a significant variable in all models when explaining the bike-sharing demand. This finding reinforced the idea that higher population levels correlate with greater demand for bike-sharing ridership.
For the stepwise regressions, the variance inflation factor (VIF) values for all variables were within an acceptable range, specifically less than 4 [36].
In the 0.25-mile buffer analysis, both open-space and single-family land uses were found to be statistically significant at the 99% confidence level for both weekdays and weekends. The coefficients associated with open-space land use were positively related to bike-sharing ridership, thereby aligning with the impact of estimated tree canopy coverage. While single-family land use demonstrated a negative impact on ridership, multi-family land use, although achieving statistical significance at the 90% confidence level in the backward model, aligned with previous findings of a positive correlation with the index of RSU. In the context of a 0.25-mile buffer analysis, the stepwise regressions indicated that individuals tended to prefer the areas with high population density, abundant open spaces, and a dense tree canopy when utilizing bike-sharing services.
Expanding the analysis to include a broader 0.5-mile buffer area showed the significance of variables that remained undetected in the 0.25-mile buffer analysis. Variables such as estimated employment, bus stops, parking lots, and office land use emerged as significant within the 0.5-mile buffer area, whereas, in the 0.25-mile buffer analysis, single-family land use was the only significant variable in the forward model. This variance in results can be attributed to the broader geographical scope that was encompassed by the 0.5-mile buffer, which allowed it to capture the influence of a wider array of urban factors surrounding the bike-sharing stations.
In addition, the 0.5-mile analysis uncovered that an increase in estimated employment and a decrease in the number of the bus stops were statistically significant factors contributing to increased bike-sharing demand on both weekdays and weekends. This implied that higher employment density, when coupled with limited access to public transportation, results in higher bike-sharing usage. Furthermore, office and multi-family land uses exhibited notable effects on weekdays, whereas parking lots and the total length of bike lanes had a significant impact on weekends. On weekdays, it appeared that areas with high population mobility experienced more bike-sharing ridership. Conversely, on weekends, individuals were more likely to park around bike stations for leisure and then utilize bike-sharing services. Despite minor variations, it was evident that urban environmental factors affect bike-sharing demand in varying ways between weekdays and weekends, with more noticeable distinctions observed in the 0.5-mile buffer analysis.
For further analysis, Figure 6 shows the elasticity values of the variables identified through stepwise regression. At both the 0.25-mile and 0.5-mile buffers, single-family land use, the RSU index, and tree canopy coverage exhibited relatively high elasticities, thereby suggesting that these urban factors, if strategically incorporated into urban planning, can significantly influence bike-sharing ridership. Furthermore, it supported that, among these, actively enhancing the tree canopy coverage around bike stations demonstrates a practical utility from a local planning perspective in Houston.

6. Discussion

In cities with a strong car-centric culture such as Houston, the promotion of bike sharing can lead to significant positive effects in the development of a sustainable environment. The existing bike-sharing system in Houston is facing a period of stagnation as a result of funding limitations and various maintenance challenges. This situation may be partly attributed to Houston’s transportation infrastructure, hot weather conditions, and insufficient infrastructure and support for the bike-sharing system. Thus, this study aims to tackle these various challenges and fundamentally explore the ways in which to rejuvenate bike sharing in Houston. It also encompasses a statistical analysis of areas with relatively higher ridership and of the underlying reasons, thereby aiming to finding solutions to these challenges.
Based on the results mentioned earlier, this study proposes some potential policy strategies to promote the Houston bike-sharing program. First, by expanding green areas and improving bicycle infrastructure, including the development of bicycle lanes and parking facilities, more favorable outcomes can be anticipated. In addition, the stable number of bike-sharing ridership with memberships suggests an opportunity for enhancing membership programs. Strengthening and promoting ridership membership programs could encourage users to consistently engage in bike-sharing services. For riders without memberships, there is increased ridership during evenings and weekends. Therefore, it might be worthwhile to contemplate strategies that enhance user convenience by supporting bike-sharing operations during these specific periods. Based on the research findings, these policy directions hold promise for improving the urban bike-sharing environment and fostering an increased adoption of cycling as a transportation mode.
Bike-sharing services are a great way to get around town, but it can be frustrating when stations are either completely empty or completely full. This can lead to a poor user experience. Ideally, bike-sharing stations should maintain a balanced occupancy level of around 50%. However, in many cities, operators of bike-sharing systems have to manually transport bikes between full and empty stations, which is slow, expensive, and inefficient.
We might want to consider strategies that enhance the satisfaction of both users and operators regarding this issue.
However, a noteworthy limitation of this study is the potential influence of COVID-19 on the data. Compared to the pre-COVID-19 era, external activities may have declined and new work patterns such as remote work may have emerged, thereby posing challenges when comparing bike-sharing usage between weekends and weekdays. This highlights the importance of exploring modeling with the data from the post-2022 period, which is expected to be less affected by COVID-19. In addition, our analysis was conducted based on the total bike-sharing ridership without distinguishing between check-in and check-out at bike stations. However, around 32% during weekends and about 37% during weekdays exhibited different check-out and check-in locations. This may be influenced by time and determined by surrounding environmental factors. According to statistical analysis, linear models often struggle to clarify these relationships, thereby leading to unexpected effects and issues such as multicollinearity. Non-linear modeling, such as machine learning, may simplify the modeling process by identifying crucial variables for explaining the dependent variable, regardless of the intricate interconnections among variables.
Urban trip modeling and mode choice analysis are ultimately essential in micromobility. As populations rapidly concentrate in cities, various urban issues arise, and the resulting traffic congestion in city centers becomes a cause of diverse social and environmental problems. In particular, travel behavior and mode choice are always critical issues, and modalities such as shared bicycles or e-scooters play significant roles in promoting micromobility. With respect to research related to this, surveys can be conducted directly or indirectly. In this study, we primarily focused on trip generation rather than mode choice as exploring land use and environmental aspects around shared bicycles can be achieved by using only the data related to shared bicycles. This was needed to investigate how modal shifts related to shared bicycles occur in Houston through surveys. Also, while population density was included as a variable in this study, it is important to differentiate by age and gender. Understanding the use of systems such as shared bicycles may vary significantly by age and gender, and these may be closely related to their residential spatial environment and lifestyle. Therefore, additional investigation is also required to further break down the population density for analytical purposes.
Lastly, we utilized only the checkout and return data provided by the city’s shared bicycles, as this was required for the additional qualitative research on travel behavior. Thus, we may need to compare the factors highlighted in previous studies, such as racial preferences and risk perception based on city size, to better understand Houston’s context [37,38].

7. Conclusions

This study investigated the relationship between the local environment and ridership of the bike-sharing system operating in Houston.
Although there was no noteworthy discrepancy in the overall ridership between weekdays and weekends, a spatial analysis revealed relatively lower ridership in the university district during the weekends, as was expected. However, when considering the overall demand for bike-sharing ridership, Saturday and Sunday exhibited higher usage. When looking at the monthly breakdown, the period encompassing the warmer months, from March to May, showed the highest levels of demand. Remarkably, the data used in this study indicated a sudden surge in ridership in July. Further research is considered necessary to gain a better understanding of this phenomenon. The presence of a membership also revealed variations in bike-sharing ridership patterns. The number of riders with membership remained stable over time as no significant fluctuations were exhibited. However, ridership without membership reached peak usage during the evening hours and weekends.
In the statistical modeling involving a range of urban environmental variables within the 0.25-mile and 0.5-mile buffer zones, the stepwise regressions we conducted consistently identified tree canopy coverage as a significant factor influencing bike-sharing ridership. While the significant variables did not exhibit substantial differences based on the methodology such as buffer size, backward, and forward steps, some variations were observed. The backward method using a 0.5-mile buffer zone identified more significant variables compared to the results from the 0.25-mile buffer zone.
This is expected to be valuable for formulating strategies that enhance the activation of the Houston bike-sharing system as it predicts more robust variables compared to linear analysis. Additionally, using the results from linear variables in a supplementary manner could contribute to suggesting a more practical and comprehensive planning strategy.

Author Contributions

Conceptualization, B.C. and Q.P.; methodology, B.C.; software, B.C.; validation, A.N.; formal analysis, B.C.; investigation, A.N.; data curation, A.N. and E.M.; writing—original draft preparation, B.C. and A.N.; writing—review and editing, B.C. and Q.P.; visualization, B.C.; supervision, B.C.; project administration, B.C.; funding acquisition, B.C. and Q.P. All authors have read and agreed to the published version of the manuscript.

Funding

This work was supported by the Cooperative Mobility for Competitive Megaregions (CM2), USDOT University Transportation Center (UTC) (grant number: UTA17-000184 Amendment #5).

Institutional Review Board Statement

Not applicable.

Informed Consent Statement

Not applicable.

Data Availability Statement

The data presented in this study are available on request from the corresponding author.

Conflicts of Interest

The authors declare no conflicts of interest.

Appendix A

Table A1. Summary of the literature highly relevant to this study.
Ref.Study AreaUnit of
Analysis
Variables/DataLand
Use
Transportation InfrastructureTree
Canopy
[1]Houston,
San Antonio, and Austin, Texas
Station/
400 m buffer
Population, housing, non-commuters, renters calculated from
census block data,
employment density,
restaurant density, and
transportation infrastructure
in a 400 m buffer zone
No In a 400 m buffer zoneNo
[3]Boulder,
Colorado
Trip patternTrip duration and timeNo No No
[4]New YorkStation/
250 m buffer
Hourly weather,
time of day, day of the week,
population density calculated from
the census block data,
employment density calculated from zip code data, and
transportation infrastructure
in a 250 m buffer zone
No In a 250 m buffer zoneNo
[5]Phoenix,
Arizona
Trip pattern/
membership
Trip duration, time, origin,
destination, member, or non-member
No No No
[6]Chicago, MichiganStation/
0.8 m, 1.6 m, and
4.8 m buffer zones
Weather data,
socio-demographic data,
at census tract level,
employment and business
at zip code level, and
transportation infrastructure
in 0.8, 1.6, and 4.8 m buffer zones
No In 0.8, 1.6, and 4.8 m buffer zonesNo
[7]Baltimore, MarylandTrip pattern/
membership
Trip duration, time, origin,
destination, member, non-member,
and the sociodemographic data of members
No No No
[8]Brisbane,
Australia
Station/
400 m buffer
Transportation infrastructure
in a 400 m buffer zone,
the topography data of
origins and destinations, and
land use in a 400 m buffer zone
In a 400 m buffer zoneIn a 400 m buffer zoneNo
[9]New YorkStation/
service area
Population and employment
in service areas,
transportation infrastructure
in service areas, and
land use in service areas
In service areasIn service areasNo
[10]Philadelphia, PennsylvaniaStation/
service area
Sociodemographic data
in service areas,
transportation infrastructure
in service areas,
and land use in service areas
In service areasIn service areasNo
[12]Calgary,
Canada
MembershipDemographics, transportation infrastructure, land use
at the community level,
bikeway type, and roadway type
at the segment level
Around members’ addressAround members’ addressNo
[19]Minneapolis–St. Paul
Minnesota
Station/
0.125 mile
and 0.25 mile
buffers
Demographics, employment,
transportation infrastructure data
in a 0.25-mile buffer zone, and
business data in a 0.125-mile buffer zone
No In 0.25-mile buffersNo
[20]Minneapolis–St. Paul,
Minnesota
MembershipDemographics and bike lane length data in the 0.25-mile buffer zones of the members’ addresses,
population, and job
in blocks where members reside
No Around members’ addressNo
[21]Montreal, CanadaStation/
0.25 mile
buffer zones
Weather data,
trip hour and day,
bicycle infrastructure, land use in a 0.25-mile buffer zone,
population density, and job density in a 0.25-mile buffer zone
No In 0.25-mile buffersNo
[22]Barcelona and Seville, SpainStation/
points of
interest
at the sub-city district level
Trip origin, destination,
station refill, removal rate, and
activities (restaurant, business,
recreational, hospital, etc.)
No No No
[23]Nanjing, ChinaStation/
points of
interest in 300 m buffers
Residence, employment, bus stops, metro stations, amenities, and activities (entertainment, restaurant, school, etc.)No In a 300 m buffer zoneNo
[24]Seoul,
South Korea
Station/
service area
Land use, subway stations in service areas,
employment, and population density in service areas
In service areasIn service areasNo
[25]Minneapolis–St. Paul,
Minnesota
MembershipTrip origin, destination,
sociodemographic data of
bike-share members, population density, and transport infrastructure in 400 m buffer zones
around the members’ addresses
No Around members’ addressNo
[26]Houston, TexasStation/
0.25-mile,
0.5-mile, and
1-mile buffers
Weather data,
household and employment density, bike lanes, bus stops, light rail stations, schools, street trees, and land use (residential, commercial, park, and institution/education/medical)
In 0.25-mile, 0.5-mile, and 1-mile buffer zonesIn 0.25-mile, 0.5-mile, and 1-mile buffer zonesNo
[33]Seattle,
Los Angeles, Bay Area, Philadelphia, Boston,
Washington D.C.,
Chicago and New York
Trip patternTrip origin and
destination
No No No

References

  1. Alcorn, L.G.; Jiao, J. Bike-Sharing Station Usage and the Surrounding Built Environments in Major Texas Cities. J. Plan. Educ. Res. 2019, 43, 122–135. [Google Scholar] [CrossRef]
  2. Houston BCycle. Available online: https://www.houstonbcycle.com/houston-bstations (accessed on 26 February 2024).
  3. Hu, Y.; Zhang, Y.; Lamb, D.; Zhang, M.; Jia, P. Examining and optimizing the BCycle bike-sharing system—A pilot study in Colorado, US. Appl. Energy 2019, 247, 1–12. [Google Scholar] [CrossRef]
  4. Faghih-Imani, A.; Eluru, N. Incorporating the impact of spatio-temporal interactions on bicycle sharing system demand: A case study of New York CitiBike system J. Transp. Geogr. 2016, 54, 218–227. [Google Scholar] [CrossRef]
  5. Khatri, R.; Cherry, C.R.; Nambisan, S.S.; Han, L.D. Modeling Route Choice of Utilitarian Bikeshare Users with GPS Data. Transp. Res. Rec. 2016, 2587, 141–149. [Google Scholar] [CrossRef]
  6. Hyland, M.; Hong, Z.; de Farias Pinto, H.K.R.; Chen, Y. Hybrid cluster-regression approach to model bikeshare station usage. Transp. Res. Part A Policy Pract. 2018, 115, 71–89. [Google Scholar] [CrossRef]
  7. Nickkar, A.; Banerjee, S.; Chavis, C.; Bhuyan, I.A.; Barnes, P. A spatial-temporal gender and land use analysis of bikeshare ridership: The case study of Baltimore City. City Cult. Soc. 2019, 18, 100291. [Google Scholar] [CrossRef]
  8. Mateo-Babiano, I.; Bean, R.; Corcoran, J.; Pojani, D. How does our natural and built environment affect the use of bicycle sharing? Transp. Res. Part A Policy Pract. 2016, 94, 295–307. [Google Scholar] [CrossRef]
  9. Noland, R.B.; Smart, M.J.; Guo, Z. Bikeshare trip generation in New York City. Transp. Res. Part A Policy Pract. 2016, 94, 164–181. [Google Scholar] [CrossRef]
  10. Caspi, O. Equity implications of electric bikesharing in Philadelphia. GeoJournal 2023, 88, 1559–1617. [Google Scholar] [CrossRef] [PubMed]
  11. Lin, Z.; Fan, W.D. Bicycle ridership using crowdsourced data: Ordered probit model approach. J. Transp. Eng. Part A Syst. 2020, 146, 04020076. [Google Scholar] [CrossRef]
  12. Yang, H.; Bao, Y.; Huo, J.; Hu, S.; Yang, L.; Sun, L. Impact of road features on shared e-scooter trip volume: A study based on multiple membership multilevel model. Travel Behav. Soc. 2022, 28, 204–213. [Google Scholar] [CrossRef]
  13. Ziter, C.D.; Pedersen, E.J.; Kucharik, C.J.; Turner, M.G. Scale-dependent interactions between tree canopy cover and impervious surfaces reduce daytime urban heat during summer. Proc. Natl. Acad. Sci. USA 2019, 116, 7575–7580. [Google Scholar] [CrossRef]
  14. Cai, Y.; Li, C.; Ye, L.; Xiao, L.; Gao, X.; Mo, L.; Zhou, G. Effect of the roadside tree canopy structure and the surrounding on the daytime urban air temperature in summer. Agric. For. Meteorol. 2022, 316, 108850. [Google Scholar] [CrossRef]
  15. Jin, S.; Guo, J.; Wheeler, S.; Kan, L.; Che, S. Evaluation of impacts of trees on PM2.5 dispersion in urban streets. Atmos. Environ. 2014, 99, 277–287. [Google Scholar] [CrossRef]
  16. Ozdemir, H. Mitigation impact of roadside trees on fine particle pollution. Sci. Total Environ. 2019, 659, 1176–1185. [Google Scholar] [CrossRef] [PubMed]
  17. Heesch, K.C.; Giles-Corti, B.; Turrell, G. Cycling for transport and recreation: Associations with the socio-economic, natural and built environment. Health Place 2015, 36, 152–161. [Google Scholar] [CrossRef] [PubMed]
  18. Lusk, A.C.; da Silva Filho, D.F.; Dobbert, L. Pedestrian and cyclist preferences for tree locations by sidewalks and cycle tracks and associated benefits: Worldwide implications from a study in Boston, MA. Cities 2020, 106, 102111. [Google Scholar] [CrossRef]
  19. Wang, X.; Lindsey, G.; Schoner, J.E.; Harrison, A. Modeling bike share station activity: Effects of nearby businesses and jobs on trips to and from stations. J. Urban Plan. Dev. 2016, 1421, 04015001. [Google Scholar] [CrossRef]
  20. Wang, J.; Lindsey, G. Do new bike share stations increase member use: A quasi-experimental study. Transp. Res. Part A Policy Pract. 2019, 121, 1–11. [Google Scholar] [CrossRef]
  21. Faghih-Imani, A.; Eluru, N.; El-Geneidy, A.M.; Rabbat, M.; Haq, U. How land-use and urban form impact bicycle flows: Evidence from the bicycle-sharing system (BIXI) in Montreal. J. Transp. Geogr. 2014, 41, 306–314. [Google Scholar] [CrossRef]
  22. Faghih-Imani, A.; Hampshire, R.; Marla, L.; Eluru, N. An empirical analysis of bike sharing usage and rebalancing: Evidence from Barcelona and Seville. Transp. Res. Part A Policy Pract. 2017, 97, 177–191. [Google Scholar] [CrossRef]
  23. Zhao, D.; Ong, G.P.; Wang, W.; Zhou, W. Estimating public bicycle trip characteristics with consideration of built environment data. Sustainability 2021, 13, 500. [Google Scholar] [CrossRef]
  24. Lee, S.; Noland, R.B. Bikeshare trips in Seoul, South Korea. Case Stud. Transp. Policy 2021, 9, 743–755. [Google Scholar] [CrossRef]
  25. Schoner, J.; Lindsey, G.; Levinson, D. Is Bikesharing Contagious? Modeling Its Effects on System Membership and General Population Cycling. Transp. Res. Rec. 2016, 2587, 125–132. [Google Scholar] [CrossRef]
  26. Azimi, M.; Lan, L.; Rahman, M.S.L.; Qi, Y. Investigating the Impact of Different Attributes on Bicycling Mode Share as a Multimodal Connectivity Strategy in Large Cities: A Case Study in Houston (No. 2018 Project 15); University of North Carolina at Charlotte, Center for Advanced Multimodal Mobility Solutions and Education: Charlotte, NC, USA, 2019. [Google Scholar]
  27. Ma, X.; Yuan, Y.; Oort, N.; Hoogendoorn, S. Bike-sharing systems’ impact on model shift: A case study in Delft, the Netherlands. J. Clean. Prod. 2020, 259, 120846. [Google Scholar] [CrossRef]
  28. Yang, L.; Shen, Q.; Li, Z. Comparing travel mode and trip chain choices between holidays and weekdays. Transp. Res. Part A 2016, 91, 273–285. [Google Scholar] [CrossRef]
  29. Shaheen, S.; Martin, E.; Cohen, A. Public bikesharing and modal shift behavior: A comparative study of early bikesharing systems in north America. Int. J. Transp. 2013, 1, 35–54. [Google Scholar] [CrossRef]
  30. Shaheen, S.; Martin, E.; Chan, N.; Cohen, A.; Pogodzinski, M. Public Bikesharing in North America during a Period of Rapid Expansion: Understanding Business Models, Industry Trends & User Impacts. MTI Report 12-29; Mineta Transportation Institute Publications: San Jose, CA, USA, 2014. [Google Scholar]
  31. Daniel, F.; Gauvin, L.; Kestens, Y. The potential modal shift and health benefits of implementing a public bicycle share program in Montreal, Canada. Int. J. Behav. Nutr. Phys. Act. 2013, 10, 66. [Google Scholar]
  32. Cervero, R. Transit-oriented development’s ridership bonus: A product of self-selection and public policies. Environ. Plan. A 2007, 39, 2068–2085. [Google Scholar] [CrossRef]
  33. Kou, Z.; Cai, H. Understanding bike sharing travel patterns: An analysis of trip data from eight cities. Phys. A Stat. Mech. Its Appl. 2019, 515, 785–797. [Google Scholar] [CrossRef]
  34. Ma, X.; Ji, Y.; Yuan, Y.; Van Oort, N.; Jin, Y.; Hoogendoorn, S. A comparison in travel patterns and determinants of user demand between docked and dockless bike-sharing systems using multi-sourced data. Transp. Res. Part A Policy Pract. 2020, 139, 148–173. [Google Scholar] [CrossRef]
  35. Liu, B.; Zhao, Q.; Jin, Y.; Shen, J.; Li, C. Application of combined model of stepwise regression analysis and artificial neural network in data calibration of miniature air quality detector. Sci. Rep. 2021, 11, 3247. [Google Scholar] [CrossRef]
  36. García, C.B.; García, J.; López Martín, M.M.; Salmerón, R. Collinearity: Revisiting the variance inflation factor in ridge regression. J. Appl. Stat. 2015, 42, 648–661. [Google Scholar] [CrossRef]
  37. Useche, S.; Alonso, F.; Boyko, A.; Buyvol, P.; Castañeda, I.; Cendales, B.; Cervantes, A.; Echiburu, T.; Faus, M.; Feitosa, Z.; et al. Cross-culturally approaching the cycling behaviour questionnaire (CBQ): Evidence from 19 countries. Transp. Res. Part F Traffic Psychol. Behav. 2022, 91, 386–400. [Google Scholar] [CrossRef]
  38. Useche, S.; Alonso, F.; Boyko, A.; Buyvol, P.; Castañeda, I.; Cendales, B.; Cervantes, A.; Echiburu, T.; Faus, M.; Gene-Morales, J.; et al. Yes, size does matter (for cycling safety)! Comparing behavioral and safety outcomes in S, M, L, and XL cities from 18 countries. J. Transp. Geogr. 2024, 114, 103754. [Google Scholar] [CrossRef]
Figure 1. Study area: Houston, Texas.
Sustainability 16 02569 g001
Figure 2. Buildings for residential use within a 0.25-mile buffer zone.
Sustainability 16 02569 g002
Figure 3. Research flowchart.
Sustainability 16 02569 g003
Figure 4. Temporal variation in the bike-sharing ridership (unit: number of bike ridership instances): (a) member vs. non-member; (b) weekdays vs. weekends; (c) daily variations; and (d) monthly variations.
Sustainability 16 02569 g004aSustainability 16 02569 g004b
Figure 5. Spatial patterns of the bike-sharing ridership: (a) weekdays and (b) weekends.
Sustainability 16 02569 g005
Figure 6. Elasticity values: (a) 0.25-mile buffer analysis and (b) 0.5-mile buffer analysis.
Sustainability 16 02569 g006
Table 1. Descriptive statistics of the variables.
Variable0.25-Mile Buffer Zone
at Bike-Share Stations
0.5-Mile Buffer Zone
at Bike-Share Stations
Unit
MeanCVMin.Max.MeanCVMin.Max.
Index of residential space use1974.050.900.007996.029839.790.690.0029,201.60count
Estimated employment9674.922.340.00111,723.0027,075.961.671.00152,862.00count
Total length of bike lanes1.770.520.005.796.720.500.0023.10mi
Number of bus stops12.780.950.0056.0044.470.730.00150.00count
Estimated parking lots0.011.000.000.050.041.000.000.13%
Estimated tree canopy coverage2699.260.98189.0015,810.0012,288.490.921,599.0054,777.00m2
Commercial LU0.091.110.000.420.090.780.000.42%
Industrial LU0.111.270.000.850.080.880.000.36%
Multi-family LU0.241.210.000.990.290.930.000.96%
Office LU0.042.000.000.440.031.330.000.18%
Park and open-space LU0.053.200.001.000.052.800.000.98%
Public and institutional LU0.181.330.001.000.161.250.000.87%
Single-family LU0.141.210.000.630.181.000.000.69%
Transportation LU0.021.500.000.190.021.000.000.08%
CV = coefficient of variation; LU = land use.
Table 2. Statistical results from the 0.25-mile buffer analysis.
VariableBackwardForward
Box–Cox WeekdayBox–Cox WeekendBox–Cox WeekdayBox–Cox Weekend
Coefficient
(t-Value)
Coefficient
(t-Value)
Coefficient
(t-Value)
Coefficient
(t-Value)
Index of
residential space use
1.73 × 10⁻⁴ **
(2.60)
1.45 × 10⁻⁴ **
(2.03)
2.36 × 10⁻⁴ ***
(4.24)
2.16 × 10⁻⁴ ***
(4.15)
Estimated
employment
Total length
of bike lanes
0.16
(1.48)
Number of
bus stops
Estimated
parking lots
Estimated
tree canopy coverage
1.18 × 10⁻⁴ ***
(3.25)
1.21 × 10⁻⁴ ***
(3.13)
1.27 × 10⁻⁴ ***
(3.59)
1.35 × 10⁻⁴ ***
(3.72)
Commercial LU1.18
(1.32)
Industrial LU
Multi-family LU0.87 *
(1.86)
0.87 *
(1.82)
Office LU
Park and
open-space LU
1.90 ***
(2.94)
2.01 ***
(3.03)
1.39 **
(2.31)
1.42 **
(2.40)
Public and
institutional LU
1.22 *
(2.63)
0.77
(1.61)
0.82 *
(1.96)
Single-family LU−2.01 ***
(−3.28)
−1.82 ***
(−2.85)
−2.67 ***
(−5.17)
−2.71 ***
(−5.05)
Transportation LU
Constant6.12 ***
(21.02)
6.10 ***
(18.94)
6.48 ***
(28.80)
R20.360.350.340.31
RMSE1.001.061.041.01
N144144144144
*** p < 0.01; ** p < 0.05; * p < 0.1; and N = sample size.
Table 3. Statistical results of the 0.5-mile buffer analysis.
VariableBackwardForward
Box–Cox WeekdayBox–Cox WeekendBox–Cox WeekdayBox–Cox Weekend
Coefficient
(t-Value)
Coefficient
(t-Value)
Coefficient
(t-Value)
Coefficient
(t-Value)
Index of
residential space use
0.72 × 10⁻⁴ ***
(3.12)
0.92 × 10⁻⁴ ***
(3.56)
0.39 × 10⁻⁴ ***
(4.24)
0.61 × 10⁻⁴ ***
(4.20)
Estimated
employment
8.18 × 10⁻⁶ ***
(2.64)
8.80 × 10⁻⁶ **
(2.16)
Total length
of bike lanes
0.06 *
(1.67)
Number of
bus stops
−0.02 ***
(−3.35)
−0.02 ***
(−3.73)
Estimated
parking lots
5.41
(1.45)
8.39 *
(1.90)
9.31 ***
(2.75)
Estimated
tree canopy coverage
0.28 × 10⁻⁴ ***
(2.60)
0.34 × 10⁻⁴ ***
(3.53)
0.42 × 10⁻⁴ ***
(4.54)
0.52 × 10⁻⁴ ***
(6.28)
Commercial LU −3.21
(−1.56)
Industrial LU
Multi-family LU1.62 ***
(3.62)
0.92
(1.57)
Office LU5.09 *
(1.86)
4.34
(1.42)
Park and
open-space LU
1.87 **
(2.47)
2.05 **
(2.41)
Public and
institutional LU
2.09 ***
(2.47)
1.31 *
(1.73)
Single-family LU −1.44 **
(−2.49)
−2.26 ***
(−4.53)
Transportation LU −7.72
(−1.65)
−9.41 **
(−2.31)
Constant5.34 ***
(21.51)
5.70 ***
(14.31)
5.95 ***
(19.66)
R20.450.450.360.34
RMSE0.930.980.990.99
N144144144144
*** p < 0.01; ** p < 0.05; * p < 0.1; and N = sample size.
Disclaimer/Publisher’s Note: The statements, opinions and data contained in all publications are solely those of the individual author(s) and contributor(s) and not of MDPI and/or the editor(s). MDPI and/or the editor(s) disclaim responsibility for any injury to people or property resulting from any ideas, methods, instructions or products referred to in the content.

