Article

Exposure to Environmental Pollution in Schools of Puchuncaví, Chile: Characterization of Heavy Metals, Health Risk Assessment, and Effects on Children’s Academic Performance

by
Sonnia Parra
1,
Hanns de la Fuente-Mella
2,
Andrea González-Rojas
3 and
Manuel A. Bravo
1,*
1
Grupo de Quimiometria Aplicada, Laboratorio de Química Analítica y Ambiental, Instituto de Química, Pontificia Universidad Católica de Valparaíso, Avenida Universidad 330, Valparaíso 2340025, Chile
2
Instituto de Estadística, Facultad de Ciencias, Pontificia Universidad Católica de Valparaíso, Valparaíso 2340031, Chile
3
Laboratorio de Neurociencias Aplicadas, Escuela de Kinesiología, Pontificia Universidad Católica de Valparaíso, Avenida Brasil 2950, Valparaíso 2340025, Chile
*
Author to whom correspondence should be addressed.
Sustainability 2024, 16(6), 2518; https://doi.org/10.3390/su16062518
Submission received: 30 January 2024 / Revised: 13 March 2024 / Accepted: 14 March 2024 / Published: 19 March 2024
(This article belongs to the Section Health, Well-Being and Sustainability)

Abstract

In Chile, Puchuncaví and Quintero face substantial environmental pollution challenges. Industrial and vehicular emissions expose schoolchildren to elevated levels of pollutants, decreasing sustainability and posing risks to both their health and educational advancement. The aim of this study is to determine the distribution of heavy metals (Li, Be, V, Cr, Mn, Co, Ni, Zn, As, Se, Sr, Mo, Cd, Sb, Tl, Pb, and Cu) in the dust in and around the schools in these cities. We also evaluate the associated carcinogenic and non-carcinogenic risks, as well as whether their concentrations affect the academic performance (AP) of the students. The chemical composition of the collected dust samples is analyzed using positive matrix factorization, and two interpretable factors related to two sources of contamination (industrial and traffic + crustal) are determined. The health risk is assessed using a model including inhalation, dermal contact, and ingestion, and the influence of metal concentration on the AP of students is determined using an econometric model. The metal concentration is found to be related to the distance to the pollution source, and differences are observed between indoor and outdoor samples. The carcinogenic risk is low, while the non-carcinogenic risk is high in Greda School. The levels of heavy metals inside and outside the schools are found to influence AP. In these cities, children are exposed to high levels of environmental pollution, which may pose a risk to their health and impact their AP.

1. Introduction

Urban environments have high population densities and are therefore strongly influenced by anthropogenic activities. These activities create high levels of environmental pollutants [1], which are subsequently transported into the atmosphere or towards the Earth’s surface in both particulate and vapor phases [2]. The particulates may contain heavy metals derived from different sources in urbanized areas, including vehicular emissions, industrial discharges, and other activities [3].
Particulate matter denotes particles with size ranging from 1 to 10,000 μm, referred to as dust, which are mostly susceptible to traveling long distances [4]. Dust is a well-known matrix and is frequently the focus of environmental and human exposure studies. Dust contaminated with heavy metals has drawn public attention due to its high toxicity, persistence, and bioaccumulation [5]. Additionally, dust particles containing heavy metals—particularly fine particles—can be re-suspended in the atmosphere or consumed by humans through ingestion, inhalation, and dermal adsorption [6]. Exposure to environmental pollutants results from urban environments fostering economic advancement without always guaranteeing the sustainable development of communities, thus posing potential risks to nearby ecosystems, environmental quality, and public health. The diminished sustainability resulting from environmental pollution threatens the balance between economic growth, environmental conservation, and social well-being, thereby jeopardizing the health and quality of life of the population.
In this regard, highly concentrated pollutants affect the health of children, especially schoolchildren who spend much of their time indoors. Therefore, it is crucial to assess potentially toxic metal(loid)s in sensitive environments such as school classrooms [7]. The air quality inside schools is a growing concern and has a significant health impact, possibly posing a greater risk than outdoor pollution [8]. Inside schools, dust can contain various contaminants and trace metals that can be transported into classrooms and affect schoolchildren who spend time in playgrounds, in gardens, and in nearby homes [9].
Such pollution is relevant for populations of children, who are more susceptible to the adverse effects of pollution due to their still-developing respiratory and immune systems, lower body mass index, and respiratory patterns, causing pollutants to become more concentrated in their systems [10]. Additionally, children are likely to ingest significant quantities of dust as they commonly put non-food objects in their mouth and repetitively suck on their hands and fingers, leading to a much higher absorption rate of heavy metals [11]. Therefore, the pollutants that enter and deposit in the environment of a classroom could provide an indirect measurement of air pollution. It is crucial to identify and quantify pollution sources to determine potential health risks for school populations [12].
Considering that childhood is a critical period for children’s development, exposure to environmental pollutants can affect their respiratory, cardiovascular, and cognitive health, which could impact their neurodevelopment and, consequently, their learning ability [13]. In this regard, some studies have shown that children exposed to air pollution achieved lower results in neurobehavioral tests [14], exhibited structural impairment of neurological function [15], and had lower intelligence quotient (IQ) scores compared to non-exposed children [16]. Additionally, children exposed to elevated levels of nitrogen dioxide have lower scores in quantitative, working memory, and gross motor skills areas, indicating lower performance in neurobehavioral tests [17]. Additionally, children exposed to high levels of black carbon had lower verbal and non-verbal intelligence and diminished scores in memory assessments [16].
It is known that learning—and, consequently, academic performance—in children depends on their cognitive functions [18], which could be affected through exposure to environmental pollution. Some research has identified that exposure to traffic-related air pollution is linked to cognitive function and, therefore, to the academic performance of children [19]. Additionally, children with low socioeconomic status (SES), as well as those belonging to ethnic minorities, may exhibit decreased cognitive functions in the face of exposure to environmental pollution in schools [20].
In this context, the study of Pastor et al. in 2006 evaluated children from impoverished communities in California exposed to environmental pollution, finding low results in standardized tests of academic performance [21]. Another study, conducted by Moahi et al. in 2011, showed that the majority of children exposed to high levels of air pollution in public schools in Michigan had low performance in state-standardized tests of academic achievement [22]. In Chile, the standardized test System for Measuring the Quality of Education (SIMCE) is administered every year. SIMCE is an assessment tool for learning applied to students across the country [23]. At present, there is no published information on whether environmental pollution can affect the academic performance of Chilean children exposed in the Quintero–Puchuncaví area. This information would be crucial for implementing preventive or mitigating measures, especially considering that this Chilean locality is currently designated as a “sacrifice zone”.
Similar to cities in other developing countries, Puchuncaví and Quintero have many environmental challenges. In Puchuncaví, the Ventanas copper smelter has emitted pollutants (i.e., sulfur dioxide and trace metals) into the atmosphere that could include toxic components which endanger both the environment and the health of school populations. Since the opening of the Ventanas copper smelter in 1964 and until the first environmental regulations in 1991, no measures were taken to mitigate these emissions. Despite the current environmental regulations, the cumulative environmental effects of historical emissions remain latent in the areas surrounding the Ventanas smelter, such as Quintero city, which borders Puchuncaví to the south [24]. Both locations are called “sacrifice zones” as they correspond to geographic areas with high levels of industrial activity, resulting in substantial economic benefits for the country; however, these activities have had a disproportionate environmental impact, leading to ecosystem degradation, reduced quality of life, and increased health risks for the area’s inhabitants, thus diminishing sustainability. In this context, the Ventanas Industrial Complex—the main cause of the high levels of pollutants in the area—generates a significant portion of the energy supply for the central region of Chile, underscoring its status as a crucial strategic asset for the country. Due to the extent of contamination, population size, social mobilization, and significant health effects resulting from past critical events, Quintero and Puchuncaví represent one of the most emblematic sacrifice zones in the country, with the greatest environmental impact [25].
Therefore, exposure to trace elements in Puchuncaví and Quintero could pose a risk to human health, which has been evidenced in several studies [24]. However, no studies have been conducted on exposure to toxic metals in school environments and the associated potential harmful effects on children’s health. Additionally, there are currently no studies indicating whether such exposure can affect academic performance in children. Therefore, the main objective of this research was to determine the distribution of trace metals from various sources present in the dust collected in and around the schools of Puchuncaví and Quintero. As secondary objectives, we determine the potential health risk that exposure to dust (derived from the impact of metals from ultrafine particles that possibly come from the Smelter) poses to schoolchildren through ingestion and dermal pathways, as well as whether the concentrations of these metals could affect their academic performance.

2. Materials and Methods

2.1. Study Area

This study was conducted in the cities of Puchuncaví and Quintero (Chile), which are situated 155 km northwest of Santiago, in the coastal area of Central (from V region). The climate is Mediterranean, with intense winter storms (up to 100–120 mm/d). The study area has been documented to be exposed to environmental pollution from industrial complexes, where emissions of trace elements might include contaminants that pose human health risks.
The most environmentally relevant factories in this area are the CODELCO Division Ventanas copper refinery complex and the AES Gener coal-fired power plant complex. There is a high amount of vehicular traffic in both cities, and their residents use the main access routes to schools daily.
Based on the study goals, we selected schools located at different distances (0.91 to 5.83 km; see Table S1 and Figure S1) from the main industries in Puchuncaví and Quintero, where the vehicular activity during the week due to scholarly activities was greater than that in other locations.

2.2. Sampling and Analysis

The dust samples were collected from different schools (indoors and outdoors) in Quintero and Puchuncaví, Chile (Table S1 and Figure S1). They were collected by two of the authors (S.P. and M.B.) during school hours, specifically between 8 a.m. and 1 p.m. For samples from inside classrooms, collection occurred during student recess periods, ensuring they were not present. Outdoor samples were obtained while students were inside classrooms. Consequently, the researchers responsible for collecting the samples had no contact with the students, either inside or outside the classrooms.
A total of 48 dust samples were collected within the schools and from dust around the schools during the summer and spring of 2019. These samples were collected through sweeping with a clean plastic brush into a clean stainless-steel tray. To prevent cross-contamination, these articles were meticulously cleaned with acetone after each sampling session. Once collected, each sample was stored in a properly labeled polyethylene bag, which was hermetically sealed and then transferred to the laboratory for subsequent analysis by the authors. During the analysis, we subjected the samples to a 72-h room temperature drying process, followed by sieving through a 63 µm nylon sieve to eliminate stones and biological waste.
In the chemical analysis, the dust samples underwent digestion and analysis following the protocol outlined by Tian et al. in 2018 [26]. About 0.05 g of the samples was placed into dry and pristine Teflon vessels for microwave digestion, with the addition of HNO3, HF, and HClO4 (ultra-pure) in a 3:1 ratio.
The dust samples were analyzed for Li, Be, V, Cr, Mn, Co, Ni, Zn, As, Se, Sr, Mo, Cd, Sb, Tl, Pb, and Cu using an iCAP™ RQ ICP-MS system (Thermo Fisher Scientific, Waltham, MA, USA).
In our analyses, calibration was performed using Milli-Q water (Milli-Q Ultra-Pure Water System; Germany), and the corresponding calibration curve was prepared from certified E-Merck standards (Darmstadt; Germany). The reliability of the analytical data was ensured through the preparation of respective standards and blank analyses, triplicate sample analyses, use of suprapur acids, ultrapure water, utilization of a 1000 mg/kg standard (Merck) for calibration curve preparation, and analysis of certified materials (ISE 973). For this substance, all acquired results showed statistical equivalence with certified values (p < 0.05), affirming the robustness of the methodology and the accuracy of the estimated concentrations. All analyses conducted in triplicate had a detection limit set as three times the standard deviation of the mean.

2.3. Evaluation of Health Risks

Utilizing a health risk assessment model [27,28,29], we computed the exposure of schoolchildren to heavy metals present in dust considering three pathways: inhalation, dermal contact, and ingestion. The exposure levels, quantified as daily doses, were individually calculated for each trace metal and each exposure pathway using Equations (1)–(3):
ADD inh = C d u s t × I n h R × E F × E D A T n o n c a r c × B W × P E F
ADD der = C d u s t × S A × A F × A B S × E F × E D × C F A T n o n c a r c × B W
ADD Ing = C d u s t × I n g R × E F × E D × C F A T n o n c a r c × B W × A T c a r c
where
ADDinh = average daily dose associated with inhalation exposure (mg/kg/day),
ADDder = average daily dose associated with dermal contact exposure (mg/kg/day),
ADDing = average daily dose associated with ingestion exposure (mg/kg/day).
For a cancer risk assessment in children, the lifetime average daily dose (mg/kg/day) was calculated for the three potential routes of exposure using Equations (4)–(6) [29]:
LADD inh = C d u s t × I n h R × E F × E D A T c a r c × B W × P E F
LADD der = C d u s t × S A × A F × A B S × E F × E D × C F A T c a r c × B W    
LADD Ing = C d u s t × I n g R × E F × E D × C F A T c a r c × B W
where
LADDinh = lifetime average daily dose associated with inhalation exposure (mg/kg/day);
LADDder = lifetime average daily dose associated with dermal contact exposure (mg/kg/day);
LADDing = lifetime average daily dose associated with ingestion exposure (mg/kg/day).
The exposure factors and parameters used in the assessment were obtained from the US EPA (Table 1).

Risk Characterization

The evaluation of potential health risks (non-carcinogenic and carcinogenic) associated with each heavy metal was carried out using Equations (7)–(9):
H Q = A D D i n h + d e r + i n g R f D
H I = H Q i n h + d e r + i n g
I L T C R = L A D D i n h   ×   C S F i n h
where
HQ = hazard quotient for non-carcinogenic risk posed by a single element;
HI = hazard index for multiple exposure routes and substances;
ILTCR = incremental lifetime cancer risk associated with inhalation exposure;
CSFinh = cancer SF associated with inhalation;
RfD (reference dosage) = daily exposure assessment of possible risks to individuals. This dosage is determined by considering children as a sensitive group over their lifespan.
To evaluate non-cancer risks, the Hazard Quotient (HQ) and Hazard Index (HI) were utilized. An HQ exceeding 1 [39] raises concerns, signifying a potential non-carcinogenic risk when pollutant exposure levels surpass this threshold. The Hazard Index (HI) provides further insight: HI ≤ 1 suggests no adverse health effects, while HI > 1 indicates a likelihood of adverse health effects. For carcinogenic substances, the Incremental Lifetime Cancer Risk (ILTCR) was computed. This metric quantifies the excess cancer risk over an individual’s lifetime due to exposure to a contaminant. Expressed as a probability, the ILTCR indicates the likelihood of developing cancer attributable to such exposure. Overall, the US EPA [40] has set an ILTCR threshold of 1 × 10⁻⁶, below which the risk can be considered negligible. However, some authors have considered the acceptable range to be from 1 × 10⁻⁶ to 1 × 10⁻⁴ [41].

2.4. Academic Performance

The academic performance of students in schools belonging to the geographically described area was obtained from the System for Measuring the Quality of Education (SIMCE) 2017 for the eighth grade (i.e., students aged between 13 to 14 years). The schools included in this analysis and their general characteristics are detailed in Table 2, and approximately 180 eighth-grade students were considered.
The SIMCE test is a standardized learning assessment tool used in the Chilean educational system, which is conducted annually and of a census nature. Its purpose is to improve the quality and equity of education through recording information about students’ learning achievements, promoting transparency and commitment to continuous learning [23].
Due to its cross-sectional nature, we used the results of the eighth-grade SIMCE test, which were formally requested from the Agency for Quality in Education under the Ministry of Education of Chile (MINEDUC). The analyzed data included results from tests in Language and Communication, Mathematics, and Natural Sciences [23].
The technical specifications of the SIMCE test distinguish and define thematic axes (or content areas) and skill axes (or cognitive domains), defined by the Agency for Quality in Education of MINEDUC. In the Reading assessment, three skill axes are distinguished: locating, interpreting and relating, and reflecting. Similarly, the Mathematics assessments includes three skill axes for evaluation: Knowledge, Application, and Reasoning. Additionally, in the eighth-grade Mathematics test, four thematic or content axes are identified: Numbers, Algebra and Functions, Geometry, and Probability and Statistics. In the eighth-grade Natural Sciences test, three skill axes are distinguished: Knowledge, Application, and Reasoning. It is worth noting that, in eighth grade, Natural Sciences are presented as a single subject that organizes its Learning Objectives into three axes, representing the scientific disciplines of Biology, Physics, and Chemistry [23].

2.5. Statistical Analysis

The dust data set for Quintero and Puchuncaví was subjected to multivariate analysis using positive matrix factorization (PMF). PMF was carried out to determine the contributions and factors related to each source of dust inside and around the schools using the PMF 5.0 software.

2.5.1. Positive Matrix Factorization (PMF)

PMF, a multivariate technique first described in [42] and further developed by the US Environmental Protection Agency (EPA), is a factor analysis method with individual weightings for matrix elements.
The primary goal of Positive Matrix Factorization (PMF) is to perform factorization on a data matrix X (n × m), where n represents the number of species and m indicates the number of samples. This factorization results in the creation of two distinct matrices: G (n × p) and F (p × m). The dimensions of G and F are determined through the factorization process, in accordance with the following equation:
X i j = k = 1 p g i k . f k j + e i j
In the context of Positive Matrix Factorization (PMF) analysis, Xij represents the concentration of the jth element measured in the ith sample; gik signifies the concentration contribution of the kth source to the ith sample, depicting the contributions of each source; fkj indicates the mass fraction (mg/kg) of the jth species in the kth source, representing the profile of each source; and eij accounts for the part of the measurements not explained by the model, referred to as the residual [42,43].
PMF aims to estimate these values through minimizing the sum of squares of the residuals. This minimization process is mathematically expressed by the following equation [42,44]:
Q = i = 1 m j = 1 n e i j s i j 2
where
e i j = x i j k = 1 p f i k . g k j
and Sij is the uncertainty in the concentration of Xij.
To calculate the uncertainty in concentration Xij, the following equation is used:
S i j = ( l j 2 + ( d j X i j ) 2 ) 1 / 2
In the context of the analytical measurements, lj signifies the detection limit for component j, calculated as the value in the control sample plus three times the standard deviation of the control value [43], and dj represents the relative uncertainty in the matrix value Xij. This uncertainty introduces an additional source of variability in the measured data.
These measures play a crucial role in evaluating the reliability of analytical results. The detection limit (lj) acts as a threshold for discerning the presence of a specific component, while the relative uncertainty (dj) reflects the potential variability in the matrix value Xij.
For this study, various methodologies were assessed, revealing that the most favorable outcomes were achieved through incorporating a consistent parameter tied to the detection limit for uncertainty estimation. For major elements, if the variable value in a sample surpassed its detection limit, the uncertainty in this value was determined as 10% of the variable value plus one-third of the detection limit (Xij > LOD, Sij = 0.1 × Xij + LOD/3). On the other hand, for trace elements with values below or equal to the detection limit, the uncertainty was calculated as 5% of the variable value plus one-third of the detection limit (Xij ≤ LOD, Sij = 0.05 × Xij + LOD/3) [44,45,46].
The uncertainty assessment serves as a benchmark for differentiating species generating substantial signals. This benchmark relies on the signal-to-noise ratio S/Nj, a parameter outlined in reference [47]. In our investigation, species exhibiting S/N < 2 were typically classified as weak variables and, consequently, were excluded. As an additional criterion, we employed the percentage of data surpassing the detection limit [44].
In determining the number of factors and interpreting the solution [47], the Q value and the explained variation in the matrix F play crucial roles. To evaluate the appropriateness of the Fpeak value, changes in the Q value were closely monitored. Through extensive trials involving adjustments to the Fpeak value and thoughtful consideration of the physical significance of the extracted factors, it was decided that no rotation would be applied (Fpeak = 0).

2.5.2. Econometric Model

To identify and model the factors that have impacts on academic performance in the Chilean study case, an econometric multivariate model was developed. In the model, the endogenous variable is the results obtained by eighth-grade students in the Education Quality Measurement System (simce_performance). The exogenous variables in the model are as follows: quantity of manganese in the sample (Mn), quantity of cobalt in the sample (Co), quantity of arsenic in the sample (As), quantity of strontium in the sample (Sr), quantity of cadmium in the sample (Cd), quantity of antimony in the sample (Sb), and quantity of vanadium in the sample (V).
Thus, the following relationships were investigated for each school in the sample, both for samples taken inside educational establishments (Model Indoor) and for samples taken outside educational establishments (Model Outdoor):
Model   Indoor :   s i m c e _ p e r f o r m a n c e i = β 0 + β 1 × M n i + β 2 × C o i + β 3 × A s i + β 4 × S r i + β 5 × C d i + μ i ,
Model   Outdoor :   s i m c e _ p e r f o r m a n c e i = β 0 + β 1 × M n i + β 2 × C d i + β 3 × S b i + β 4 × V i + μ i ,
where
i: the ith school sample;
μ i : random error.
For this analysis, we considered 6 out of the 7 schools included in this research (See Table 2). The school “El Faro” was excluded as it does not have an eighth grade. Additionally, the heavy metal measurement results were analyzed only for the summer season.

3. Results

3.1. Chemical Composition of Dust Inside Schools and around Schools

The trace metal concentrations (mg/kg) in indoor and outdoor dust collected from school environments in Puchuncaví and Quintero are shown in Table 3 and Table 4, respectively.
Table 3 shows that the mean trace element concentrations in dust collected inside the schools were greater than those collected outside the schools.

3.2. Source Identification Using PMF

Using PMF, we evaluated the profiles of chemical species and analyzed the contribution of each factor to the total mass per sample (mg/kg). In the context of dust collected within the school environment, we identified two prevalent factors. Figure 1 displays the chemical profiles derived from this analysis. The key characteristics of the identified factors are detailed as follows.
Factor 1: The first component, “industrial”, explained 64% of the total variance and was mainly associated with the contents of Cu, Mo, Cd, Sb, Pb, As, Zn, and Se (Figure 1). The chemical profile of this factor suggests contamination from the copper smelter, located less than 6 km from the schools where the dust samples were collected (Table S1). The greatest contributions to this factor were found in the Greda (Alerces) and Greda schools.
Factor 2: The second component, “traffic + crustal”, represented 36% of the total variance. The chemical profile of this factor was characterized by Li, Be V, Cr, Mn, Co, Ni, Zn, As, Se, Sr, and Tl. The greatest contributions to this factor were found in the Faro, Santa Filomena, Inglés, Politécnico, Chocota, and Horcón schools (Figure 2).
PMF was applied to determine the chemical species profiles and contribution of each factor in the samples of outdoor dust collected from the schools and, similarly, two factors were identified (Figure 3).
Factor 1: The first component, “industrial”, explained 28% of the total variance and was associated with the contents of Cu, Sb, Cd, Zn, As, Se, Mo, and Pb (contamination by copper smelting).
Factor 2: The second component explained the greatest part of the variance (72%) and was characterized by the presence of Li, Be, V, Cr, Mn, Co, Ni, Zn, As, Se, Sr, and Tl in the samples collected from outside the schools.

3.3. Health Risk Assessment for Schoolchildren

The exposure of children to trace elements in dust through ingestion, inhalation, and dermal contact was determined using Equations (1)–(9).
The HQ and HI were calculated for the trace metals that children were exposed to from school dust collected inside and outside the selected schools in the cities of Quintero and Puchuncaví (Table 5 and Table 6). Nine toxic metals (V, Cr, Ni, Zn, As, Sr, Cd, Pb, and Cu) were evaluated in the non-carcinogenic health risk assessment, while five toxic metals (As, Cd, Cr, Ni, and Pb) were considered in the carcinogenic health risk assessment [48,49].
The HQ and ƩHI (Table 5 and Table 6) values for all exposure routes in the Faro, Santa Filomena, Ingles Quintero, Politécnico, Basica Chocota, and Basica Horcón schools were below 1. In contrast, for the Greda (Alerces) and Greda schools, the ƩHI value exceeded 1. Of the three exposure pathways, the highest hazard quotient (HQ) for arsenic via the dermal route was found in indoor dust samples collected from Greda Alerces (2.09) and Greda (1.13) schools.
Among the dust samples collected indoors at other schools, V, Cr, Cu, Pb, and As presented the greatest non-carcinogenic risk among the nine heavy metals studied, whereas Zn showed the lowest non-carcinogenic risks both indoors and outdoors. Dermal contact was identified as the primary route of toxic metal exposure to children in the selected schools, followed by inhalation and ingestion.
Subsequently, we computed integrated hazard index (ΣHI) values to assess the cumulative content of all heavy metals in dust. This approach reflects real-life scenarios, where children encounter a mixture of heavy metals rather than exposure to individual metals [51].
Hence, upon evaluating the ΣHI values across all schools, children in Greda School faced the greatest non-cancerous risk, thereby increasing their vulnerability to symptoms such as nausea, loss of appetite, and headache.
Additionally, we performed an assessment of carcinogenic health risks among schoolchildren, as depicted in Table 7. Given the absence of reference slope factors, the evaluation of cancer risks (CR) was centered on As, Cd, Cr, Ni, and Pb, with a particular focus on inhalation exposure.
All the values determined for the ILTCR inside and outside the schools were lower than or very close to 1 × 10⁻⁶, which is considered the safe limit by regulatory and environmental agencies [40]. However, for carcinogenic health risks, only Cr and As presented higher ILTCR values in all samples of dust collected inside and outside the selected schools in Quintero and Puchuncaví (Table 7). Similarly, at the Santa Filomena and Faro schools, the ILTCR values for Cr were 5.44 × 10⁻⁷ and 4.82 × 10⁻⁷, respectively.

3.4. Academic Performance

The six schools included in this research were all located in the previously described geographical area. Their characteristics include the following: five out of the six are situated in urban areas, and one is in a rural area; four are sub-schools, and two are subsidized, with none being private. Regarding socioeconomic characteristics, four schools fall under the middle socio-economic stratum, and two fall under the lower-middle stratum. Therefore, the general characteristics of the schools analyzed regarding administrative dependency, socioeconomic level, and location were similar and did not represent confounding variables (see Table 2).
Regarding the indoor model’s performance, 92% of the variance in the endogenous variable was accounted for by the variability of the exogenous variable (refer to Table 8). The significance level of both comprehensive and individual model explanations exceeded 95%, often surpassing 99%.
An analysis of Table 8 reveals that variations in the quantities of manganese (Mn), cobalt (Co), arsenic (As), strontium (Sr), and cadmium (Cd) significantly impacted indoor sample performance by 5%.
In contrast, concerning the outdoor model’s performance, 96% of the variance in the endogenous variable was accounted for through the variability of the exogenous variable (refer to Table 9). The significance level of both the comprehensive and individual model explanations exceeded 95%, often surpassing 99%.
Analysis of Table 9 reveals that variations in the quantities of manganese (Mn), cadmium (Cd), antimony (Sb), and vanadium (V) in the sample significantly impacted outdoor sample performance by 5%.

4. Discussion

The main objective of this research was to determine the distribution of trace metals from various sources present in the dust collected inside and outside the schools in the Quintero and Puchuncaví area, which is located in a highly polluted coastal region of the fifth largest region of Chile. Our results indicated that the concentrations of heavy metals are related to the distance of the schools from the source of pollution; they also identified differences between samples obtained from indoor and outdoor areas of the analyzed educational centers. Additionally, in the most-contaminated school in the area, elevated concentrations of metals such as Co, Zn, Cu, As, Se, Pb, Mo, Cd, and Sb were detected.
The first of the secondary objectives of this study was to identify potential carcinogenic and non-carcinogenic risks posed by the analyzed metals to the health of children. In this regard, we did not find evidence of a carcinogenic risk for the health of the exposed students; however, some schools were near the limit values, potentially posing a risk to the children there. Finally, we determined whether the concentration of these heavy metals could affect the academic performance of the exposed children, assessed through the eighth-grade SIMCE test. Our results indicated that, in samples obtained from inside the analyzed schools, the concentrations of manganese, cobalt, arsenic, strontium, and cadmium influenced the academic performance of exposed students. Regarding samples obtained from outside of the analyzed schools, the concentrations of manganese, cobalt, antimony, and vanadium influenced the academic performance of exposed students.
Considering the distribution of trace metals from various sources present in the dust collected inside and outside the schools, the concentrations of trace elements reported in this study are higher than those in dust samples from general school environments worldwide. For example, the mean concentrations of As, Cu, and Mo in dust collected inside the Greda School were higher by factors of 20, 1500, and 50, respectively, when compared to those reported by De Miguel et al., 2007 (Spain) [52] and Abdul et al., 2020 (Pakistan) [7]. Similarly, the concentrations of Zn, Pb, V, Cr, and Ni in the studies of Olujimi et al., 2019 in Nigeria [53] and Chen et al., 2014 in China [34], were up to 10 times lower than those reported in this study. In addition, V and Cr were higher in the Faro and Santa Filomena schools and Ni and Sr were higher in the Faro School than in the other schools sampled. Faro and Santa Filomena are located six kilometers from the industrial complex in the area (see Table S1) and are also close (less than 700 m) to a bus terminal and a company dedicated to boarding and disembarking ships, which could be sources of vanadium in the schools as this element is enriched in emissions from crude or heavy oil used in large ships and automobiles [54]. The average Co, Zn, Cu, As, Se, Pb, Mo, Cd, and Sb concentrations were higher in the Greda (Alerces) and Greda schools (located less than 3.3 km from the industrial complex) than in the other schools sampled. The high levels of these trace metals inside the schools likely derive from external sources (e.g., industrial activities and vehicular emissions) and may be transported into the schools on the schoolchildren.
Regarding the concentrations of trace elements in the outdoor dust, our results indicated higher mean concentrations of V (427 mg/kg) and Cr (591 mg/kg) in the summer at the Santa Filomena School than at the other schools. Moreover, the mean concentrations of Ni, Zn, Se, and Sr in dust around the schools were higher at the Horcón School than at the other schools, possibly because Horcón is a popular tourist location, suggesting a greater influence of anthropogenic sources such as motor vehicles. At the Greda (Alerces) and Greda schools, the average concentrations of Cu, As, and Mo in the dust samples collected outdoors were 60, 3, and 10 times higher, respectively, than those at the other schools sampled, and the concentrations of Cu, Co, Zn, As, Se, Sb, Mo, Cd, and Pb in both indoor and outdoor dust were highest among the sampled schools, suggesting the influence of anthropogenic sources.
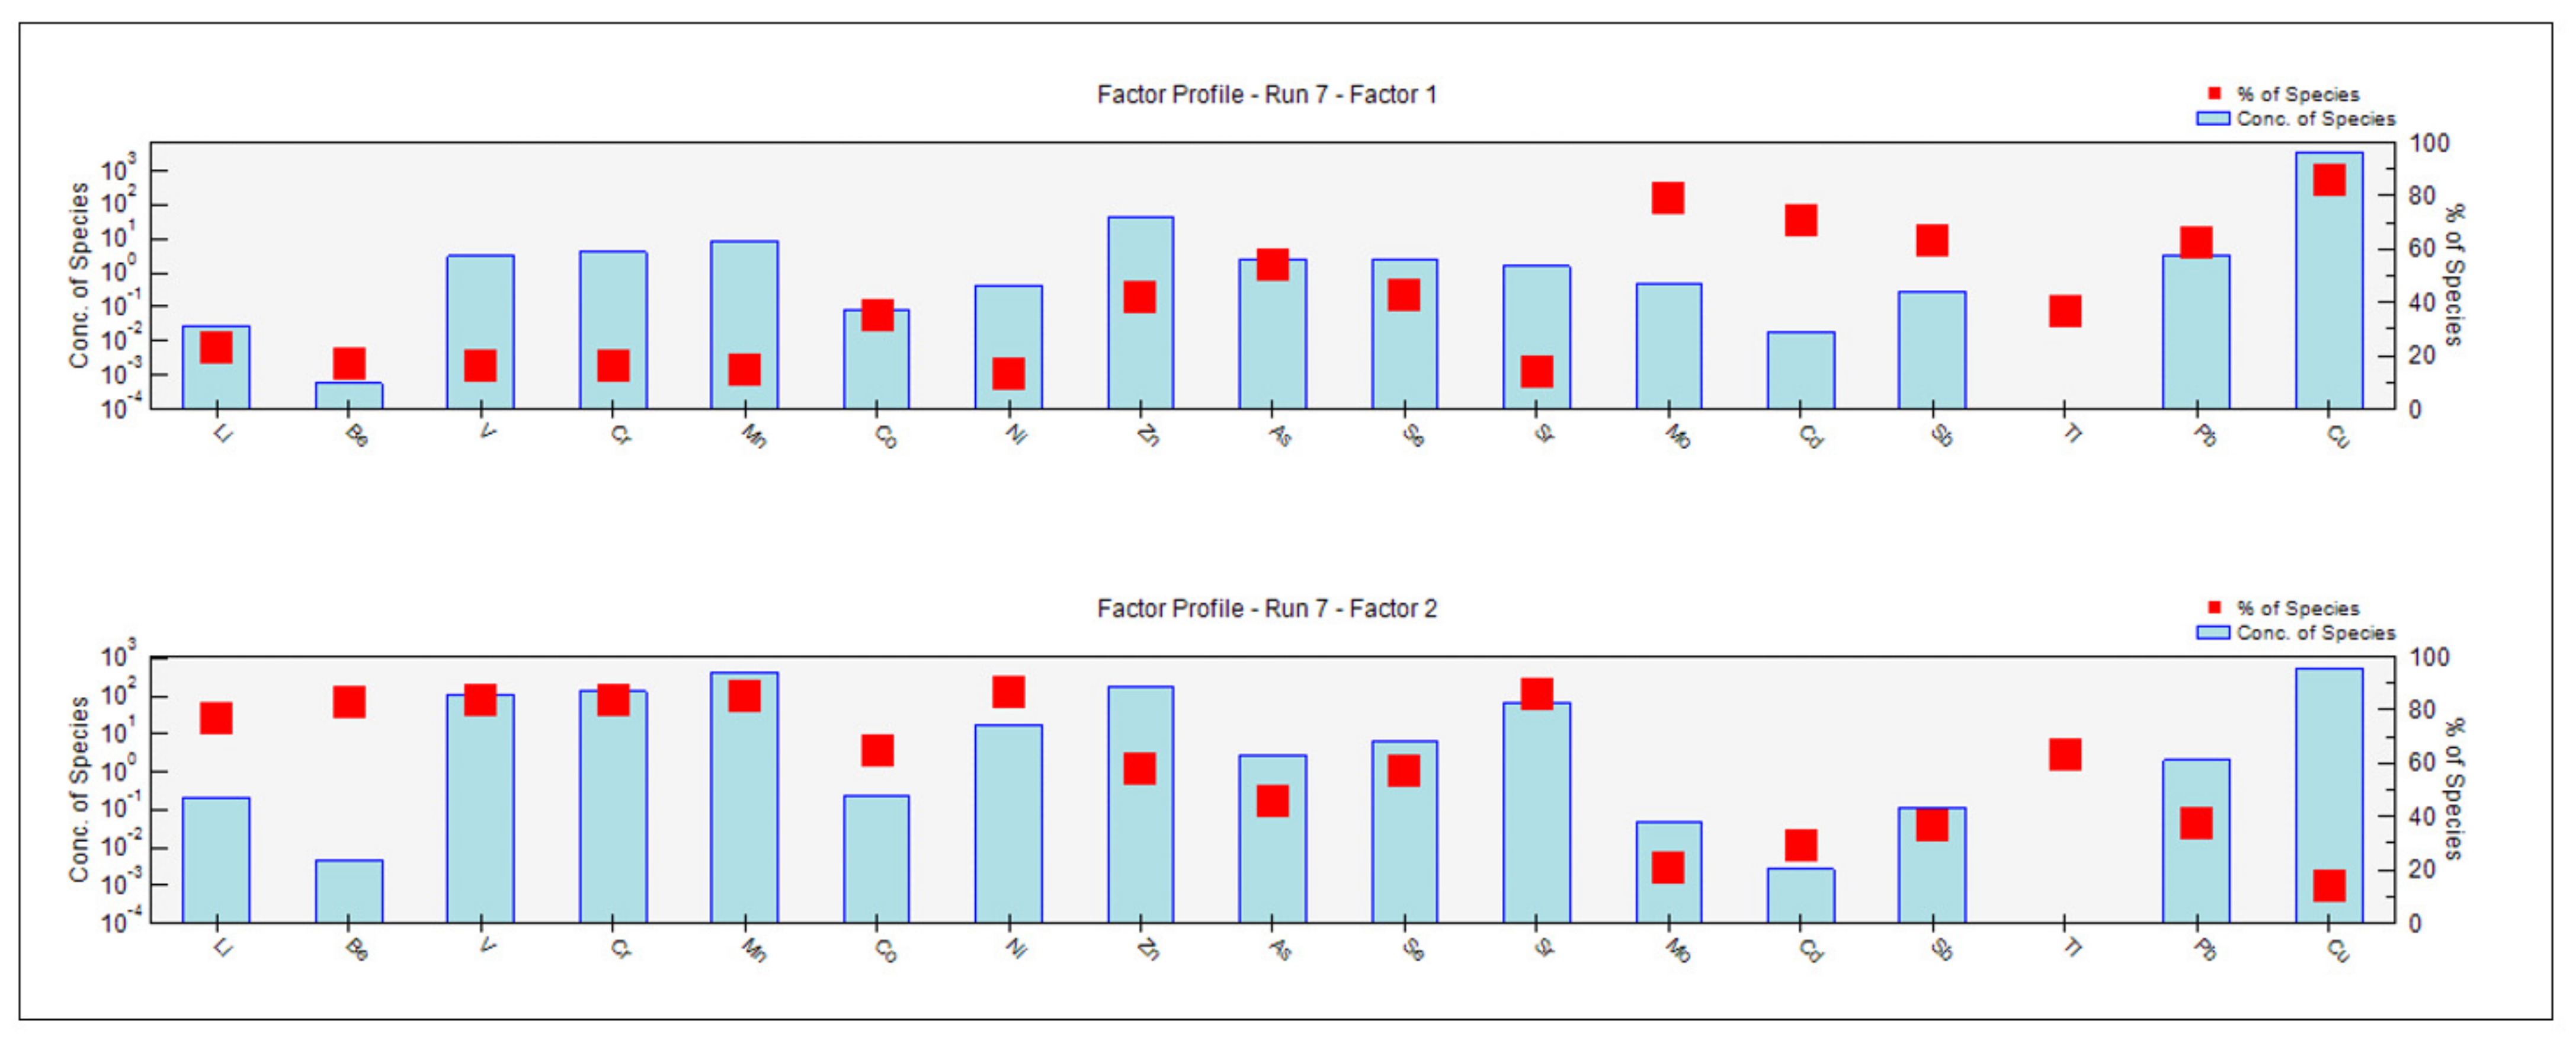
Next, we determined the chemical species profiles and the contribution of each factor to the total mass per sample (mg/kg) through PMF and found that the first component—labeled “industrial”—explained 64% of the total variance and was primarily associated with the contents of Cu, Mo, Cd, Sb, Pb, As, Zn, and Se. The chemical profile of this factor suggests contamination from the nearby copper smelter near the schools, with the most-affected schools being the Greda (Alerces) and Greda schools, likely due to their proximity to industrial complexes in the area and the trajectory of the prevailing winds (northeasterly). These results are similar to those reported in other studies, such as [55], in which the sources of heavy metal contamination in urban dust in a continental city in eastern China were determined, where Cu and Zn originated from emissions from the local smelting industry. Similarly, other studies have found metal smelting to be one of the most important anthropogenic sources of heavy metal emissions [56]. During the smelting process, the heavy metals in minerals are evaporated from the matrix and eventually transported to the atmosphere if pollution control technology is not applied [57]. In addition, it has been reported that Cu is released during industrial activities such as metal processing and smelting [58,59].
Regarding the second component, our results showed that 36% of the total variance was explained by the “traffic + crustal” component. The chemical profile of this factor was characterized by Li, Be V, Cr, Mn, Co, Ni, Zn, As, Se, Sr, and Tl. The greatest contributions to this factor were found in the Faro, Santa Filomena, Inglés, Politécnico, Chocota, and Horcón schools. The presence of Mn, Ni, and Zn could be associated with vehicular sources (related to brake and engine wear), which has also been reported in other studies [60,61]. The trace elements Zn, As, and Se have two possible sources: industrial (copper smelter) and vehicular [26].
The trace elements Zn, Cr, Ni, Sr, and Co are related to traffic, as they are present in vehicle exhaust [62,63,64,65]. These results are comparable with those of a similar study [66] investigating the composition of dust in indoor and outdoor school classrooms in Kuala Lumpur, in which it was found that the highest contribution was exhaust emissions containing Cr and Ni. Similarly, Cr, Ni, V, and Co have been reported as markers of either exhaust emissions or brake and clutch wear in other studies, such as [54,67].
On the other hand, due to the relationship between nickel and vanadium, the source of these trace elements could be vehicular fuel combustion, which has been reported in other studies [68,69]. Likewise, the elements Li, Be, and Tl could be attributed to lithogenic sources [46,70,71].
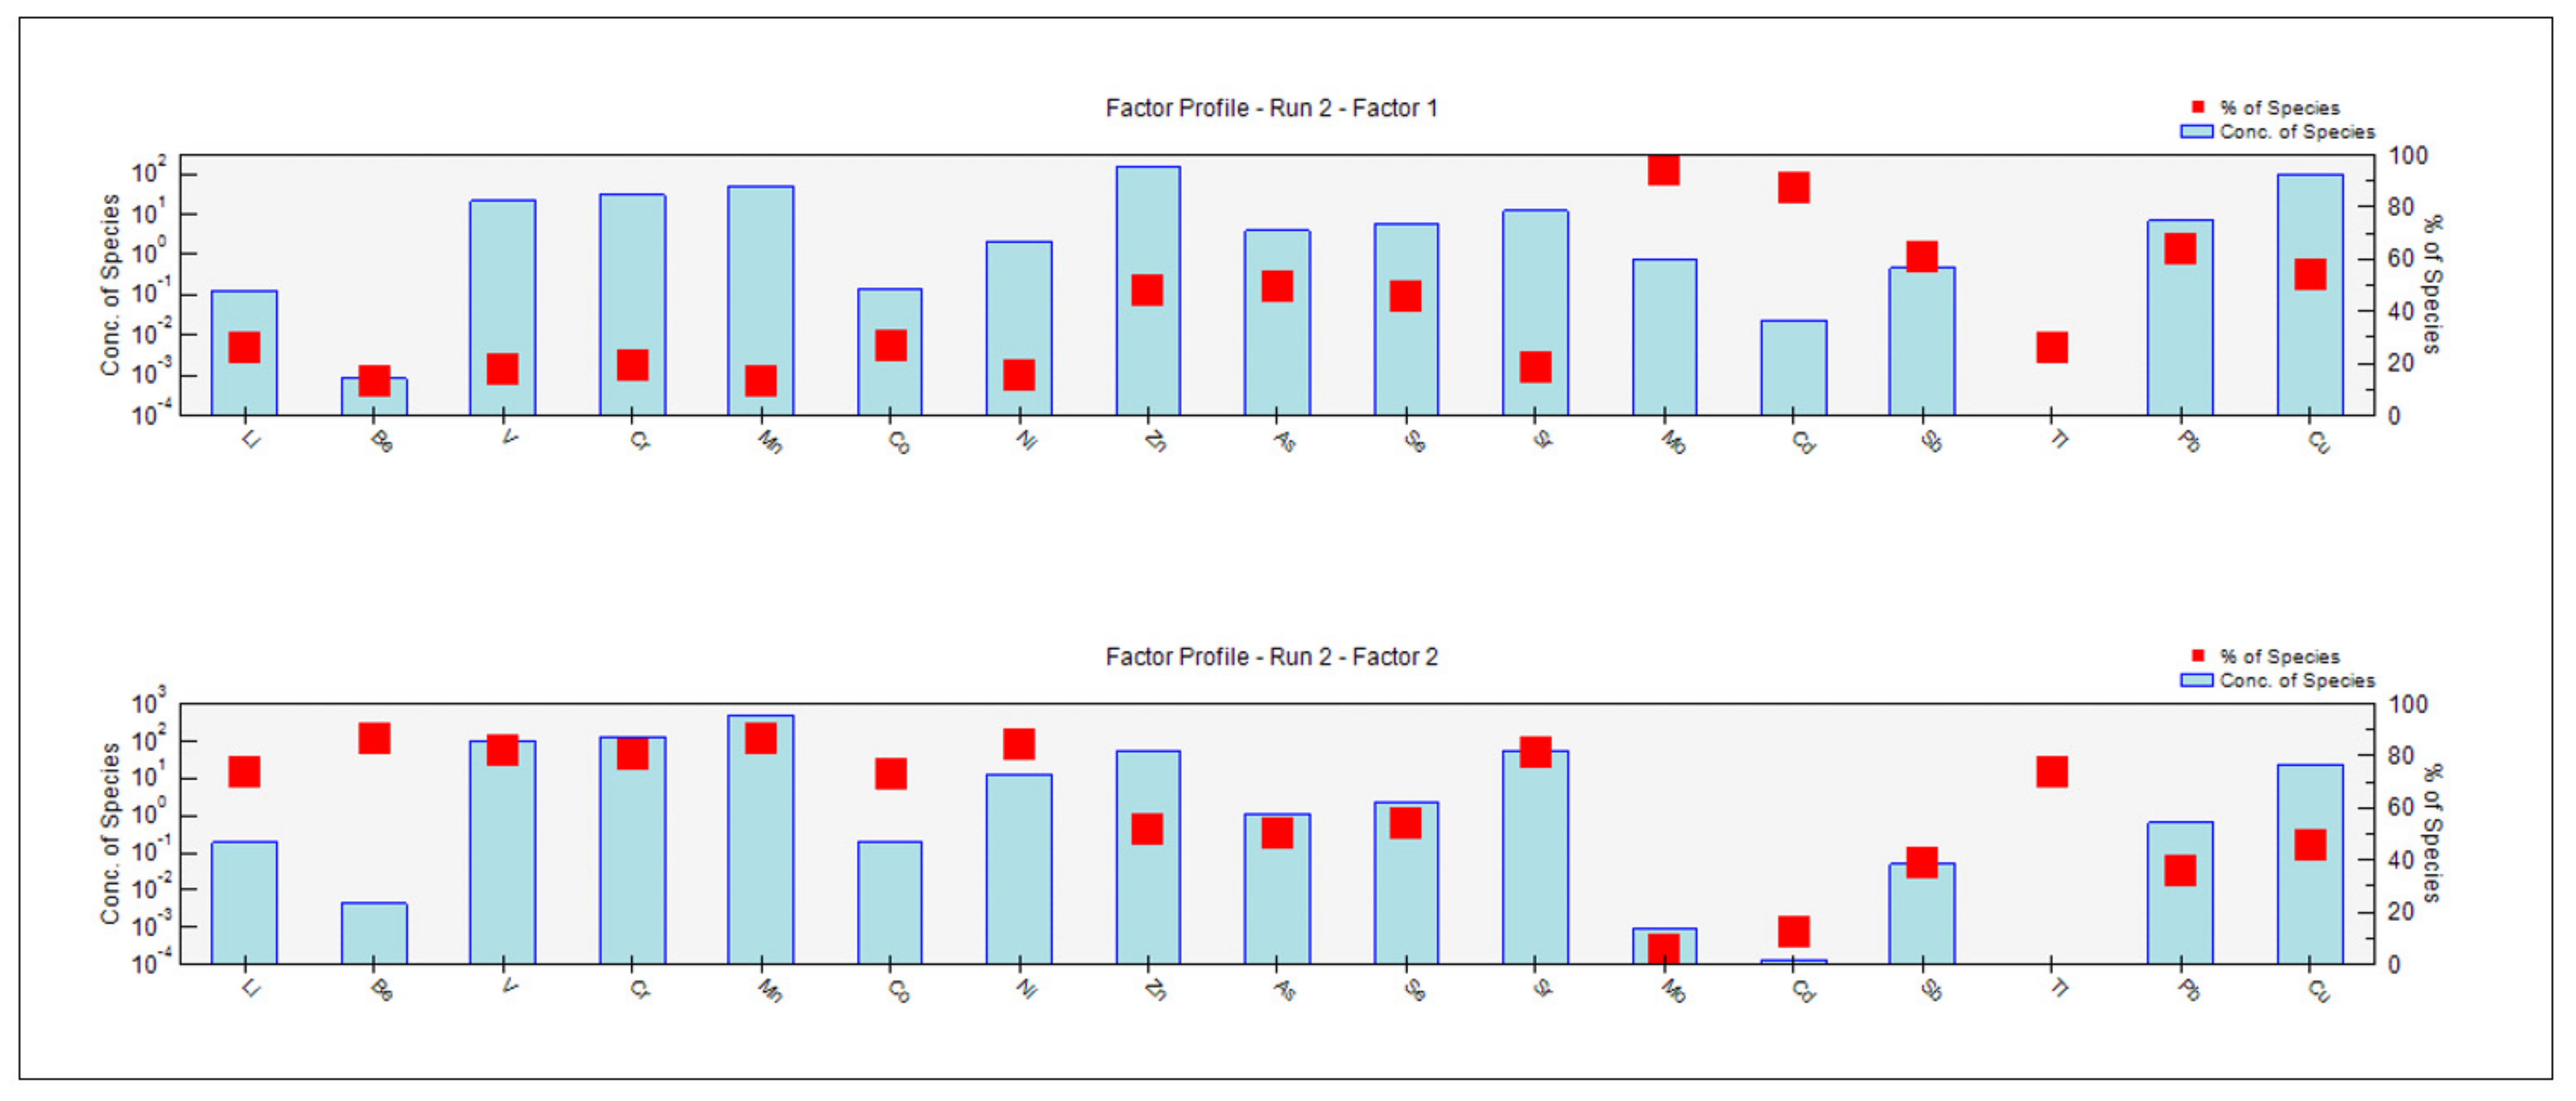
In the dust samples collected outdoors from the analyzed schools, PMF was applied to determine the chemical species profiles and the contribution of each factor. In this regard, two factors were identified: the first component—named “industrial”—explained 28% of the total variance and was associated with the contents of Cu, Sb, Cd, Zn, As, Se, Mo, and Pb, which are attributed to copper smelting contamination. The second component explained 72% of the variance and was characterized by the presence of Li, Be, V, Cr, Mn, Co, Ni, Zn, As, Se, Sr, and Tl in the samples collected outside the schools. This high percentage is logical as these outdoor samples were collected in front of the schools, where there were high contributions from vehicular and lithogenic sources.
According to the above results, the sampled dust particles contained pollutants with an anthropogenic origin, including an industrial source and traffic sources (e.g., related to brake and wear).
Therefore, the sources of contamination inside these schools could be external; that is, external atmospheric particles were carried in by the wind or on the children themselves, originating from the copper smelter and vehicular sources.
Subsequently, we determined the children’s exposure to trace metals in the school dust collected inside and outside selected schools in the cities of Quintero and Puchuncaví, either through ingestion, inhalation, or dermal contact, using Equations (1)–(9).
The hazard quotient (HQ) and hazard index (HI) were computed for nine hazardous metals (V, Cr, Ni, Zn, As, Sr, Cd, Pb, and Cu) for a non-carcinogenic health risk assessment. Simultaneously, a carcinogenic health risk assessment focused on five toxic metals (As, Cd, Cr, Ni, and Pb) was also conducted, assessing their potential health impacts [48,49].
The HQ and ƩHI for all exposure routes in the Faro, Santa Filomena, Ingles Quintero, Politécnico, Basica Chocota, and Basica Horcón schools were below 1, indicating that there were no significant non-carcinogenic health risks posed by the trace metals in all samples collected (indoor or outdoor dust). In the Greda (Alerces) and Greda schools, the ƩHI value exceeded 1, indicating a potential risk for non-cancerous effects. Among the three routes of exposure, the HQ for the dermic pathway was the highest for As in indoor dust collected in the Greda Alerces (2.09) and Greda (1.13) schools. Because these HQ values exceed 1, the children currently studying at Greda School are at potential risk of non-cancerous effects from As.
Among the dust samples collected from other schools, V, Cr, Cu, Pb, and As presented the highest non-carcinogenic risk of the nine heavy metals, while Zn showed the lowest non-carcinogenic risks both indoors and outdoors. Dermal contact was identified as the primary route of toxic metal exposure for children in the selected schools, followed by inhalation and ingestion.
The assessment of heavy metal concentrations in dust was conducted through the utilization of integrated hazard index (ΣHI) values, reflecting real-life scenarios of children’s exposure to a mixture of heavy metals, rather than individual metal exposure [51].
Considering the ΣHI values for all of the schools, the children encountered the highest non-cancerous risk inside Greda School, being at risk of experiencing non-cancerous effects such as nausea, loss of appetite, and headache.
According to the obtained values for the different exposure pathways, even though the HI values for the six schools fell within the safe range, the high concentrations of some elements that could be emitted from anthropogenic sources pose a risk to the health of children, especially considering the greater susceptibility of children due to their body weight [72,73].
Likewise, we evaluated the carcinogenic health risks among the schoolchildren. Due to the unavailability of reference slope factors, we assessed the cancer risks (CR) associated with As, Cd, Cr, Ni, and Pb specifically for inhalation exposure.
All of the values determined for the ILTCR inside and outside the schools were lower than or very close to 1 × 10⁻⁶ and were therefore within the safe limit established by regulatory and environmental agencies [40]. These results were similar to those of other studies, where the values for carcinogenic risk were found to be lower than 1 × 10⁻⁶ [50,66,74]. However, for carcinogenic health risks, only Cr and As presented higher ILTCR values in all dust samples collected inside and outside the selected schools in Quintero and Puchuncaví (Table 7). This suggests that local environmental authorities should pay attention to a potential carcinogenic risk at Greda School, where the detected value for As was 5.98 × 10⁻⁸, whereas it was lower (3.7 × 10⁻⁸) in the outdoor dust samples collected at the same location. Similarly, at the Santa Filomena and Faro schools, the ILTCR values for Cr were 5.44 × 10⁻⁷ and 4.82 × 10⁻⁷, respectively. This trend in the Cr-associated carcinogenic risk assessment for children was similar to those reported in other studies on pollution and health risk assessments of trace elements in indoor dust in classrooms [7,53].
Finally, through the use of an economic model, we determined whether the concentrations of heavy metals inside and outside the classrooms of eighth-grade students at schools in Quintero and Puchuncaví could predict their academic performance. Our results indicated that, in the dust collected from inside the classrooms, higher concentrations of Mn, As, Sr, and Cd were associated with lower academic performance assessed through the SIMCE test. Meanwhile, higher concentrations of Co predicted better academic performance for eighth-grade students. In dust samples collected outside the children’s classrooms, high concentrations of Mn, Sb, and V predicted lower academic performance, while high concentrations of Cd could indicate higher academic performance.
In this regard, Mn is a crucial element for the proper development of mammals throughout their lives, but elevated concentrations of this compound can lead to health disturbances [75]. In children, it has been observed that exposure to manganese can impact neurodevelopment, learning, and, consequently, academic performance. Our results support this statement and align with the conclusions of other authors. Various authors have assessed the relationship between exposure to high concentrations of Mn in children aged 6 to 13 from different countries and alterations in IQ [76], scores in intelligence test (Wechsler Intelligence Scale for Children, WISC-IV) [77], scores in cognitive functions (Raven’s Progressive Color Matrices Scale, PCM) [78], mathematics test scores [79], and scores on memory and attention tests [80]. The results of these studies have consistently shown that higher concentrations of Mn to which children are exposed are associated with lower performance in learning assessments and academic achievement. Furthermore, our results indicate that, both inside and outside the classroom, higher levels of Mn decreased the academic performance of the analyzed eighth-grade students, leaving them exposed in their entire school environment to the effects of this element.
Similar to Mn, various studies have observed that exposure to elevated levels of As in children aged 6 to 13 is associated with lower IQ scores [81], diminished cognitive abilities (Wechsler Intelligence Scale for Children, WISC-IV) [82], low scores in mathematics tests [83], and decreased visuospatial skills [84], as well as a reduction in vocabulary and the assembly of objects and images [85]. Our results align with those of the mentioned authors, but only in our indoor model (specifically, within the classroom). Considering this result, it appears that exposure to As (arsenic) during the school day inside the classroom may negatively affect the learning ability of the assessed children. On the other hand, most of the mentioned studies have assessed As levels in the urine or blood of children; in contrast, our study demonstrated that an invasive procedure is not necessary to identify the effect of As concentration on the academic performance of exposed students.
On the other hand, Sr (strontium) is a metal that can be found in the air, soil, and water. Our results showed that elevated levels of Sr in the indoor model predicted lower academic performance in the evaluated students. In this regard, we conducted a search for possible relationships or associations of Sr with cognitive function, neurodevelopment, IQ, or academic performance in children, but no information on the subject was found. Some studies have demonstrated possible relationships between Sr levels in water and certain pathologies in the population. In this regard, it has been shown that Sr levels in drinking water could prevent cavities in children when the concentration was 5–6 mg/L [86]. It has also been observed that the levels of Sr are negatively correlated with the incidence and mortality of cardiovascular diseases [87] and positively correlated with longevity [88]. Furthermore, Sr (strontium) levels are related with a hazard index (HI) above 1, indicating evident non-cancerous risks [89]. Considering the above, it is possible that elevated Sr levels could affect the cognitive function of children and, consequently, their academic performance; however, further research is needed in this regard.
With respect to Cd, our results indicated that, in the indoor model, high levels of Cd predicted lower academic performance in the evaluated students; meanwhile, in the outdoor model, the results indicated the opposite. Cadmium is a rare element in nature; however, the main sources of cadmium exposure in children are food, cigarette smoke, and dust [90]. Furthermore, Cd is toxic to organs such as the lungs, kidneys, liver, digestive system, and bone tissue, and can cause cancer and neurotoxicity [91]. Pre- and post-natal exposure to this element has a detrimental effect on the child’s neurological development, primarily due to increased oxidative stress that could induce neuronal apoptosis [92]. Regarding the effects on the neurodevelopment of children exposed to elevated Cd levels, Tian et al. (2009) have assessed 4-year-old children, and their results indicated that IQ was lower when children had higher levels of Cd in the blood [93]. Gustin et al. (2018) have also identified an association between Cd exposure and a decrease in IQ [94]. Lui et al., in 2022, assessed mothers and children during pre- and post-natal stages (2–3 years old), examining the presence of 22 heavy metals in serum and urine and their relationship with the neurocognitive development of the children using the Gesell Developmental Diagnosis Scale (GDDS; Chinese version). Their findings indicated that higher pre-natal exposure to Cd was associated with a lower Gesell Developmental Quotient (DQ) score, indicating lower cognitive levels in the gross motor area; furthermore, in the post-natal stage, increased Cd exposure was linked to a lower DQ score in language [95]. On the other hand, some studies in children aged 2 to 14 years did not find relationships or associations between Cd levels and neurodevelopmental assessments in children [91,96]. Considering this information, more data are necessary to determine the effects of Cd on cognitive functions, IQ, neurodevelopment, and academic performance in children.
Regarding Co, in our indoor model, high concentrations of this metal predicted better academic performance in the evaluated children. In this regard, no published information was found on the effects of Co on learning, academic performance, cognitive function, or IQ in children. However, there is information indicating that exposure to high concentrations of Co in children aged 6–11 years was associated with a higher overall health score [97]. On the other hand, Boraa et al., in 2019, demonstrated that Co concentrations >5 μg/L were associated with low scores in memory tests in children under 18 years old [98]. Due to the inconsistency in the published information and the limited amount of research available, it is necessary to continue investigating the effects of Co on cognitive function, learning, and neurodevelopment in exposed children.
Antimony is commonly found in the form of antimony trioxide, and is present in the environment due to industrial activities or the weathering of rocks and soil runoff [99]. Our results showed that elevated levels of antimony outside classrooms of the analyzed schools predicted lower academic performance. In this regard, no information was found regarding the effect of antimony on cognitive function, learning, academic performance, or neurodevelopment in exposed children. Some research, such as that of Cao et al. in 2016, has associated its ingestion in children with non-carcinogenic and carcinogenic risks 100 times higher than the acceptable level in an integrated analysis of Pb, Cr, Cu, Zn, As, Se, Cd, and Sb [100]. The study of Cheung et al. in 2008 demonstrated that, in secondary-level students, the levels of antimony—along with other heavy metals ingested through the diet—posed low health risks [99]; furthermore, the study of Jiang et al. in 2021 showed that children are more susceptible to the non-cancerous effects of antimony [101]. These studies indicate that high concentrations of Se may impact the overall health of children, but there is a lack of information regarding its effects on cognitive function and learning. It is necessary to continue investigating the potential effects of Se in children, particularly those exposed to elevated levels of this metal due to living in highly contaminated industrial areas.
Finally, our results indicated that vanadium levels in dust samples collected outside children’s classrooms predicted lower academic performance. Vanadium (V) is found in the environment as a byproduct of the petrochemical industry, automobile manufacturing, fertilizer production, and steel manufacturing [102]. The population is exposed to V primarily through alcohol consumption, water, diet, and inhalation of contaminated air [103]. Some studies have shown that exposure to V can cause adverse health effects, such as neurotoxicity and cognitive deficit in rats [104], reproductive and developmental alterations [105], and adverse birth outcomes [106], related to cognitive and neurodevelopmental alterations in children. No studies were found that have assessed its effects on learning and academic performance in children. Considering its effects on neurodevelopment and the described birth outcomes, it is possible that its effects on variables associated with academic performance could be similar; however, more information is needed in this regard.
Undoubtedly, the impact of pollution on children must be factored into the governmental policies of the region and the country. Chile has made strides in managing environmental pollutants in the Quintero and Puchuncaví area following numerous instances of environmental alerts and the poisoning of residents, particularly children. These incidents, largely stemming from emissions from local industries, prompted action from the Chilean Ministry of the Environment. Their Atmospheric Prevention and Decontamination Plan for the municipalities of Concón, Quintero, and Puchuncaví (D.S. N°105/2018) has led to a reduction in pollution levels. However, this plan primarily addresses air pollutants, overlooking soil and water contaminants, which pose challenges due to their prolonged presence. Despite a decrease in critical events, these pollutants persist, indicating that current measures—though significant—remain insufficient. We advocate for the incorporation of our findings into public health policies and strategies at regional and national levels. This should involve comprehensive control of pollution, encompassing not just air quality but also soil and water management in affected areas. Given the elevated risks posed to children’s health and education by soil contamination, interventions within and around schools are particularly crucial. We urge relevant Chilean ministries to consider these recommendations for effective risk reduction, especially for vulnerable populations such as children. In particular, considering that dust is a major reservoir of pollutants that can enter children through various pathways, it is necessary to continue conducting thorough research on the risks associated with carcinogenic contaminants present in schools and their potential hazards. Therefore, it is imperative to seek support from governmental entities to implement development and pollution mitigation plans targeted at anthropogenic activities, such as installing and maintaining adequate ventilation systems inside classrooms, as well as promoting green environments (including gardens and recreational areas) in schoolyards and nearby locations.

Limitations

One limitation of this research was its sole focus on the Quintero and Puchuncaví zones, which constitute only one of the five sacrifice zones in Chile. We chose to concentrate on Quintero and Puchuncaví due to the significant population affected by severe environmental pollution, resulting in numerous critical health incidents such as vomiting, fainting, headaches, and respiratory crises, affecting both children and adults, including vulnerable groups such as the elderly and pregnant women. This level of impact is more intense and frequent in Quintero and Puchuncaví compared to other sacrifice zones in Chile, leading to various social movements advocating for the regulation of industrial pollution levels. Consequently, Quintero and Puchuncaví are emblematic sacrifice zones in the country with the most significant environmental and social repercussions. The Ventanas Industrial Complex is a major pollution source in the area, playing a vital role in regional and national contexts as it hosts significant port activities, copper and heavy metal smelting, energy generation, gas reception and distribution, and other operations. It contributes substantially to the energy supply of Chile’s central area, making it a key strategic location for the country geopolitically.
This sacrifice zone likely mirrors others in Chile and worldwide, characterized by exposure to high levels of contaminants from industries that make essential economic contributions but come with significant environmental costs.
As for limitations related to academic performance, we first identify the number of schools analyzed. We analyzed approximately 50% of the schools in the area, but it would be interesting to consider all of the schools located in this sacrifice zone in future research, providing a comprehensive overview of public, subsidized, and private schools. On this occasion, our analysis was conducted only in public and subsidized schools. Another potential limitation is that some schools only offer basic education, while others only offer secondary education. Therefore, it was not possible to compare the results of heavy metal measurements with the same academic performance test for all students. Consequently, in the analysis of academic results, we did not include all the schools from which dust samples were taken, but only those teaching the eighth grade. In future research, it would be beneficial to analyze or contrast the results of standardized academic performance tests conducted at different educational levels or to consider other indicators of academic performance and learning. In such cases, it would be valuable to differentiate the analyses based on the sociodemographic characteristics of the children and their families, such as parents’ educational level, family socioeconomic status, gender, etc.

5. Conclusions

The trace metal concentrations in dust collected from inside and around eight schools located in two cities highly contaminated by emissions from a copper smelter and nearby traffic were investigated.
The chemical composition of the collected dust samples was analyzed using the receptor model PMF, allowing for the determination of two interpretable factors related to two contamination sources (i.e., Traffic + Crustal and Industrial).
The trace element pollutant levels in these two cities were highest at the Faro, Santa Filomena, Greda Alerces, and Greda schools. Furthermore, the highest concentrations of Cu, Co, Zn, As, Se, Pb, Mo, Cd, and Sb were observed at the Greda School. According to the results obtained, the three potential routes of exposure to dust are dermal contact, inhalation, and ingestion.
Following the evaluation of non-carcinogenic health risks, children at Greda School were found to face an elevated likelihood of experiencing non-carcinogenic health effects. Conversely, in the assessment of carcinogenic health risks, all Incremental Lifetime Cancer Risk (ILTCR) values were within the permissible limit set by the USEPA. Consequently, the probability of developing cancer due to exposure to trace elements present in the dust within and around these schools was deemed to be low.
Finally, in the indoor model, the variation in the levels of manganese, cobalt, arsenic, strontium, and cadmium in the sample was found to influence the academic performance of eighth-grade children, as evaluated through the SIMCE test. Meanwhile, in the outdoor sample, the variation in the levels of manganese, cobalt, antimony, and vanadium in the sample influenced the academic performance of the exposed students.
Consequently, strategies should be adopted by local environmental agencies to improve the environmental quality in these schools, especially inside Greda School, where students are currently exposed to industrial emissions enriched with potentially toxic elements that may put their health, safety, and learning ability at risk.
These findings affirm the adverse effects resulting from exposure to elevated levels of environmental pollutants among children. While this study focused on samples from the Quintero and Puchuncaví area, recognized as an area representative of sustainability challenges in Chile, the implications may be cautiously extrapolated to other regions in the world that face similar geographic, economic, social, and pollution issues. Consequently, prioritizing children’s health and development in any sacrifice zone is imperative. As a burgeoning demographic, children are particularly vulnerable to the detrimental effects of heightened pollution levels, which can significantly impact their quality of life, exacerbate existing health conditions, and hinder cognitive development. Therefore, implementing consistent monitoring of pollutants, regulations on industrial and vehicular emissions, and potential mitigation strategies, alongside public education initiatives regarding health risks and early warning signs, are crucial steps toward restoring sustainability in affected areas.

Supplementary Materials

The following supporting information can be downloaded at: https://www.mdpi.com/article/10.3390/su16062518/s1, Figure S1. Locations of the schools in the cities of Quintero and Puchuncaví; Table S1. Distance of the selected schools from the industrial complex located in the study area (the cities of Puchuncaví and Quintero).

Author Contributions

Data curation, S.P., H.d.l.F.-M., A.G.-R. and M.A.B.; formal analysis, S.P., H.d.l.F.-M., A.G.-R. and M.A.B.; investigation, S.P. and M.A.B.; methodology, H.d.l.F.-M. and A.G.-R.; writing—original draft, S.P. and M.A.B.; writing—review and editing, S.P., H.d.l.F.-M., A.G.-R. and M.A.B. All authors have read and agreed to the published version of the manuscript.

Funding

The research work of H. de la Fuente-Mella was partially supported by Proyecto FONDECYT Regular. Código del Proyecto: 1230881. Agencia Nacional de Investigación y Desarrollo de Chile. Dirección de Investigación y Estudios Avanzados (VRIEA-PUCV) project 039.470/2020 under the supervision of Dr. Sonnia Parra.

Institutional Review Board Statement

Not applicable.

Informed Consent Statement

Not applicable.

Data Availability Statement

The data used to support the findings of this study are available from the corresponding author upon request.

Acknowledgments

The authors acknowledge the schools that allowed them to conduct this research at their facilities and the Pontifical Catholic University of Valparaíso.

Conflicts of Interest

The authors declare no conflicts of interest.

References

  1. Jang, E.; Do, W.; Park, G.; Kim, M.; Yoo, E. Spatial and Temporal Variation of Urban Air Pollutants and Their Concentrations in Relation to Meteorological Conditions at Four Sites in Busan, South Korea. Atmos. Pollut. Res. 2017, 8, 89–100. [Google Scholar] [CrossRef]
  2. Azimi, S.; Rocher, V.; Muller, M.; Moilleron, R.; Thevenot, D.R. Sources, Distribution and Variability of Hydrocarbons and Metals in Atmospheric Deposition in an Urban Area (Paris, France). Sci. Total Environ. 2005, 337, 223–239. [Google Scholar] [CrossRef]
  3. Guttikunda, S.K. Estimating Health Impacts of Urban Air Pollution. 2008. Available online: http://www.indiaenvironmentportal.org.in/files/SIM-06-2008-Estimating_Health_Impacts.pdf (accessed on 13 March 2024).
  4. Habil, M.; Taneja, A. Children’s Exposure to Indoor Particulate Matter in Naturally Ventilated Schools in India. Indoor Built Environ. 2011, 20, 430–448. [Google Scholar] [CrossRef]
  5. Apeagyei, E.; Bank, M.S.; Spengler, J.D. Distribution of Heavy Metals in Road Dust along an Urban-Rural Gradient in Massachusetts. Atmos. Environ. 2011, 45, 2310–2323. [Google Scholar] [CrossRef]
  6. Mohmand, J.; Eqani, S.A.M.A.S.; Fasola, M.; Alamdar, A.; Mustafa, I.; Ali, N.; Liu, L.; Peng, S.; Shen, H. Human Exposure to Toxic Metals via Contaminated Dust: Bio-Accumulation Trends and Their Potential Risk Estimation. Chemosphere 2015, 132, 142–151. [Google Scholar] [CrossRef] [PubMed]
  7. Rehman, A.; Liu, G.; Yousaf, B.; Zia-ur-Rehman, M.; Ali, M.U.; Rashid, M.S.; Farooq, M.R.; Javed, Z. Characterizing Pollution Indices and Children Health Risk Assessment of Potentially Toxic Metal(Oid)s in School Dust of Lahore, Pakistan. Ecotoxicol. Environ. Saf. 2020, 190, 110059. [Google Scholar] [CrossRef] [PubMed]
  8. Cincinelli, A.; Martellini, T. Indoor Air Quality and Health. Int. J. Environ. Res. Public Health 2017, 14, 1286. [Google Scholar] [CrossRef]
  9. Liu, Y.; Ma, J.; Yan, H.; Ren, Y.; Wang, B.; Lin, C.; Liu, X. Bioaccessibility and Health Risk Assessment of Arsenic in Soil and Indoor Dust in Rural and Urban Areas of Hubei Province, China. Ecotoxicol. Environ. Saf. 2016, 126, 14–22. [Google Scholar] [CrossRef]
  10. Bennett, J.; Davy, P.; Trompetter, B.; Wang, Y.; Pierse, N.; Boulic, M.; Phipps, R.; Howden-Chapman, P. Sources of Indoor Air Pollution at a New Zealand Urban Primary School; a Case Study. Atmos. Pollut. Res. 2019, 10, 435–444. [Google Scholar] [CrossRef]
  11. Meza-Figueroa, D.; De La O-Villanueva, M.; De La Parra, M.L. Heavy Metal Distribution in Dust from Elementary Schools in Hermosillo, Sonora, México. Atmos. Environ. 2007, 41, 276–288. [Google Scholar] [CrossRef]
  12. Hopke, P.K.; Ito, K.; Mar, T.; Christensen, W.F.; Eatough, D.J.; Henry, R.C.; Kim, E.; Laden, F.; Lall, R.; Larson, T.V.; et al. PM Source Apportionment and Health Effects: 1. Intercomparison of Source Apportionment Results. J. Expo Sci. Environ. Epidemiol. 2006, 16, 275–286. [Google Scholar] [CrossRef]
  13. Calderón-Garcidueñas, L.; Franco-Lira, M.; Torres-Jardón, R.; Henriquez-Roldán, C.; Barragán-Mejía, G.; Valencia-Salazar, G.; Gonzaléz-Maciel, A.; Reynoso-Robles, R.; Villarreal-Calderón, R.; Reed, W. Pediatric Respiratory and Systemic Effects of Chronic Air Pollution Exposure: Nose, Lung, Heart, and Brain Pathology. Toxicol. Pathol. 2007, 35, 154–162. [Google Scholar] [CrossRef]
  14. Wang, S.; Zhang, J.; Zeng, X.; Zeng, Y.; Wang, S.; Chen, S. Association of Traffic-Related Air Pollution with Children’s Neurobehavioral Functions in Quanzhou, China. Environ. Health Perspect. 2009, 117, 1612–1618. [Google Scholar] [CrossRef]
  15. Calderón-Garcidueñas, L.; Mora-Tiscareño, A.; Ontiveros, E.; Gómez-Garza, G.; Barragán-Mejía, G.; Broadway, J.; Chapman, S.; Valencia-Salazar, G.; Jewells, V.; Maronpot, R.R.; et al. Air Pollution, Cognitive Deficits and Brain Abnormalities: A Pilot Study with Children and Dogs. Brain Cogn. 2008, 68, 117–127. [Google Scholar] [CrossRef]
  16. Suglia, S.F.; Gryparis, A.; Wright, R.O.; Schwartz, J.; Wright, R.J. Association of Black Carbon with Cognition among Children in a Prospective Birth Cohort Study. Am. J. Epidemiol. 2007, 167, 280–286. [Google Scholar] [CrossRef]
  17. Freire, C.; Ramos, R.; Puertas, R.; Lopez-Espinosa, M.-J.; Julvez, J.; Aguilera, I.; Cruz, F.; Fernandez, M.-F.; Sunyer, J.; Olea, N. Association of Traffic-Related Air Pollution with Cognitive Development in Children. J. Epidemiol. Community Health 2010, 64, 223–228. [Google Scholar] [CrossRef]
  18. Aronen, E.T.; Vuontela, V.; Steenari, M.-R.; Salmi, J.; Carlson, S. Working Memory, Psychiatric Symptoms, and Academic Performance at School. Neurobiol. Learn. Mem. 2005, 83, 33–42. [Google Scholar] [CrossRef]
  19. Sunyer, J.; Esnaola, M.; Alvarez-Pedrerol, M.; Forns, J.; Rivas, I.; López-Vicente, M.; Suades-González, E.; Foraster, M.; Garcia-Esteban, R.; Basagaña, X.; et al. Association between Traffic-Related Air Pollution in Schools and Cognitive Development in Primary School Children: A Prospective Cohort Study. PLoS Med. 2015, 12, e1001792. [Google Scholar] [CrossRef] [PubMed]
  20. Wu, Y.-C.; Batterman, S.A. Proximity of Schools in Detroit, Michigan to Automobile and Truck Traffic. J. Expo Sci. Environ. Epidemiol. 2006, 16, 457–470. [Google Scholar] [CrossRef] [PubMed]
  21. Pastor, M.; Morello-Frosch, R.; Sadd, J.L. Breathless: Schools, Air Toxics, and Environmental Justice in California. Policy Stud. J. 2006, 34, 337–362. [Google Scholar] [CrossRef]
  22. Mohai, P.; Kweon, B.-S.; Lee, S.; Ard, K. Air Pollution Around Schools Is Linked to Poorer Student Health and Academic Performance. Health Aff. 2011, 30, 852–862. [Google Scholar] [CrossRef]
  23. Agencia de Calidad de la Educación. Características de las Pruebas y de los Cuestionarios de Calidad y Contexto de la Educación; Ministerio de Educación, Gobierno de Chile: Santiago de Chile, Chile, 2023; pp. 1–20.
  24. Parra, S.; Bravo, M.A.; Quiroz, W.; Moreno, T.; Karanasiou, A.; Font, O.; Vidal, V.; Cereceda, F. Distribution of Trace Elements in Particle Size Fractions for Contaminated Soils by a Copper Smelting from Different Zones of the Puchuncaví Valley (Chile). Chemosphere 2014, 111, 513–521. [Google Scholar] [CrossRef] [PubMed]
  25. Homazabal Poblete, N.; Maino Ansaldo, S.; Vergara Herrera, M.; Vergara Herrera, M. Habitar En Una Zona de Sacrificio: Análisis Multiescalar de La Comuna de Puchuncaví. HS 2019, 9, 6–15. [Google Scholar] [CrossRef]
  26. Tian, S.; Liang, T.; Li, K.; Wang, L. Source and Path Identification of Metals Pollution in a Mining Area by PMF and Rare Earth Element Patterns in Road Dust. Sci. Total Environ. 2018, 633, 958–966. [Google Scholar] [CrossRef] [PubMed]
  27. US EPA Risk Assessment Guidance for Superfund Volume I Human Health Evaluation Manual (Part A) EPA/540/1-89/002, 1989; Office of Emergency and Remedial Response, U.S.: Washington, DC, USA, 1989.
  28. US EPA Soil Screening Guidance: Technical Background Document. EPA/540/R-95/128; Office of Soild Waste and Emergency Response: 1996. Available online: http://www.epa.gov/superfund/health/conmedia/soil/pdfs/attachc.pdf (accessed on 13 March 2024).
  29. US EPA Supplemental Guidance for Developing Soil Screening Level for Superfund Sites; OSWER 9355.4-24, 2001; Office of Solid Waste and Emergency Response: Washington, DC, USA, 2001.
  30. Environmental Protection Agency (US EPA). Integrated Risk Information System (IRIS); U.S. Environmental Protection Agency: Washington, DC, USA, 2011.
  31. Ferreira-baptista, L.; Miguel, E. De Geochemistry and Risk Assessment of Street Dust in Luanda, Angola: A Tropical Urban Environment. Atmos. Environ. 2005, 39, 4501–4512. [Google Scholar] [CrossRef]
  32. Li, H.; Qian, X.; Hu, W.; Wang, Y.; Gao, H. Science of the Total Environment Chemical Speciation and Human Health Risk of Trace Metals in Urban Street Dusts from a Metropolitan City, Nanjing, SE China. Sci. Total Environ. 2013, 456–457, 212–221. [Google Scholar] [CrossRef] [PubMed]
  33. Zheng, N.; Liu, J.; Wang, Q.; Liang, Z. Health Risk Assessment of Heavy Metal Exposure to Street Dust in the Zinc Smelting District, Northeast of China. Sci. Total Environ. 2010, 408, 726–733. [Google Scholar] [CrossRef] [PubMed]
  34. Chen, H.; Lu, X.; Li, L.Y. Spatial Distribution and Risk Assessment of Metals in Dust Based on Samples from Nursery and Primary Schools of Xi’an, China. Atmos. Environ. 2014, 88, 172–182. [Google Scholar] [CrossRef]
  35. US EPA Risk Assessment Guidance for Superfund. Volume I: Human Health Evaluation Manual, Part E: Supplemental Guidance for Dermal Risk Assessment. EPA/540/R/99/005, OSWER 9285.7-02EP PB99-963312. 2004. Available online: https://www.epa.gov/risk/risk-assessment-guidance-superfund-rags-part-e (accessed on 13 March 2024).
  36. EPA, U.S. Risk Assessment Guidance for Superfund (RAGS), Vol III—Part A, Process for Conducting Probabilistic Risk Assessment; Office of Emergency and Remedial Response: Washington, DC, USA, 2001.
  37. US EPA (United States Environmental Protection Agency). Highlights of the Child-specific Exposure Factors Handbook. Office of Research and Development, United States Environmental Protection Agency, Washington, DC, EPA/600/R-08/135, 2009b. Available online: http://cfpub.epa.gov/ncea/CFM/recordisplay.cfm?deid=199243 (accessed on 13 March 2024).
  38. Lim, H.; Lee, J.; Chon, H.; Sager, M. Heavy Metal Contamination and Health Risk Assessment in the Vicinity of the Abandoned Songcheon Au—Ag Mine in Korea. J. Geochem. Explor. 2008, 96, 223–230. [Google Scholar] [CrossRef]
  39. Kong, S.; Lu, B.; Ji, Y.; Zhao, X.; Chen, L.; Li, Z.; Han, B.; Bai, Z. Levels, Risk Assessment and Sources of PM 10 Fraction Heavy Metals in Four Types Dust from a Coal-Based City. Microchem. J. 2011, 98, 280–290. [Google Scholar] [CrossRef]
  40. US EPA Supplemental Guidance for Developing Soil Screening Levels for Superfund Sites; Office of Emergency and Remedial Response: Washington, DC, USA, 2002.
  41. Shao, T.; Pan, L.; Chen, Z.; Wang, R.; Li, W.; Qin, Q. Content of Heavy Metal in the Dust of Leisure Squares and Its Health Risk Assessment—A Case Study of Yanta District in Xi’an. Int. J. Environ. Res. Public Health 2018, 15, 394. [Google Scholar] [CrossRef]
  42. Karanasiou, A.A.; Siskos, P.A.; Eleftheriadis, K. Assessment of Source Apportionment by Positive Matrix Factorization Analysis on Fine and Coarse Urban Aerosol Size Fractions. Atmos. Environ. 2009, 43, 3385–3395. [Google Scholar] [CrossRef]
  43. Tertian, R.; Claisse, F. Principles of Quantitative X-ray Fluorescence Analysis; Heyden Son Ltd.: London, UK, 1982. [Google Scholar]
  44. Amato, F.; Pandolfi, M.; Escrig, A.; Querol, X.; Alastuey, A.; Pey, J.; Perez, N.; Hopke, P.K. Quantifying Roas Dust Resuspension in Urban Environment by Multilinear Engine: A Comparacion with PMF2. Atmos. Environ. 2009, 43, 2770–2780. [Google Scholar] [CrossRef]
  45. Tauler, R.; Viana, M.; Querol, X.; Alastuey, A.; Flight, R.M.; Wentzell, P.D.; Hopke, P.K. Comparison of the Results Obtained by Four Receptor Modelling Methods in Aerosol Source Apportionment Studies. Atmos. Environ. 2009, 43, 3989–3997. [Google Scholar] [CrossRef]
  46. Parra, S.; Bravo, M.A.; Quiroz, W.; Moreno, T.; Karanasiou, A.; Font, O.; Vidal, V.; Cereceda-balic, F. Chemometrics and Intelligent Laboratory Systems Source Apportionment for Contaminated Soils Using Multivariate Statistical Methods. Chemom. Intell. Lab. Syst. 2014, 138, 127–132. [Google Scholar] [CrossRef]
  47. Paatero, P.; Hopke, P. Discarding or Downweighting High-Noise Variables in Factor Analytic Models. Anal. Chim. 2003, 490, 277–289. [Google Scholar] [CrossRef]
  48. USEPA Supplemental Guidance for Developing Soil Screening Levels for Superfund Sites, Appendix A—Generic SSLs for the Residential and Commercial/Industrial Scenarios; Environmental Protection Agency: Washington, DC, USA, 2002.
  49. USEPA Exposure Factors Handbook: 2011 Edition. EPA/600/R-090/052F. Natl. Cent. Environ. Assess. 1–1466. EPA/600/R-090/052F. 2011. Available online: https://www.sciencedirect.com/science/article/pii/S0045653517305970 (accessed on 13 March 2024).
  50. Ali, M.U.; Liu, G.; Yousaf, B.; Abbas, Q.; Ullah, H.; Munir, M.A.M.; Fu, B. Pollution Characteristics and Human Health Risks of Potentially (Eco)Toxic Elements (PTEs) in Road Dust from Metropolitan Area of Hefei, China. Chemosphere 2017, 181, 111–121. [Google Scholar] [CrossRef]
  51. Muhammad, I.; Wahab, A.; Mohd, W.; Abd, A.; Sahani, M.; Khan, F. Science of the Total Environment Characteristics and Health Effect of Heavy Metals on Non-Exhaust Road Dusts in Kuala Lumpur. Sci. Total Environ. 2020, 703, 135535. [Google Scholar] [CrossRef]
  52. De Miguel, E.; Charlesworth, S.; Iribarren, I.; Chacon, E.; Charlesworth, S. Risk-Based Evaluation of the Exposure of Children to Trace Elements in Playgrounds in Madrid (Spain). Chemosphere 2007, 66, 505–513. [Google Scholar] [CrossRef]
  53. Olujimi, O.; Steiner, O.; Goessler, W. Journal of African Earth Sciences Pollution Indexing and Health Risk Assessments of Trace Elements in Indoor Dusts from Classrooms, Living Rooms and Offices in Ogun State, Nigeria. J. Afr. Earth Sci. 2015, 101, 396–404. [Google Scholar] [CrossRef]
  54. Mohamad, N.; Talib, M.; Khan, F. Ecotoxicology and Environmental Safety Source Apportionment and Health Risk Assessment of PM 10 in a Naturally Ventilated School in a Tropical Environment. Ecotoxicol. Environ. Saf. 2016, 124, 351–362. [Google Scholar] [CrossRef]
  55. Zhao, L.; Hu, G.; Yan, Y.; Yu, R.; Cui, J.; Wang, X.; Yan, Y. Source Apportionment of Heavy Metals in Urban Road Dust in a Continental City of Eastern China: Using Pb and Sr Isotopes Combined with Multivariate Statistical Analysis. Atmos. Environ. 2019, 201, 201–211. [Google Scholar] [CrossRef]
  56. Niragu, J.; Pacyna, J. Quantitative Assessment of Worldwide Contamination of Air, Water and Soils by Trace Meals. Nature 1988, 333, 134–139. [Google Scholar] [CrossRef]
  57. Pacyna, E.G.; Pacyna, J.M. Global emission of mercury from anthropogenic sources in 1995. Water Air Soil Pollut 2002, 137, 149–165. [Google Scholar] [CrossRef]
  58. Gong, X.; Chen, Z.; Luo, Z. Spatial Distribution, Temporal Variation, and Sources of Heavy Metal Pollution in Groundwater of a Century-Old Nonferrous Metal Mining and Smelting Area in China. Environ. Monit. Assess. 2014, 186, 9101–9116. [Google Scholar] [CrossRef]
  59. Men, C.; Liu, R.; Xu, F.; Wang, Q.; Guo, L.; Shen, Z. Nt Pollution Characteristics, Risk Assessment, and Source Apportionment of Heavy Metals in Road Dust in Beijing, China. Sci. Total Environ. 2018, 612, 138–147. [Google Scholar] [CrossRef]
  60. Gugamsetty, B.; Wei, H.; Liu, C.; Awasthi, A.; Hsu, S.; Tsai, C.; Roam, G.; Wu, Y.; Chen, C. Positive Matrix Factorization. Aerosol Air Qual. Res. 2012, 12, 476–491. [Google Scholar] [CrossRef]
  61. Zannoni, D.; Valotto, G.; Visin, F.; Rampazzo, G. Sources and Distribution of Tracer Elements in Road Dust: The Venice Mainland Case of Study. J. Geochem. Explor. 2016, 166, 64–72. [Google Scholar] [CrossRef]
  62. Valotto, G.; Rampazzo, G.; Visin, F.; Gonella, F.; Cattaruzza, E.; Glisenti, A.; Formenton, G.; Tieppo, P. Environmental and Traf Fi C-Related Parameters Affecting Road Dust Composition: A Multi-Technique Approach Applied to Venice Area. Atmos. Environ. 2015, 122, 596–608. [Google Scholar] [CrossRef]
  63. Zhang, Y.; Cao, S.; Xu, X.; Qiu, J.; Chen, M.; Wang, D. Metals Compositions of Indoor PM 2.5, Health Risk Assessment, and Birth Outcomes in Lanzhou, China. Environ. Monit. Assess. 2016, 188, 325. [Google Scholar] [CrossRef]
  64. Han, X.; Lu, X.; Wu, Y. Health Risks and Contamination Levels of Heavy Metals in Dusts from Parks and Squares of an Industrial City in Semi-Arid Area of China. Int. J. Environ. Res. Public Health 2017, 14, 886. [Google Scholar] [CrossRef]
  65. Men, C.; Liu, R.; Xu, L.; Wang, Q.; Guo, L.; Miao, Y.; Shen, Z. Source-Speci Fi c Ecological Risk Analysis and Critical Source Identi Fi Cation of Heavy Metals in Road Dust in Beijing, China. J. Hazard. Mater. 2020, 388, 121763. [Google Scholar] [CrossRef]
  66. Othman, M.; Talib, M.; Matsumi, Y. The Exposure of Children to PM 2.5 and Dust in Indoor and Outdoor School Classrooms in Kuala Lumpur City Centre. Ecotoxicol. Environ. Saf. 2019, 170, 739–749. [Google Scholar] [CrossRef]
  67. Al-khashman, O.A. Determination of Metal Accumulation in Deposited Street Dusts in Amman, Jordan. Environ. Geochem. Health 2007, 29, 1–10. [Google Scholar] [CrossRef]
  68. Li, X.; Xu, Z.; Guan, C.; Huang, Z. Particle Size Distributions and OC, EC Emissions from a Diesel Engine with the Application of in-Cylinder Emission Control Strategies. Fuel 2014, 121, 20–26. [Google Scholar] [CrossRef]
  69. Caserini, S.; Galante, S.; Ozgen, S.; Cucco, S.; Gregorio, K.D.; Moretti, M. Science of the Total Environment A Methodology for Elemental and Organic Carbon Emission Inventory and Results for Lombardy Region, Italy. Sci. Total Environ. 2013, 450–451, 22–30. [Google Scholar] [CrossRef]
  70. Li, P.; Lin, C.; Cheng, H.; Duan, X.; Lei, K. Ecotoxicology and Environmental Safety Contamination and Health Risks of Soil Heavy Metals around a Lead/Zinc Smelter in Southwestern China. Ecotoxicol. Environ. Saf. 2015, 113, 391–399. [Google Scholar] [CrossRef]
  71. Wang, X.; Liu, E.; Lin, Q.; Liu, L.; Yuan, H.; Li, Z. Occurrence, Sources and Health Risks of Toxic Metal (Loid) s in Road Dust from a Mega City (Nanjing) in China *. Environ. Pollut. 2020, 263, 114518. [Google Scholar] [CrossRef]
  72. Cheng, H.; Hu, Y. Lead (Pb) Isotopic Fingerprinting and Its Applications in Lead Pollution Studies in China: A Review. Environ. Pollut. 2010, 158, 1134–1146. [Google Scholar] [CrossRef]
  73. Li, Z.; Ma, Z.; Van der Kuijp, T.; Yuan, Z.; Huang, L. A Review of Soil Heavy Metal Pollution from Mines in China: Pollution and Health Risk Assessment. Sci. Total Environ. 2014, 468–469, 843–853. [Google Scholar] [CrossRef]
  74. Abdul, Q.; Zulfiqar, A.; Zeeshan, A.; Xing, C.; Khan, S.; Usman, M.; Huang, Y.; Bashir, S.; Ahmed, S.; Hussain, K.; et al. Concentrations, Pollution Indices and Health Risk Assessment of Heavy Metals in Road Dust from Two Urbanized Cities of Pakistan: Comparing Two Sampling Methods for Heavy Metals Concentration. Sustain. Cities Soc. 2020, 53, 101959. [Google Scholar] [CrossRef]
  75. Bjørklund, G.; Chartrand, M.S.; Aaseth, J. Manganese Exposure and Neurotoxic Effects in Children. Environ. Res. 2017, 155, 380–384. [Google Scholar] [CrossRef]
  76. Bouchard, M.F.; Sauvé, S.; Barbeau, B.; Legrand, M.; Brodeur, M.-È.; Bouffard, T.; Limoges, E.; Bellinger, D.C.; Mergler, D. Intellectual Impairment in School-Age Children Exposed to Manganese from Drinking Water. Environ. Health Perspect 2011, 119, 138–143. [Google Scholar] [CrossRef] [PubMed]
  77. Wasserman, G.A.; Liu, X.; Parvez, F.; Factor-Litvak, P.; Ahsan, H.; Levy, D.; Kline, J.; Van Geen, A.; Mey, J.; Slavkovich, V.; et al. Arsenic and Manganese Exposure and Children’s Intellectual Function. NeuroToxicology 2011, 32, 450–457. [Google Scholar] [CrossRef] [PubMed]
  78. Betancourt, Ó.; Tapia, M.; Méndez, I. Decline of General Intelligence in Children Exposed to Manganese from Mining Contamination in Puyango River Basin, Southern Ecuador. EcoHealth 2015, 12, 453–460. [Google Scholar] [CrossRef]
  79. Khan, K.; Wasserman, G.A.; Liu, X.; Ahmed, E.; Parvez, F.; Slavkovich, V.; Levy, D.; Mey, J.; Van Geen, A.; Graziano, J.H.; et al. Manganese Exposure from Drinking Water and Children’s Academic Achievement. NeuroToxicology 2012, 33, 91–97. [Google Scholar] [CrossRef] [PubMed]
  80. Oulhote, Y.; Mergler, D.; Barbeau, B.; Bellinger, D.C.; Bouffard, T.; Brodeur, M.-È.; Saint-Amour, D.; Legrand, M.; Sauvé, S.; Bouchard, M.F. Neurobehavioral Function in School-Age Children Exposed to Manganese in Drinking Water. Env. Health Perspect 2014, 122, 1343–1350. [Google Scholar] [CrossRef] [PubMed]
  81. Rocha-Amador, D.; Navarro, M.E.; Carrizales, L.; Morales, R.; Calderón, J. Decreased Intelligence in Children and Exposure to Fluoride and Arsenic in Drinking Water. Cad. Saúde Pública 2007, 23, S579–S587. [Google Scholar] [CrossRef] [PubMed]
  82. Vahter, M.; Skröder, H.; Rahman, S.M.; Levi, M.; Derakhshani Hamadani, J.; Kippler, M. Prenatal and Childhood Arsenic Exposure through Drinking Water and Food and Cognitive Abilities at 10 Years of Age: A Prospective Cohort Study. Environ. Int. 2020, 139, 105723. [Google Scholar] [CrossRef]
  83. Asadullah, M.N.; Chaudhury, N. Poisoning the Mind: Arsenic Contamination of Drinking Water Wells and Children’s Educational Achievement in Rural Bangladesh. Econ. Educ. Rev. 2011, 30, 873–888. [Google Scholar] [CrossRef]
  84. Rosado, J.L.; Ronquillo, D.; Kordas, K.; Rojas, O.; Alatorre, J.; Lopez, P.; Garcia-Vargas, G.; Del Carmen Caamaño, M.; Cebrián, M.E.; Stoltzfus, R.J. Arsenic Exposure and Cognitive Performance in Mexican Schoolchildren. Environ. Health Perspect 2007, 115, 1371–1375. [Google Scholar] [CrossRef] [PubMed]
  85. Von Ehrenstein, O.S.; Poddar, S.; Yuan, Y.; Mazumder, D.G.; Eskenazi, B.; Basu, A.; Hira-Smith, M.; Ghosh, N.; Lahiri, S.; Haque, R.; et al. Children’s Intellectual Function in Relation to Arsenic Exposure. Epidemiology 2007, 18, 44–51. [Google Scholar] [CrossRef] [PubMed]
  86. Curzon, M.E.J.; Spector, P.C.; Iker, H.P. An Association between Strontium in Drinking Water Supplies and Low Caries Prevalence in Man. Arch. Oral Biol. 1978, 23, 317–321. [Google Scholar] [CrossRef] [PubMed]
  87. Dawson, E.B.; Frey, M.J.; Moore, T.D.; McGanity, W.J. Relationship of Metal Metabolism to Vascular Disease Mortality Rates in Texas1. Am. J. Clin. Nutr. 1978, 31, 1188–1197. [Google Scholar] [CrossRef] [PubMed]
  88. Lv, J.; Wang, W.; Krafft, T.; Li, Y.; Zhang, F.; Yuan, F. Effects of Several Environmental Factors on Longevity and Health of the Human Population of Zhongxiang, Hubei, China. Biol. Trace Elem. Res. 2011, 143, 702–716. [Google Scholar] [CrossRef]
  89. Khandare, A.L.; Validandi, V.; Rajendran, A.; Singh, T.G.; Thingnganing, L.; Kurella, S.; Nagaraju, R.; Dheeravath, S.; Vaddi, N.; Kommu, S.; et al. Health Risk Assessment of Heavy Metals and Strontium in Groundwater Used for Drinking and Cooking in 58 Villages of Prakasam District, Andhra Pradesh, India. Environ. Geochem. Health 2020, 42, 3675–3701. [Google Scholar] [CrossRef]
  90. Rodríguez-Barranco, M.; Lacasaña, M.; Aguilar-Garduño, C.; Alguacil, J.; Gil, F.; González-Alzaga, B.; Rojas-García, A. Association of Arsenic, Cadmium and Manganese Exposure with Neurodevelopment and Behavioural Disorders in Children: A Systematic Review and Meta-Analysis. Sci. Total Environ. 2013, 454–455, 562–577. [Google Scholar] [CrossRef]
  91. Cao, Y.; Chen, A.; Radcliffe, J.; Dietrich, K.N.; Jones, R.L.; Caldwell, K.; Rogan, W.J. Postnatal Cadmium Exposure, Neurodevelopment, and Blood Pressure in Children at 2, 5, and 7 Years of Age. Environ. Health Perspect 2009, 117, 1580–1586. [Google Scholar] [CrossRef]
  92. Chen, L.; Xu, B.; Liu, L.; Luo, Y.; Zhou, H.; Chen, W.; Shen, T.; Han, X.; Kontos, C.D.; Huang, S. Cadmium Induction of Reactive Oxygen Species Activates the mTOR Pathway, Leading to Neuronal Cell Death. Free Radic. Biol. Med. 2011, 50, 624–632. [Google Scholar] [CrossRef]
  93. Tian, L.-L.; Zhao, Y.-C.; Wang, X.-C.; Gu, J.-L.; Sun, Z.-J.; Zhang, Y.-L.; Wang, J.-X. Effects of Gestational Cadmium Exposure on Pregnancy Outcome and Development in the Offspring at Age 4.5 Years. Biol. Trace Elem. Res. 2009, 132, 51–59. [Google Scholar] [CrossRef]
  94. Gustin, K.; Tofail, F.; Vahter, M.; Kippler, M. Cadmium Exposure and Cognitive Abilities and Behavior at 10 Years of Age: A Prospective Cohort Study. Environ. Int. 2018, 113, 259–268. [Google Scholar] [CrossRef]
  95. Liu, C.; Huang, L.; Huang, S.; Wei, L.; Cao, D.; Zan, G.; Tan, Y.; Wang, S.; Yang, M.; Tian, L.; et al. Association of Both Prenatal and Early Childhood Multiple Metals Exposure with Neurodevelopment in Infant: A Prospective Cohort Study. Environ. Res. 2022, 205, 112450. [Google Scholar] [CrossRef] [PubMed]
  96. Torrente, M.; Colomina, M.T.; Domingo, J.L. Metal Concentrations in Hair and Cognitive Assessment in an Adolescent Population. Biol. Trace Elem. Res. 2005, 104, 215–222. [Google Scholar] [CrossRef] [PubMed]
  97. Amine, I.; Guillien, A.; Philippat, C.; Anguita-Ruiz, A.; Casas, M.; De Castro, M.; Dedele, A.; Garcia-Aymerich, J.; Granum, B.; Grazuleviciene, R.; et al. Environmental Exposures in Early-Life and General Health in Childhood. Environ. Health 2023, 22, 53. [Google Scholar] [CrossRef] [PubMed]
  98. Bora, B.K.; Ramos-Crawford, A.L.; Sikorskii, A.; Boivin, M.J.; Lez, D.M.; Mumba-Ngoyi, D.; Mukalay Wa Mukalay, A.; Okitundu-Luwa, D.; Tshala-Katumbay, D. Concurrent Exposure to Heavy Metals and Cognition in School-Age Children in Congo-Kinshasa: A Complex Overdue Research Agenda. Brain Res. Bull. 2019, 145, 81–86. [Google Scholar] [CrossRef] [PubMed]
  99. Cheung Chung, S.W.; Kwong, K.P.; Yau, J.C.W.; Wong, W.W.K. Dietary Exposure to Antimony, Lead and Mercury of Secondary School Students in Hong Kong. Food Addit. Contam. Part A 2008, 25, 831–840. [Google Scholar] [CrossRef]
  100. Cao, S.; Duan, X.; Zhao, X.; Chen, Y.; Wang, B.; Sun, C.; Zheng, B.; Wei, F. Health Risks of Children’s Cumulative and Aggregative Exposure to Metals and Metalloids in a Typical Urban Environment in China. Chemosphere 2016, 147, 404–411. [Google Scholar] [CrossRef] [PubMed]
  101. Jiang, J.; Wu, Y.; Sun, G.; Zhang, L.; Li, Z.; Sommar, J.; Yao, H.; Feng, X. Characteristics, Accumulation, and Potential Health Risks of Antimony in Atmospheric Particulate Matter. ACS Omega 2021, 6, 9460–9470. [Google Scholar] [CrossRef] [PubMed]
  102. Imtiaz, M.; Rizwan, M.S.; Xiong, S.; Li, H.; Ashraf, M.; Shahzad, S.M.; Shahzad, M.; Rizwan, M.; Tu, S. Vanadium, Recent Advancements and Research Prospects: A Review. Environ. Int. 2015, 80, 79–88. [Google Scholar] [CrossRef]
  103. Mukherjee, B.; Patra, B.; Mahapatra, S.; Banerjee, P.; Tiwari, A.; Chatterjee, M. Vanadium—An Element of Atypical Biological Significance. Toxicol. Lett. 2004, 150, 135–143. [Google Scholar] [CrossRef]
  104. Soazo, M.; Garcia, G.B. Vanadium Exposure through Lactation Produces Behavioral Alterations and CNS Myelin Deficit in Neonatal Rats. Neurotoxicol. Teratol. 2007, 29, 503–510. [Google Scholar] [CrossRef] [PubMed]
  105. Wilk, A.; Szypulska-Koziarska, D.; Wiszniewska, B. The Toxicity of Vanadium on Gastrointestinal, Urinary and Reproductive System, and Its Influence on Fertility and Fetuses Malformations. Postep. Hig. Med. Dosw. 2017, 71, 850–859. [Google Scholar] [CrossRef] [PubMed]
  106. Basu, R.; Harris, M.; Sie, L.; Malig, B.; Broadwin, R.; Green, R. Effects of Fine Particulate Matter and Its Constituents on Low Birth Weight among Full-Term Infants in California. Environ. Res. 2014, 128, 42–51. [Google Scholar] [CrossRef] [PubMed]
Figure 1. Source profiles for dust from indoor school environments. The red points correspond to the percentages of the species distributed in each factor.
Sustainability 16 02518 g001
Figure 2. Concentration of indoor dust species as a percentage in the sampled schools.
Sustainability 16 02518 g002
Figure 3. Source profiles for dust in the outdoor school environments. The red points correspond to the percentages of the species distributed in each factor.
Sustainability 16 02518 g003
Table 1. Variables and parameters of exposure applied in the risk assessment calculations.
VariablesDefinitionChildrenReference
C dust (mg/kg)Heavy metal concentration in dust Present study
BW (kg)Body weight15[30]
IngR (mg/day)Ingestion rate200[30]
InhR (m3/day)Inhalation rate7.63[6]
EF (d/y)Exposure frequency274[31]
ED (y)Exposure duration6[32]
ATcarc (d)Averaging time for carcinogenic effect70 × 365[6,31]
ATnoncarc (d)Averaging time for non-carcinogenic effectED × 365[31]
SA (cm2)Surface area of skin exposed to dust2800[30,33]
AF (mg/cm/day)Skin adherence factor for dust0.2[31,34]
PEF (m3/kg)Particle emission factor1.36 × 109[32]
ABSAbsorption skin factor0.001
For As 0.03
[6,34,35,36,37]
CF kg m−1Conversion factor1 × 10−6[38]
Table 2. General characteristics of the schools included in the analysis of academic performance through the SIMCE test.
LocationSchoolsAdministrative DependencySocioeconomic LevelRural/Urban
QuinteroPolitécnicoPublicMedium–lowUrban
Santa FilomenaSubsidizedMediumUrban
InglésSubsidizedMediumUrban
PuchuncavíGredaPublicMediumRural
ChocotaPublicMediumUrban
HorcónPublicMedium–lowUrban
Table 3. Concentrations of trace elements in indoor dust from the analyzed schools, both in summer and winter seasons.
CitySchools (Summer)mg/kgLiBeVCrMnCoNiZnAsSeSrMoCdSbTlPbCu
PUCHUNCAVIGreda Alercesmean19.62.6396.6490.2665.336.7119.81823.0331.9317.0252.9123.115.1108.61.1324.544,187.6
máx.20.74.1397.1495.0715.539.2134.11860.7332.5319.8254.0124.916.6110.01.2330.145,572.7
min17.81.7396.0482.1614.632.1101.31750.9331.4312.5251.1121.512.8107.01.0321.742,318.8
Gredamean19.81.5368.1373.4856.131.1112.61030.4147.6164.1272.654.36.435.10.3190.427,086.2
máx.22.11.6369.8377.1876.331.7115.71035.7148.6168.3287.158.26.737.90.3197.928,782.7
min17.61.3365.3366.6831.130.7109.61021.9146.9156.3258.950.06.131.20.3183.825,070.4
Básica Chocotamean12.11.8342.8439.9742.213.1150.4529.347.082.6295.58.11.512.00.251.8428.2
máx.13.91.9346.3447.2749.913.9151.2532.249.286.5305.98.71.612.50.253.3445.4
min10.71.7338.5435.1733.612.0149.4525.343.579.1282.47.21.311.40.250.8411.9
Horcónmean12.21.4392.6481.3889.513.8164.2483.366.286.8291.34.61.06.30.241.8338.9
máx.12.51.7394.7489.0894.014.4168.0489.169.487.8295.74.71.16.40.242.9344.8
min11.61.2389.9476.6886.813.2159.4480.363.886.1285.24.50.96.10.139.9331.7
QUINTEROSanta Filomenamean14.61.3424.7535.2763.014.9127.2598.043.193.2252.56.92.312.20.265.91137.8
máx.15.71.5434.3541.1764.715.2133.0613.845.294.2257.17.72.312.80.267.81151.8
min13.61.0415.1526.9762.014.7121.2589.741.492.5246.26.02.211.80.264.91118.4
Inglés Quinteromean19.21.1420.9478.8884.916.1146.2625.545.896.7343.54.90.99.60.245.6443.6
máx.19.81.3427.2487.6899.217.4148.3636.749.298.7349.35.40.99.60.247.0450.3
min18.91.0415.0468.1875.715.2142.1614.942.794.6332.54.40.89.50.244.6438.8
Politécnico Quinteromean13.22.0405.8436.8965.015.4148.1607.743.095.2277.24.31.49.20.266.3626.2
máx.14.52.0409.2447.3966.916.0152.8617.345.398.9282.04.41.69.60.367.2635.3
min12.41.9403.1431.0961.815.2144.8601.240.589.9274.24.21.28.80.264.5620.2
The Faromean13.51.9482.5594.8685.614.1179.6199.355.934.5409.74.70.86.90.412.8143.3
máx.15.42.0492.9616.7716.015.8194.5205.360.036.9414.54.80.97.30.513.4146.6
min10.71.8472.7573.2649.711.3168.2189.751.930.8406.74.60.76.70.412.0140.6
CitySchools
(Spring)
mg/kgLiBeVCrMnCoNiZnAsSeSrMoCdSbTlPbCu
PUCHUNCAVIGreda Alercesmean16.51.6341.1435.7636.229.1119.41753.6278.2300.6237.798.912.690.90.5319.254,081.0
máx.17.31.6366.7469.6641.429.9128.61866.0286.9316.2250.8105.813.396.20.5330.954,740.5
min15.51.6293.2412.2626.927.7105.61629.1265.2284.9219.991.011.484.20.5299.953,056.9
Gredamean19.42.1357.5365.7847.129.8103.8949.8183.0172.8244.666.77.736.00.4186.59843.2
máx.20.02.2358.6368.6853.430.2109.8956.0185.7173.3248.669.87.937.40.4189.310,072.0
min18.42.0356.8362.0841.929.596.6942.9181.5172.0238.063.07.334.80.4184.89706.9
Básica Chocotamean14.21.9418.4505.4646.811.3162.4617.452.1113.6297.34.71.27.30.253.5276.5
máx.15.31.9421.6510.1659.111.8165.3623.553.4115.3309.64.71.27.80.255.3286.2
min13.61.9416.0503.0639.610.7160.6611.651.2112.6288.24.51.17.10.252.4258.4
Básica Horcónmean12.01.7330.5473.2832.011.4137.7389.439.571.0325.02.60.66.40.244.4364.0
máx.12.61.9336.8478.7835.611.6139.8394.840.771.1329.93.20.76.50.245.6368.3
min11.21.6319.8465.2825.811.2136.0381.838.570.9321.22.30.56.20.243.2361.6
QUINTEROSanta Filomenamean9.31.7427.8545.2635.811.796.1728.676.4148.0257.26.01.410.00.267.51450.6
máx.9.61.8438.6548.9657.612.9100.0752.977.7156.7262.76.61.510.90.269.71489.5
min9.21.6421.5541.7624.710.793.0710.974.5142.5251.85.51.29.30.264.01429.4
Inglés Quinteromean16.61.9351.5374.0790.212.2144.2650.644.9119.0354.73.71.09.90.267.6441.8
máx.17.92.0356.8375.5794.612.9145.3655.847.0122.2356.23.91.210.50.269.6444.2
min15.21.8346.5373.1781.610.7142.9647.143.8117.2353.23.60.99.40.264.5438.2
Politécnico Quinteromean9.11.7293.5307.6873.110.9157.4620.652.9114.2254.43.21.78.60.262.5294.2
máx.9.41.8296.8310.8877.511.5161.2628.954.2116.8259.33.31.98.80.263.7299.9
min8.71.4291.1305.5865.510.1154.7615.051.6111.8251.23.21.68.30.260.9289.7
The Faromean11.51.6334.8363.3732.013.1146.3339.443.054.3259.02.60.66.10.321.2179.4
máx.12.41.7338.5367.6738.814.1149.0345.443.356.8260.42.80.76.50.421.8183.9
min11.01.6328.0360.7720.112.4142.5335.942.552.3257.92.20.55.80.320.3175.9
Table 4. Concentrations of trace elements in outdoor dust from the analyzed schools, both in summer and winter seasons.
CitySchool (Summer)mg/kgLiBeVCrMnCoNiZnAsSeSrMoCdSbTlPbCu
PUCHUNCAVIGreda Alercesmean17.01.2383.3479.1577.716.1104.6823.495.4138.8237.144.15.036.10.4127.812,484.8
máx.17.81.3392.7488.3578.717.3107.5825.498.0142.9239.447.85.339.30.4129.814,075.7
min16.11.1373.3464.7577.015.2101.2821.493.7134.7234.241.04.634.00.4125.411294.5
Gredamean21.31.4371.1429.9852.228.9112.7991.8143.0160.1280.251.55.633.30.3172.133,233.4
máx.22.91.5373.0437.6856.429.5114.5997.8146.1161.7287.252.85.935.60.3172.935,387.2
min20.41.3368.0424.1848.528.0110.3983.4140.3158.1271.249.95.430.40.3170.432,009.2
Básica Chocotamean23.40.9367.5447.4937.313.4141.4316.847.347.1317.06.01.013.60.237.9235.9
máx.24.60.9373.9455.6940.914.7146.3319.949.148.9317.86.31.014.30.238.4242.8
min22.30.7360.0440.1934.212.7138.9311.345.344.9315.85.81.012.30.237.3231.6
Básica Horcónmean11.31.7383.1403.2875.212.089.0428.035.865.6382.42.00.521.00.2163.3140.2
máx.11.41.8386.0407.1881.212.091.3428.936.166.6383.02.10.521.40.2166.3144.3
min11.31.7381.7400.2872.212.087.8426.235.763.7381.31.90.520.70.2160.4132.3
QUINTEROSanta Filomenamean18.01.2427.8591.2618.111.987.2186.021.431.0147.70.70.29.90.217.8111.6
máx.18.21.2434.0596.1619.312.089.2187.622.132.0149.20.70.210.70.218.6114.8
min17.81.2423.3584.1617.111.785.0184.920.229.9146.50.60.29.50.217.2106.6
Inglés Quinteromean12.91.2392.4449.9827.213.7129.4421.735.364.7272.52.60.810.40.262.6228.4
máx.13.61.4394.6458.7829.214.5130.7425.636.066.0273.92.80.810.60.263.1233.3
min12.21.1390.2444.4825.713.3128.5419.334.362.6271.62.50.710.20.262.3222.9
Politécnico Quinteromean14.12.1407.5463.8887.015.0153.4395.638.661.9287.54.90.711.20.270.4286.8
máx.14.62.3410.8466.3890.115.4158.1402.739.463.6290.95.00.811.60.271.2295.8
min13.32.0404.2461.4884.914.4150.3392.038.259.0283.74.80.710.90.269.7281.0
The Faromean15.42.1344.6393.61039.217.1103.1246.534.942.2227.81.60.44.70.222.4137.4
máx.15.72.1351.4399.91042.517.8104.6249.435.644.6229.41.70.44.80.323.4139.8
min14.81.9340.6388.21036.216.2101.3243.334.139.8224.61.50.44.60.221.3134.9
CitySchool (Spring)mg/kgLiBeVCrMnCoNiZnAsSeSrMoCdSbTlPbCu
PUCHUNCAVIGreda Alercesmean13.11.7385.3453.3648.617.193.2623.291.5102.7252.830.23.526.10.2102.612,535.9
máx.14.11.7388.5455.5650.817.796.9625.292.1103.1254.431.13.726.70.2106.213,314.3
min12.51.6382.8451.0646.416.690.5620.391.0101.9251.429.83.525.60.2100.111,260.6
Gredamean18.91.4327.0451.2733.711.9118.7996.164.0164.4288.212.11.710.20.348.85099.9
máx.19.31.5334.8455.5734.412.7120.4997.567.7167.1288.712.61.910.60.349.95249.8
min18.21.4321.2448.1732.911.2116.9993.560.5163.0287.211.21.59.90.347.34987.7
Básica Chocotamean16.82.6414.5426.21027.313.4143.0307.645.567.4302.93.10.611.50.334.3254.2
máx.17.02.9419.2429.01032.914.0145.9309.545.969.5307.73.10.711.90.334.5259.3
min16.52.4411.5422.61023.712.6141.1306.145.366.1299.93.10.611.10.334.2248.1
Básica Horcónmean12.31.9353.2399.0744.910.8166.11062.045.0182.6279.84.31.36.80.336.6369.1
máx.12.41.9355.7401.1748.710.9167.11067.445.3185.2288.24.41.36.90.339.0371.2
min12.11.9350.6397.9740.810.7164.61056.344.6180.1272.24.21.26.70.335.3365.1
QUINTEROSanta Filomena Schoomean11.91.8367.8363.1739.911.8110.9267.242.152.8266.42.80.67.10.232.6244.7
máx.12.41.9369.0366.1741.112.3111.9269.243.153.3269.62.80.67.50.233.9248.0
min11.51.7366.9361.0738.211.3109.9265.541.552.3262.32.80.66.80.230.3240.6
Inglés Quintero Schoolmean13.61.7367.5375.9882.812.7123.3402.042.577.5356.512.22.014.80.289.9253.5
máx.14.61.8369.7378.8885.813.2126.9403.044.578.8359.912.82.215.30.290.7257.1
min12.21.7363.4371.9878.912.4120.2400.541.076.6353.911.71.814.40.289.0248.9
Politécnico Quintero Schoolmean10.11.8326.3486.9819.115.1155.8262.331.561.9235.51.50.46.40.224.9210.4
máx.10.71.9328.5490.6820.715.8158.2263.832.263.5236.41.60.56.50.225.7213.6
min9.71.8324.7482.3817.514.7152.0259.831.160.2234.61.40.46.30.224.0205.3
The Faro Schoolmean10.71.9393.7421.2969.315.9116.6242.235.543.6256.01.50.35.90.223.5313.2
máx.11.41.9397.2422.2976.316.2117.9244.036.744.5258.91.60.36.00.224.9318.4
min10.11.8391.1419.9963.515.5114.5241.234.642.2250.11.40.35.80.221.7310.4
Table 5. Hazard quotient (HQ) and hazard index (HI) for non-carcinogenic risk to schoolchildren in the cities of Puchuncaví and Quintero (indoor dust). Reference dose values (relative toxicity values (RfD)) for the different exposure routes were derived from the US EPA [7,38,50].
CitySchoolsHQVCrNiZnAsSrCdPbCuHIƩ HI
PUCHUNCAVIGreda AlercesHQ ing2.06 × 10−56.05 × 10−52.34 × 10−62.34 × 10−63.98 × 10−41.60 × 10−75.42 × 10−73.60 × 10−54.81 × 10−41.00 × 10−32.65
HQ inh 4.53 × 10−31.62 × 10−61.67 × 10−62.83 × 10−4 3.87 × 10−62.56 × 10−53.44 × 10−45.19 × 10−3
HQ der1.48 × 10−12.59 × 10−16.21 × 10−48.35 × 10−42.05.73 × 10−51.55 × 10−21.72 × 10−21.15 × 10−12.64
HI = ƩHQ1.48 × 10−12.64 × 10−16.25 × 10−48.39 × 10−42.05.75 × 10−51.55 × 10−21.72 × 10−21.16 × 10−12.65
GredaHQ ing2.03 × 10−54.83 × 10−52.12 × 10−61.29 × 10−62.16 × 10−41.69 × 10−72.75 × 10−72.11 × 10−51.81 × 10−44.90 × 10−41.55
HQ inh 3.61 × 10−31.47 × 10−69.23 × 10−71.54 × 10−4 1.97 × 10−61.50 × 10−51.29 × 10−43.92 × 10−3
HQ der1.45 × 10−12.07 × 10−15.62 × 10−44.62 × 10−41.16.04 × 10−57.88 × 10−31.01 × 10−24.31 × 10−21.54
HI1.45 × 10−12.11 × 10−15.65 × 10−44.65 × 10−41.16.06 × 10−57.88 × 10−31.01 × 10−24.34 × 10−21.55
Básica ChocotaHQ ing2.13 × 10−56.17 × 10−53.06 × 10−67.49 × 10−76.47 × 10−51.94 × 10−75.19 × 10−85.89 × 10−63.45 × 10−61.61 × 10−47.75 × 10−1
HQ inh 1.22 × 10−25.59 × 10−61.41 × 10−61.21 × 10−4_9.75 × 10−71.10 × 10−56.48 × 10−61.23 × 10⁻²
HQ der1.52 × 10−12.65 × 10−18.12 × 10−42.68 × 10−43.39 × 10−16.92 × 10−51.49 × 10−32.81 × 10−38.23 × 10−47.62 × 10⁻¹
HI1.52 × 10−12.77 × 10−12.42 × 10−38.46 × 10−49.95 × 10−16.94 × 10−51.49 × 10−32.83 × 10−38.33 × 10−47.75 × 10⁻¹
Básica HorcónHQ ing2.02 × 10−56.23 × 10−52.96 × 10−65.70 × 10−76.90 × 10−52.01 × 10−73.19 × 10−84.83 × 10−63.44 × 10−61.64 × 10−47.83 × 10−1
HQ inh 4.67 × 10−32.05 × 10−64.07 × 10−74.91 × 10−5 2.28 × 10−73.43 × 10−62.46 × 10−64.72 × 10−3
HQ der1.45 × 10−12.67 × 10−17.83 × 10−42.04 × 10−43.61 × 10−17.20 × 10−59.13 × 10−42.30 × 10−38.21 × 10−47.78 × 10⁻¹
HI1.45 × 10−12.72 × 10−17.88 × 10−42.05 × 10−43.61 × 10−17.22 × 10−59.13 × 10−42.31 × 10−38.27 × 10−47.83 × 10⁻¹
QUINTEROSanta FilomenaHQ ing2.39 × 10−57.05 × 10−52.19 × 10−68.66 × 10−77.80 × 10−51.66 × 10−77.17 × 10−87.47 × 10−61.27 × 10−51.96 × 10−48.97 × 10−1
HQ inh 5.28 × 10−31.52 × 10−66.18 × 10−75.55 × 10−5 5.12 × 10−75.30 × 10−69.05 × 10−65.35 × 10−3
HQ der1.71 × 10−13.03 × 10−15.79 × 10−43.10 × 10−44.08 × 10−15.95 × 10−52.05 × 10−33.56 × 10−33.02 × 10−38.91 × 10⁻¹
HI1.71 × 10−13.08 × 10−15.83 × 10−43.11 × 10−44.08 × 10−15.97 × 10−52.05 × 10−33.57 × 10−33.04 × 10−38.97 × 10⁻¹
Inglés QuinteroHQ ing2.16 × 10−55.57 × 10−52.84 × 10−68.33 × 10−75.92 × 10−52.28 × 10−73.76 × 10−86.33 × 10−64.34 × 10−61.51 × 10−47.14 × 10−1
HQ inh 4.17 × 10−31.97 × 10−65.95 × 10−74.22 × 10−5 2.68 × 10−74.50 × 10−63.10 × 10−64.22 × 10−3
HQ der1.55 × 10−12.39 × 10−17.53 × 10−42.98 × 10−43.10 × 10−18.15 × 10−51.07 × 10−33.02 × 10−31.03 × 10−37.10 × 10⁻¹
HI1.55 × 10−12.43 × 10−17.58 × 10−42.99 × 10−43.10 × 10−18.18 × 10−51.07 × 10−33.03 × 10−31.04 × 10−37.14 × 10⁻¹
Politécnico QuinteroHQ ing1.96 × 10−54.86 × 10−52.99 × 10−68.02 × 10−76.26 × 10−51.74 × 10−76.25 × 10−87.20 × 10−64.51 × 10−61.47 × 10−46.88 × 10−1
HQ inh 3.64 × 10−32.07 × 10−65.73 × 10−74.46 × 10−5 4.46 × 10−75.11 × 10−63.22 × 10−63.70 × 10−3
HQ der1.40 × 10−12.09 × 10−17.93 × 10−42.87 × 10−43.28 × 10−16.21 × 10−51.79 × 10−33.44 × 10−31.07 × 10−36.84 × 10⁻¹
HI1.40 × 10−12.12 × 10−17.98 × 10−42.88 × 10−43.28 × 10−16.22 × 10−51.79 × 10−33.45 × 10−31.08 × 10−36.88 × 10⁻¹
FaroHQ ing2.29 × 10−56.26 × 10−53.19 × 10−63.52 × 10−76.46 × 10−52.18 × 10−72.86 × 10−81.90 × 10−61.58 × 10−61.57 × 10−47.78 × 10−1
HQ inh_4.68 × 10−32.21 × 10−62.51 × 10−74.59 × 10⁻⁵ 2.04 × 10−71.35 × 10−61.13 × 10−64.74 × 10−3
HQ der1.64 × 10−12.69 × 10−18.46 × 10−41.26 × 10−443.38 × 10−17.81 × 10−58.18 × 10−49.08 × 10−43.77 × 10−47.73 × 10−1
HI1.64 × 10−12.73 × 10−18.51 × 10−41.26 × 10−43.38 × 10−17.83 × 10−58.18 × 10−49.11 × 10−43.79 × 10−47.78 × 10⁻¹
Relative toxicity valuesRfDIng7.00 × 10−13.00 × 10−32.00 × 10−23.00 × 10−13.00 × 10−46.00 × 10−11.00 × 10−23.50 × 10−34.00 × 10−2
RfDInh_2.86 × 10−52.06 × 10−23.00 × 10−13.01 × 10⁻⁴_1.00 × 10−33.52 × 10−34.00 × 10−2
RfDDer7.00 × 10−55.00 × 10−55.40 × 10−36.00 × 10−21.23 × 10−41.20 × 10−12.50 × 10−55.25 × 10−41.20 × 10−2
Table 6. Hazard quotient (HQ) and hazard index (HI) for non-carcinogenic risk to schoolchildren in the cities of Puchuncaví and Quintero (outdoor dust).
CitySchoolsHQVCrNiZnAsSrCdPbCuHIƩ HI
PUCHUNCAVIGreda AlercesHQ ing1.4 × 10−54.0 × 10−51.3 × 10−68.0 × 10−58.0 × 10−51.1 × 10−71.1 × 10−78.5 × 10−68.0 × 10−53.0 × 10−44.14 × 10−1
HQ inh 3.0 × 10−38.8 × 10−74.4 × 10−75.7 × 10−5 7.9 × 10−76.0 × 10−65.7 × 10−53.1 × 10−3
HQ der5.8 × 10−29.8 × 10−21.9 × 10−41.3 × 10−42.4 × 10−12.1 × 10−51.8 × 10−32.3 × 10−31.1 × 10−24.1 × 10⁻¹
HI5.8 × 10−21.0 × 10−11.9 × 10−42.1 × 10−42.4 × 10−12.2 × 10−51.8 × 10−32.3 × 10−31.1 × 10−24.1 × 10⁻¹
GredaHQ ing1.3 × 10−53.8 × 10−51.5 × 10−68.9 × 10−58.9 × 10−51.2 × 10−79.4 × 10−88.1 × 10−61.2 × 10−43.6 × 10−44.4 × 10−1
HQ inh 2.8 × 10−31.0 × 10−66.1 × 10−76.3 × 10−5 6.7 × 10−75.8 × 10−68.8 × 10−53.0 × 10−3
HQ der5.2 × 10−29.3 × 10−22.25 × 10−41.7 × 10−42.7 × 10−12.5 × 10−51.5 × 10−32.2 × 10−31.7 × 10−24.3 × 10⁻¹
HI5.2 × 10−29.6 × 10−22.3 × 10−42.6 × 10−42.7 × 10−12.5 × 10−51.5 × 10−32.2 × 10−31.7 × 10−24.4 × 10⁻¹
Básica ChocotaHQ ing1.4 × 10−53.7 × 10−51.8 × 10−64.0 × 10−54.0 × 10−51.3 × 10−72.1 × 10−82.7 × 10−61.6 × 10−61.4 × 10−42.74 × 10−1
HQ inh 2.8 × 10−31.3 × 10−61.9 × 10−72.8 × 10−5 1.5 × 10−71.9 × 10−61.1 × 10⁻⁶ 62.8 × 10⁻³
HQ der5.9 × 10−29.2 × 10−22.8 × 10−45.5 × 10−51.2 × 10−12.7 × 10−53.4 × 10−47.2 × 10−42.1 × 10−42.7 × 10⁻¹
HI5.9 × 10−29.5 × 10−22.8 × 10−49.5 × 10−51.2 × 10−12.7 × 10−53.4 × 10−47.3 × 10−42.2 × 10−42.7 × 10⁻¹
Básica HorcónHQ ing1.4 × 10−53.4 × 10−51.6 × 10−63.5 × 10−53.5 × 10−51.4 × 10−72.2 × 10−87.3 × 10−61.6 × 10−61.3 × 10−42.5 × 10−1
HQ inh 2.6 × 10−31.1 × 10−64.6 × 10−72.5 × 10−5 1.6 × 10−75.2 × 10−61.2 × 10−62.6 × 10−3
HQ der5.5 × 10−28.4 × 10−22.5 × 10−41.3 × 10−41.0 × 10−12.9 × 10−53.7 × 10−42.0 × 10−32.2 × 10−42.5 × 10⁻¹
HI5.5 × 10−28.7 × 10−22.5 × 10−41.7 × 10−41.0 × 10−12.9 × 10−53.7 × 10−42.0 × 10−32.3 × 10−42.5 × 10⁻¹
QUINTEROSanta FilomenaHQ ing1.5 × 10−54.1 × 10−51.3 × 10−62.7 × 10−52.7 × 10−58.9 × 10−81.0 × 10−81.9 × 10−61.1 × 10−61.1 × 10−42.5 × 10−1
HQ inh 3.1 × 10−38.8 × 10−71.4 × 10−71.9 × 10−5 7.1 × 10−81.3 × 10−68.2 × 10−73.1 × 10−3
HQ der6.0 × 10−21.0 × 10−11.93 × 10−44. × 10−58.1 × 10−21.8 × 10−51.6 × 10−45.1 × 10−41.6 × 10−42.4 × 10−1
HI6.0 × 10−21.0 × 10−12.0 × 10−46.7 × 10−58.2 × 10−21.8 × 10−51.6 × 10−45.1 × 10−41.6 × 10−42.5 × 10⁻¹
Inglés QuinteroHQ ing1.4 × 10−53.5 × 10−51.6 × 10−63.3 × 10−53.3 × 10−51.3 × 10−73.6 × 10−85.6 × 10−61.6 × 10−61.3 × 10−42.5 × 10−1
HQ inh 2.7 × 10−31.1 × 10−62.5 × 10−72.4 × 10−5 2.6 × 10−74.0 × 10−61.1 × 10−62.7 × 10−3
HQ der5.7 × 10−28.69 × 10−22.5 × 10−47.2 × 10−51.0 × 10−12.8 × 10−55.9 × 10−41.5 × 10−32.1 × 10−42.5 × 10⁻¹
HI5.7 × 10−29.0 × 10−22.5 × 10−41.1 × 10−41.0 × 10−12.8 × 10−55.9 × 10−41.5 × 10−32.1 × 10−42.5 × 10⁻¹
Politécnico QuinteroHQ ing1.3 × 10−54.1 × 10−52.0 × 10−63.0 × 10−53.0 × 10−51.1 × 10−71.5 × 10873.5 × 10−61.6 × 10−61.2 × 10−42.50 × 10⁻¹
HQ inh 3.1 × 10−31.4 × 10−62.0 × 10−72.1 × 10−5 1.1 × 10−72.5 × 10−61.1 × 10−63.1 × 10−3
HQ der5.5 × 10−21.0 × 10−13.0 × 10−45.8 × 10−59.0 × 10−22.3 × 10−52.4 × 10−49.5 × 10−42.2 × 10−42.5 × 10⁻¹
HI5.5 × 10−21.0 × 10−13.0 × 10−48.8 × 10−59.0 × 10−22.3 × 10−52.4 × 10−49.6 × 10−42.2 × 10−42.5 × 10⁻¹
FaroHQ ing1.4 × 10−53.5 × 10−51.4 × 10−63.0 × 10−53.0 × 10−51.0 × 10−78.2 × 10−91.7 × 10−61.4 × 10−61.1 × 10−42.4 × 10−1
HQ inh 2.6 × 10−39.8 × 10−71.5 × 10−72.1 × 10−5 5.8 × 10−81.2 × 10−61.0 × 10−62.6 × 10−3
HQ der5.5 × 10−28.6 × 10−22.1 × 10−44.3 × 10−59.0 × 10−22.1 × 10−51.3 × 10−44.6 × 10−42.0 × 10−42.3 × 10⁻¹
HI5.5 × 10−28.8 × 10−22.2 × 10−47.3 × 10−59.0 × 10−22.1 × 10−51.3 × 10−44.6 × 10−42.0 × 10−42.4 × 10⁻¹
Table 7. Incremental lifetime cancer risk (ILTCR) for indoor and outdoor dust inhalation exposure routes among the analyzed schools.
CitySchoolsILTCR Children (Indoor Dust)ILTCR Children (Outdoor Dust)
CrNiAsSrCdPbƩILTCRCrNiAsSrCdPbƩILTCR
PUCHUNCAVIGreda Alerces4.66 × 10−72.41 × 10−91.10 × 10−75.00 × 10−112.09 × 10−93.24 × 10−105.8 × 10−74.7 × 10−72.0 × 10−93.4 × 10−85.0 × 10−116.5 × 10−101.2 × 10−105.1 × 10⁻⁷
Greda3.72 × 10−72.18 × 10−95.98 × 10−82.02 × 10−101.06 × 10−91.90 × 10−104.4 × 10−74.4 × 10−72.3 × 10−93.7 × 10−82.0 × 10−105.5 × 10−101.1 × 10−104.8 × 10⁻⁷
Básica Chocota4.76 × 10−73.15 × 10−91.79 × 10−81.17 × 10−102.00 × 10−105.30 × 10−115.0 × 10−74.4 × 10−72.9 × 10−91.7 × 10−86.4 × 10−111.2 × 10−103.6 × 10−114.6 × 10⁻⁷
Básica Horcón4.80 × 10−73.04 × 10−91.91 × 10−88.89 × 10−111.23 × 10−104.34 × 10−115.0 × 10−74.0 × 10−72.6 × 10−91.5 × 10−81.5 × 10−101.3 × 10−101.0 × 10−104.2 × 10⁻⁷
QUINTEROSanta Filomena5.44 × 10−72.25 × 10−92.16 × 10−81.35 × 10−102.76 × 10−106.72 × 10−115.7 × 10−74.8 × 10−72.0 × 10−91.1 × 10−84.6 × 10−115.8 × 10−112.5 × 10−114.9 × 10⁻⁷
Inglés Quintero4.29 × 10−72.92 × 10−91.64 × 10−81.30 × 10−101.45 × 10−105.70 × 10−114.5 × 10−74.2 × 10−72.5 × 10−91.4 × 10−88.4 × 10−112.1 × 10−107.7 × 10−114.3 × 10⁻⁷
Politécnico Quintero3.75 × 10−73.08 × 10−91.74 × 10−81.25 × 10−102.41 × 10−106.48 × 10−114.0 × 10−74.8 × 10−73.1 × 10−91.3 × 10−86.7 × 10−118.7 × 10−114.8 × 10−114.9 × 10⁻⁷
The Faro4.82 × 10−73.28 × 10−91.79 × 10−85.49 × 10−111.10 × 10−101.71 × 10−115.0 × 10−74.1 × 10−72.2 × 10−91.3 × 10−85.0 × 10−114.8 × 10−112.3 × 10−114.3 × 10⁻⁷
Slope factor values used for calculation of hazard indices.CSF4.20 × 10−18.40 × 10−11.51 × 10−18.50 × 10−36.304.20 × 10−2CSF4.2 × 10−18.40 × 10−11.51 × 10−18.50 × 10−36.304.20 × 10−2
Table 8. Result of econometric model for the indoor case.
Indoor Model Simce_PerformanceUnstandardized CoefficientsStandardized CoefficientstSig.
BStd. ErrorBeta
(Constant)415.6224.285 97.0030.007
Mn−0.2170.004−1.247−49.2820.013
Co10.5110.1814.14558.0530.011
As−0.7320.009−1.762−83.0640.008
Sr−0.3480.009−1.258−40.1170.016
Cd−14.5710.664−1.879−21.9540.029
R2 = 92%; Fstatistic: 7489.88: p_valor: 0.009.
Table 9. Result of econometric model for the outdoor case.
Outdoor Model Simce_PerformanceUnstandardized CoefficientsStandardized CoefficientstSig.
BStd. ErrorBeta
(Constant)412.90130.976 13.3300.006
Mn−0.1190.012−0.973−9.9410.010
Cd11.6470.6861.40016.9680.003
Sb−1.9360.143−1.075−13.5620.005
V−0.1650.056−0.297−2.9520.098
R2 = 96%; Fstatistic: 138.706: p_valor: 0.007.
Disclaimer/Publisher’s Note: The statements, opinions and data contained in all publications are solely those of the individual author(s) and contributor(s) and not of MDPI and/or the editor(s). MDPI and/or the editor(s) disclaim responsibility for any injury to people or property resulting from any ideas, methods, instructions or products referred to in the content.

