
Decoupling Economic Growth from Carbon Emissions in the Yangtze River Economic Belt of China: From the Coordinated Regional Development Perspective

Abstract
1. Introduction
2. Literature Review
3. Methodology and Data
3.1. Thiel Index
3.2. Decoupling Model
3.3. Decomposition Analysis
3.4. Data Sources and Processing
4. Results and Discussions
4.1. Decoupling Analysis of Carbon Emissions
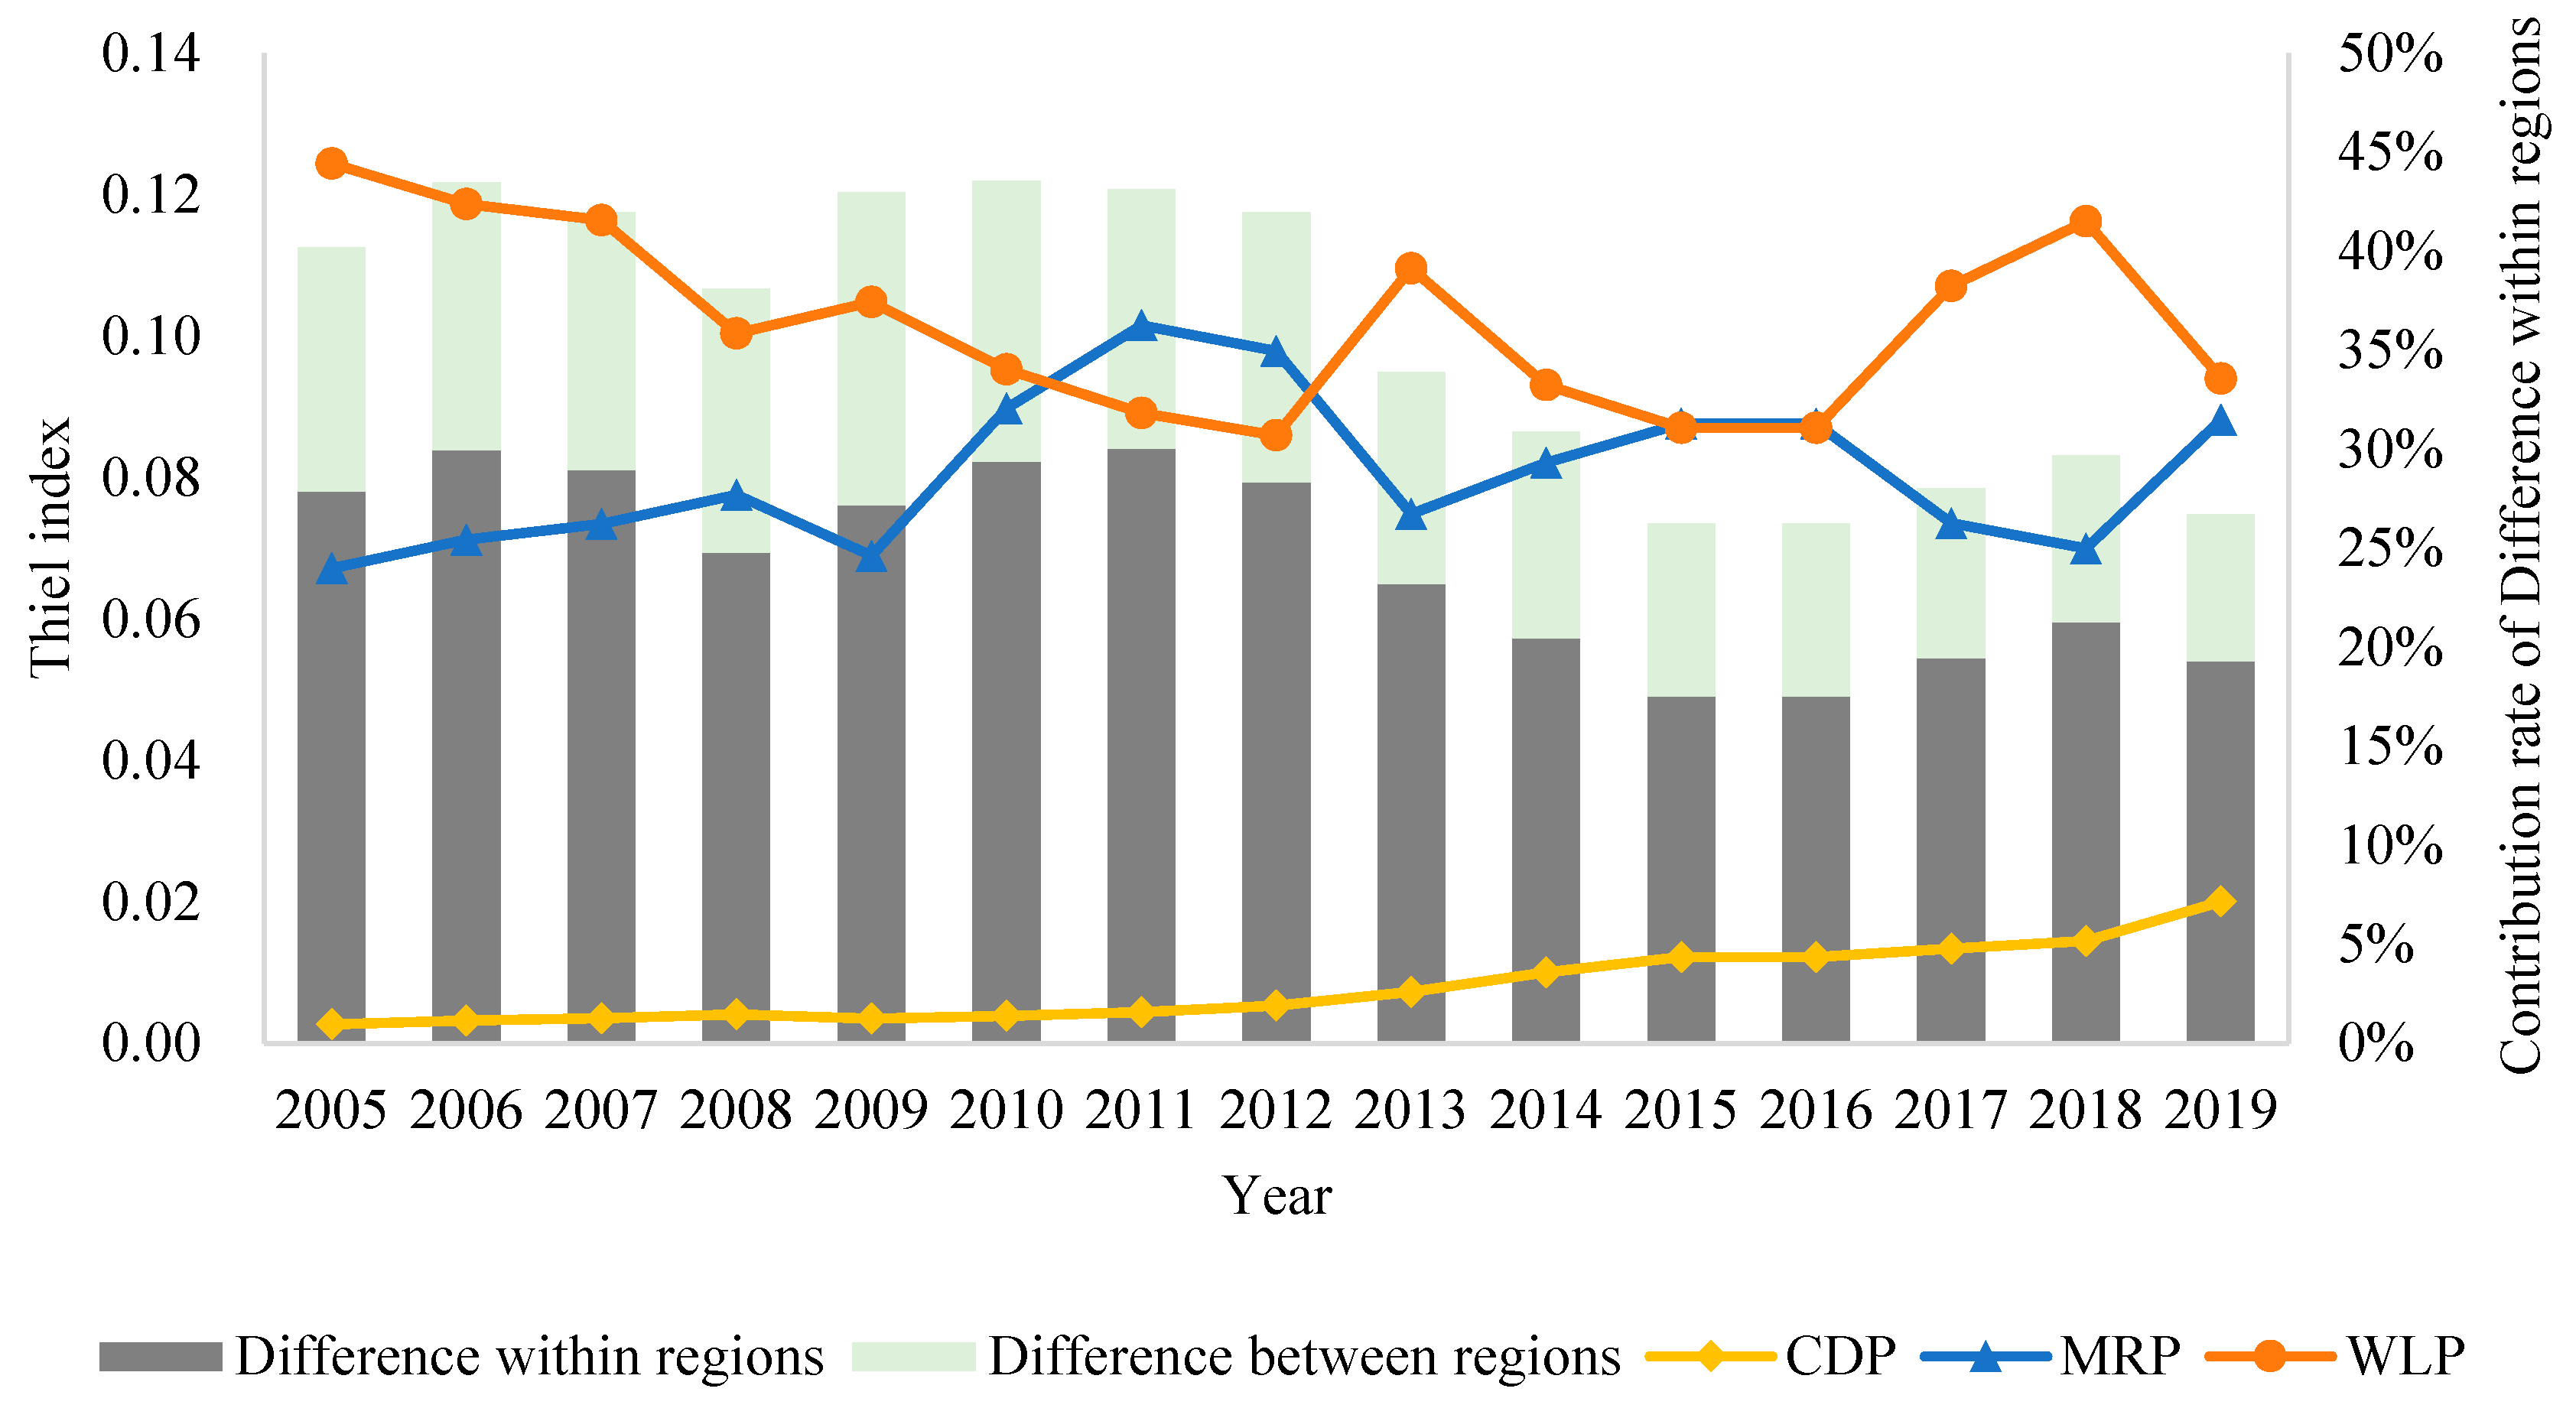
4.1.1. Regional Differences in Carbon Intensity
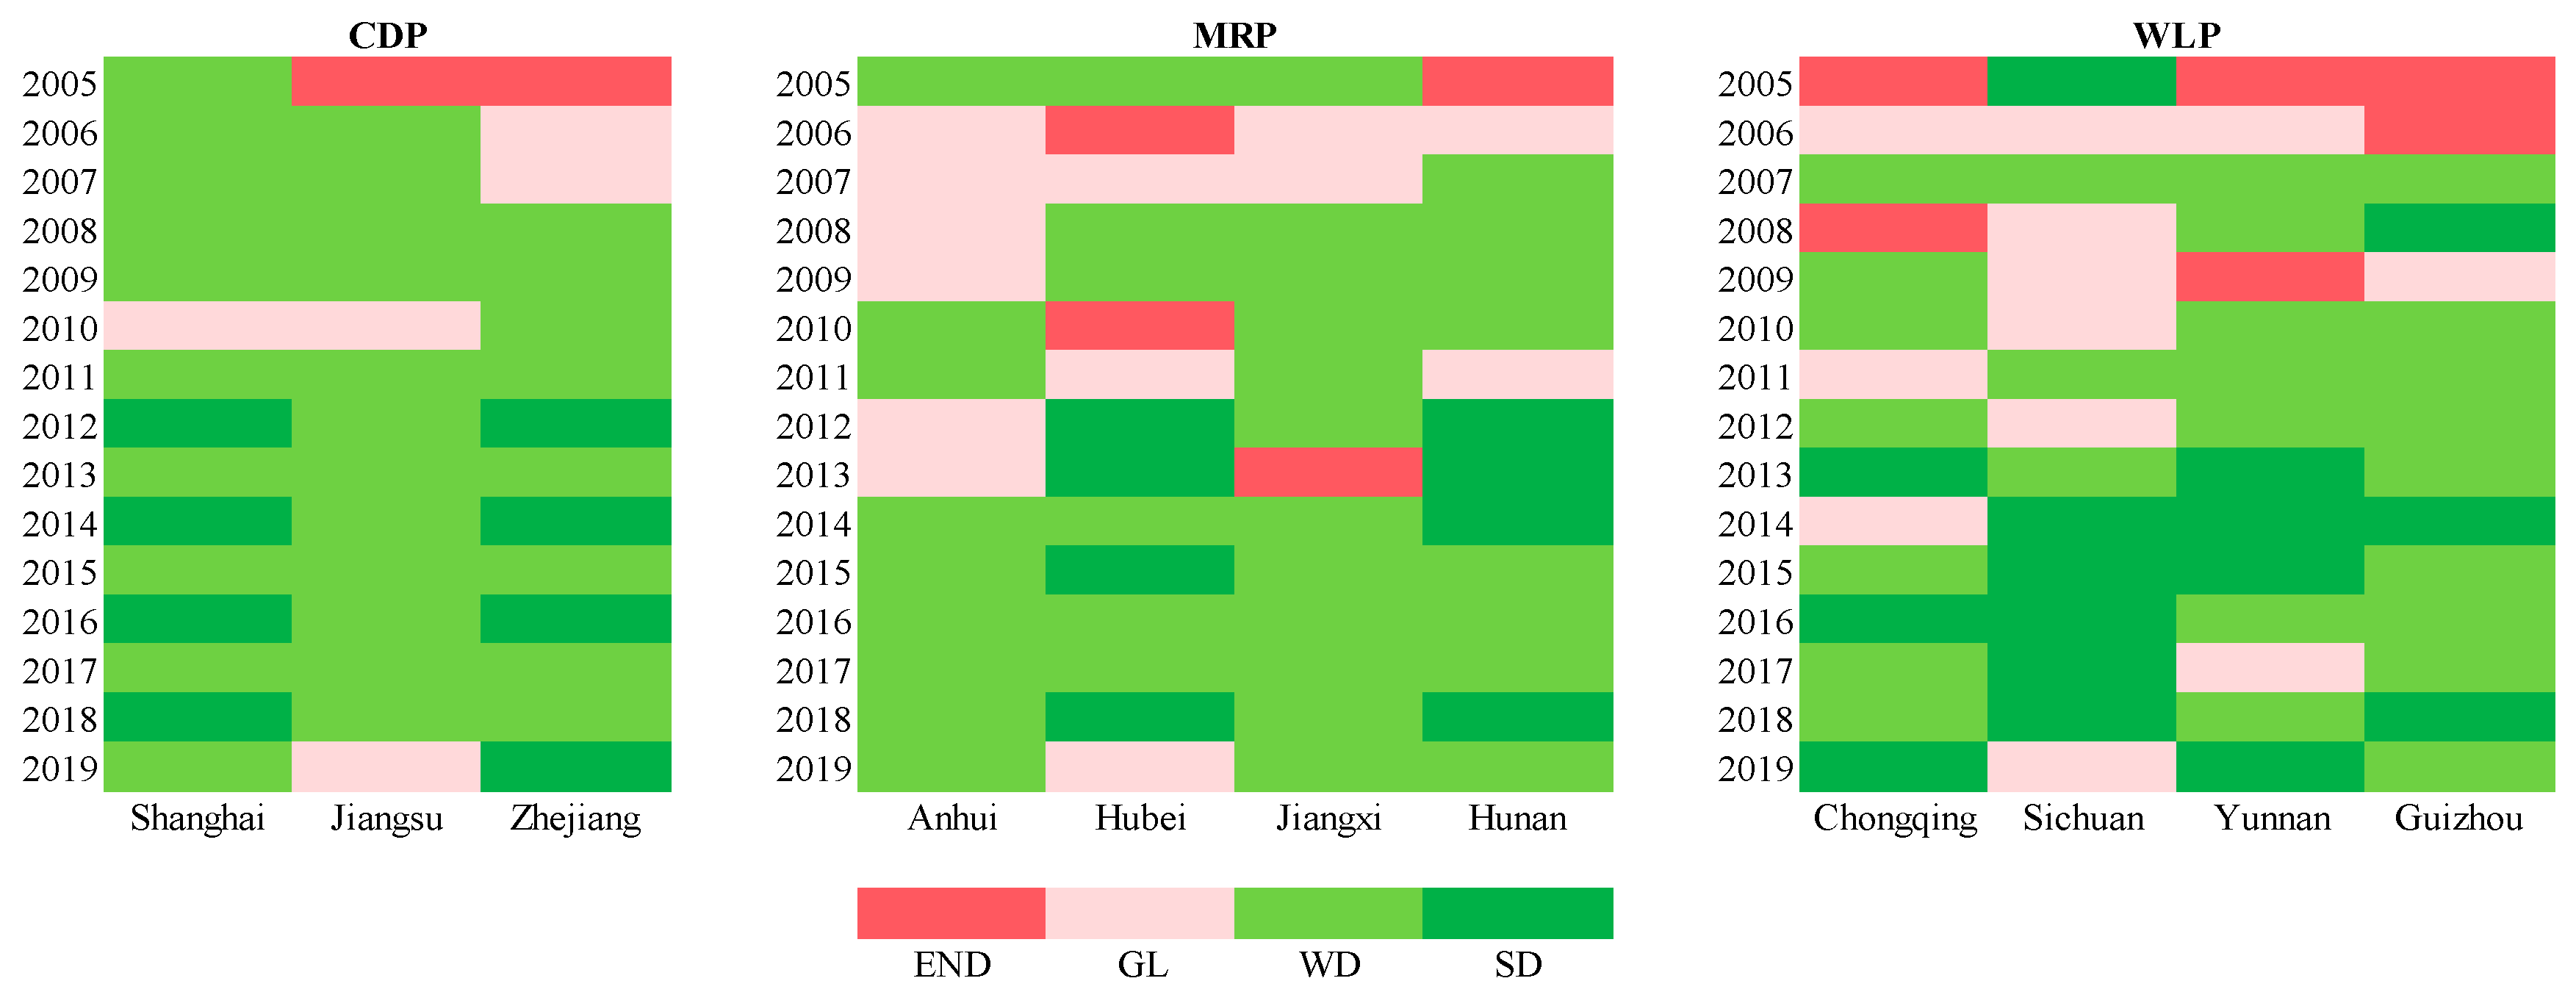
4.1.2. Decoupling Index and State of the YREB
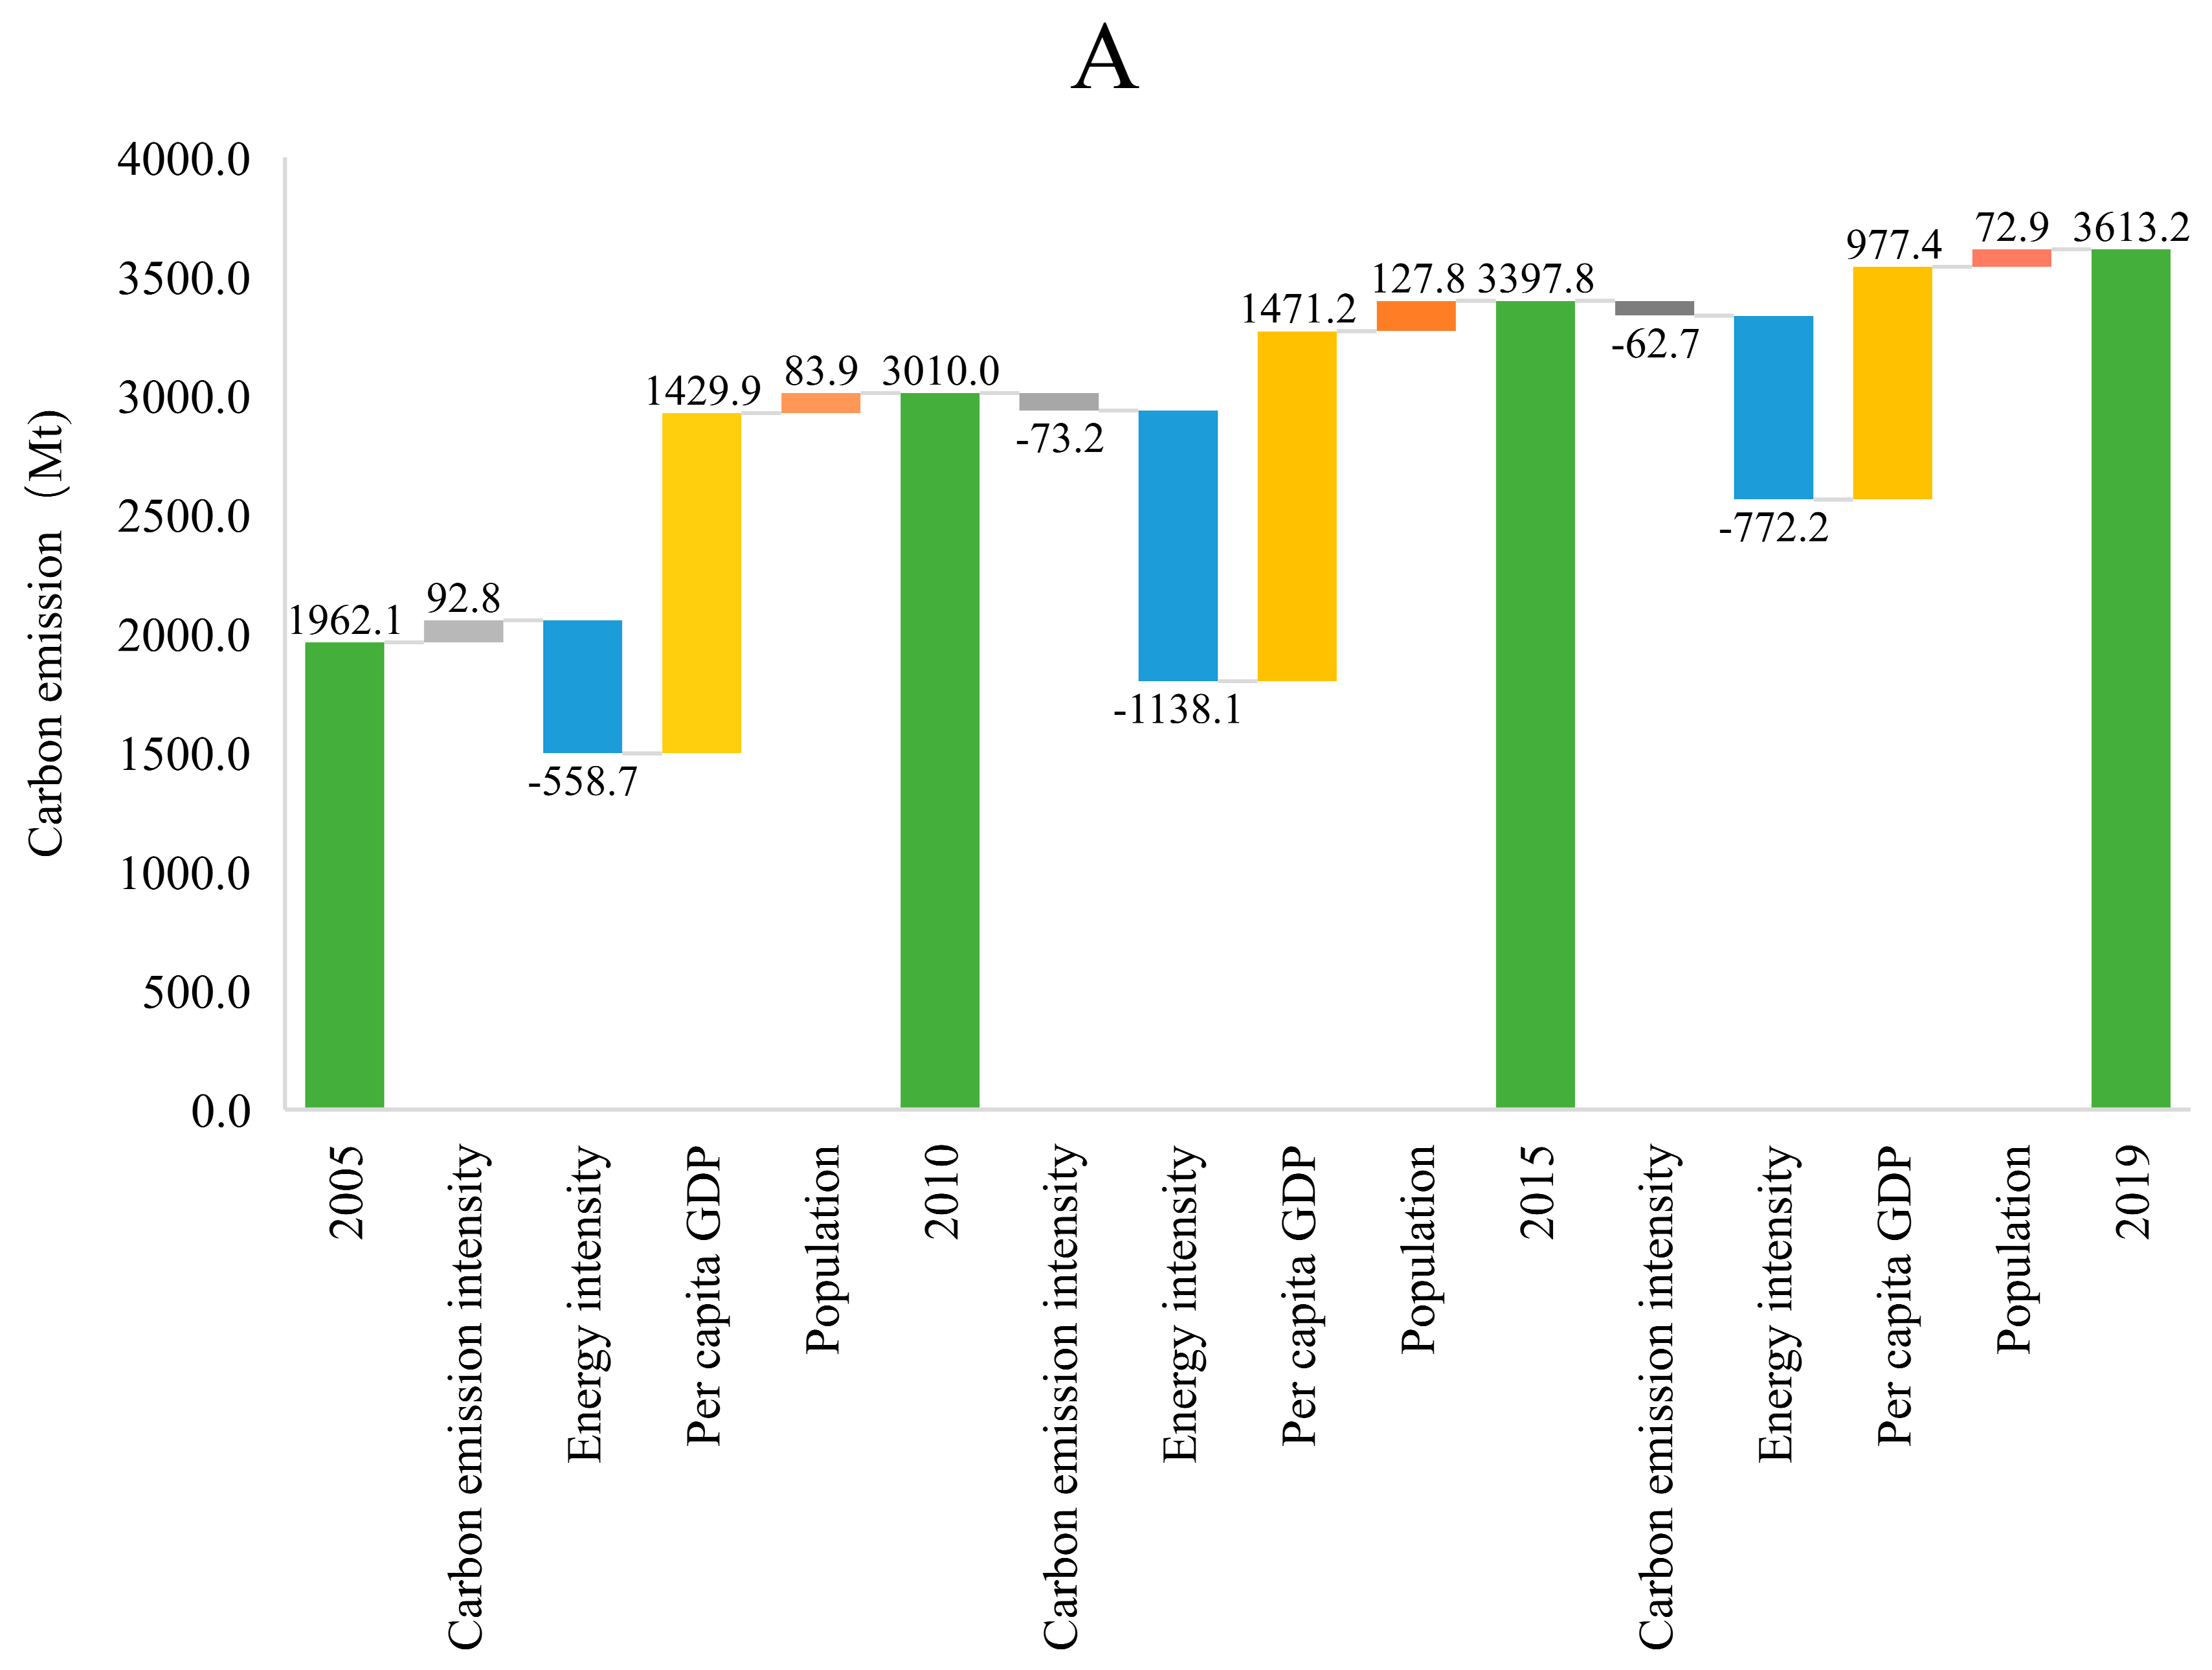
4.2. Decomposition Analysis of Carbon Emissions
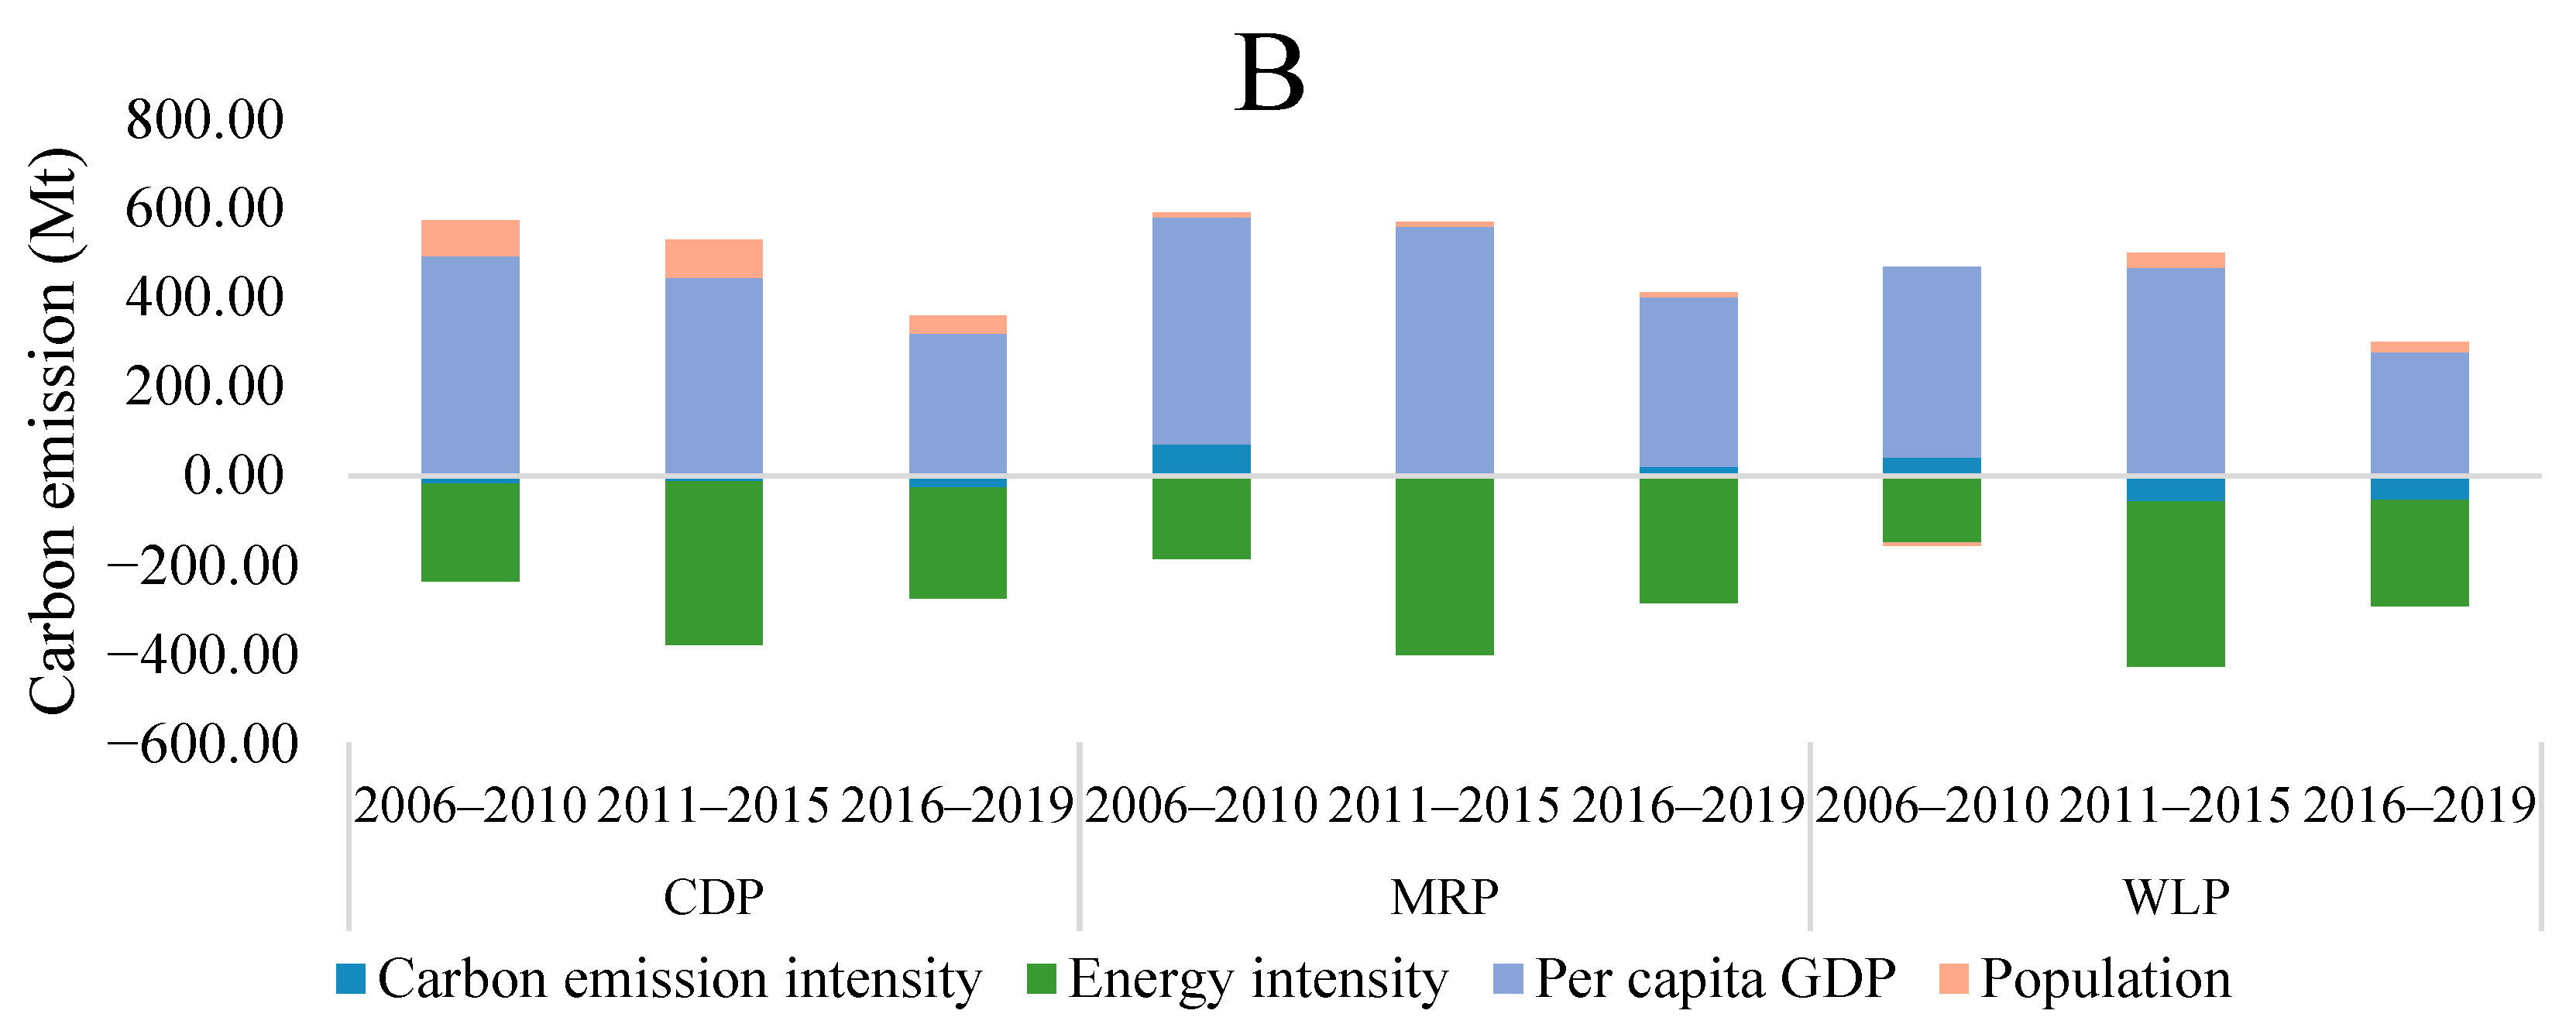
4.2.1. Decomposition between Regions
4.2.2. Decomposition within Regions
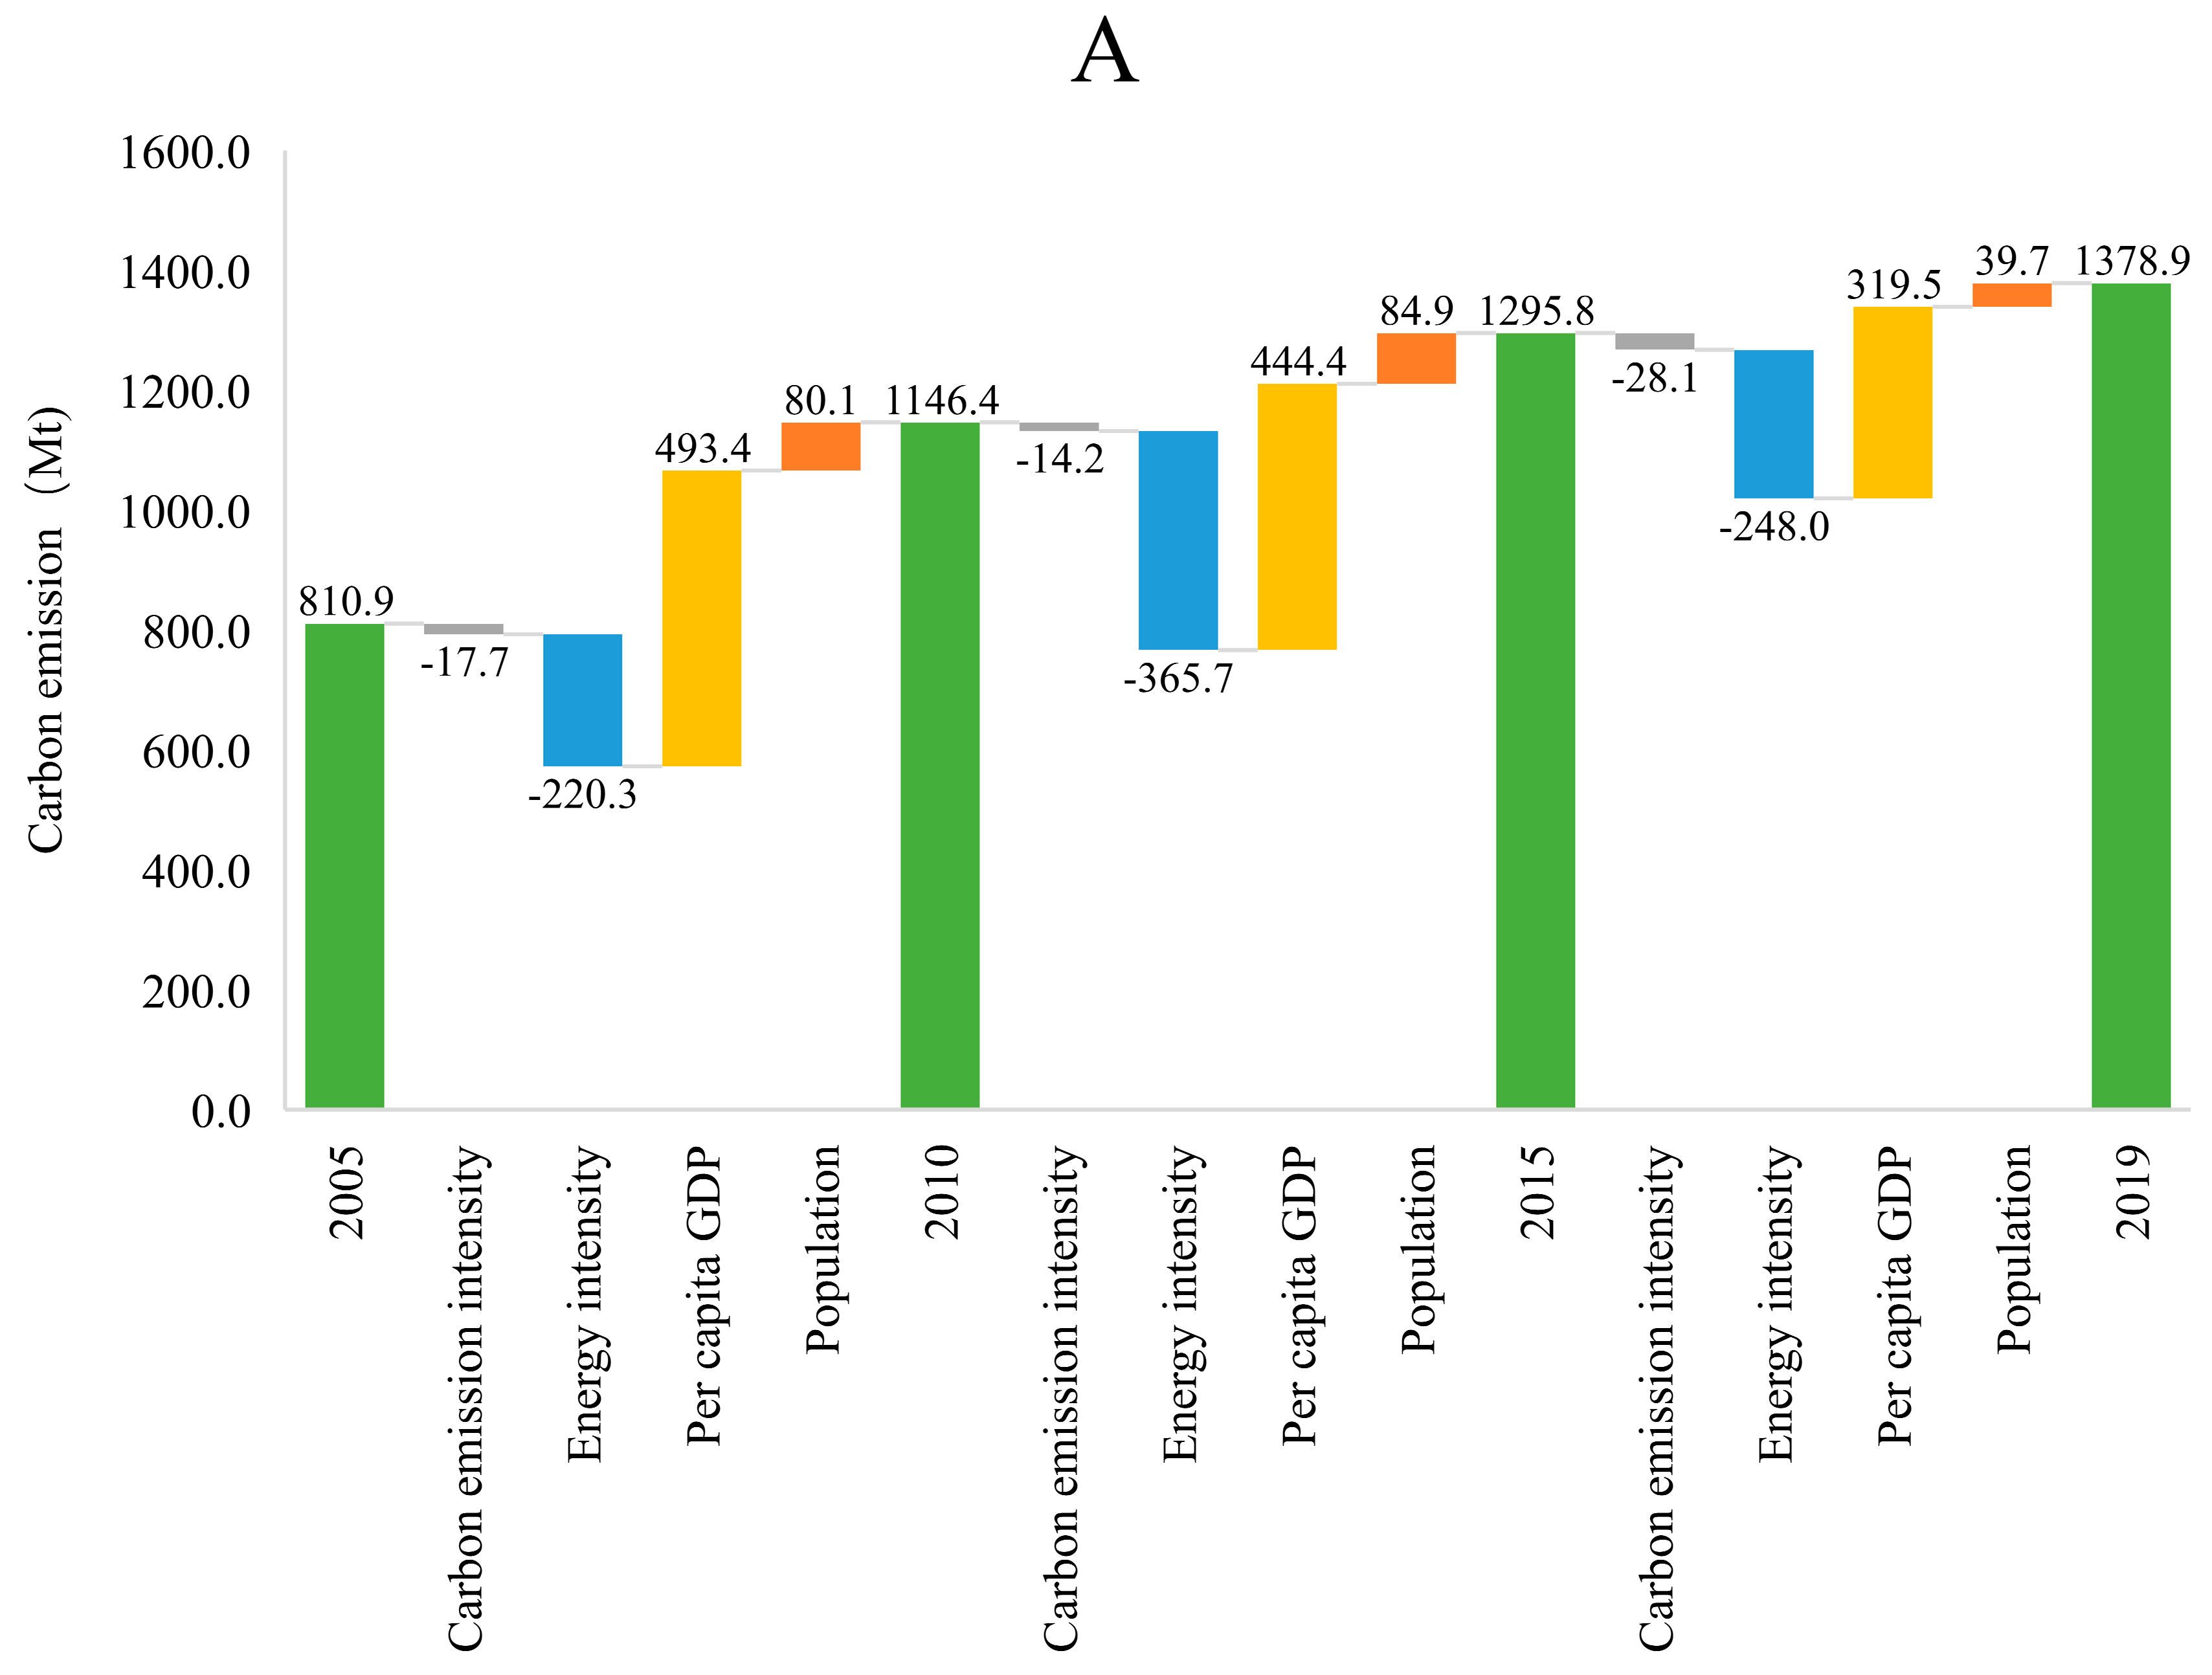
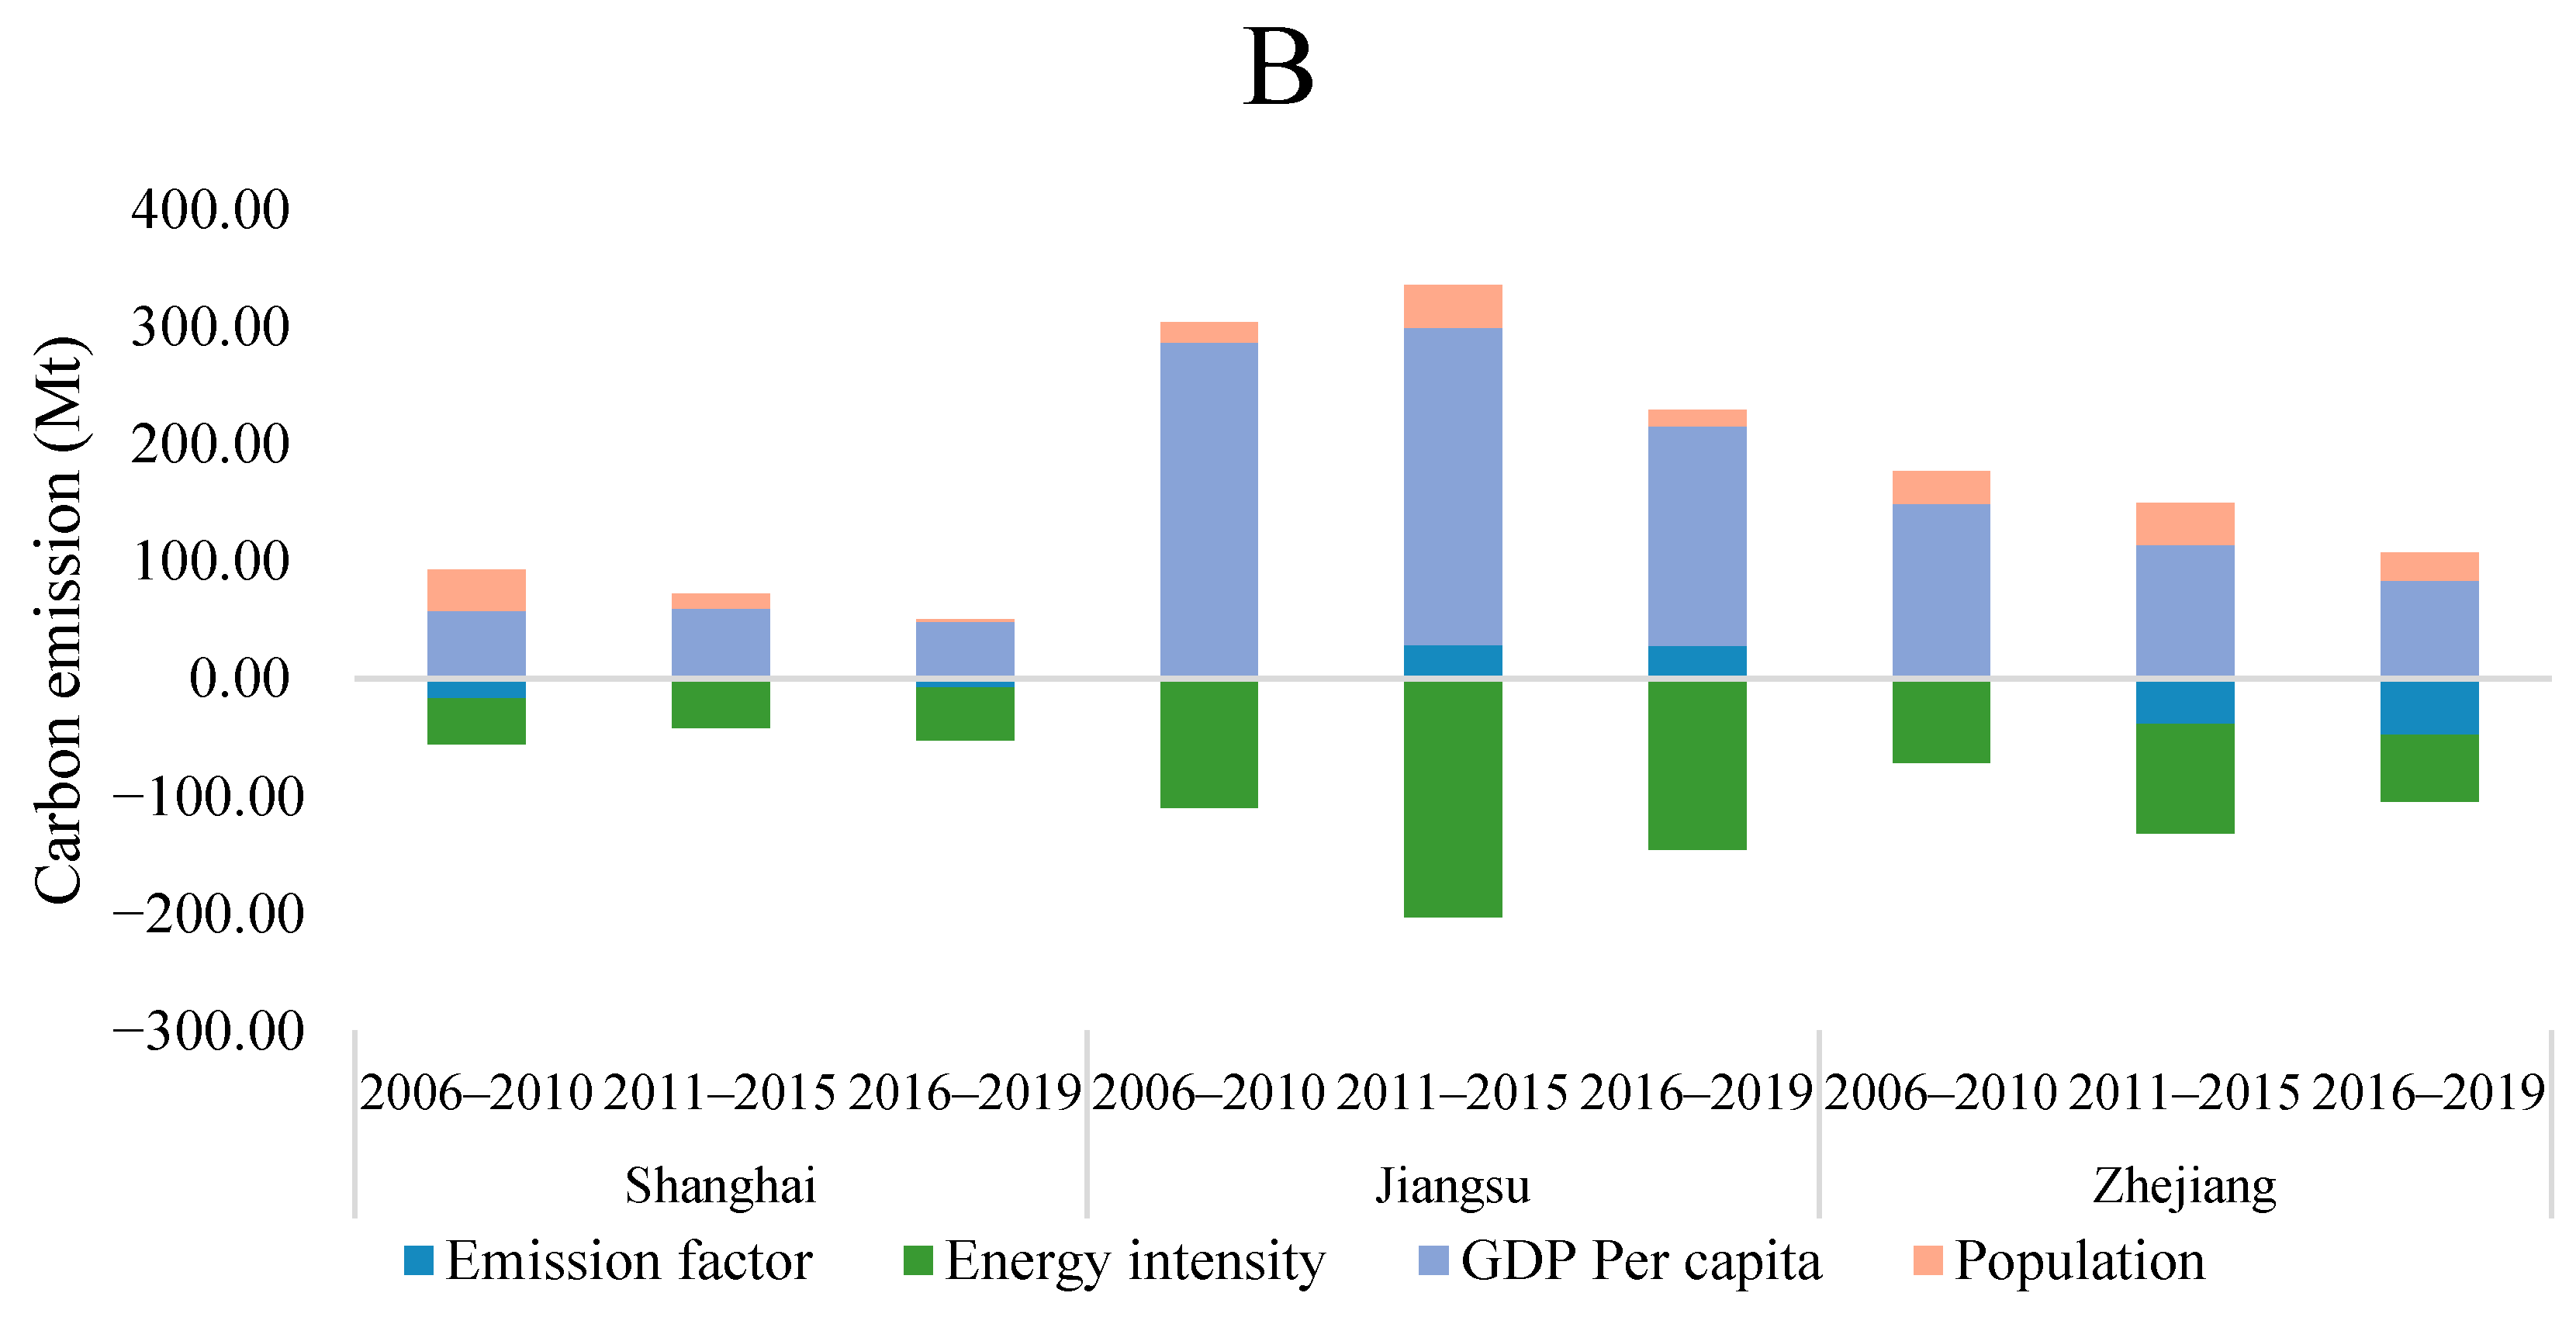
- Coastal developed provinces
- 2.
- Middle-rising provinces
- 3.
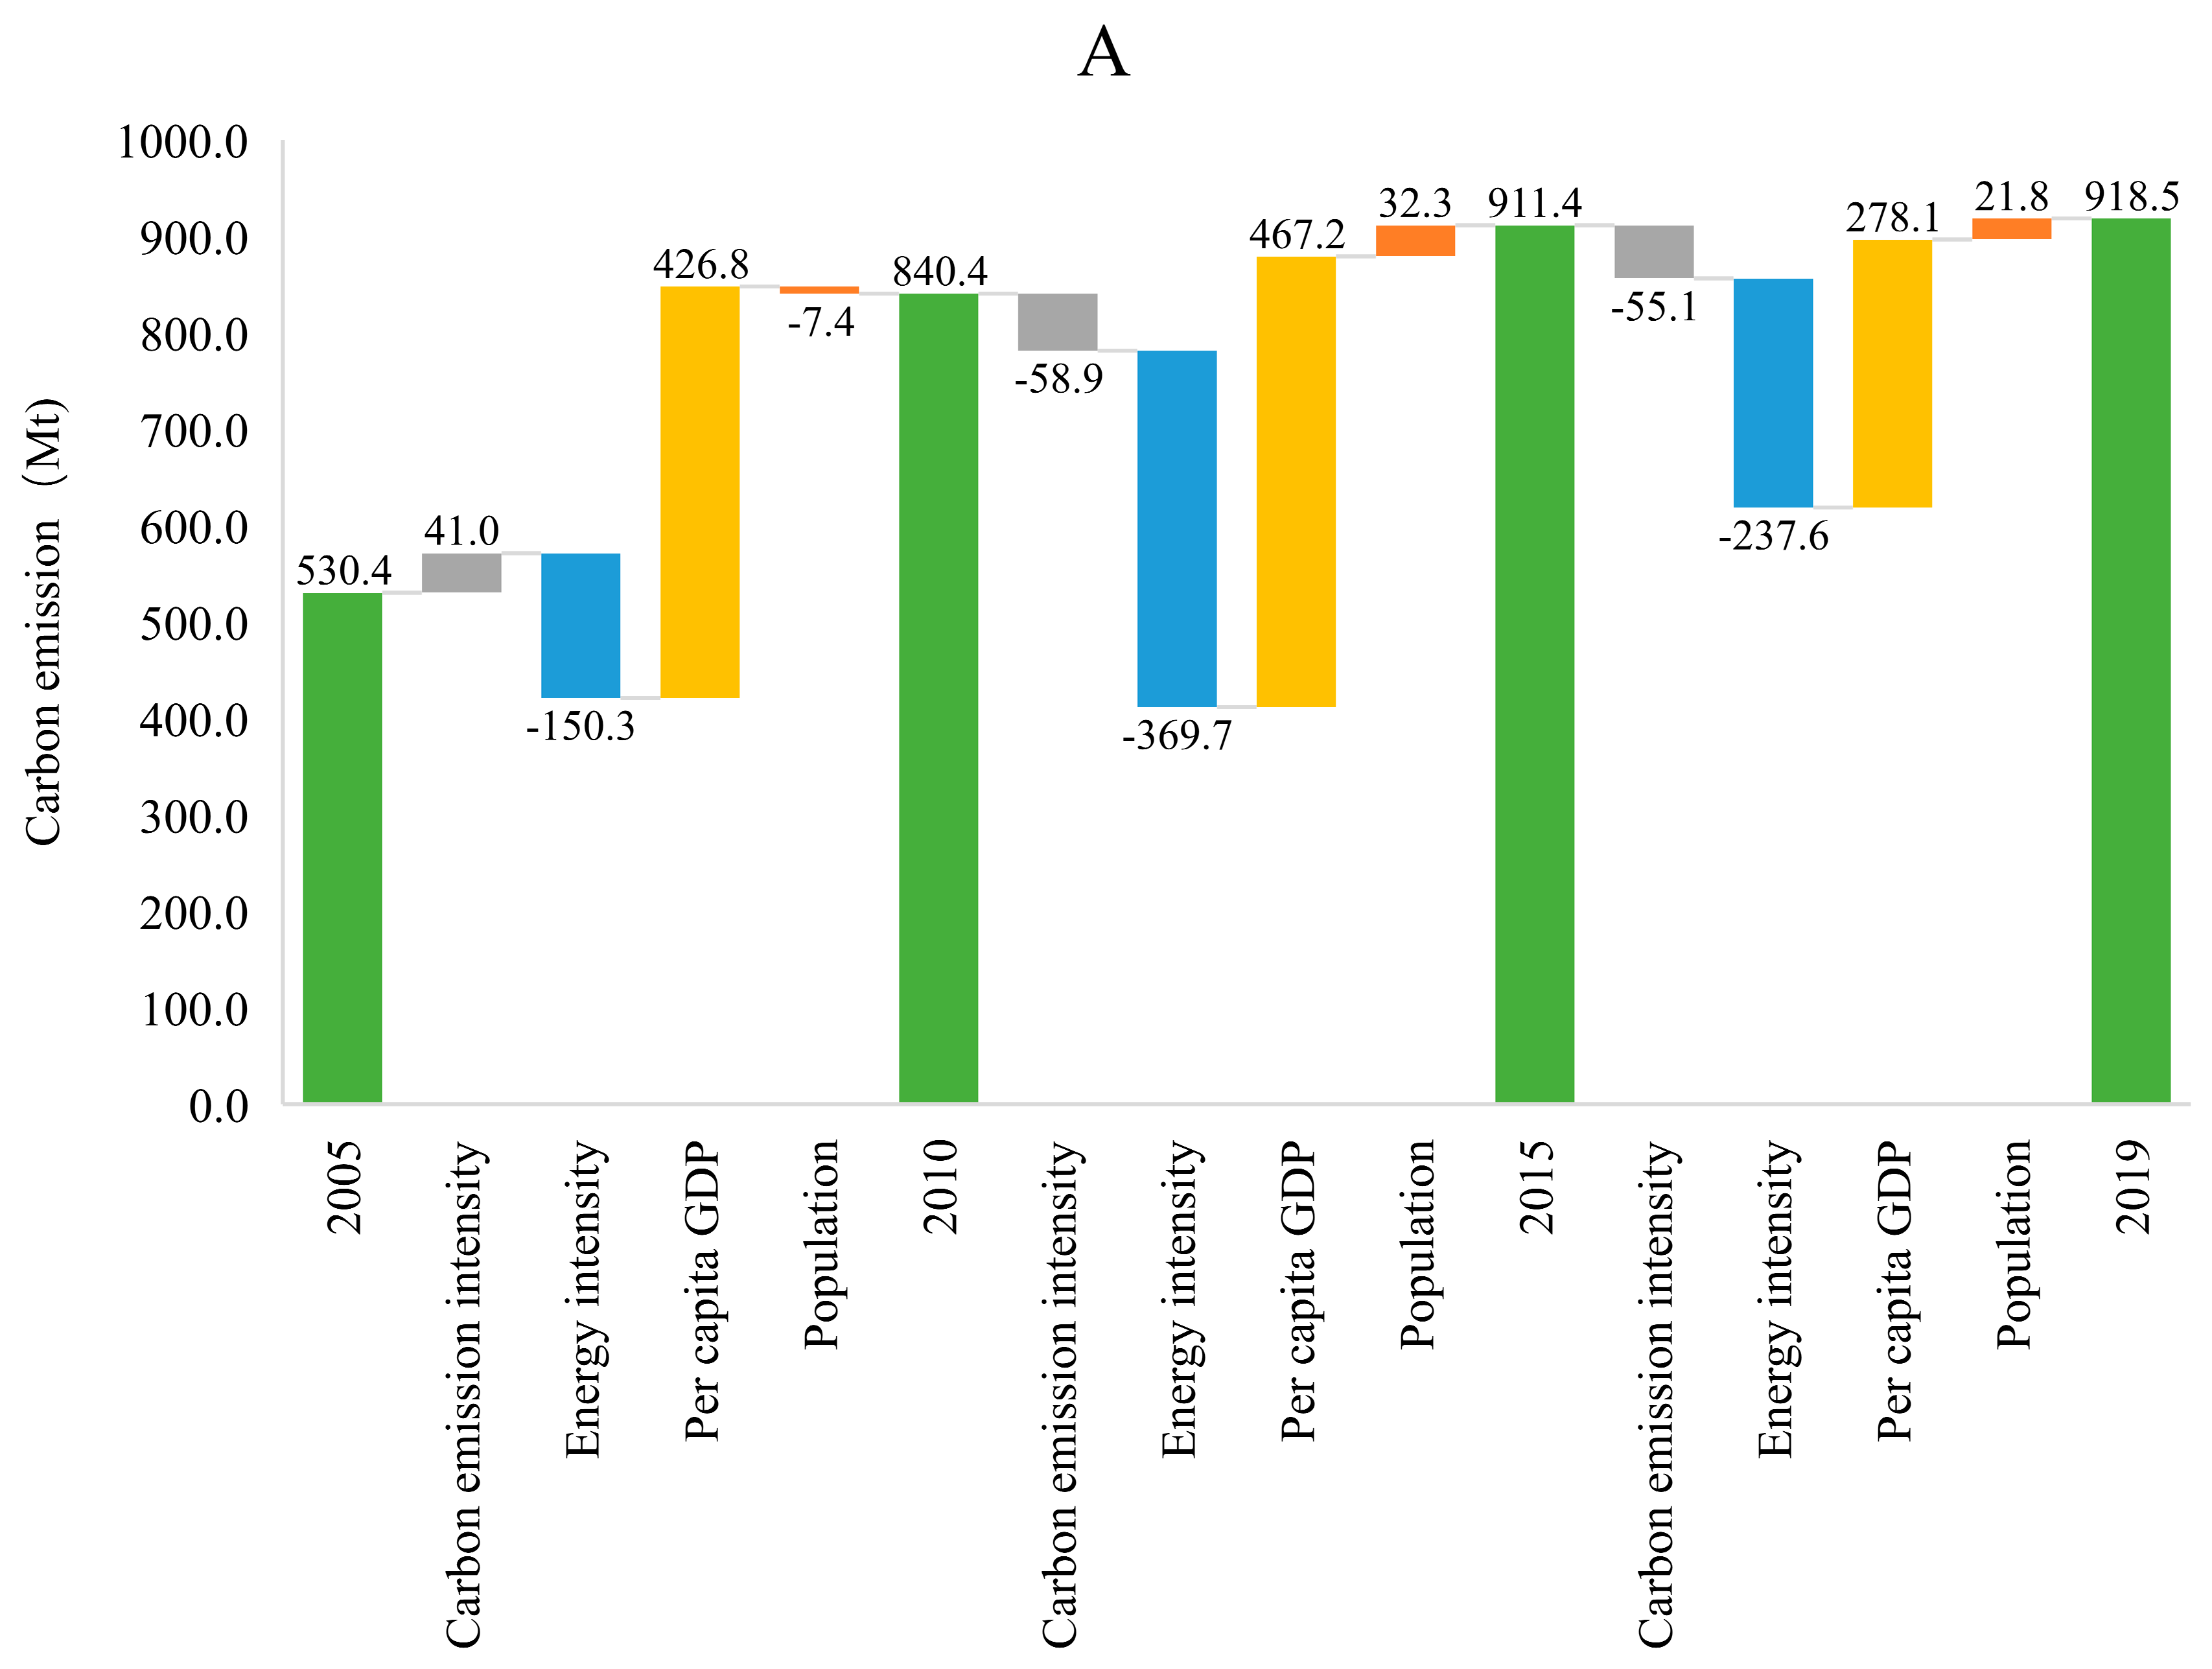
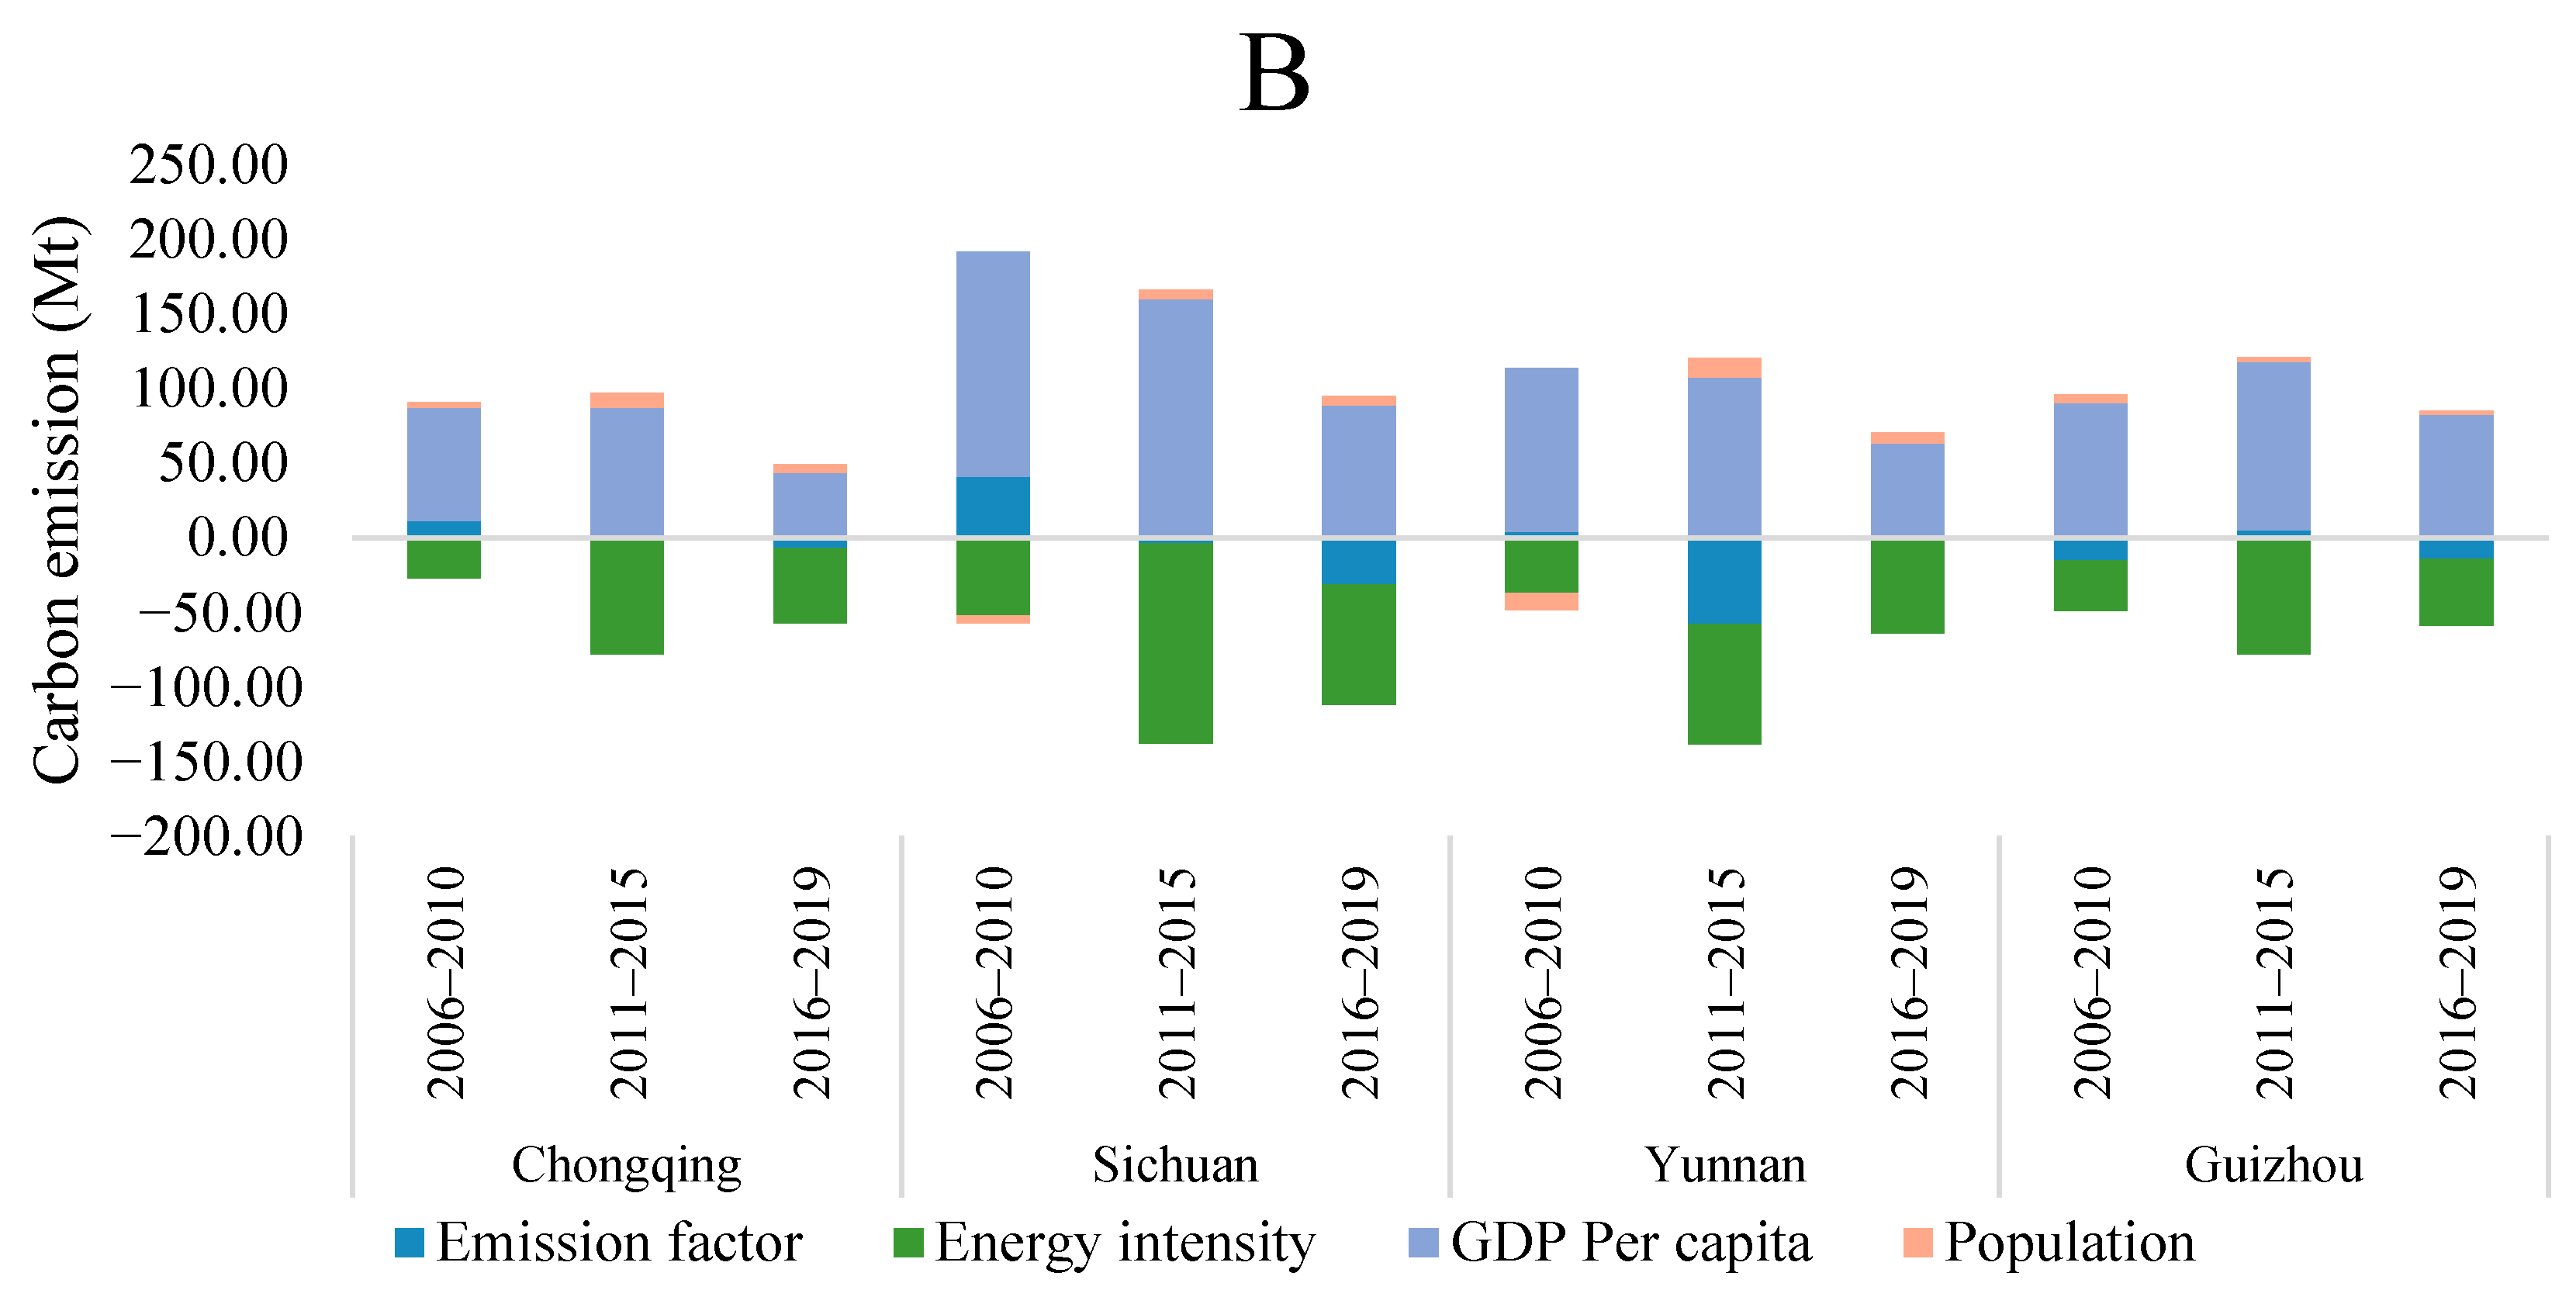
- Western less-developed provinces
4.3. Discussions
5. Conclusions and Policy Suggestions
5.1. Conclusions
5.2. Policy Implications
Author Contributions
Funding
Institutional Review Board Statement
Data Availability Statement
Conflicts of Interest
Appendix A

| Year | Shanghai | Jiangsu | Zhejiang | Anhui | Hubei | Jiangxi | Hunan | Chongqing | Sichuan | Yunnan | Guizhou |
|---|---|---|---|---|---|---|---|---|---|---|---|
| 2005 | 0.598 | 1.869 | 1.345 | 0.169 | 0.299 | 0.659 | 3.475 | 1.660 | −0.224 | 9.979 | 1.484 |
| 2006 | 0.310 | 0.760 | 0.961 | 0.968 | 1.544 | 0.973 | 1.080 | 0.822 | 0.858 | 1.002 | 1.400 |
| 2007 | 0.379 | 0.423 | 0.834 | 0.883 | 0.827 | 1.157 | 0.657 | 0.634 | 0.680 | 0.497 | 0.113 |
| 2008 | 0.199 | 0.468 | 0.147 | 1.099 | 0.126 | 0.181 | 0.103 | 1.871 | 0.944 | 0.139 | −0.470 |
| 2009 | 0.060 | 0.309 | 0.280 | 0.899 | 0.632 | 0.666 | 0.398 | 0.358 | 0.988 | 1.253 | 1.077 |
| 2010 | 0.900 | 1.133 | 0.562 | 0.554 | 1.622 | 0.465 | 0.662 | 0.539 | 1.041 | 0.457 | 0.340 |
| 2011 | 0.369 | 0.726 | 0.664 | 0.623 | 1.114 | 0.628 | 0.886 | 0.889 | 0.092 | 0.362 | 0.764 |
| 2012 | −0.368 | 0.305 | −0.063 | 0.908 | −0.174 | 0.045 | −0.020 | 0.222 | 0.821 | 0.245 | 0.773 |
| 2013 | 0.756 | 0.783 | 0.053 | 0.981 | −1.510 | 2.139 | −0.341 | −1.067 | 0.399 | −0.161 | 0.113 |
| 2014 | −0.910 | 0.027 | −0.124 | 0.199 | 0.022 | 0.268 | −0.094 | 0.847 | −0.010 | −0.516 | −0.113 |
| 2015 | 0.081 | 0.220 | 0.002 | 0.020 | −0.074 | 0.475 | 0.584 | 0.073 | −0.688 | −0.932 | 0.082 |
| 2016 | −0.046 | 0.380 | −0.150 | 0.382 | 0.062 | 0.169 | 0.665 | −0.433 | −0.512 | 0.216 | 0.782 |
| 2017 | 0.106 | 0.277 | 0.342 | 0.188 | 0.421 | 0.578 | 0.632 | 0.272 | −0.010 | 0.806 | 0.281 |
| 2018 | −0.413 | 0.121 | 0.156 | 0.548 | −0.088 | 0.428 | −0.701 | 0.006 | −0.883 | 0.731 | −0.204 |
| 2019 | 0.199 | 0.899 | −0.281 | 0.312 | 0.988 | 0.329 | 0.201 | −0.430 | 0.860 | −1.492 | 0.397 |
References
- World Economic Forum. The Global Risks Report 2022. 2022. Available online: https://www.weforum.org/publications/global-risks-report-2022/ (accessed on 31 March 2023).
- Duan, H.; Zhou, S.; Jiang, K.; Bertram, C.; Harmsen, M.; Kriegler, E.; Van Vuuren, D.P.; Wang, S.; Fujimori, S.; Tavoni, M.; et al. Assessing China’s Efforts to Pursue the 1.5 °C Warming Limit. Science 2021, 372, 378–385. [Google Scholar] [CrossRef]
- UNFCC. Paper Presented at the Report of the Conference of the Parties to the United Nations Framework Convention on Climate Change (21st Session, 2015: Paris); 2015. Available online: https://digitallibrary.un.org/record/831052?v=pdf (accessed on 31 March 2023).
- Stults, M.; Larsen, L. Tackling Uncertainty in US Local Climate Adaptation Planning. J. Plan. Educ. Res. 2020, 40, 416–431. [Google Scholar] [CrossRef]
- Bonfante, A.; Monaco, E.; Vitale, A.; Barbato, G.; Villani, V.; Mercogliano, P.; Rianna, G.; Mileti, F.A.; Manna, P.; Terribile, F. A Geospatial Decision Support System to Support Policy Implementation on Climate Change in EU. Land Degrad. Dev. 2024, ldr.5042. [Google Scholar] [CrossRef]
- Kim, Y.; Oka, K.; Kawazu, E.C.; Ng, C.F.S.; Seposo, X.; Ueda, K.; Hashizume, M.; Honda, Y. Enhancing Health Resilience in Japan in a Changing Climate. Lancet Reg. Health—West. Pac. 2023, 40, 100970. [Google Scholar] [CrossRef] [PubMed]
- BP. Statistical Review of World Energy 2023. 2023. Available online: https://www.energyinst.org/statistical-review (accessed on 8 March 2024).
- Evans, S. Analysis: Which Countries Are Historically Responsible for Climate Change? Available online: https://www.carbonbrief.org/analysis-which-countries-are-historically-responsible-for-climate-change/ (accessed on 8 March 2024).
- Cui, G.; Yu, Y.; Zhou, L.; Zhang, H. Driving Forces for Carbon Emissions Changes in Beijing and the Role of Green Power. Sci. Total Environ. 2020, 728, 138688. [Google Scholar] [CrossRef]
- Sun, L.-L.; Cui, H.-J.; Ge, Q.-S. Will China Achieve Its 2060 Carbon Neutral Commitment from the Provincial Perspective? Adv. Clim. Chang. Res. 2022, 13, 169–178. [Google Scholar] [CrossRef]
- Xian, Y.; Wang, K.; Wei, Y.-M.; Huang, Z. Would China’s Power Industry Benefit from Nationwide Carbon Emission Permit Trading? An Optimization Model-Based Ex Post Analysis on Abatement Cost Savings. Appl. Energy 2019, 235, 978–986. [Google Scholar] [CrossRef]
- Li, W.; Yu, X.; Hu, N.; Huang, F.; Wang, J.; Peng, Q. Study on the Relationship between Fossil Energy Consumption and Carbon Emission in Sichuan Province. Energy Rep. 2022, 8, 53–62. [Google Scholar] [CrossRef]
- Liu, J.; Li, S.; Ji, Q. Regional Differences and Driving Factors Analysis of Carbon Emission Intensity from Transport Sector in China. Energy 2021, 224, 120178. [Google Scholar] [CrossRef]
- Carley, S.; Konisky, D.M. The Justice and Equity Implications of the Clean Energy Transition. Nat. Energy 2020, 5, 569–577. [Google Scholar] [CrossRef]
- Kuznets, S. Economic Growth and Inequality Income. Am. Econ. Rev. 1955, 45, 1–28. [Google Scholar]
- Panayotou, T. Demystifying the Environmental Kuznets Curve: Turning a Black Box into a Policy Tool. Envir. Dev. Econ. 1997, 2, 465–484. [Google Scholar] [CrossRef]
- Andreoni, J.; Levinson, A. The Simple Analytics of the Environmental Kuznets Curve. J. Public Econ. 2001, 80, 269–286. [Google Scholar] [CrossRef]
- Ben Jebli, M.; Ben Youssef, S.; Ozturk, I. Testing Environmental Kuznets Curve Hypothesis: The Role of Renewable and Non-Renewable Energy Consumption and Trade in OECD Countries. Ecol. Indic. 2016, 60, 824–831. [Google Scholar] [CrossRef]
- Pu, Z. Time-Spatial Convergence of Air Pollution and Regional Economic Growth in China. Sustainability 2017, 9, 1284. [Google Scholar] [CrossRef]
- Balsalobre-Lorente, D.; Shahbaz, M.; Murshed, M.; Nuta, F.M. Environmental Impact of Globalization: The Case of Central and Eastern European Emerging Economies. J. Environ. Manag. 2023, 341, 118018. [Google Scholar] [CrossRef]
- Liu, W. EKC Test Study on the Relationship between Carbon Dioxide Emission and Regional Economic Growth. Carbon Manag. 2020, 11, 415–425. [Google Scholar] [CrossRef]
- Sohag, K.; Kalugina, O.; Samargandi, N. Re-Visiting Environmental Kuznets Curve: Role of Scale, Composite, and Technology Factors in OECD Countries. Environ. Sci. Pollut. Res. 2019, 26, 27726–27737. [Google Scholar] [CrossRef]
- Aung, T.S.; Saboori, B.; Rasoulinezhad, E. Economic Growth and Environmental Pollution in Myanmar: An Analysis of Environmental Kuznets Curve. Environ. Sci. Pollut. Res. 2017, 24, 20487–20501. [Google Scholar] [CrossRef]
- Massagony, A. Budiono Is the Environmental Kuznets Curve (EKC) Hypothesis Valid on CO2 Emissions in Indonesia? Int. J. Environ. Stud. 2023, 80, 20–31. [Google Scholar] [CrossRef]
- Aslan, A.; Destek, M.A.; Okumus, I. Sectoral Carbon Emissions and Economic Growth in the US: Further Evidence from Rolling Window Estimation Method. J. Clean Prod. 2018, 200, 402–411. [Google Scholar] [CrossRef]
- Hasanov, F.J.; Mikayilov, J.I.; Mukhtarov, S.; Suleymanov, E. Does CO2 Emissions–Economic Growth Relationship Reveal EKC in Developing Countries? Evidence from Kazakhstan. Env. Sci Pollut Res 2019, 26, 30229–30241. [Google Scholar] [CrossRef]
- Zhang, Y.; Liu, W.; Cai, Y.; Khan, S.U.; Zhao, M. Decoupling Analysis of Water Use and Economic Development in Arid Region of China—Based on Quantity and Quality of Water Use. Sci. Total Environ. 2021, 761, 143275. [Google Scholar] [CrossRef]
- Dong, B.; Zhang, M.; Mu, H.; Su, X. Study on Decoupling Analysis between Energy Consumption and Economic Growth in Liaoning Province. Energy Policy 2016, 97, 414–420. [Google Scholar] [CrossRef]
- Zhang, M.; Song, Y.; Su, B.; Sun, X. Decomposing the Decoupling Indicator between the Economic Growth and Energy Consumption in China. Energy Effic. 2015, 8, 1231–1239. [Google Scholar] [CrossRef]
- Kan, S.; Chen, B.; Chen, G. Worldwide Energy Use across Global Supply Chains: Decoupled from Economic Growth? Appl. Energy 2019, 250, 1235–1245. [Google Scholar] [CrossRef]
- Zhang, M.; Bai, C. Exploring the Influencing Factors and Decoupling State of Residential Energy Consumption in Shandong. J. Clean Prod. 2018, 194, 253–262. [Google Scholar] [CrossRef]
- Yang, Y.; Jia, J.; Devlin, A.T.; Zhou, Y.; Xie, D.; Ju, M. Decoupling and Decomposition Analysis of Residential Energy Consumption from Economic Growth during 2000-2017: A Comparative Study of Urban and Rural Guangdong, China. Energies 2020, 13, 4461. [Google Scholar] [CrossRef]
- Wang, Q.; Jiang, R.; Zhan, L. Is Decoupling Economic Growth from Fuel Consumption Possible in Developing Countries?—A Comparison of China and India. J. Clean. Prod. 2019, 229, 806–817. [Google Scholar] [CrossRef]
- Frodyma, K.; Papiez, M.; Smiech, S. Decoupling Economic Growth from Fossil Fuel Use-Evidence from 141 Countries in the 25-Year Perspective. Energies 2020, 13, 6671. [Google Scholar] [CrossRef]
- Shi, Y.B.; Zhao, X.X.; Jang, C.-L.; Chang, C.-P. Decoupling Effect between Economic Development and Environmental Pollution: A Spatial-Temporal Investigation Using 31 Provinces in China. Energy Environ. 2019, 30, 755–775. [Google Scholar] [CrossRef]
- Xi, Y.; Yan, D.; Zhang, J.; Fu, X. Decoupling Analysis of the Industrial Growth and Environmental Pollution in the Circum-Bohai-Sea Region in China. Environ. Sci. Pollut. Res. 2021, 28, 19079–19093. [Google Scholar] [CrossRef] [PubMed]
- Amir, I.; Tang, X.; Jahangir, S.; Yang, Y.; Rasool, S.F. Decoupling Mechanism of Industry Carbon Emissions, Carbon Intensity and Economic Growth in Pakistan. Indoor Built Environ. 2023, 32, 1707–1726. [Google Scholar] [CrossRef]
- Xie, P.; Gong, N.; Sun, F.; Li, P.; Pan, X. What Factors Contribute to the Extent of Decoupling Economic Growth and Energy Carbon Emissions in China? Energy Policy 2023, 173, 113416. [Google Scholar] [CrossRef]
- Bianco, V.; Cascetta, F.; Nardini, S. Analysis of the Carbon Emissions Trend in European Union. A Decomposition and Decoupling Approach. Sci. Total Environ. 2024, 909, 168528. [Google Scholar] [CrossRef] [PubMed]
- Lu, Q.; Yang, H.; Huang, X.; Chuai, X.; Wu, C. Multi-Sectoral Decomposition in Decoupling Industrial Growth from Carbon Emissions in the Developed Jiangsu Province, China. Energy 2015, 82, 414–425. [Google Scholar] [CrossRef]
- Pan, B.; Zhang, Y. Impact of Affluence, Nuclear and Alternative Energy on US Carbon Emissions from 1960 to 2014. Energy Strateg. Rev. 2020, 32, 100581. [Google Scholar] [CrossRef]
- Nuţă, F.M.; Sharafat, A.; Abban, O.J.; Khan, I.; Irfan, M.; Nuţă, A.C.; Dankyi, A.B.; Asghar, M. The Relationship among Urbanization, Economic Growth, Renewable Energy Consumption, and Environmental Degradation: A Comparative View of European and Asian Emerging Economies. Gondwana Res. 2024, 128, 325–339. [Google Scholar] [CrossRef]
- Pan, X.; Uddin, M.K.; Ai, B.; Pan, X.; Saima, U. Influential Factors of Carbon Emissions Intensity in OECD Countries: Evidence from Symbolic Regression. J. Clean Prod. 2019, 220, 1194–1201. [Google Scholar] [CrossRef]
- Zhang, Y.; Zhang, Q.; Pan, B. Impact of Affluence and Fossil Energy on China Carbon Emissions Using STIRPAT Model. Environ. Sci. Pollut. Res. 2019, 26, 18814–18824. [Google Scholar] [CrossRef]
- Wang, Q.; Chiu, Y.-H.; Chiu, C.-R. Driving Factors behind Carbon Dioxide Emissions in China: A Modified Production-Theoretical Decomposition Analysis. Energy Econ. 2015, 51, 252–260. [Google Scholar] [CrossRef]
- Tian, X.; Bai, F.; Jia, J.; Liu, Y.; Shi, F. Realizing Low-Carbon Development in a Developing and Industrializing Region: Impacts of Industrial Structure Change on CO2 Emissions in Southwest China. J. Environ. Manag. 2019, 233, 728–738. [Google Scholar] [CrossRef]
- Xu, S.-C.; Zhang, L.; Liu, Y.-T.; Zhang, W.-W.; He, Z.-X.; Long, R.-Y.; Chen, H. Determination of the Factors That Influence Increments in CO2 Emissions in Jiangsu, China Using the SDA Method. J. Clean Prod. 2017, 142, 3061–3074. [Google Scholar] [CrossRef]
- Fan, J.-L.; Da, Y.-B.; Wan, S.-L.; Zhang, M.; Cao, Z.; Wang, Y.; Zhang, X. Determinants of Carbon Emissions in ‘Belt and Road Initiative’ Countries: A Production Technology Perspective. Appl. Energy 2019, 239, 268–279. [Google Scholar] [CrossRef]
- Lima, F.; Nunes, M.L.; Cunha, J.; Lucena, A.F.P. A Cross-Country Assessment of Energy-Related CO 2 Emissions: An Extended Kaya Index Decomposition Approach. Energy 2016, 115, 1361–1374. [Google Scholar] [CrossRef]
- Su, B.; Ang, B.W. Structural Decomposition Analysis Applied to Energy and Emissions: Some Methodological Developments. Energy Econ. 2012, 34, 177–188. [Google Scholar] [CrossRef]
- Papiez, M.; Smiech, S.; Frodyma, K. The Role of Energy Policy on the Decoupling Processes in the European Union Countries. J. Clean Prod. 2021, 318, 128484. [Google Scholar] [CrossRef]
- Koilakou, E.; Hatzigeorgiou, E.; Bithas, K. Carbon and Energy Intensity of the USA and Germany. A LMDI Decomposition Approach and Decoupling Analysis. Envion. Sci. Pollut. Res. 2022, 30, 12412–12427. [Google Scholar] [CrossRef] [PubMed]
- Hang, Y.; Wang, Q.; Zhou, D.; Zhang, L. Factors Influencing the Progress in Decoupling Economic Growth from Carbon Dioxide Emissions in China’s Manufacturing Industry. Resour. Conserv. Recycl. 2019, 146, 77–88. [Google Scholar] [CrossRef]
- Wang, J.; Li, Z.; Wu, T.; Wu, S.; Yin, T. The Decoupling Analysis of CO2 Emissions from Power Generation in Chinese Provincial Power Sector. Energy 2022, 255, 124488. [Google Scholar] [CrossRef]
- Zhang, X.; Geng, Y.; Shao, S.; Dong, H.; Wu, R.; Yao, T.; Song, J. How to Achieve China’s CO2 Emission Reduction Targets by Provincial Efforts?—An Analysis Based on Generalized Divisia Index and Dynamic Scenario Simulation. Renew. Sust. Energ. Rev. 2020, 127, 109892. [Google Scholar] [CrossRef]
- Diakoulaki, D.; Mandaraka, M. Decomposition Analysis for Assessing the Progress in Decoupling Industrial Growth from CO2 Emissions in the EU Manufacturing Sector. Energy Econ. 2007, 29, 636–664. [Google Scholar] [CrossRef]
- Wang, Q.; Zhao, M.; Li, R.; Su, M. Decomposition and Decoupling Analysis of Carbon Emissions from Economic Growth: A Comparative Study of China and the United States. J. Clean Prod. 2018, 197, 178–184. [Google Scholar] [CrossRef]
- Shen, T.; Hu, R.; Hu, P.; Tao, Z. Decoupling between Economic Growth and Carbon Emissions: Based on Four Major Regions in China. IJERPH 2023, 20, 1496. [Google Scholar] [CrossRef]
- OECD. Indicators to Measure Decoupling of Environmental Pressure from Economic Growth. OECD 2002, 35–47. [Google Scholar]
- Tapio, P. Towards a Theory of Decoupling: Degrees of Decoupling in the EU and the Case of Road Traffic in Finland between 1970 and 2001. Transp. Policy 2005, 12, 137–151. [Google Scholar] [CrossRef]
- Tapio, P.; Banister, D.; Luukkanen, J.; Vehmas, J.; Willamo, R. Energy and Transport in Comparison: Immaterialisation Dematerialisation and Decarbonisation in the EU15 between 1970 and 2000. Energy Policy 2007, 35, 433–451. [Google Scholar] [CrossRef]
- Zhang, X.; Geng, Y.; Shao, S.; Song, X.; Fan, M.; Yang, L.; Song, J. Decoupling PM2.5 Emissions and Economic Growth in China over 1998–2016: A Regional Investment Perspective. Sci. Total Environ. 2020, 714, 136841. [Google Scholar] [CrossRef] [PubMed]
- Li, K.; Zhou, Y.; Xiao, H.; Li, Z.; Shan, Y. Decoupling of Economic Growth from CO2 Emissions in Yangtze River Economic Belt Cities. Sci. Total Environ. 2021, 775, 145927. [Google Scholar] [CrossRef]
- Kaya, Y. Impact of Carbon Dioxide Emission Control on GNP Growth: Interpretation of Proposed Scenarios. 1989. Available online: https://www.scirp.org/reference/ReferencesPapers?ReferenceID=1021752 (accessed on 8 March 2024).
- Sarkodie, S.A.; Ozturk, I. Investigating the Environmental Kuznets Curve Hypothesis in Kenya: A Multivariate Analysis. Renew. Sust. Energ. Rev. 2020, 117, 109481. [Google Scholar] [CrossRef]
- Zhang, L.; Mu, R.; Zhan, Y.; Yu, J.; Liu, L.; Yu, Y.; Zhang, J. Digital Economy, Energy Efficiency, and Carbon Emissions: Evidence from Provincial Panel Data in China. Sci. Total Environ. 2022, 852, 158403. [Google Scholar] [CrossRef] [PubMed]
- Khan, I.; Hou, F.; Le, H.P. The Impact of Natural Resources, Energy Consumption, and Population Growth on Environmental Quality: Fresh Evidence from the United States of America. Sci. Total Environ. 2021, 754, 142222. [Google Scholar] [CrossRef] [PubMed]
- Shan, S.; Genc, S.Y.; Kamran, H.W.; Dinca, G. Role of Green Technology Innovation and Renewable Energy in Carbon Neutrality: A Sustainable Investigation from Turkey. J. Environ. Manag. 2021, 294, 113004. [Google Scholar] [CrossRef] [PubMed]
- Ang, B.W.; Xu, X.Y.; Su, B. Multi-Country Comparisons of Energy Performance: The Index Decomposition Analysis Approach. Energy Econ. 2015, 47, 68–76. [Google Scholar] [CrossRef]
- Ang, B.W. The LMDI Approach to Decomposition Analysis: A Practical Guide. Energy Policy 2005, 33, 867–871. [Google Scholar] [CrossRef]
- Ang, B.W. LMDI Decomposition Approach: A Guide for Implementation. Energy Policy 2015, 86, 233–238. [Google Scholar] [CrossRef]
- Eggleston, S.; Buendia, L.; Miwa, K.; Ngara, T.; Tanabe, K. IPCC 2006 Guidelines for National Greenhouse Gas Inventories; Institute for Global Environmental Strategies (IGES): Arlington, VA, USA, 2006; ISBN 4-88788-032-4. [Google Scholar]
- Guan, Y.; Shan, Y.; Huang, Q.; Chen, H.; Wang, D.; Hubacek, K. Assessment to China’s Recent Emission Pattern Shifts. Earth Future 2021, 9, e2021EF002241. [Google Scholar] [CrossRef]
- Wei, C.; Zheng, X.Y. A New Perspective on Energy Efficiency Improvement: Based on the Test of Market Segmentation. Soc. Sci. China 2017, 41, 90–111+206. [Google Scholar]
- Huang, W.; Shahbaz, M.; Li, H. Decomposition and Decoupling of Regional Carbon Emissions: A Case of the Yangtze River Delta in China. J. Glob. Inf. Manag. 2022, 30, 1–19. [Google Scholar] [CrossRef]
- Shao, L.; Geng, Z.; Wu, X.F.; Xu, P.; Pan, T.; Yu, H.; Wu, Z. Changes and Driving Forces of Urban Consumption-Based Carbon Emissions: A Case Study of Shanghai. J. Clean Prod. 2020, 245, 118774. [Google Scholar] [CrossRef]
- Hua, J.; Gao, J.; Chen, K.; Li, J. Driving Effect of Decoupling Provincial Industrial Economic Growth and Industrial Carbon Emissions in China. IJERPH 2022, 20, 145. [Google Scholar] [CrossRef]
- Jiang, J.; Zhao, T.; Wang, J. Decoupling Analysis and Scenario Prediction of Agricultural CO2 Emissions: An Empirical Analysis of 30 Provinces in China. J. Clean. Prod. 2021, 320, 128798. [Google Scholar] [CrossRef]
- Zhao, P.; Tuygun, G.T.; Li, B.; Liu, J.; Yuan, L.; Luo, Y.; Xiao, H.; Zhou, Y. The Effect of Environmental Regulations on Air Quality: A Long-Term Trend Analysis of SO2 and NO2 in the Largest Urban Agglomeration in Southwest China. Atmos. Pollut. Res. 2019, 10, 2030–2039. [Google Scholar] [CrossRef]
- Zhang, X.; Guo, X.; Zhang, X. Assessing and Prospecting Decoupling Effect of Carbon Emissions from Economic Growth: Empirical Studies from Chinese Provinces. Energy Environ. 2023, 34, 2044–2071. [Google Scholar] [CrossRef]
- Wang, Q.; Wang, S.; Li, R. Determinants of Decoupling Economic Output from Carbon Emission in the Transport Sector: A Comparison Study of Four Municipalities in China. Int. J. Environ. Res. Public Health 2019, 16, 3729. [Google Scholar] [CrossRef]


| Region | Province | Population (Ten Thousand) | Administrative Area (Ten Thousand km2) | GDP Per Capita (CNY) |
|---|---|---|---|---|
| CDP | Shanghai | 2424 | 0.63 | 134,982 |
| Jiangsu | 8051 | 10.72 | 115,168 | |
| Zhejiang | 5737 | 10.56 | 98,643 | |
| MRP | Anhui | 6324 | 14.01 | 47,711 |
| Hubei | 5917 | 18.59 | 66,615 | |
| Jiangxi | 4648 | 16.69 | 47,433 | |
| Hunan | 6899 | 21.18 | 52,948 | |
| WLP | Chongqing | 3102 | 8.24 | 65,932 |
| Sichuan | 8341 | 48.61 | 48,883 | |
| Yunnan | 4830 | 39.41 | 37,135 | |
| Guizhou | 3600 | 17.62 | 41,243 |
| Type | Decoupling State | Carbon Emission | Economic Growth | Decoupling Factor |
|---|---|---|---|---|
| Decoupling | strong decoupling | ΔCE < 0 | ΔRG > 0 | ε < 0 |
| weak decoupling | ΔCE > 0 | ΔRG > 0 | 0 < ε < 0.8 | |
| recessive decoupling | ΔCE < 0 | ΔRG < 0 | ε > 1.2 | |
| Coupling | growth link | ΔCE > 0 | ΔRG > 0 | 0.8 ≤ ε ≤ 1.2 |
| recessive link | ΔCE < 0 | ΔRG < 0 | 0.8 ≤ ε ≤ 1.2 | |
| Negative decoupling | expansive negative decoupling | ΔCE > 0 | ΔRG > 0 | ε > 1.2 |
| strong negative decoupling | ΔCE < 0 | ΔRG < 0 | ε < 0 | |
| weak negative decoupling | ΔCE < 0 | ΔRG < 0 | 0 < ε < 0.8 |
| Variables | Units | N | Mean | Sd | Min | Max |
|---|---|---|---|---|---|---|
| Carbon emissions () | 165 | 277 | 141 | 82 | 805 | |
| Real GDP | 165 | 1641 | 1225 | 189 | 6691 | |
| Total energy use (Energy) | (tce: tonnes coal equivalent.) | 165 | 133 | 62 | 43 | 325 |
| Emission factor () | 165 | 2.105 | 0.367 | 1.439 | 3.050 | |
| Energy intensity () | 165 | 0.107 | 0.057 | 0.035 | 0.298 | |
| GDP per capita () | 165 | 32 | 22 | 5 | 115 | |
| Population () | 165 | 53 | 18 | 19 | 85 |
| CDP | MRP | WLP | |||
|---|---|---|---|---|---|
| Shanghai | 2.57 | Anhui | 2.06 | Chongqing | 7.17 |
| Jiangsu | 1.63 | Hubei | 3.33 | Sichuan | 12.66 |
| Zhejiang | 6.38 | Jiangxi | 4.14 | Yunnan | 1.65 |
| Hunan | 2.46 | Guizhou | 2.13 |
Disclaimer/Publisher’s Note: The statements, opinions and data contained in all publications are solely those of the individual author(s) and contributor(s) and not of MDPI and/or the editor(s). MDPI and/or the editor(s) disclaim responsibility for any injury to people or property resulting from any ideas, methods, instructions or products referred to in the content. |
© 2024 by the authors. Licensee MDPI, Basel, Switzerland. This article is an open access article distributed under the terms and conditions of the Creative Commons Attribution (CC BY) license (https://creativecommons.org/licenses/by/4.0/).
Share and Cite
Fu, J.; Wang, F.; Guo, J. Decoupling Economic Growth from Carbon Emissions in the Yangtze River Economic Belt of China: From the Coordinated Regional Development Perspective. Sustainability 2024, 16, 2477. https://doi.org/10.3390/su16062477
Fu J, Wang F, Guo J. Decoupling Economic Growth from Carbon Emissions in the Yangtze River Economic Belt of China: From the Coordinated Regional Development Perspective. Sustainability. 2024; 16(6):2477. https://doi.org/10.3390/su16062477
Chicago/Turabian StyleFu, Jiasha, Fan Wang, and Jin Guo. 2024. "Decoupling Economic Growth from Carbon Emissions in the Yangtze River Economic Belt of China: From the Coordinated Regional Development Perspective" Sustainability 16, no. 6: 2477. https://doi.org/10.3390/su16062477
APA StyleFu, J., Wang, F., & Guo, J. (2024). Decoupling Economic Growth from Carbon Emissions in the Yangtze River Economic Belt of China: From the Coordinated Regional Development Perspective. Sustainability, 16(6), 2477. https://doi.org/10.3390/su16062477