1. Introduction
Nuclear energy is a recognized, clean, and economical modern energy source that can replace conventional energy sources on a large scale. It has many advantages, such as high energy density, abundant resources, low pollution, and low power generation costs. However, unlike other renewable energy sources, there are potential radiation safety issues in the process of nuclear energy utilization. If a severe accident occurs at a nuclear power plant, leading to the large-scale release of radionuclides, the consequences will be catastrophic. Therefore, safety issues must be given top priority in the process of nuclear energy utilization.
In the event of a radioactive release accident, it is crucial to ensure the safe evacuation of personnel from the plant. Emergency evacuation routes on site were formulated for accident situations during the early design of nuclear power plants. However, in actual accidents, the uncertainty of atmospheric conditions may cause the evacuation routes to pass through radioactive plumes, resulting in higher radiation doses for personnel evacuating from the plant area. Therefore, it is important to consider the potential impact of atmospheric conditions when formulating emergency evacuation plans.
The current state of research on emergency evacuation strategies for nuclear power plant accidents is extensive, with numerous factors influencing evacuation dynamics being explored by scholars. Zou et al. established a mathematical model using graph theory and point graph parity methods, considering factors such as road capacity and external influences [
1]. Jang et al. analyzed the impact of child pickup behaviors using a dynamic model based on intelligent agents [
2]. Vegsoova et al. found that smaller emergency groups resulted in longer evacuation times [
3]. Kim et al. demonstrated that travel demand levels affect the effectiveness of evacuation strategies [
4].
Uncertainty during emergency evacuation is a crucial factor, presenting challenges for decision makers. Several scholars have investigated this aspect. Park et al. used TSIS-CORSIM to collect data and construct a multi-model network to identify factors influencing evacuation time uncertainty [
5]. Li et al. proposed a Fuzzy Gradient Chance-Constrained Evacuation Model (FGCCEM) to address various uncertainties in evacuation management and planning [
6]. Lakshay et al. developed evacuation strategies for public transportation using a mathematical model, offering a method to manage external environmental uncertainty [
7].
Various simulation methods and models have been proposed for nuclear accident emergency evacuation, including Agent-based Modeling (ABM) [
8], the Dynamic Dose-based Emergency Evacuation Model (DDEEM) [
9], the Complex Terrain based on the A* algorithm (CTA) [
10], the Random Forest Exit Choice Model [
11], and the Fuzzy-Improved Genetic Algorithm (F_IGA) [
12]. Probability Safety Assessment (PSA) methods, such as Kimura et al.’s three-level PSA criteria, have been utilized for evaluating nuclear accident evacuations, calculating early doses, and assessing protective action effectiveness [
13]. Dong et al. used PSA to compare the radiation doses and risks for workers and the public under emergency evacuation conditions at multiple nuclear power plants [
14].
Planning methods play a crucial role in evacuation route determination. Teichmann et al. introduced a novel planning optimization method based on multicriteria mixed-integer linear programming for determining rapid evacuation routes [
15]. Herschelman et al. proposed a new evacuation route planning method that satisfied conflict-free constraints while minimizing evacuation time [
16]. Tang et al. presented a multi-objective evacuation path optimization method for severe nuclear accidents, combining atmospheric dispersion models, improved ant colony algorithms, and road resistance models to find the evacuation path with minimal time and dose [
17].
Researchers have explored the effectiveness of zone-based and staged evacuations. For instance, Park et al. addressed the uneven population density in evacuation areas by scoring staged evacuation strategies to identify the optimal approach [
18]. Sun et al. divided nuclear power plants into protection, management, and construction zones, conducting separate analyses and modeling to achieve favorable results [
19]. Zhao et al. proposed a risk-assessment-based zoning evacuation framework to assist decision makers in analyzing complex information for designing effective evacuation plans [
20]. Xie et al. used exposure risk as an optimization goal to construct a zoning evacuation planning model based on cellular transport [
21].
With the rapid development of high-tech solutions, novel technologies have been increasingly applied in the field of nuclear emergency management. Park et al. investigated the integration of artificial intelligence into various disaster management stages, discussing the developmental direction of radiation emergency response systems [
22]. Amir et al. proposed a formalized model for nuclear accident evacuation using Agent-Based Simulation (ABS) [
23]. Chu et al. introduced the emergency evacuation simulation system for the “Hualong One” plant in China, utilizing integrated technology to directly create three-dimensional virtual scenes from design models and developing an AI pathfinding algorithm for nuclear power plant emergency evacuation simulations [
24]. Li et al. applied an emergency evacuation virtual reality simulation system to estimate the evacuation time for the Fuqing Nuclear Power Station [
25].
Several studies have also delved into evacuation methods. Shin et al. suggested wearing respiratory protective equipment during emergency evacuations to minimize random exposure to radioactive substances [
26]. Nagashima et al. developed an evacuation exposure risk assessment decision method reflecting accident scenarios and regional characteristics such as population and geography [
27]. Ham et al. proposed an evacuation plan that efficiently transports individuals using public transportation, suitable for large-scale emergency evacuations [
28]. Parr et al. quantitatively assessed the benefits of Microscopic Traffic Control (MTC) through the establishment of a traffic simulation model [
29].
Additionally, recent years have witnessed several meaningful research endeavors. Becerra et al. proposed three different nonlinear estimation techniques for the rapid and reliable estimation of radioactivity released during nuclear accidents [
30]. Choi et al. applied big data analysis techniques and proposed emergency evacuation recommendations based on the analysis of historical weather data [
31,
32]. Kim et al. conducted a simulation evacuation study based on the Shin Kori Nuclear Power Plant, focusing on personnel evacuation from buildings during accidents [
33]. Liptak et al. introduced the round-the-clock Decision Support System (ESTE), providing action recommendations to emergency personnel for protecting residents from radiation during nuclear accidents [
34]. Chen et al. designed a nuclear accident emergency response system based on unmanned aerial vehicles and bus systems for radiation field estimation and emergency evacuation [
35]. Kim et al. proposed a perception-based behavioral simulation framework using cognitive discovery to study residents’ protective actions during nuclear accidents [
36]. Park et al. presented a VR-based immersive experimental system capable of quantitatively extracting human behavioral characteristics in emergency evacuations, a field yet to be comprehensively studied [
37]. Yao et al. proposed a bus-based evacuation optimization method, converting mixed-integer nonlinear programming problems into mixed-integer linear programming problems using a Big-M free method [
38].
Most of the above studies on emergency evacuation of nuclear accidents ignore the influence of meteorological uncertainty on plume and rain, or the models used are complex and not suitable for emergency evacuation simulation. During an on-site emergency evacuation, the scope is small and the number of evacuees is limited, so there is no need to consider traffic carrying capacity. Additionally, the radioactive plumes inside the site are more concentrated and have higher concentrations. Therefore, it is particularly important to plan the evacuation route to avoid the direction of plume transport with the wind. The goal of on-site emergency evacuation planning should be to minimize the dose received by personnel. Therefore, when planning the route, it is necessary to quickly estimate the distribution of pollutant concentration and dose based on real-time meteorological data.
In this paper, an integrated solution of radionuclide release accident assessment and emergency evacuation decision making is proposed to solve the problem of optimal evacuation path decisions. The solution consists of three processes: atmospheric dispersion calculation, dose calculation, and path planning. The individual processes are connected through data exchange, thus allowing users to choose specific models based on experience. The proposed scheme combination is the Gaussian plume model, the dose conversion factor method, and an improved Dijkstra’s path planning algorithm. The algorithm combines the dispersion and dose results and weights the nodes by moving the expected dose, which is conducive to choosing the path with the least dose risk. A program called ADDC (Atmospheric Dispersion and Dose Calculation) was developed based on the recommended scheme. ADDC takes into account the influence of meteorological conditions and source terms, and can predict radionuclide dispersion based on real-time meteorological data. It can also estimate the radiation dose that people along the evacuation path may receive and plan the optimal evacuation route according to the principle of minimum expected dose. The program has simple input parameters, a fast running speed, and can be applied to nuclear accident site emergency response. In addition, the Gaussian plume model adopted by ADDC is based on the atmospheric dispersion law and pays attention to the influence of the source term. Dose estimates and optimal evacuation routes can be obtained quickly and at very low cost in response to rapidly changing environmental conditions.
In
Section 2, the paper describes the recommended combination of solutions. In the whole solution, we give the choice of each part of the model to the user, and while the applicability and accuracy of the model are also guaranteed by the user, the solution only guarantees the correct output on the premise of the correct input data. However, this paper still hopes that users will choose the Gaussian model as the atmospheric dispersion scheme. The excellent performance of the Gaussian model under specific conditions, its extremely high computational efficiency, and the mode of display solution are highly compatible with our solution to maximize the potential of this solution. The Gaussian model is a rough model, which may make its accuracy in complex building environments questionable. The Gaussian model has two advantages: fast computation and few input parameters. Most researchers focus on the former, while the latter is often ignored. Especially with the modern new model and the rapid development of computing power, the advantage of the Gaussian model in computing speed is not obvious. However, the advantages of having fewer input parameters and no need for modeling are crucial in certain scenarios. We put the choice of model in the hands of the user, making the solution highly versatile and flexible.
In
Section 3, we choose a spent fuel pool accident as a case, and the scenario is not necessarily consistent with the recommended model, just to demonstrate the implementation process and feasibility of the solution.
Prior to the Fukushima accident, research on the consequences of nuclear accidents primarily focused on the reactor core. It was widely believed that ensuring the safety and cooling of the core was the top priority in the event of a severe accident. The design of the SFP included high redundancy, leading to the general belief that the possibility of a severe accident in the SFP was extremely low [
11]. As a result, the safety analysis and risk assessment of the SFP did not receive sufficient attention. However, the Fukushima nuclear accident exposed the safety hazards of the SFP to external events beyond the design basis. There is now a risk of a large amount of radionuclide stored in the SFP leaking.
Accidental releases from SFPs can have equally severe consequences as core attacks. The NUREG/CR-4982 report, which studied the severe consequences of the Millstone 1 SFP accident, found that approximately 1472 assemblies of spent fuel released I-131 at a level of 4.51 × 10¹⁶ Bq, which is about one-tenth of the release from the Fukushima accident (1~4 × 10¹⁷ Bq), and Cs-137 at a level of 7.47 × 10¹⁷ Bq, exceeding the release levels of the Fukushima accident (7–700 × 1015 Bq) [
12,
13]. Although the radioactivity levels of fuel assemblies in SFPs decrease after a period of storage, the release of a large number of fuel assemblies containing radionuclides would still lead to severe consequences.
The remaining sections of the paper are organized as follows:
Section 2 will provide a detailed introduction to the specific implementation process, required data, and computational models of the integrated solution for optimal evacuation path decision making within the plant. It will also introduce the structure and functions of the ADDC program developed based on this solution. In order to verify the feasibility of this solution, the paper presents a case study based on meteorological data for three years 2020–2022 from a planned nuclear power plant site in China, which assumes a water loss incident in SFP, resulting in the release of radionuclides. The test case is described in
Section 3, and the test results are given and discussed in
Section 4.
Section 5 will give a summary.
2. Methods
2.1. Program Structure
Our research focus and innovation point is a fast, efficient, and easy-to-use solution for emergency evacuation of nuclide release accidents, which consists of three core processes: and (1) concentration calculation process; (2) dose calculation process; (3) Path planning process. We expect the scheme to have a high degree of flexibility and scalability and then become a common mode for emergency evacuation of all kinds of nuclear accidents. Therefore, the three processes in the scheme are only connected through data transmission, and there is no coupling in physical processes. The role of process 1 is to provide the radionuclide concentration for process 2, and the role of process 2 is to provide the dose required for process 3 to plan the path. The Gaussian model, dose conversion factor method, and Dijkstra’s algorithm presented in the following sections are for demonstration and recommended use only. In fact, as long as the purpose can be achieved, the scheme of the three processes can be freely chosen. For example, in process 1, the Gaussian model, Lagrange model, Euler model, or any other model can be used to obtain the concentration, no matter which model is used to simulate the atmospheric dispersion process, it will not affect the subsequent dose calculation and path planning process. Therefore, users can flexibly set it according to different scenarios. In order to realize the full potential of this solution, we recommend that users use the following combination of schemes: the Gaussian plume model, the dose conversion factor method, and Dijkstra’s algorithm, which has been implemented in ADDC and is described in detail below.
The ADDC program is composed of four modules: data preparation, atmospheric dispersion calculation, dose calculation, and path planning. The program’s structure is illustrated in
Figure 1.
There are three primary inputs for the program: observed meteorological data, source data, and map data. Observed meteorological data typically includes wind direction, wind speed, and atmospheric stability class, which are measured at a height of 10 m using instruments. For locations without measuring instruments, historical meteorological data can be obtained from the European Centre for Medium-Range Weather Forecasts’ Fifth Generation Atmospheric Reanalysis dataset (ERA5), and the atmospheric stability class can be estimated using the method recommended in
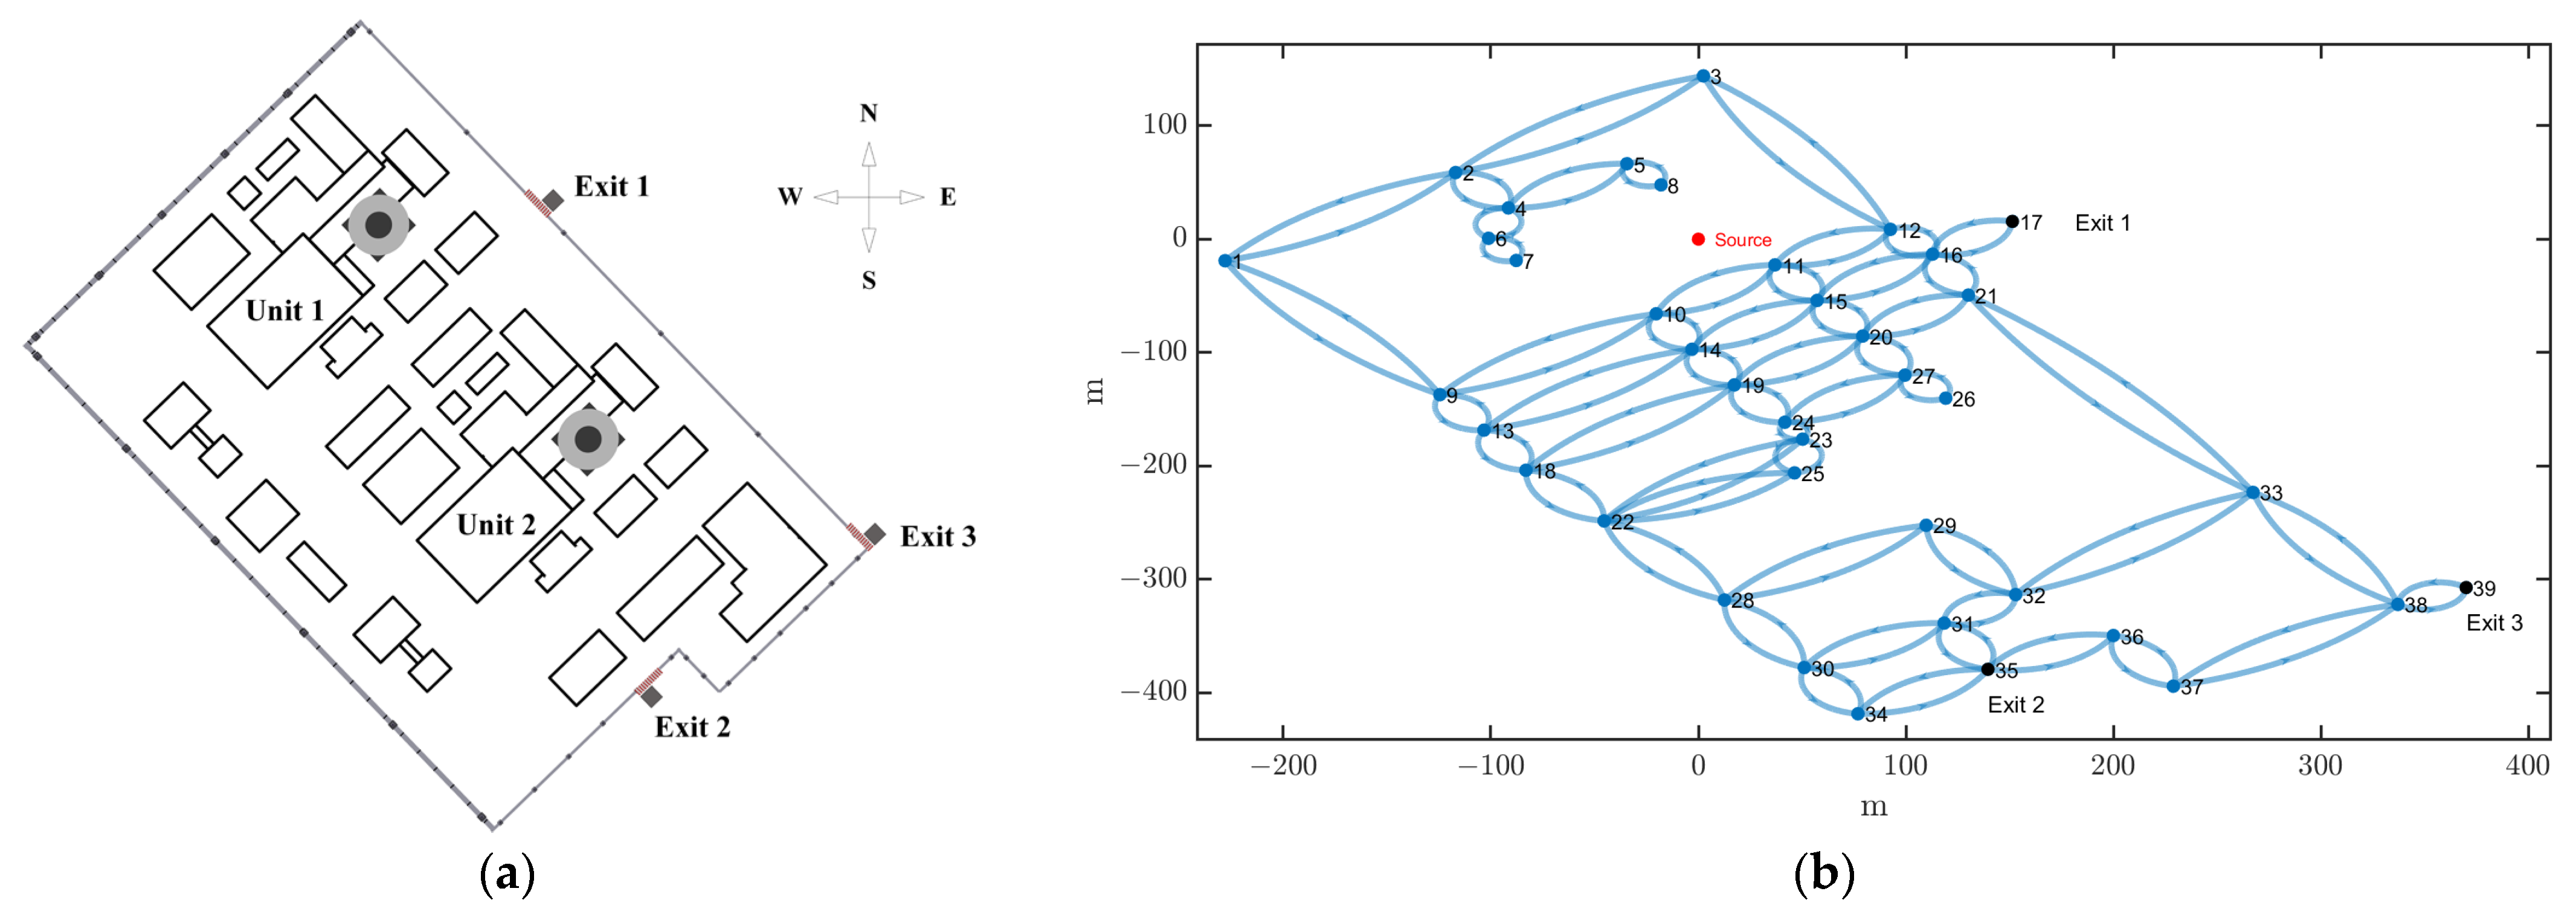
Section 2.2. Source data includes the types and amounts of radioactive nuclides released by emission sources. Map data refers to the abstracted connectivity graph data from actual maps, including the number and coordinates of map nodes as well as the connection relationships between nodes.
The data preparation module will analyze historical weather data statistically, creating three-dimensional joint frequency distributions from the meteorological data and converting measured meteorological data into data for pollutant release height. The atmospheric dispersion calculation module uses the Gaussian plume model to estimate the short-term atmospheric dispersion factor, which is the relative concentration of pollutants at a specified distance in each downwind direction based on the joint frequency distribution of input meteorological data. The output of this module will serve as input for the dose calculation module. The dose calculation module uses the dose conversion factor method to calculate the cumulative dose received at a specified location during a specified time period, as well as the dose received by individuals moving along a specified path. The path dose will be used as the edge weight for the path planning module. The path planning module is based on an improved Dijkstra’s algorithm and can find the evacuation path that minimizes the dose received by individuals.
The program can generate three types of results: atmospheric dispersion factor distribution, dose distribution, and shortest path information. The atmospheric dispersion factor distribution result provides an estimated value of the atmospheric dispersion factor and the corresponding probability value at each specific location. The probability value represents the likelihood of the actual atmospheric dispersion factor exceeding this estimated value. The dose distribution result provides the cumulative dose at each location during a specified time period, calculated based on the atmospheric dispersion factor distribution. The shortest path result provides node information and the total dose of the shortest path.
The program’s calculation steps include: firstly, converting the measured meteorological data into standard meteorological data for the release height through data conversion. Then, calculate the atmospheric dispersion factor at specified distances in each downwind direction through the atmospheric dispersion calculation model. After that, calculate the dose distribution through the dose calculation module. Finally, obtain the evacuation path with the minimum dose risk through the path planning module.
2.2. Atmospheric Dispersion
After radionuclides are released into the atmosphere from nuclear power plants, the first step is atmospheric dispersion. This refers to the combined processes of atmospheric transport and atmospheric diffusion. Atmospheric transport involves the drifting of radionuclides with the wind as they rise, while atmospheric diffusion refers to the diffusion of radionuclides in the horizontal and vertical directions due to atmospheric turbulence during transport [
39]. The assessment of atmospheric dispersion often uses the atmospheric dispersion factor, which is the ratio of the pollutant concentration χ at a specified location to the pollutant emission strength Q.
There are three types of atmospheric dispersion models: Gaussian models, Lagrangian models, and Eulerian models. The solution proposed in this article adopts the Gaussian puff model, which has the fastest calculation speed and can maintain high accuracy within a short distance. It is suitable for simulating the early stages of nuclear accidents within a short period of time and at a close range, and it is more suitable for emergency evacuation scenarios. The Gaussian model is based on the gradient transport theory (K-theory) and is derived under the assumption that the diffusion coefficient K is constant. It can also be derived through turbulence statistical theory under the assumption of steady and uniform turbulence [
40]. The main assumptions of the Gaussian model include: (1) conservation of pollutant mass; (2) continuous, uniform, and stable release of pollutants; (3) uniform and steady atmospheric flow; and (4) pollutants following a normal distribution in both horizontal and vertical directions. The Gaussian model has the advantages of requiring fewer input parameters and having high computational efficiency in calculating the short-term atmospheric dispersion process of continuous point source releases at close distances. It is widely used in atmospheric dispersion assessments of nuclear power plants [
41].
The weather conditions surrounding the power plant are constantly changing, and the concentration of pollutants at different locations varies during accidents under different weather conditions. To conduct a preliminary atmospheric dispersion assessment of the plant site, we need to find a typical value that can integrate all meteorological information and be conservative enough to reflect the high and low concentrations of pollutants. For specific weather conditions, we can calculate the actual distribution of pollutant concentrations. This article refers to the RG1.145 guideline and uses probability estimation quantile values to determine the typical value [
42]. The atmospheric dispersion calculation module of the ADDC program is divided into two calculation modes based on the input data: (a) calculating the actual value of atmospheric dispersion factors using real-time meteorological data; (b) calculating the probability estimation value of atmospheric dispersion factors using historical meteorological data.
For mode (b), the program aims to provide conservative conclusions by referring to the NUREG/CR-2858 report and using the upper 0.5% value when calculating atmospheric dispersion factors for each wind direction [
43]. The α% percentile represents the probability that the actual value exceeds this value. For instance, the 0.5% value indicates that the possibility of the actual concentration exceeding the typical concentration is only 0.5%, which means that there is a 99.5% probability that the actual concentration is lower than the calculated concentration.
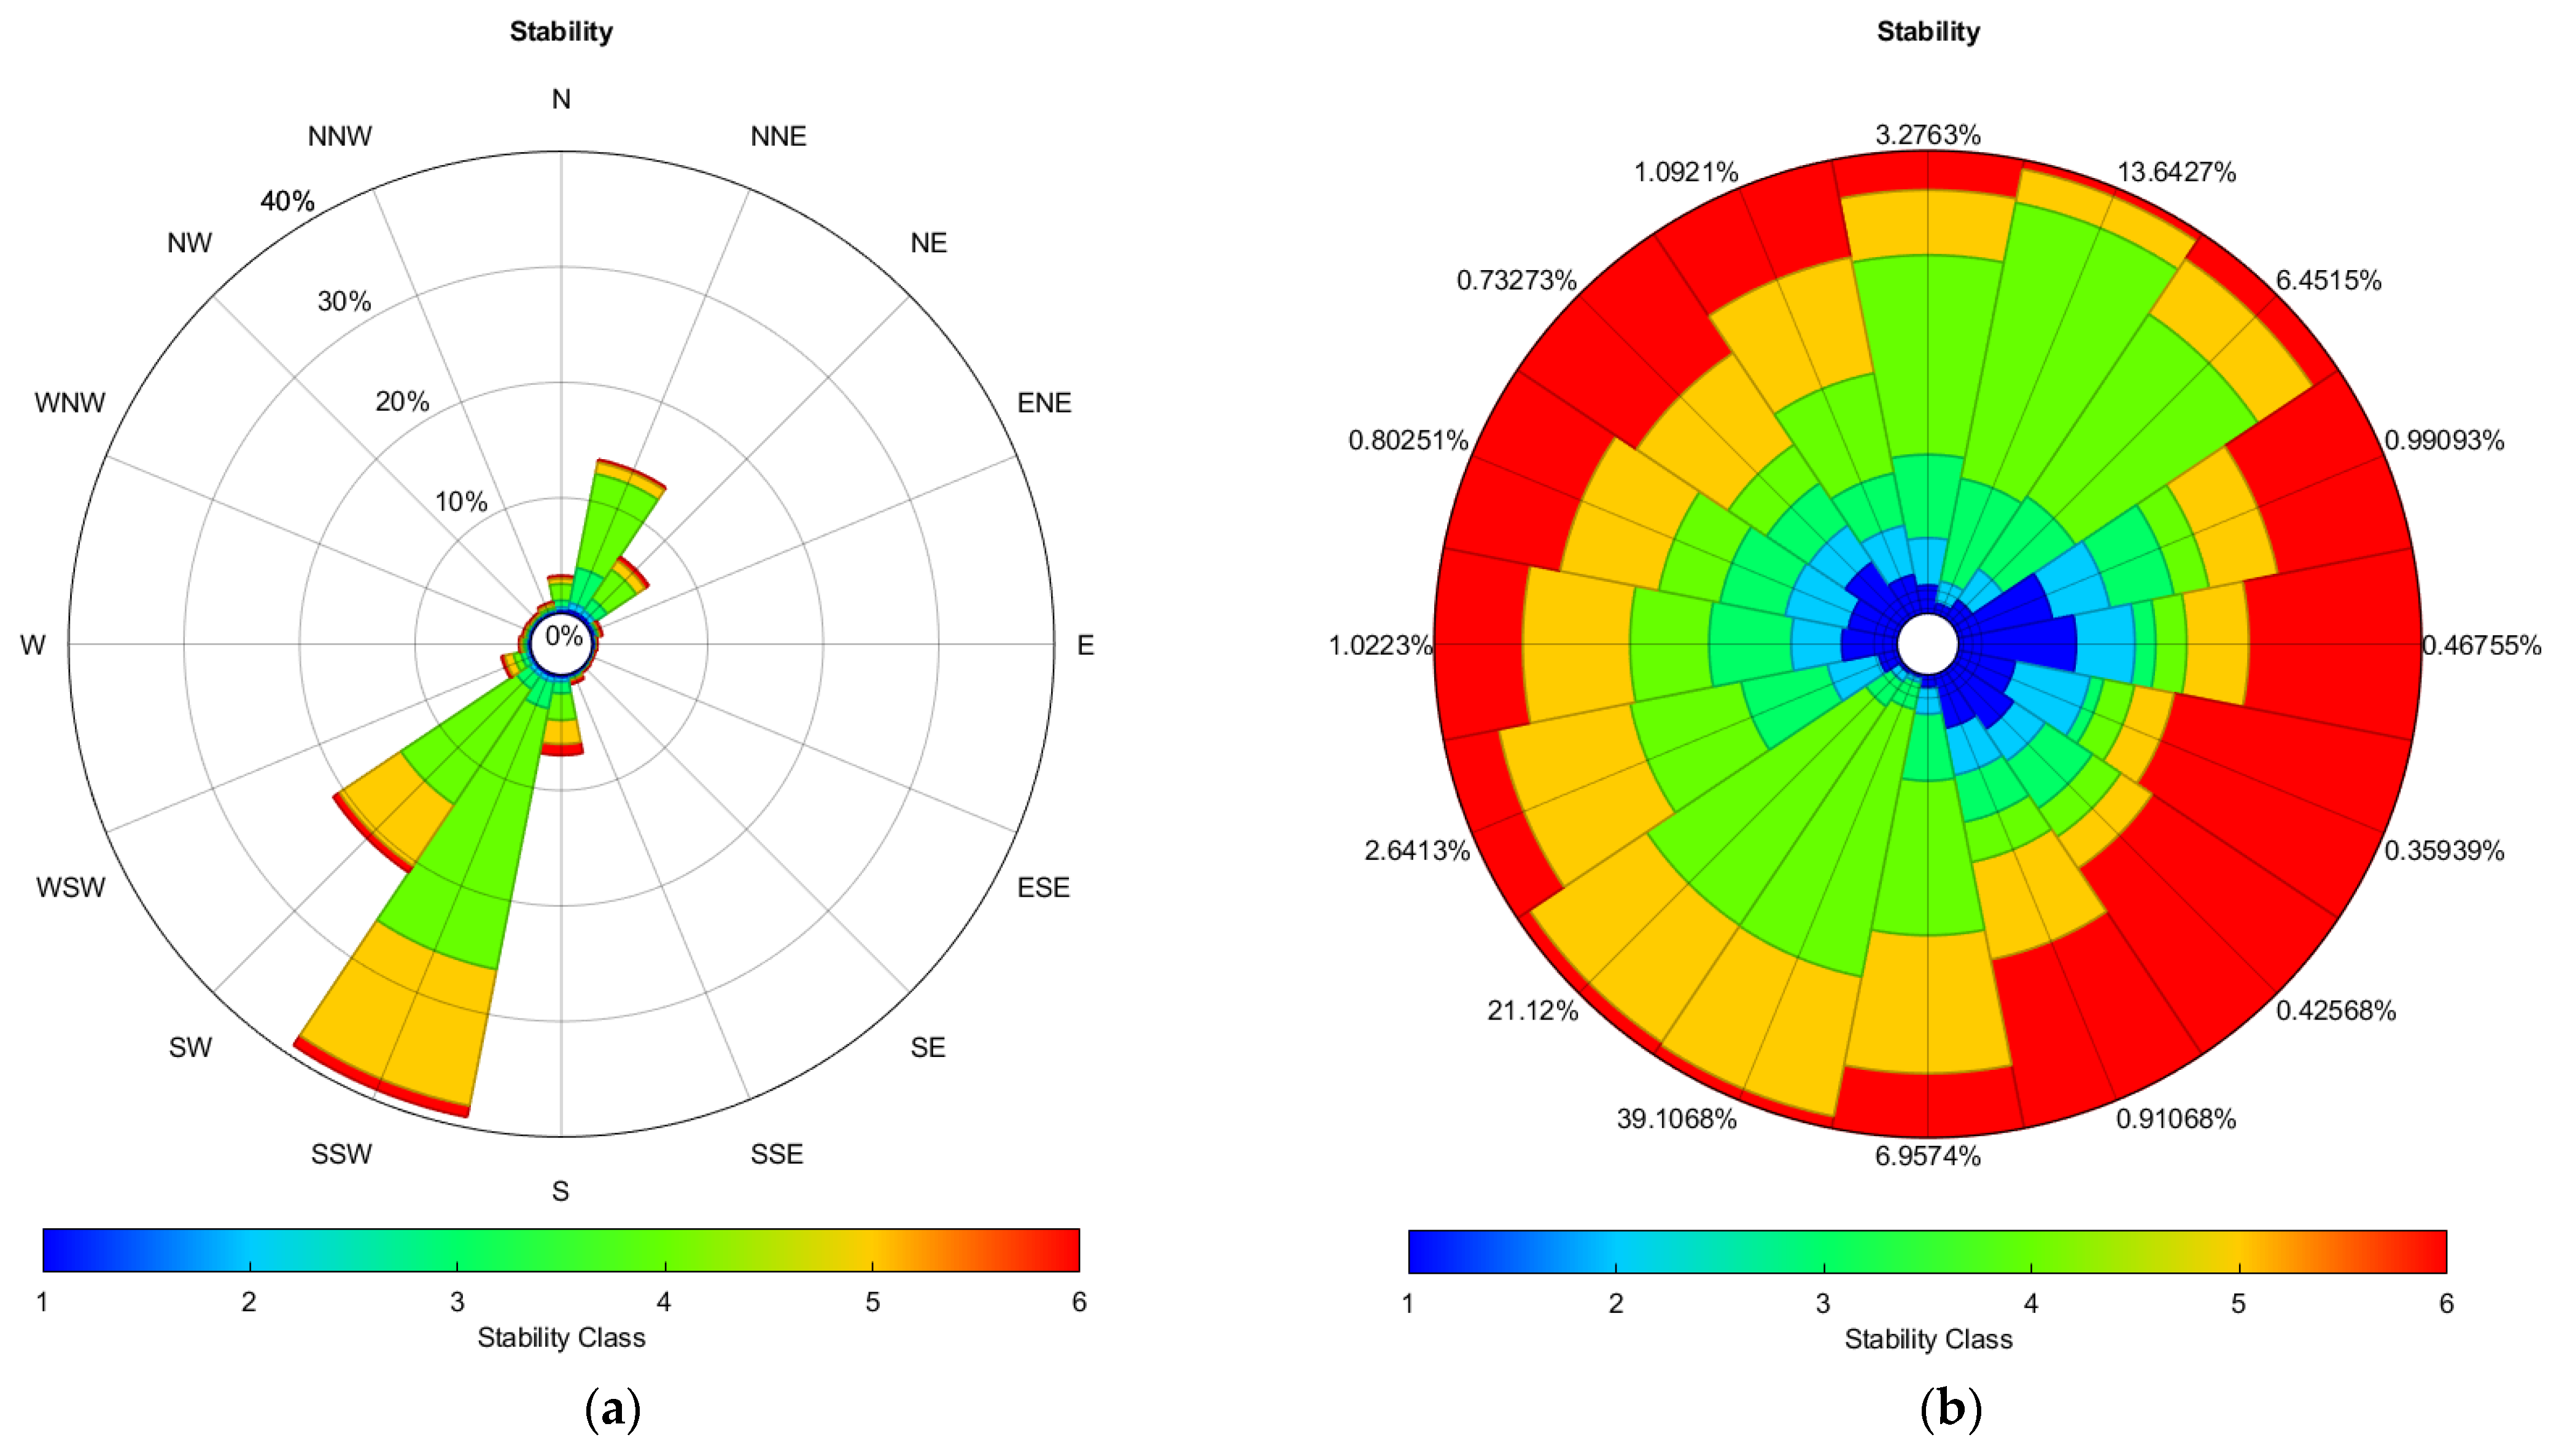
To simplify the estimation of meteorological conditions, it is necessary to discretize the meteorological parameters. The ADDC program requires three dimensions of meteorological parameters as input, including wind speed, wind direction, and atmospheric stability class. Wind direction is divided into an average of 16 categories atmospheric stability is divided into 6 categories based on the Pasquill stability class, and wind speed categories can be customized by users according to their needs.
In the early stages of site selection without the installation of meteorological measurement devices, atmospheric stability data are usually not easy to obtain, so this paper provides a method for estimating atmospheric stability. The study by Golder et al. gives an image of the relationship between the Monin–Obukov length and the Pasquill stability level [
44]. The Monin–Obukov length is defined as follows:
where
L is the Monin–Obukhov length (m),
u* is the friction velocity (m/s),
cp is the specific heat capacity of air at constant pressure with a constant value of 1007 J/(kg·K), ϱ is the air density with a constant value of 1.293 kg/m³, T is the ambient temperature (K),
k is the Von Karman constant, typically assigned a value of 0.4,
g is the acceleration due to gravity, with a value of 9.8 m/s², and
H is the vertical heat flux (W/m²).
In the above equation, apart from the constant, the friction velocity u*, ambient temperature T, and vertical heat flux H can all be obtained from the Fifth Generation European Centre for Medium-Range Weather Forecasts’ atmospheric reanalysis dataset (ERA5).
When the surface friction length
z0 = 0.2 m, the relationship between Monin–Obukhov length and Pasquill stability class is shown in
Table 1.
Currently, most wind speed measuring instruments are installed at a height of 10 m to measure wind speed. However, pollutant emission sources can be located at any height. Therefore, to calculate the atmospheric dispersion factor, the wind speed at the release height must be determined. The user can set the release height based on the actual situation, and in this example, it is set to 10 m. The program assumes an exponential relationship between wind speed and height, with the exponent being a function of atmospheric stability, as described by Smith [
45]. The relationship can be expressed as follows:
where
,
are the wind speed at the height of the pollutant release source and measurement, respectively (m/s).
,
are the height of the pollutant release source and measurement, respectively (m).
p is the power law exponent. For unstable and neutral atmospheric conditions (A–D categories), the value of
p is 0.25. For stable atmospheric conditions (E and F categories), the value of
p is 0.5.
The calculation is based on the recommended method of the RG1.145 guidelines. It calculates the possible short-term atmospheric dispersion factors and their occurrence frequencies at specified distances in each downwind direction [
42].
The basic equation for ground release is:
where
is the atmospheric dispersion factor at a downwind distance
for wind speed class
and atmospheric stability class
.
is the average wind speed at a height of 10 m for wind speed class
and atmospheric stability class
(m/s).
,
are the horizontal and vertical plume dispersion at a downwind distance
in the downwind direction for stability class
, respectively (m).
is the building wake mixing volume coefficient. The default setting is 0.5.
is the minimum cross-sectional area of a building that contributes to the dilution of the building wake(m
2).
is the meander factor for horizontal plume dispersion for wind speed class
and atmospheric stability class
.
When the atmospheric stability is neutral (class D) or stable (class E, F) and the 10 m wind speed is less than 6 m/s, it is necessary to consider the horizontal plume meander effect. Equations (3)–(5) should be calculated sequentially, and the results of Equations (3) and (4) should be compared. The larger value should be compared with Equation (5), and the smaller value should be selected as the short-term dispersion factor for the given wind speed and atmospheric stability.
In unstable (A–C class) atmospheric stability or when the 10 m wind speed is greater than 6 m/s, the meander effect of horizontal plume is not considered. Only the results of Equations (3) and (4) are compared, and the larger value is taken as the short-term dispersion factor for the given wind speed and atmospheric stability.
When the downwind distance exceeds 800 m, it is necessary to adjust the product of the meander factor and the cross-flow lateral diffusion in Equation (5) to ensure accuracy.
The equation for calculating the meander factor is:
The minimum value constraint for the meander factor is 1, and the values of the constants in Equation (8) for different stability classes are referenced from RG1.145, as shown in
Table 2 [
42].
The equation for calculating the plume dispersion factor
and
is:
where
is the horizontal or vertical plume dispersion at a downwind distance
in the downwind direction for stability class
(m).
a,
b and
c are constants, and their values can also refer to RG1.145 [
42].
In this section, we calculate the distribution of pollutant concentrations around the emission source using the Gaussian plume model. The model is based on meteorological data provided by the user. We express the concentration as a ratio of the actual concentration to the emission source strength. By multiplying the relative concentration distribution data with the emission source strength data provided by the user, we obtain the actual concentration distribution data for pollutants. This data is used to calculate the effective dose in the next section.
2.3. Dose Calculation
In the previous section, we completed the calculation of atmospheric dispersion and obtained the relative concentration distribution around the nuclear power plant site. Nuclear accidents can release radionuclides that produce ionizing radiation, which can harm the human body. When organisms are exposed to ionizing radiation, it transmits energy to their organs, tissues, cells, molecules, and other basic life structures, triggering a series of complex physical, chemical, and biological changes. This can cause damage to the functions of various systems of organisms, resulting in a variety of biological effects. Ultimately, the assessment of the consequences of the release of a radioactive substance will be attributed to calculating the dose to which the human body is exposed. Therefore, this section will describe the method of calculating the dose in detail.
The most commonly used method for dose calculation is the Monte Carlo simulation method. However, in emergency response, due to limited time, the dose conversion factor method is also commonly used to quickly estimate the effective dose received by personnel. Currently, the standards related to dose conversion factors include the NUREG/CR-6547 report, the FGR11-13 series reports, the IAEA19 report, the ICRP series publications, etc. The dose conversion factor data used in this article is from the NUREG/CR-6547 report [
46].
The most commonly used unit of radiation dose is the Total Effective Dose Equivalent (TEDE), which is obtained by adding the external exposure dose and the internal exposure dose. External exposure can come from fission products suspended in the air (known as the cloud exposure dose rate) and fission product aerosols deposited on the ground (known as the ground exposure dose rate). Internal exposure occurs when fission product aerosols are inhaled and retained in the human body (gaseous fission products do not remain in the human body).
The external exposure dose results from both cloud irradiation and ground irradiation. In the short term, the dose from ground irradiation can be ignored without considering the deposition of smoke plumes. Within the time interval
, the equation for the dose rate of cloud irradiation caused by all radioactive nuclides at a distance
from the pollutant release source for organ
k is as follows:
where
is the cloud irradiation dose from all radioactive nuclides to organ
at distance
(Sv).
is the concentration of radionuclide
at distance
(Bq/m
3).
is the time elapsed since the pollutant started releasing(s).
is the decay constant of the radionuclide
(s
−1).
is the conversion factor for cloud irradiation dose from radioactive nuclide
to organ
(Sv·m³/Bq·s).
is the shielding factor for cloud irradiation dose, with a value of 0.5.
is the short-term atmospheric dispersion factor in the downwind direction at distance
(m
3/s).
is the intensity of the radioactive nuclide
released from the pollutant source (Bq/s).
is the wind speed (m/s).
To calculate the cloud dose of all radionuclides to organ , use Equation (10), and to calculate the concentration of radioactive nuclide , use Equation (11). Assuming that the wind speed is the speed at which radioactive nuclides are transported, the concentration of radioactive nuclides at the calculation point is 0 before the wind arrives. After the wind arrives, the concentration of radioactive nuclides at the calculation point becomes the equilibrium concentration, which is the product of the release intensity of radioactive nuclides and the short-term atmospheric dispersion factor. The process of concentration changing from zero to infinity can be ignored.
The internal irradiation dose is caused by fission product aerosols inhaled by the human body. Inert gas isotopes are inhaled and immediately exhaled, so they do not cause internal irradiation. Therefore, the conversion factor for the internal irradiation dose of inert gas isotopes is 0.
The equation for the dose rate of internal irradiation caused by all radioactive nuclides from the pollution source at the location
to organ
within time interval
is as follows:
where
is the internal irradiation dose from all radioactive nuclides to organ
at distance
(Sv).
is the conversion factor for internal irradiation dose from radioactive nuclide
to organ
(Sv·m³/Bq·s).
is the human breathing rate, with a value of 2.66 × 10
−4 m
3/s.
is the shielding factor for the internal irradiation dose, with a value of 0.5%.
Equation (12) is used to calculate the internal irradiation dose from all radionuclides to organ , where the concentration of radionuclide at distance is calculated using Equation (11).
The equation for the total irradiation dose rate to an organ
from all radioactive nuclides at a distance
from the pollutant release source within a time interval
is as follows:
Equation (13) can be used to calculate the total dose rate of all radionuclides per organ
per unit of time. By integrating this dose rate over time, we can obtain the total irradiation dose per organ
.
The dose is the equivalent dose from all radionuclides to the organ
. Due to the differing sensitivities of different organs to radiation, the equivalent doses of each organ are weighted by organ weighting factors
and then summed to obtain the effective dose, which represents the total effective dose to the whole body from radiation exposure.
The weighting factors
used in the program are taken from Publication ICRP 60, as shown in
Table 3 [
47].
As long as the relationship between the relative concentration of environmental pollutants and the time t is known, this method can be used to calculate the total effective dose at a specific location during a specific time period. It can also be used to calculate the total effective dose that individuals receive when moving along a specified path. The total effective dose received when moving along a specific path will be used as the path weight in the improved Dijkstra’s algorithm for optimal path planning.
2.4. Path Planning
In emergency evacuations, path planning is necessary to minimize the radiation dose suffered by personnel during the evacuation process in the factory area. With known start and exit points, the classical Dijkstra’s shortest path algorithm can efficiently solve the shortest distance path. However, when the shortest path directly passes through radioactive plumes or is close to the release source, it may result in higher radiation doses for personnel inside the facility. Therefore, the classical Dijkstra’s algorithm is not suitable for emergency planning in nuclear accidents.
In response to this problem, this paper proposes improvements to Dijkstra’s algorithm. The improved Dijkstra’s algorithm retains its original advantages of efficiency and accuracy. By integrating it with the pollution concentration distribution map and dose calculation method obtained in previous sections, it can be used to determine the evacuation path that minimizes the radiation dose to personnel inside the plant.
The principle of the improved Dijkstra’s algorithm is as follows: Let
be a weighted, directed network. Firstly, the set of nodes in the graph
is divided into two groups: the set
of nodes for which the minimum dose path has been determined (initially,
only contains the source node, and each time a minimum dose path is found, the corresponding node is added to the set
until all nodes are included in
); and the set
of nodes for which the minimum dose path is yet to be determined. Assuming that the facility personnel move from node
(coordinates
,
) to node
(coordinates
,
) at a fixed speed
, the coordinates of personnel’s location at any given time can be determined (assuming the selected location nodes are connected by straight lines). If the path is long or curved, it can be considered as connecting multiple straight line segments. By referring to the relative concentration distribution calculated based on meteorological data in
Section 2.2, the pollution concentration in the personnel’s environment at any given time can be determined, thus establishing the relationship between environmental pollution concentration and time. By integrating over time using the dose rate calculation formula in
Section 2.3, the expected dose from node
to
can be obtained. This expected dose is then substituted for distance as the weight between nodes, and the minimum dose paths from one node to all other nodes are calculated, expanding outward from the starting point until the endpoint is reached.
The algorithm can be described as follows:
is the set of endpoints of the minimum dose paths found from the node . It is initially an empty set, and the source node is added to . The remaining nodes form the set .
Calculate the expected dose list from the source node to the other nodes. Nodes not connected to the source node have an expected dose of infinity.
Perform a breadth-first traversal of the nodes connected to the source node and find the node with the minimum expected dose. The minimum dose path to this node is determined, and the node is moved from to .
Take the current node as the intermediate point and perform a breadth-first traversal, updating the expected dose for the traversed nodes.
Search for the node in with the minimum expected dose and move it to .
Perform a breadth-first search with this node as the intermediate point and update the expected dose.
Repeat the above steps until is empty.
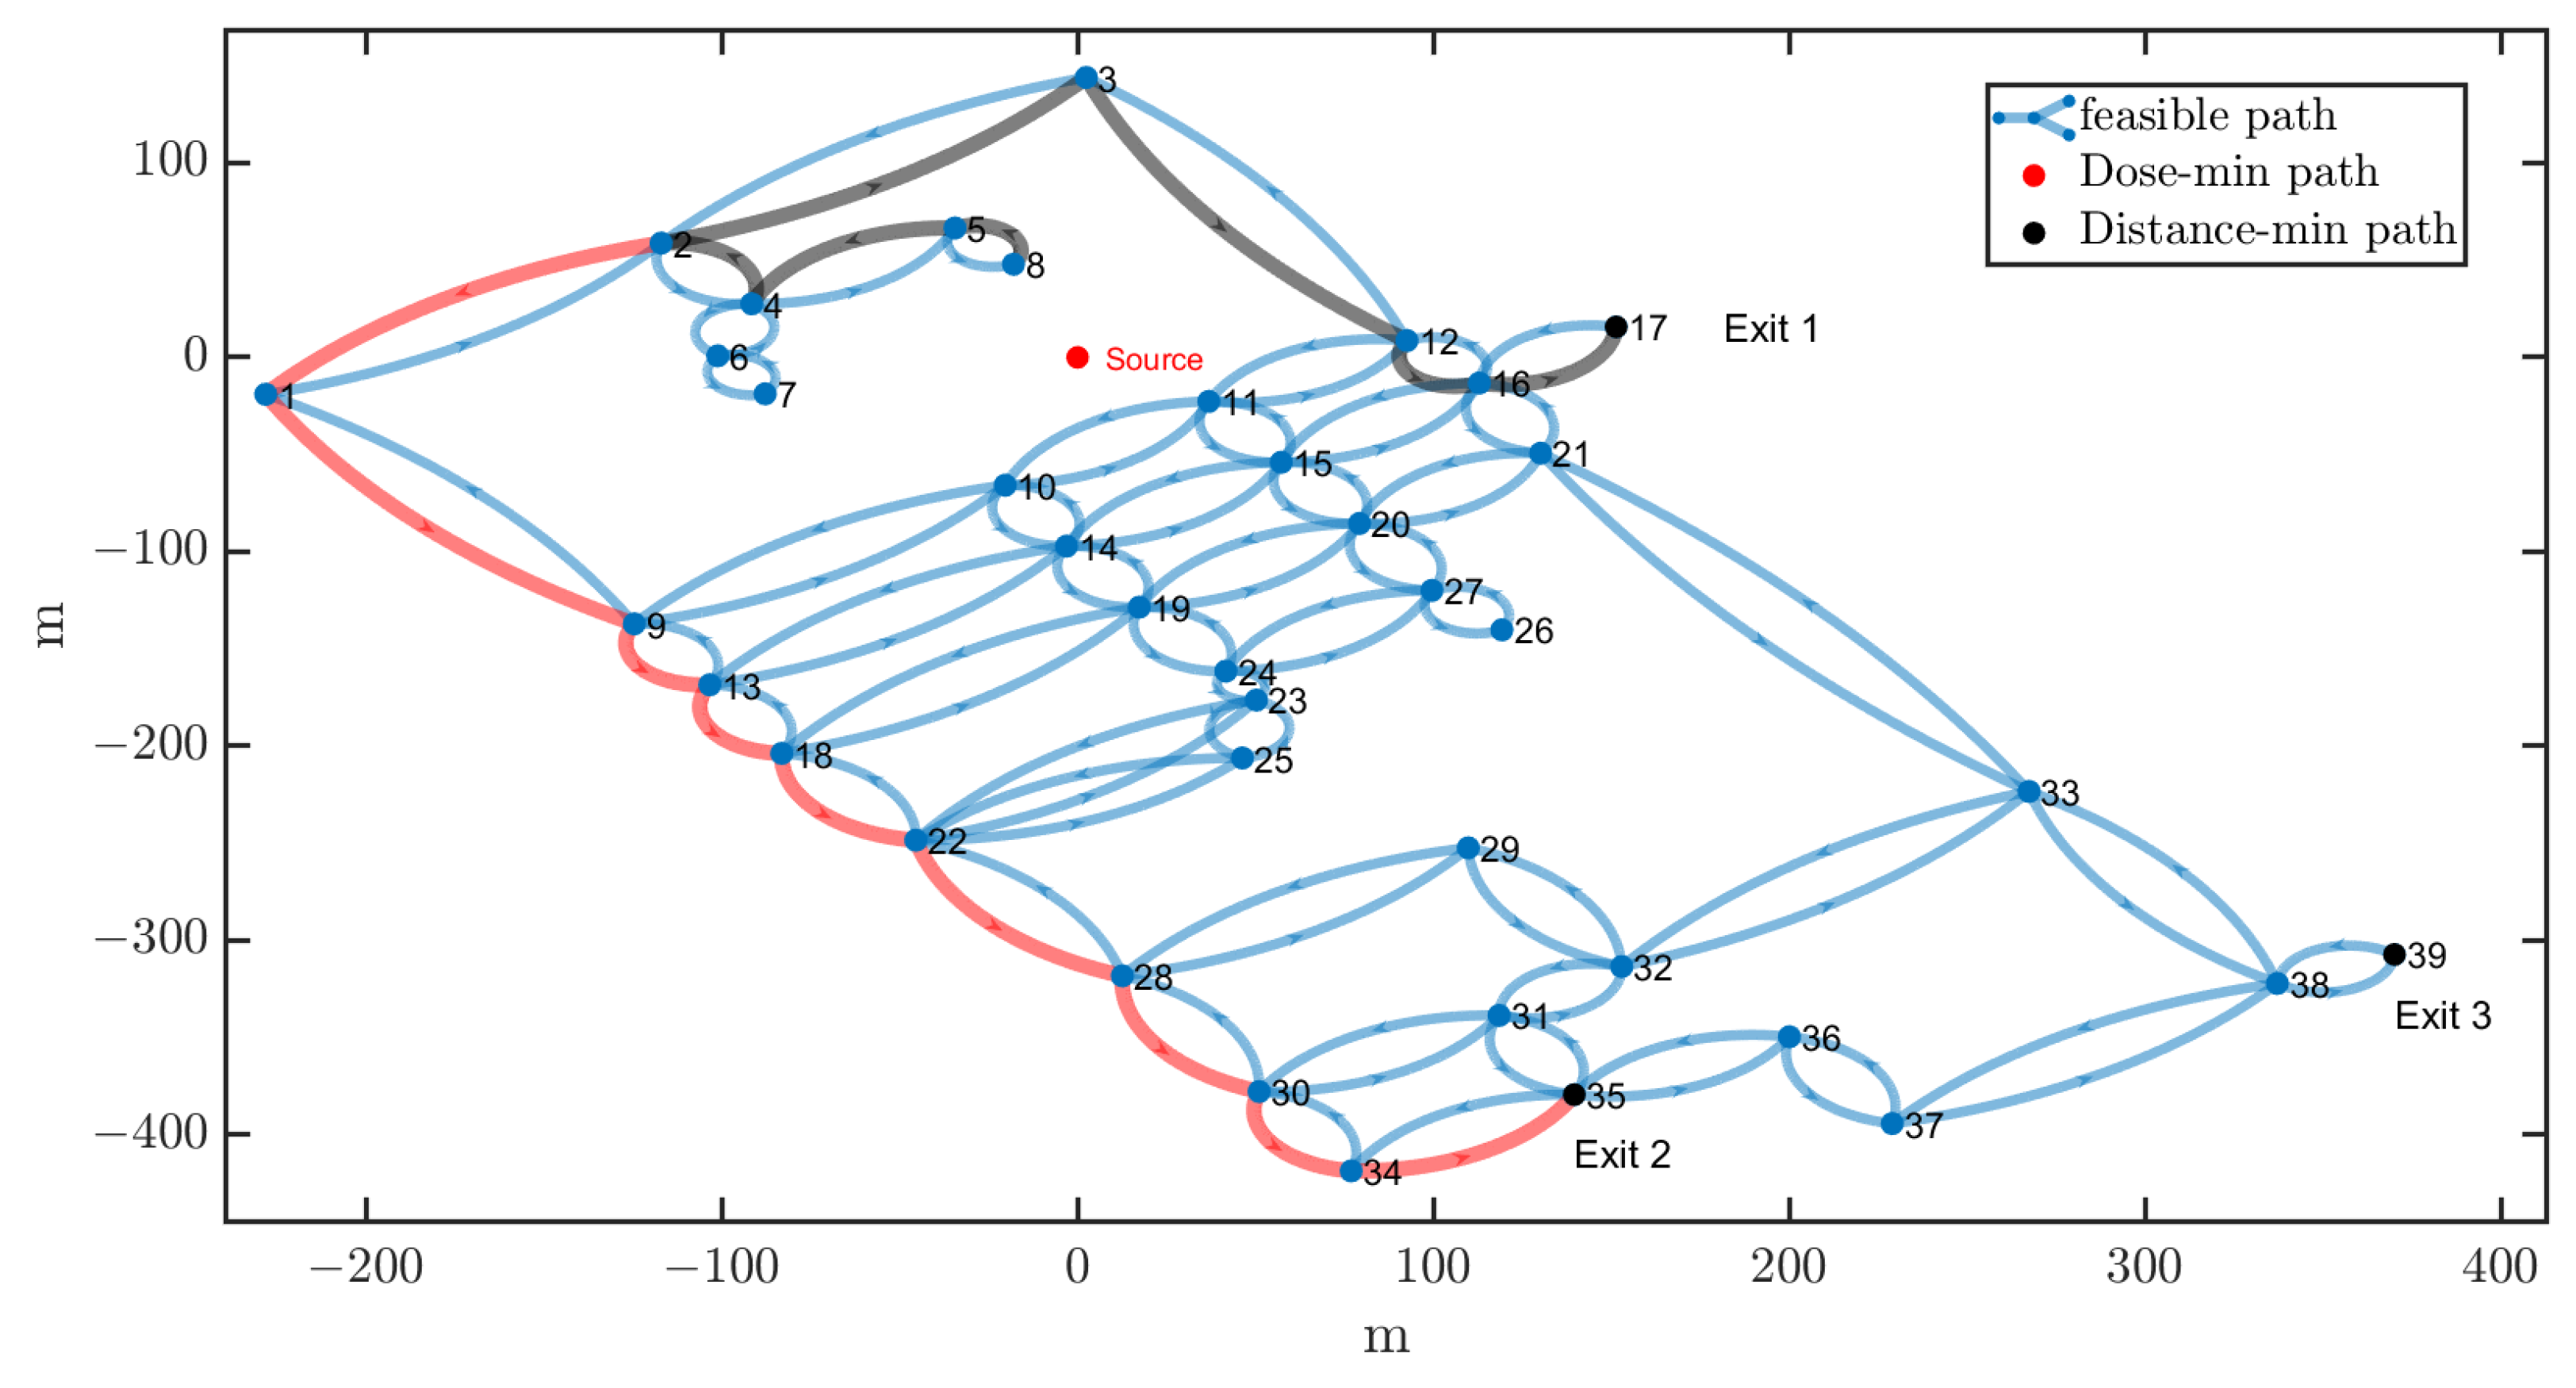
The ADDC program finally utilizes the relative concentration distribution data and the improved Dijkstra’s algorithm to determine the path with the minimum expected dose, which represents the optimal evacuation path. For problems with multiple endpoints, the program calculates the minimum dose path from the starting point to each endpoint separately, and then selects the path with the minimum expected dose from the calculated paths.
5. Conclusions
The paper presents an integrated solution for assessing the consequences of radioactive material release accidents and planning evacuation paths. The scheme consists of three processes: atmospheric dispersion calculation, dose calculation, and path planning. The three processes are highly independent and connected only by data transmission, allowing the user to freely choose the model according to the usage scenario. This paper details a recommended combination of solutions, including the Gaussian plume model, the dose conversion factor method, and an improved Dijkstra’s algorithm, and develops an application called ADDC to implement the recommended combination of solutions.
Under the proposed scheme combination, the atmospheric dispersion model is the Gaussian plume model, which has the advantages of fast calculation speed, high precision in close range, and no need for manual modeling. The dose conversion factor method is used to calculate the effective dose for an individual according to the concentration of environmental pollutants. In the path planning part, an improved path planning method based on Dijkstra’s algorithm is adopted. The improved Dijkstra’s algorithm can be combined with contaminant concentration distribution calculation and dose calculation methods. It uses the expected dose during the movement as the weight between nodes to find the evacuation path at the minimum dose. The proposed scheme combination has the advantages of simple application, high computational efficiency, few input parameters, low modeling cost, high flexibility, and universality, and is especially suitable for dealing with complex and changeable scenarios.
This paper chooses a planned nuclear power plant SFP release accident as an alternative example. The study assessed the risk of radiation exposure using meteorological data from 2020 to 2022. The results show that the individual radiation dose can reach 30–150 mSv within 2 h within 100 m from the release center, and the individual radiation dose can reach 5–15 mSv within 500 m. Compared with the shortest-distance path, the shortest path planned by the protocol can reduce the effective dose by 67.3%, effectively reducing the risk of radiation exposure during emergency evacuation.


