1. Introduction
In recent years, the health hazards of air pollution have become a global public health concern for the WHO and many countries. The United Nations Environment Programme (UNEP) has declared that air pollution has become the biggest threat to human health, causing nearly 6.5 million deaths each year [
1,
2]. Data from Switzerland’s IQAir show that in 2021, the annual average air pollution in 97% of cities across 117 countries worldwide exceeded the air quality standards set by the World Health Organization, with only 3.4% of the surveyed cities meeting the standards. China is one of the countries with the most severe air pollution. From 2012 to 2021, the proportion of days when the overall air quality in the Yangtze River Delta (YRD) region of China did not meet the standard was 30.25%, significantly higher than the national average of 19.2% during the same period. In response to frequent atmospheric pollution incidents, the 2022 Chinese government work report explicitly stated that it would “strengthen the coordinated control of multiple atmospheric pollutants and regional governance” and identified the YRD as the key target for governance. Environmental resource utilization efficiency is generally evaluated through the calculation of environmental efficiency, which reflects the efficiency of resource utilization and the level of pollution control based on the ratio of resource input to pollution emissions [
3,
4]. Therefore, Atmospheric Environmental Efficiency (AEE) is an extension of this concept in the field of atmospheric environment. It can help governments and companies evaluate the effectiveness of atmospheric environmental governance and resource utilization and develop corresponding policies and management measures. Therefore, a reasonable evaluation of regional AEE is a key link in implementing pollutant reduction policies and improving the environmental management level. By searching and summarizing the relevant research, we can categorize research related to AEE into three main aspects.
From the perspective of evaluation methods, there are two main methods for efficiency measurement, which are the stochastic frontier analysis (SFA) and the data envelopment analysis (DEA) [
5,
6]. When measuring efficiency, SFA takes into account the influence of the external environment and assumes the existence of a random error term for each production unit. For example, Kwon (2020) [
7] analyzed the production efficiency of Korean farmers by establishing a Bayesian stochastic frontier model with multiple error components. Kang (2022) [
8] analyzed the environmental efficiency of Korea based on SFA. However, SFA typically only considers one input and one output, while DEA can simultaneously consider multiple input and output indicators, allowing DEA to comprehensively evaluate efficiency levels [
9,
10]. Therefore, DEA and its derivative models are mostly used in efficiency measurement related to the atmosphere. For example, Liou (2011) [
11] constructed a global energy utilization and carbon dioxide emission efficiency index using DEA to evaluate national energy utilization efficiency and carbon dioxide emission efficiency. Wu et al. (2023) [
12] explored the regional differences and influencing factors of provincial atmospheric pollution emission efficiency in China using an improved SBM model and panel Tobit model. Liu et al. (2021) [
13] evaluated and tested the atmospheric environmental efficiency of Chinese cities using a super-efficiency SBM measurement model and spatial autocorrelation method. However, the DEA model cannot account for the stochastic errors in the production process. Fried et al. (2002) [
14] proposed a new three-stage DEA efficiency evaluation model that combines the SFA model and the DEA model. For instance, Lu (2022) [
15] used the three-stage DEA method to evaluate the impact of greenhouse gas emissions on climate change, which can remove environmental and stochastic error factors and calculate the true efficiency value. However, using the DEA model alone can only measure static efficiency and lacks efficiency analysis from a dynamic perspective, which cannot identify the optimization and improvement space of AEE [
16]. Therefore, this paper combines the use of the three-stage DEA and Malmquist index models to measure the AEE in the YRD from both static and dynamic perspectives, making the efficiency measurement results more scientifically reasonable.
As for evaluation indicators, there are two types of analysis frameworks based on input–output DEA analysis. One type considers that the emission of atmospheric pollutants cannot be completely avoided in economic activities and, therefore, uses atmospheric pollutants as input indicators to calculate the efficiency. For example, Wu (2018) [
17] calculated the efficiency of Haze Emissions in China by using SO2, NOx, and coal smoke as input indicators. Ding (2019) [
18] used SO2, smoke and dust, and NOx emissions as input factors to measure the efficiency and regional differences in cities in Zhejiang Province. Zhang (2019) [
19] used SO2, NOx, and PM2.5 as input factors to calculate the atmospheric pollution emission efficiency of China’s Jiangsu cement industry. The other type believes that using pollutants as input indicators is too economically oriented and cannot reflect actual efficiency. Instead, atmospheric pollutants should be used as output indicators to calculate the efficiency [
10,
20]. Therefore, Lv (2020) [
21] constructed an evaluation index system for the atmospheric environmental efficiency of Shandong Province using the annual average PM2.5 concentration as an unexpected output. Jiang (2022) [
22] analyzed atmospheric environmental efficiency and influencing factors by using industrial SO2 emissions as an unexpected output indicator. However, a single pollution indicator has difficulty comprehensively measuring the overall environmental pollution situation in a certain region. Therefore, Zhang (2021) [
23] used the annual average concentration of PM2.5, SO2, smoke, and dust emissions as unexpected outputs to measure the atmospheric environmental efficiency of cities in the Yangtze River Economic Belt. Huang (2021) [
24] used SO2, NOx, and PM2.5 emissions simultaneously as unexpected outputs to measure the atmospheric environmental efficiency of Shandong, China. This study adopts the second approach and uses atmospheric pollutants as unexpected output indicators for calculation. Since the emissions of different pollutants may be highly correlated, including them in the same equation may lead to endogeneity issues. Additionally, simply adding up these indicators into one variable may lead to difficulties in calculating due to unit differences among pollutants. The entropy method can standardize each indicator and incorporate the weights of each indicator to obtain a comprehensive evaluation result of relative importance. Therefore, this paper, while adhering to the principle of data availability, comprehensively considers the emissions of various pollutants and designs a new comprehensive indicator, the Atmospheric Pollution Index (API), to make the measurement results more scientifically reasonable.
For the evaluation objects, the YRD region is one of the most economically developed and densely populated areas in China, as well as one of the areas with the most severe atmospheric pollution. With the rapid development of the economy and the acceleration of industrialization, urbanization, and modernization processes in the YRD, the total energy consumption and atmospheric pollutant emissions have remained high, posing a huge threat to public health and ecological security. In this study, a search was conducted on the Web of Science using the keywords “Yangtze River Delta”, which yielded over 6000 academic papers spanning 20 years. The research topics covered a wide range of subjects, including environmental pollution, atmospheric particles, geological changes, urbanization, and many others, and atmospheric pollution has been a hot topic over the past 20 years. However, most research on atmospheric pollution related to the YRD focuses on the changes in pollutant concentrations and sources, with relatively inadequate comprehensive evaluations of the AEE. Since the promulgation of the “Action Plan for Atmospheric Pollution Prevention and Control” in 2013, the YRD region has continued to promote the battle against pollution, and although certain results have been achieved, PM2.5 concentrations in the major cities in northern Jiangsu and Anhui provinces are still at a high level, and the atmospheric quality in some areas has not yet reached the second-level standard, with PM2.5 still being the main pollutant exceeding the standard in the region. At the same time, O3 pollution in the YRD has also shown a rapid rise and spread. In 2019, the annual average O3 concentration in the region was 179 µg/m3, higher than the national average, making it one of the most severely affected regions in terms of O3 pollution rise and spread in the country. As the largest urban agglomeration in China and one of the most developed regions in terms of economy and industry, an effective evaluation of AEE in the YRD can help the government and enterprises understand the distribution of atmospheric pollution control efficiency, propose targeted policy recommendations, and explore specific paths for balancing environmental protection and economic development, and is crucial for achieving the goal of building a “world-class city cluster”.
Compared with the existing research, this article’s contributions are mainly in the following aspects: (1) fully considering the comprehensive impact of atmospheric pollutants and proposing the construction of the API as an indicator. (2) Adopting a three-stage DEA model combined with the Malmquist index model to measure AEE from both static and dynamic aspects and analyze its spatial and temporal differences. (3) Taking the YRD, an important development area, as the research object, we evaluate the AEE and its spatial and temporal differences and propose effective suggestions to provide a theoretical basis and decision-making reference for the green and sustainable development of the YRD.
3. Results
3.1. Static Analysis of AEE in the YRD Urban Agglomeration
3.1.1. Empirical Results of the First Phase
MATLAB 2021a software was used to measure the AEE of the YRD Urban Agglomeration in the first phase, as shown in
Table 2 and
Table 3.
The above table shows that in terms of time dimension, all the indicators of YRD in a single year and the whole time period did not reach 1. The TE and SE showed an overall upward trend, while the PTE fluctuated significantly, and the value of the PTE was lower than that of the SE value, which indicates that the main factor hindering the improvement of the AEE of the YRD is the PTE.
Table 3 shows that in terms of spatial dimension, four cities (Chizhou, Jinhua, Shanghai, and Zhoushan) are located in the production frontier plane in terms of AEE. Six cities (Hefei, Suzhou, Taizhou2, Wuxi, Wenzhou, and Yangzhou) TE values were 0.83 or above, demonstrating a relatively high level of efficiency. The TE values, PTE values, and SE values are ranked from highest to lowest as Shanghai > Zhejiang > Jiangsu > Anhui, Shanghai > Jiangsu > Zhejiang > Anhui, and Shanghai > Zhejiang > Anhui > Jiangsu, respectively. In view of the fact that the results of the first stage are easily affected by the external environment and random errors and do not fully reflect the AEE of the YRD, the second stage of empirical calculations was carried out.
Table 3.
Regional AEE from 2012 to 2021.
Table 3.
Regional AEE from 2012 to 2021.
| City | TE | PTE | SE | Ranking | City | TE | PTE | SE | Ranking |
|---|
| Anqing | 0.6604 | 0.6864 | 0.9534 | 24 | Taizhou1 | 0.7443 | 0.7574 | 0.9755 | 14 |
| Changzhou | 0.6672 | 0.7464 | 0.8958 | 24 | Taizhou2 | 0.8712 | 0.8887 | 0.9726 | 8 |
| Chizhou | 1 | 1 | 1 | 1 | Tongling | 0.7554 | 0.8076 | 0.9265 | 12 |
| Chuzhou | 0.6817 | 0.7036 | 0.9612 | 20 | Wuxi | 0.8365 | 0.9572 | 0.8658 | 9 |
| Hangzhou | 0.6687 | 0.7706 | 0.8713 | 21 | Wenzhou | 0.9128 | 0.9424 | 0.9602 | 6 |
| Hefei | 0.9675 | 0.9923 | 0.9684 | 5 | Wuhu | 0.5003 | 0.5201 | 0.9544 | 27 |
| Huzhou | 0.7613 | 0.7787 | 0.9702 | 11 | Xuancheng | 0.6967 | 0.7303 | 0.9461 | 19 |
| Jiaxing | 0.6444 | 0.6578 | 0.9714 | 25 | Yancheng | 0.7386 | 0.7515 | 0.9754 | 15 |
| Jinhua | 1 | 1 | 1 | 1 | Yangzhou | 0.8304 | 0.8876 | 0.9302 | 10 |
| Ma’anshan | 0.5012 | 0.6081 | 0.8157 | 26 | Zhenjiang | 0.7542 | 0.76548 | 0.9783 | 13 |
| Nanjing | 0.7212 | 0.8972 | 0.7978 | 18 | Zhoushan | 1 | 1 | 1 | 1 |
| Nantong | 0.7356 | 0.7823 | 0.9316 | 17 | Shanghai | 1 | 1 | 1 | 1 |
| Ningbo | 0.6618 | 0.6745 | 0.9732 | 23 | Anhui | 0.7187 | 0.7549 | 0.9394 | |
| Shaoxing | 0.7374 | 0.7426 | 0.9844 | 16 | Jiangsu | 0.7682 | 0.8338 | 0.9172 | |
| Suzhou | 0.8793 | 0.9702 | 0.8982 | 7 | Zhejiang | 0.8053 | 0.8256 | 0.9651 | |
3.1.2. Empirical Results of the Second Phase
Given that the results of the first stage are easily influenced by external factors and random errors and cannot fully reflect the AEE of the YRD urban agglomeration, a second stage empirical calculation was carried out. Using the slack values of the three input variables in the first stage as dependent variables and the five environmental variables as independent variables, a maximum likelihood regression was performed using Frontier4.1 software, and the results are shown in
Table 4. A positive coefficient indicates that an increase in the environmental variable will lead to an increase in input redundancy and a decrease in AEE, while a negative coefficient indicates the opposite and will help improve AEE.
The table above shows that has passed the significance test, indicating that managerial inefficiency is the main influencing factor of input slack variables. Specifically, the regression coefficients of population density, labor, and energy input slack variables are positive, indicating that the increasing population density will reduce the utilization rate of labor and energy resources, exacerbating the atmospheric pollution in the YRD. The regression coefficients of environmental regulation, capital, and energy input slack variables are negative, indicating that the greater the intensity of environmental regulation, the more conducive it is to the utilization of capital and energy resources, thereby improving the AEE. Similarly, the increase in the proportion of the secondary industry will increase the input of the three resources and reduce their utilization efficiency, which will lower the AEE; the improvement of the technological level will save capital and energy input and reduce labor use; and the increase in the degree of opening to the outside world is conducive to improving the efficiency of capital and energy use, which is conducive to improving AEE.
3.1.3. Empirical Results of the Third Phase
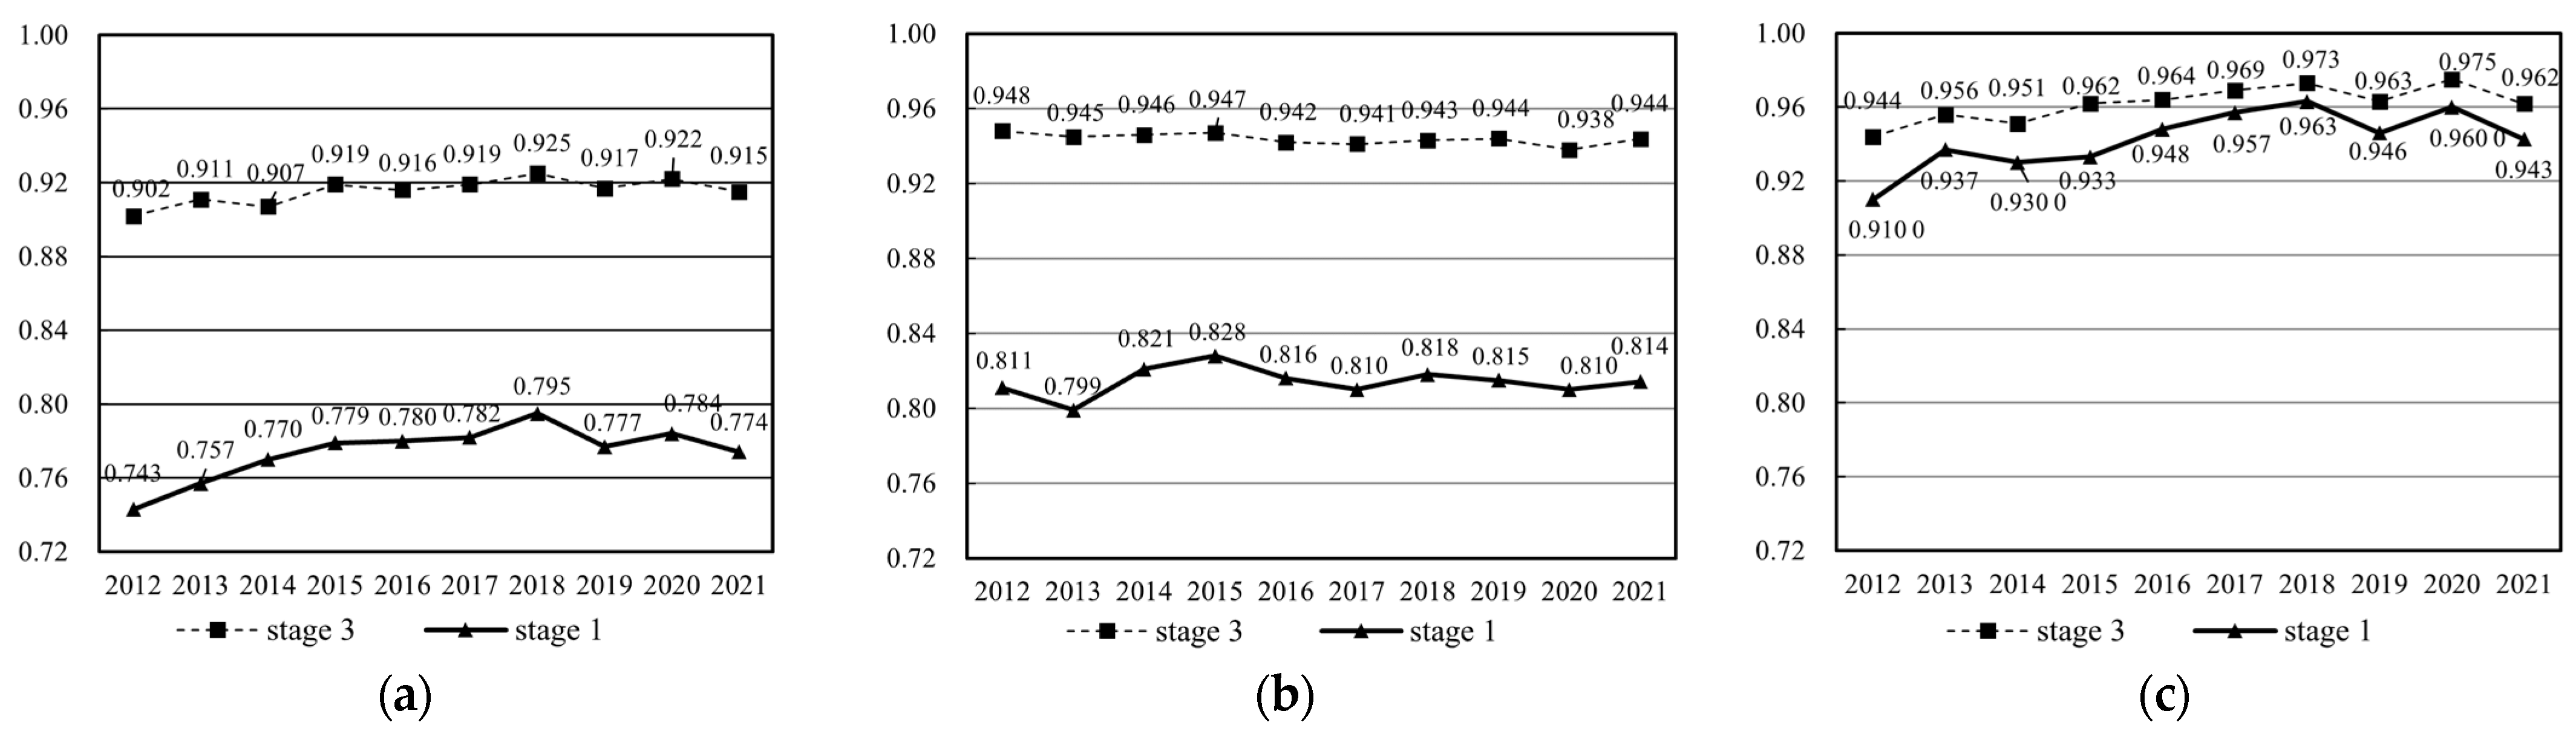
Using Equation (3) to adjust the input variables in the first stage, we conducted the third stage calculation using MATLAB software and drew a comparison between the time trends and spatial distribution of the AEE in the YRD in the first and third stages in
Figure 1 and
Figure 2.
In terms of time dimension, the average value of AEE in the third stage is 0.915, in which TE, PTE, and SE are all higher than those in the first stage, indicating that the real efficiency is underestimated, but still none of them reaches the production frontier, showing that there is still room for efficiency improvement. In the third stage, the TE value generally shows a fluctuating upward trend, the PTE shows alternating ups and downs, and the SE rises in all the years except for some years (2014, 2019, 2021), which have declined. Similar to the first stage, the value of PTE in the third stage is still lower than the value of SE, indicating that PTE is still the most important factor limiting the improvement of AEE in the YRD.
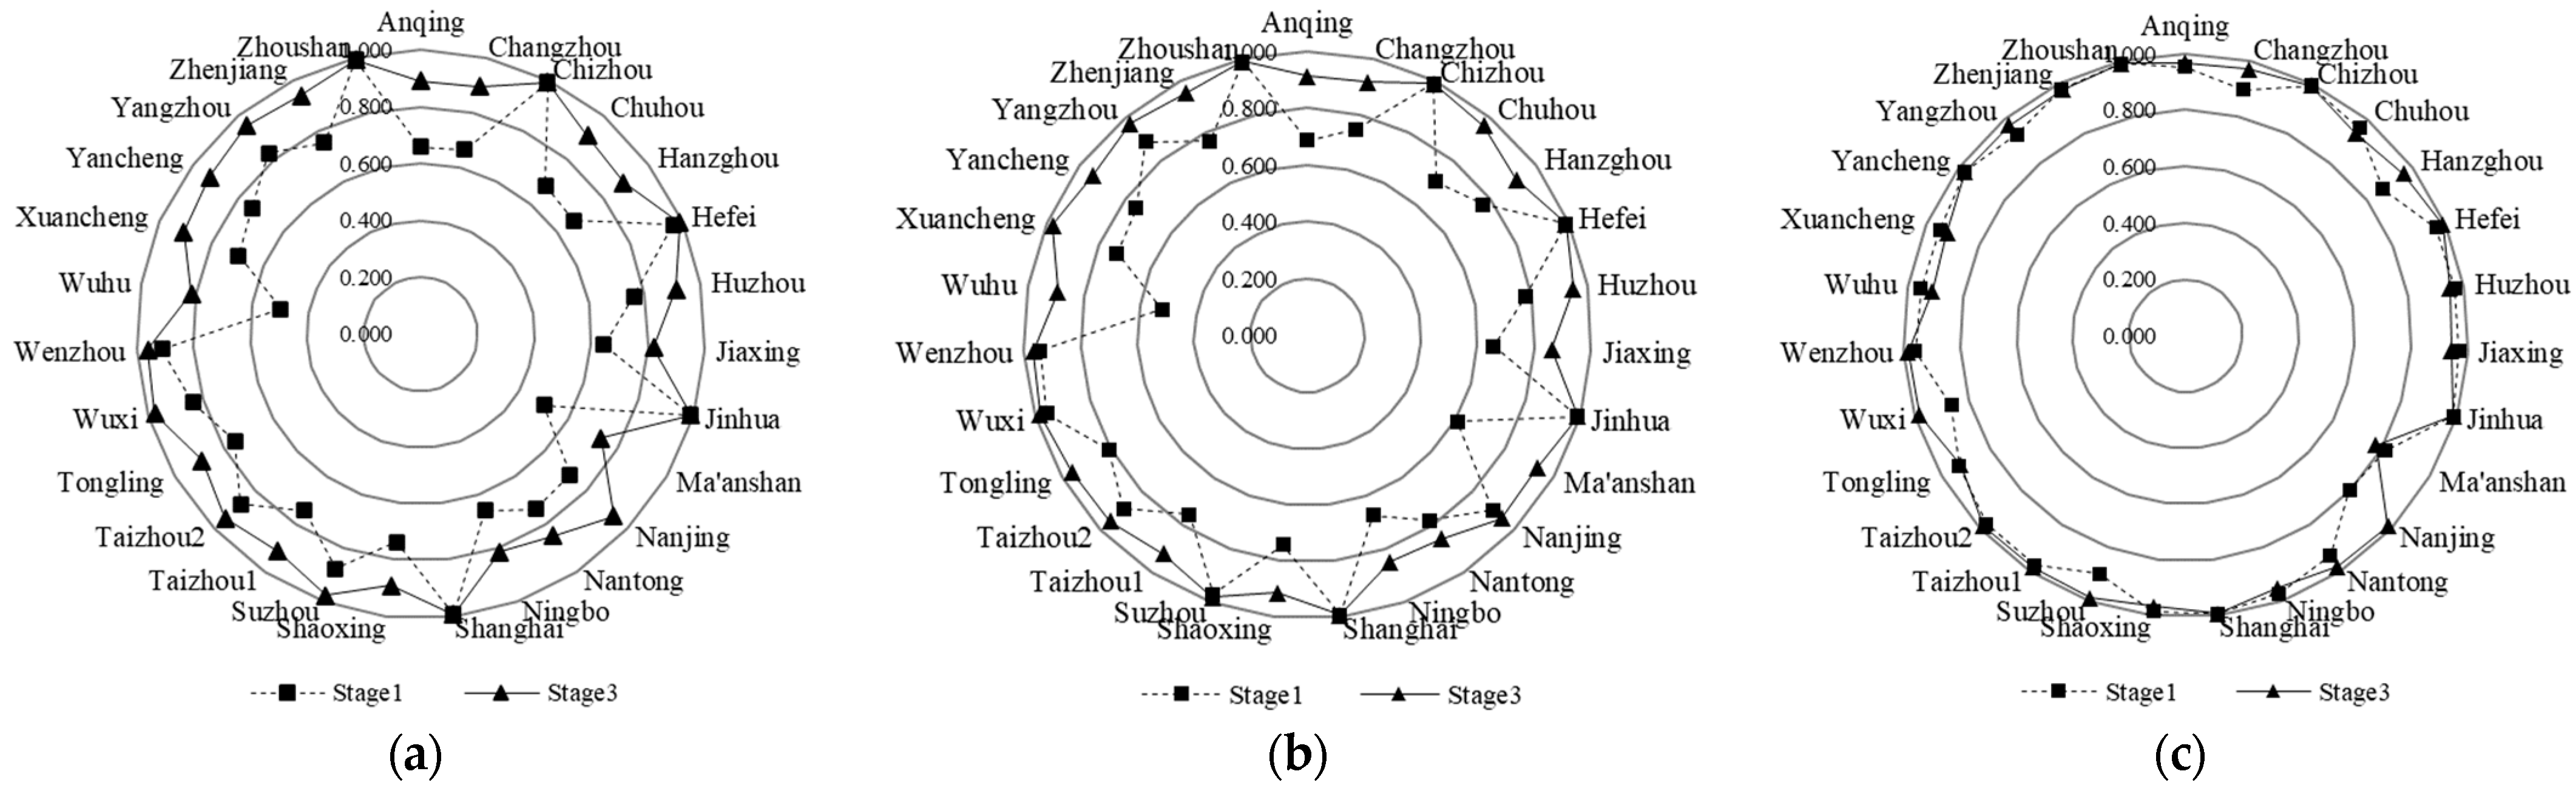
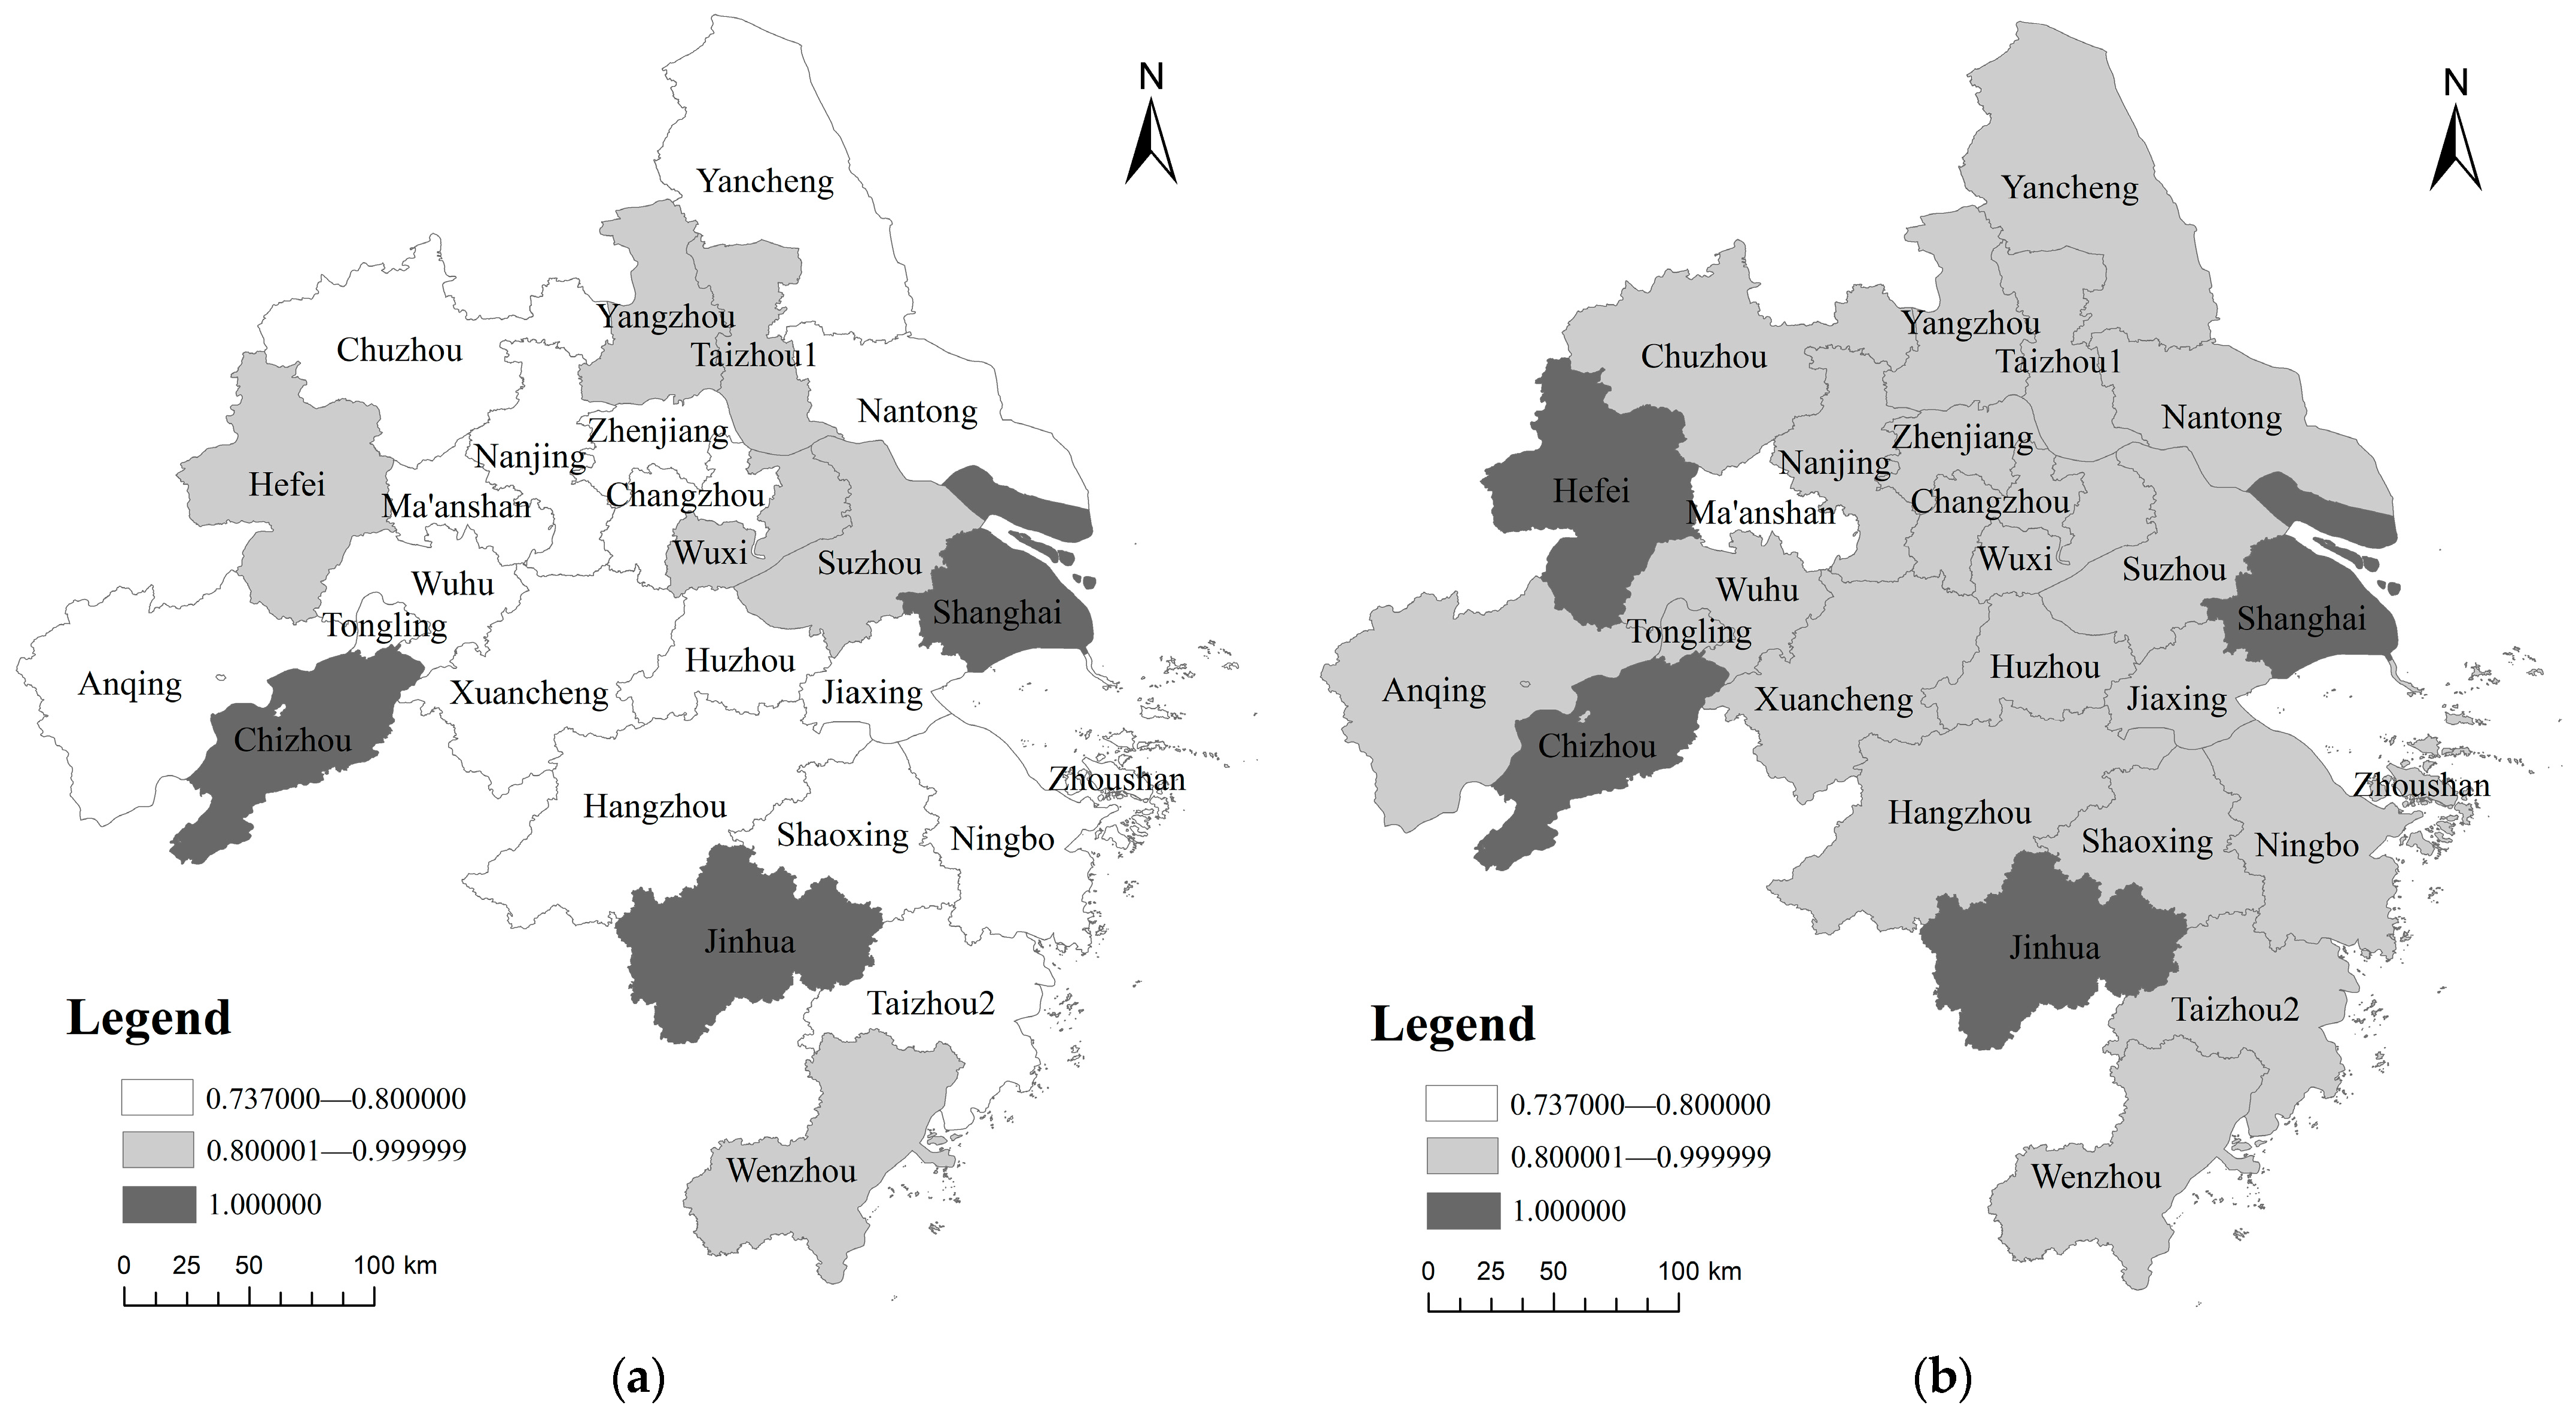
Figure 2 shows that in terms of the spatial dimension, four cities (Suzhou, Wuxi, Wenzhou, Yangzhou) in the third stage of the TE increased to more than 0.950, close to the production frontier surface. The TE and PTE circle values of each city have moved up significantly, with most cities close to the highest value of the periphery 1, and the degree of spatial tension of TE is similar to that of PTE. Ten cities (Chuzhou, Huzhou, Jiaxing, Ma’anshan, Ningbo, Shaoxing, Tongling, Wuhu, Xuancheng, and Zhenjiang) have seen a downward shift in the value of SE, but they are all higher than 0.731. The distribution of urban efficiency in different provinces can be observed from
Figure 3, and the following ranking can be obtained by combining
Figure 2. The values of TE are sorted as follows: Shanghai (1.000) > Jiangsu (0.930) > Zhejiang (0.913) > Anhui (0.892); the PTE values are ranked as Shanghai (1.000) > Anhui (0.944) > Jiangsu (0.941) > Zhejiang (0.933); the SE values are ranked as Shanghai (1.000) > Jiangsu (0.980) > Zhejiang (0.970) > Anhui (0.927). Observing the limiting factors of TE of each province and city, it is found that Shanghai has reached the efficiency frontier; Jiangsu and Zhejiang’s TE values are limited by lower PTE values, and Anhui is mainly limited by SE values.
Figure 2.
Distribution of AEE in the YRD. (a) Technical efficiency; (b) pure technical efficiency; (c) efficiency of scale.
Figure 2.
Distribution of AEE in the YRD. (a) Technical efficiency; (b) pure technical efficiency; (c) efficiency of scale.
3.1.4. Third Stage of Cluster Analysis
To further explore the clustering characteristics of the AEE in the YRD, the 27 cities were divided into six types based on the mean values of the third stage TE, PTE, and SE (0.915, 0.944, and 0.962) as the critical values. The “high–low–high” indicates that the TE is higher than the critical value, the PTE is lower than the critical value, and the SE is higher than the critical value. The other types can be deduced similarly.
Table 5 above shows that 11 cities, including Chizhou and Hefei, are of the “high–high–high” type, indicating that the overall management of the air environment in these cities is relatively good and efficient. Nanjing and Yancheng are “high–low–high” type cities, although the TE is higher than the regional average, but if they do not make efforts to improve the PTE, they may develop into “low–low–high” type cities in the future. Chuzhou, Huzhou, etc., are categorized as “low–high–low” type cities, with lower SE being the main reason for lower than average TE. Taizhou1 and Changzhou are classified as “low–low–high” cities, reflecting that PTE limits the improvement of the overall efficiency of the city’s AEE. Jiaxing and Huzhou are classified as “low–low–low” cities, indicating that their efficiency in various aspects still needs to be improved. Further analysis reveals that, in terms of the region to which the cities belong, the cities with low TE are mainly located in Anhui (the six selected cities account for 75.00 percent of the province and 42.86 percent of all cities in this category), which is the province of focus in terms of AEE in the YRD.
3.2. Dynamic Analysis of AEE in the YRD Urban Agglomeration
Based on adjusted input data in the three-stage DEA, the Malmquist model was used to measure the spatial and temporal dynamic AEE in the YRD. Therefore, the total factor productivity (TFP) of the AEE in the YRD was obtained, as shown in
Table 6 and
Table 7.
From a time perspective, the TFP of the AEE in the YRD showed an overall increasing trend during the study period. As for the decomposition efficiency indicators, the technical efficiency change index (TEC) increased slightly by 0.03% during the study period under the combined effect of an increase in the scale efficiency change index (SC) (0.50%) and a decrease in the pure technical efficiency change index (PC) (0.10%). The technical progress index (TC), on the other hand, increased significantly by 3.10 percent. Specifically on the decomposition efficiency in each time period, the total factor productivity values in four time periods, 2014–2015, 2016–2017, 2017–2018, and 2018–2019, were affected by the double-factor increase in the TEC and the TC, while the rest of the time periods were the result of a single-factor increase or double-factor decrease; and only for the 2014–2015 and 2017–2018 time periods did the increase in the PC and SC contribute to the increase in TE. This shows that TC is the main factor driving the improvement of AEE in the YRD [
31].
From a spatial perspective, in terms of changes in the efficiency of cities, the total factor productivity (TFP) index of three cities, Anqing, Chizhou, and Tongling, is less than 1, which shows a downward trend in efficiency and needs to be given great attention; the remaining 24 provinces and cities have a TFP index greater than 1, and the efficiency of the AEE has been improved. In terms of efficiency improvement drivers, only eight cities, namely Hangzhou, Jiaxing, Nanjing, Nantong, Ningbo, Suzhou, Wuxi, and Wuhu, benefited from the synergistic two-factor promotion of technical efficiency improvement and technological advancement in terms of total factor productivity improvement, while the remaining 19 cities suffered from a single-factor promotion or two-factor pulling effect. In the decomposed technical efficiency, only five cities, Chuzhou, Jiaxing, Nantong, Wuxi, Xuancheng, etc., the pure technical efficiency and scale efficiency together play a contributing role to the technical efficiency, which shows that the other cities should take targeted measures according to the main factors limiting the efficiency of the atmospheric environment. In terms of provinces, the total factor productivity values are ranked as Shanghai (1.054) > Jiangsu (1.050) > Zhejiang (1.031) > Anhui (1.011).
3.3. A Comprehensive Dynamic and Static Analysis of AEE in the YRD Urban Agglomeration
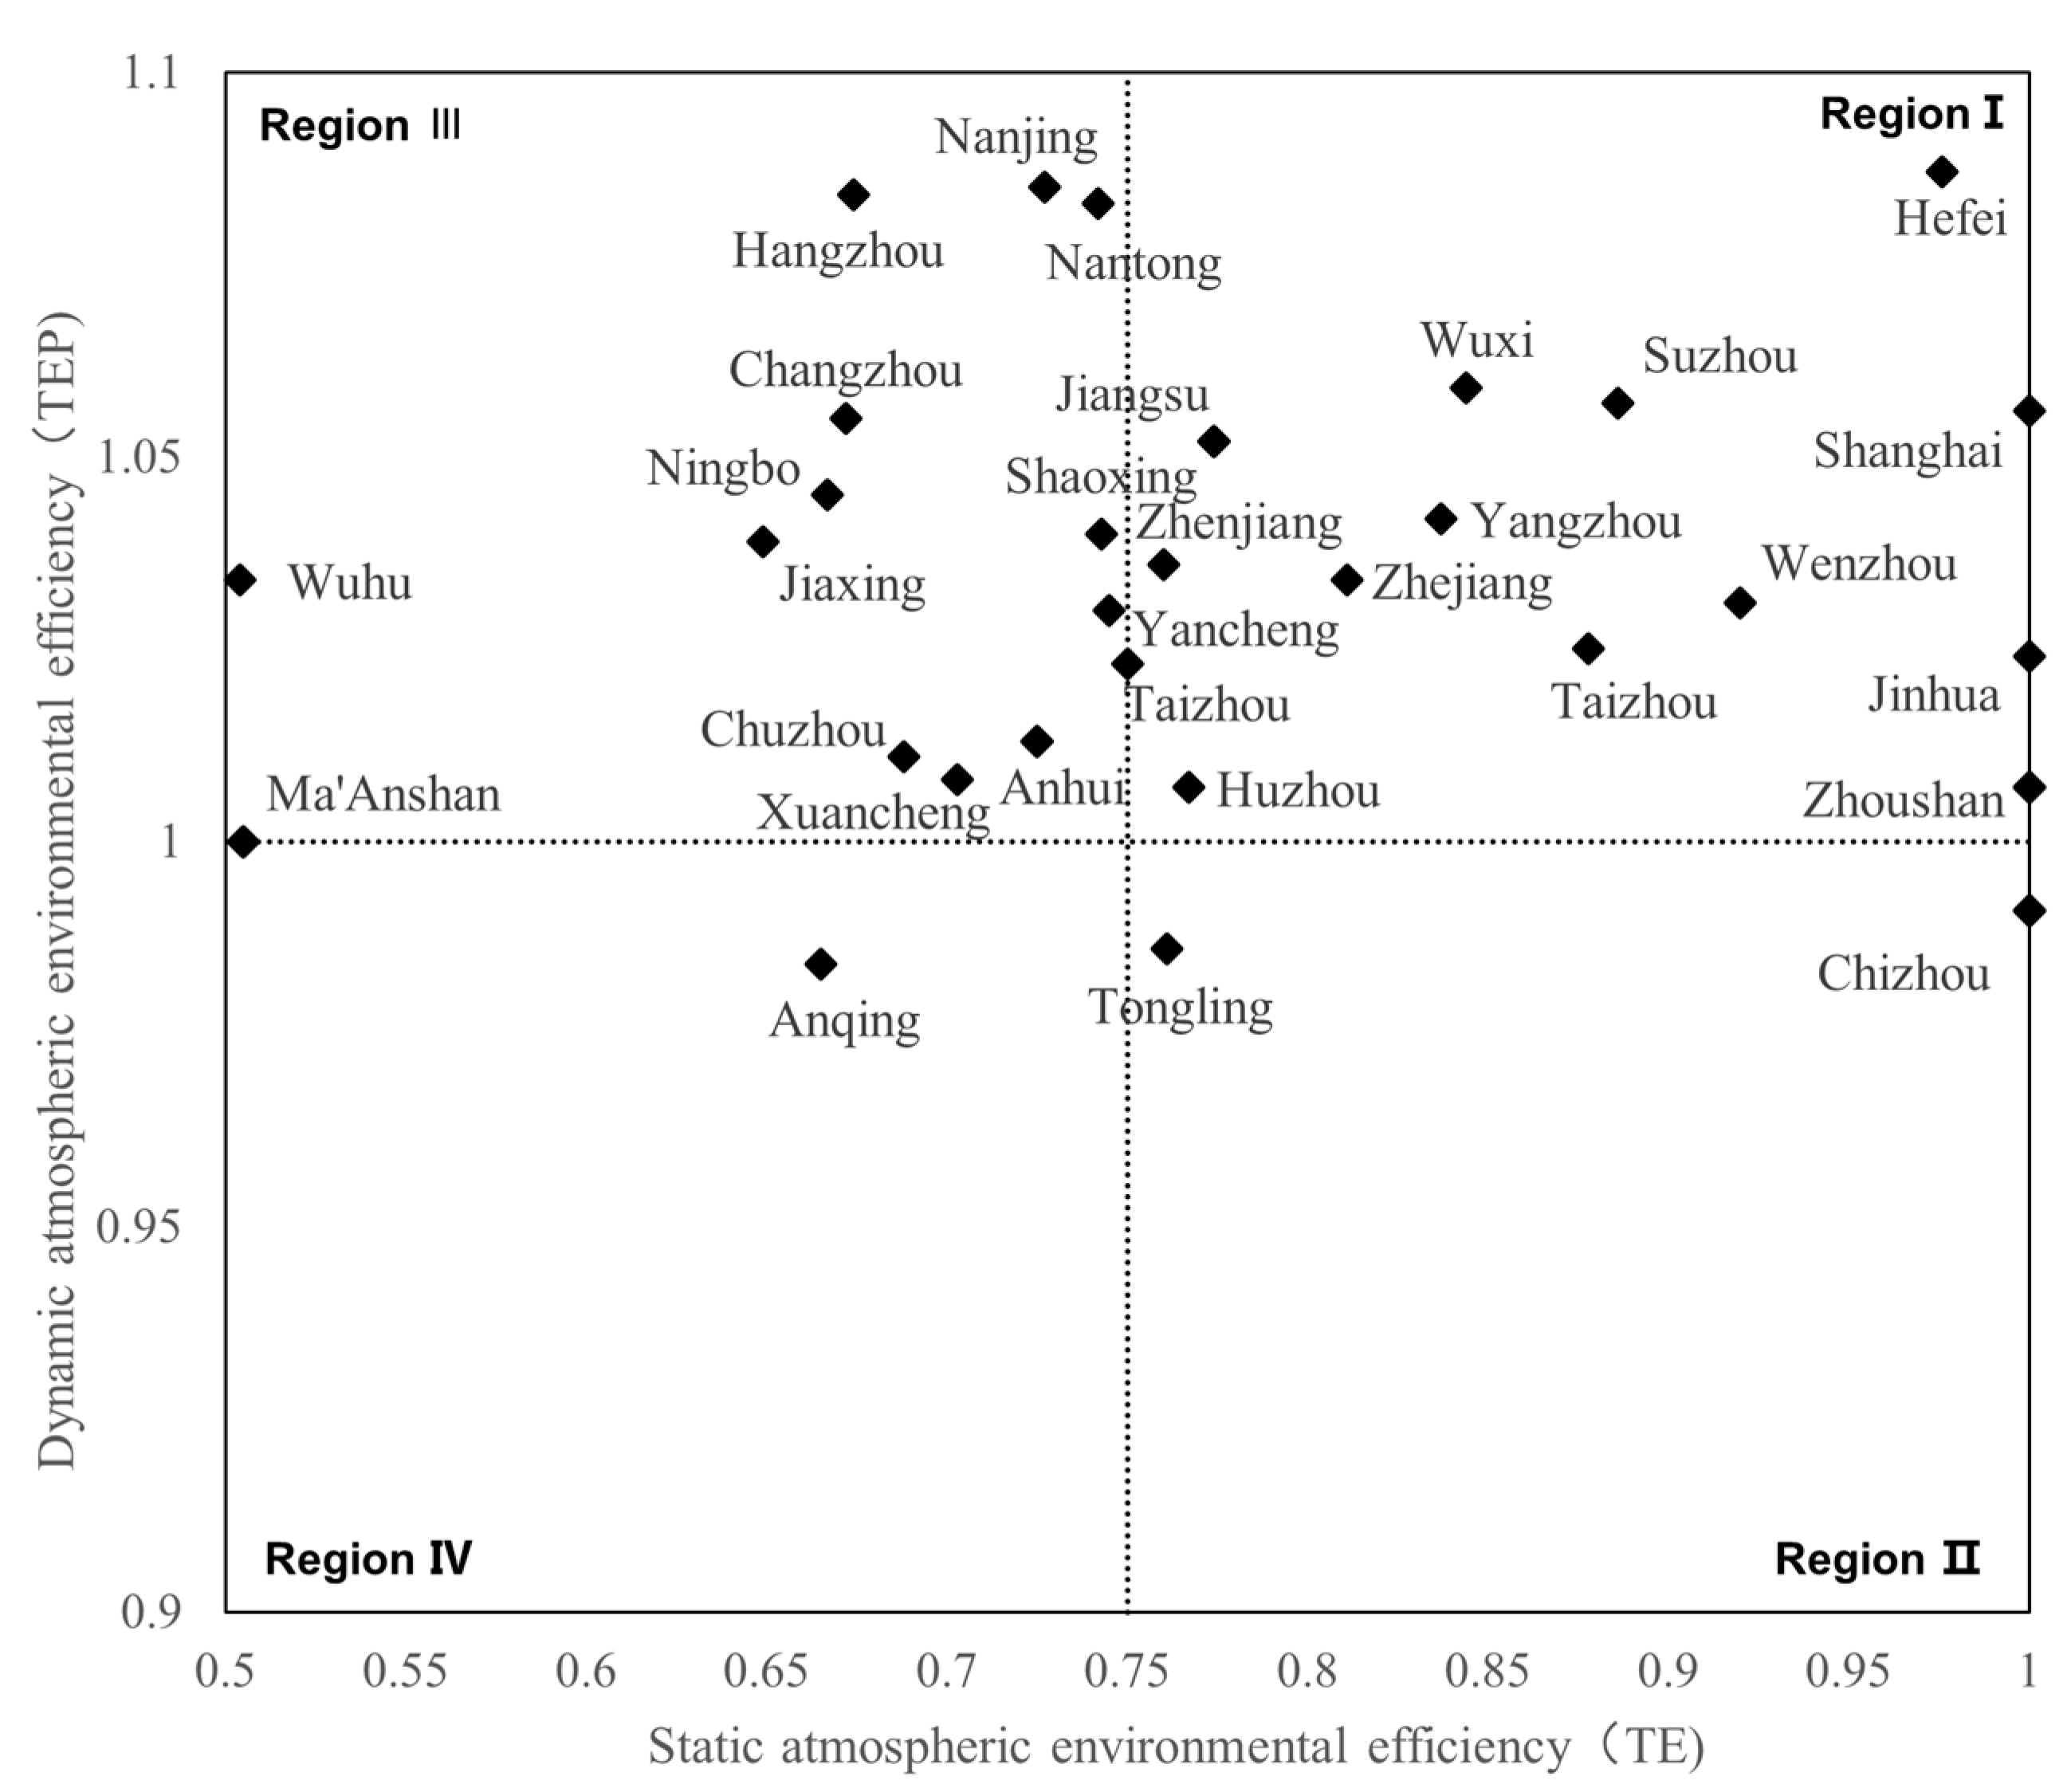
Based on the static and dynamic analysis of AEE in the YRD, a two-dimensional comprehensive correlation analysis was conducted, and the YRD city cluster was divided into four regions, as shown in the
Figure 4.
High static AEE and high dynamic AEE are defined as region I, including 10 cities such as Hefei, Shanghai, Wuxi, and Suzhou. These cities currently have a relatively high level of AEE, and their efficiency values are still on the rise during the research period. The high static AEE and low dynamic AEE are defined as region II, which only includes one city, Chizhou, indicating that the static AEE of this city has reached the production frontier, but its static AEE is likely to decrease in the future. Region III is characterized by low static AEE and high dynamic AEE, including 17 cities such as Nanjing, Hangzhou, and Nantong. Although the static AEE of these cities is currently lower than the average, their dynamic AEE is on the rise with technological progress. The low static AEE and low dynamic AEE are defined as region IV, including Anqing and Tongling, whose current static and dynamic AEE values are relatively low and may continue to decrease.
4. Discussions
First, the AEE of the first stage in the YRD region during the study period is 0.778, and the obtained results are similar to the value of AEE in the southeast derived by Wu et al. (2022) [
32], and both of them are lower than the value of AEE in the third stage, 0.915, which indicates that the elimination of the environmental factors and the stochastic error is particularly important, and the arithmetic model of the present study achieves the expected effect. In addition, the PTE value changes in the third stage and the first stage show consistent fluctuations, and both are lower than the SE value. This indicates that the technological innovation in the YRD still needs to be improved, and the technological factor is the main factor limiting the improvement of its AEE, which is also consistent with the results measured by Wu (2021) [
33] and others. It is worth noting that the PTE value of Shanghai is 1, which has reached the frontier level, and there is still a large gap between other cities. Zhang (2021) [
23] also pointed out that Shanghai has a technological leadership in air pollution management, which can provide a reference for other regions. According to data provided by the Shanghai Environmental Protection Agency, up to now, nearly 80 percent of industrial enterprises in Shanghai have implemented flue gas purification facilities, and more than 60 percent of them have achieved full coverage of the three-waste management, including desulphurization, denitrification, and dedusting, and constructed an intelligent environmental monitoring platform to achieve real-time monitoring and data analysis of the atmospheric environment. Therefore, technological advancement is a major factor in enhancing the efficiency of the YRD’s AEE [
34]. Cities in the YRD should strengthen the development and application of green technologies, especially in industrial emission control technologies and intelligent monitoring systems. On the one hand, for industrial emission control technologies, highly efficient desulphurization, denitrification, and dust removal equipment can be introduced to reduce the emission of harmful substances such as sulfur dioxide, nitrogen oxides, and particulate matter generated during industrial production. At the same time, the use of new treatment technologies, such as biotechnology and photocatalytic technology, can be explored to achieve efficient purification and resource utilization of industrial waste gas. On the other hand, an intelligent environmental monitoring platform can be constructed, and through big data analysis technology, pollution anomalies in industrial enterprises can be detected promptly to achieve accurate monitoring and management of pollution sources.
Second, there are some differences in the effects of environmental variables on atmospheric efficiency in the process of economic development. The results of the second-stage SFA show that the regression coefficients of the industrial structure on the relaxation values of capital, labor, and energy inputs are 5.677, 4.388, and 9.258, respectively, with the most significant effect on energy, i.e., increasing the proportion of the secondary industry leads to an increase in the input resources such as energy and a decrease in the efficiency of their use, which reduces the AEE, suggesting that the optimization of the industrial structure has a significant role to play in improving the AEE, indicating that the optimization of industrial structure is of great significance in improving AEE. Relevant research supports the impact of industrial structure on environmental efficiency, and the transformation and upgrading of industrial structure can reduce resource consumption and pollution emissions, as well as improve environmental efficiency (Dinda, 2018) [
35]. In 2021, in the value-added of industry above scale in the YRD, the proportion of the value-added of heavy industry is 46.8%, while the proportion of the value-added of light industry and high-technology manufacturing industry is 26.9% and 14.8%, respectively, which indicates that heavy industry still occupies a considerable proportion in the YRD region. Therefore, optimizing the industrial structure is an important means of combating air pollution in the YRD region. Firstly, the YRD region should step up its efforts to phase out and modernize traditional heavy industries and prompt these enterprises to phase out or upgrade and transform by reducing preferential policy support for traditional heavy industries and strengthening the implementation of environmental protection regulations. Secondly, the YRD region should vigorously develop green and emerging industries, including clean energy, energy conservation, environmental protection, and the circular economy, which will not only reduce the impact of industry on the environment but also inject new impetus into economic growth. Finally, the government can encourage enterprises to increase the research, development, and application of green, smart, and efficient technologies by providing financial subsidies, tax incentives, and technical support.
Third, only 41% of the cities in the YRD region are located in the category of “high–high–high”, and 52% of the cities have at least two or more inefficiencies, which is overall polarized, showing a lack of overall synergy in the YRD region’s atmospheric environmental governance. Further observation of the geographical distribution of cities reveals that cities with high AEE are in a dispersed state, while cities with low efficiency are more concentrated, reflecting the lack of unified planning and significant differences in the governance of the urban atmospheric environment in the YRD region, the same conclusion was also proposed by Zhou (2019) [
36]. Therefore, it is crucial to strengthen synergistic governance within the region. On the one hand, governments across the region should establish a unified data platform to share air pollution monitoring data and environmental protection policy information promptly, to form a joint effort to deal with the air pollution problem and to unify and coordinate the governance actions across the region, to effectively curb the trans-regional transmission and diffusion of air pollutants. On the other hand, local governments should work together to formulate cross-regional air pollution control plans and policy measures, to form unified control standards and directions of action, to avoid policy conflicts and competition between localities, and to achieve complementarity of advantages and resource-sharing, to jointly promote the improvement of the quality of the air environment in the region.
5. Conclusions
Based on the panel data of cities in the Yangtze River Delta region from 2012 to 2021, this paper measures the atmospheric environmental efficiency from the static and dynamic perspectives using the three-stage DEA and Malmquist index models, analyses the characteristics of its spatial and temporal differences, and puts forward effective suggestions. The study found that (a) Stage 1’s AE value of 0.778 is lower than Stage 3’s AE value of 0.915, suggesting that the true value is underestimated and that the removal of environmental factors and random errors is critical to the assessment of the efficiency. (b) There is still room for improvement in the efficiency of the AEE in the YRD region, with PTE being the main factor contributing to the overall low level of efficiency. (c) Different environmental variables have different impacts on AEE, with the positive impact of industrial structure being the most significant. (d) Cities exhibit five types of agglomeration: “high–high–high”, “high–low–high”, “low–low–high”, “low–high–low”, “low–low–low”, and “low–low–low”, with significant differences in the lack of unified planning for the management of the atmospheric environment. Based on this, this study concludes that, firstly, technological progress is the main factor in improving the AEE in the YRD. Second, the optimization of industrial structures is an important means of preventing and controlling air pollution. Third, air pollution should be managed in a coordinated manner through regional collaborative development.
The limitations of this study are that it is restricted to data from cities in the YRD region, which may limit the ability to generalize the results as the situation in other regions or countries may be different, and the study may have failed to take into account other external factors that may affect the atmospheric environmental efficiency, such as policies, economic cycles, and technological advances. Future studies could try to make cross-regional and cross-country comparisons to better understand the differences between regions, as well as the performance and room for improvement of each region in terms of atmospheric environmental efficiency. In addition, more factors that may affect atmospheric environmental efficiency, such as socio-economic factors, policy factors, etc., should be considered, and attempts could be made to use other types of models for analyses and predictions.


