Article

A Multi-Hazard Risk Assessment Model for a Road Network Based on Neural Networks and Fuzzy Comprehensive Evaluation

1
School of Architecture and Transportation Engineering, Guilin University of Electronic Technology, Guilin 541004, China
2
Guangxi Key Laboratory of ITS, Guilin 541004, China
3
Key Laboratory of New Infrastructure Construction in the Transport Sector, Education Department of Guangxi Zhuang Autonomous Region, Guilin 541004, China
*
Author to whom correspondence should be addressed.
Sustainability 2024, 16(6), 2429; https://doi.org/10.3390/su16062429
Submission received: 7 February 2024 / Revised: 7 March 2024 / Accepted: 12 March 2024 / Published: 14 March 2024

Abstract

:
The frequency of extreme weather events has increased worldwide, leading to more intense natural disasters, which pose significant threats to human life and property safety. The main form of disaster occurrence is multi-hazard coupling and multi-hazard chaining. This paper constructs a road natural disaster risk assessment model using a fuzzy comprehensive evaluation method and neural network to quantitatively analyze road disasters with multiple hazards, and provides valuable insights for the predication of road natural disaster risk. Here, ten factors, including temperature, relative humidity, precipitation, elevation, slope, slope orientation, vegetation cover, geologic lithology, historical impact factors, and road density, were selected as input variables, and risk grade was selected as the output value (the evaluation results). The remaining hidden layers use the fully connected neural network. This model was first trained using historical data (from 2011 to 2021) obtained from road networks and natural disasters in Guangxi, China. Then, taking Lingchuan County as an example, the model was used to predict the risk of natural disasters on its roads, and, finally, the prediction accuracy of the model was determined by comparing the results with actual disaster situations. This study can provide theoretical support and technical operations for the development of subsequent early warning systems.

1. Introduction

In contemporary society, marked by the escalating challenges of climate change and expedited urbanization, the incidence of events where multiple hazards concurrently inflict significant damage on road networks has seen a notable increase. The resilience of these road networks, serving as critical infrastructure facilitating urban and rural connectivity, holds a direct correlation with the efficacy of disaster emergency responses and the pace at which socio-economic restoration occurs. Consequently, the development and enforcement of a harmonized set of assessment criteria emerge as crucial for the bolstering of road network resilience and the prompt reinstatement of transportation systems in the aftermath of disasters.
The main challenge facing natural disaster risk assessment is the construction of a disaster system assessment model from the perspective of disaster system theory according to disaster-causing factors, disaster-conceiving environments and disaster-carrying bodies. At present, risk assessment models based on a single hazard are commonly studied using methods such as risk identification; hazard analysis of causal factors; vulnerability and exposure analysis of disaster-bearing entities; risk classification; and impact analysis [1]. However, the results obtained from studying a single disaster are limited [2,3], and it is known that disasters are often the result of the combined effect of multiple other disasters.
Multi-hazard risk refers to the interaction of different types of hazards at the spatial scale [4]. Most of existing multi-hazard risk assessment studies are based on hazard system theory, and are carried out using the risk synthesis method of superposition and the coupling perspective. Therefore, multi-hazard disaster risk assessment is the result of a synthesized assessment achieved by assigning corresponding weight values to single-hazard risks [5,6,7,8]. It is clear from the literature that many assessment models have been developed for multi-hazard risk assessment. Typical examples are the disaster hotspot index [9] and the risk index [10], which first appeared in 2001 and 2004, respectively. The hotspot index generates a map of global natural hazard hotspots to visualize areas of higher risk. The risk index assesses overall risk by integrating various natural hazard risk factors such as frequency, intensity, affected population, and potential economic losses. These two methods have provided a framework and benchmark for subsequent disaster risk studies. The ESPON party, the INFORM method, the Total Risk Index, and the Multi-Hazard Index are also now available [11]. Due to the complexity of the formation mechanism in multi-disaster scenarios, the system for evaluating and selecting factors is somewhat limited. Therefore, it is key to establish a more unified multi-hazard risk assessment standard. Based on the above reasons, this study attempts to find a model that can be applied to multiple regions and natural disasters and establish a unified evaluation standard to make multi-disaster natural disaster risk assessment more concise and applicable to multiple regions and scenarios.
As people’s living standards continue to improve, roads, an important characteristic of cities, play a key role in rescues and transportation [12,13]. On the one hand, road transportation is convenient, but also brings with it unavoidable risks [14]. There are many types of road hazards, the most common being mudslides [15], landslides [16], and floods [17], which are caused by factors such as geo-environmental conditions, natural climatic factors, and human activities. Most of the studies on roads are based on technologies such as map remote sensing [18] and on road damage [19], road evacuation [20], and the post-disaster repair of road infrastructure [21]. From the above literature, it is clear that research on road disasters tends to focus on post-disaster response and recovery efforts, emphasizing road damage detection, analysis, and road re-extraction. While this approach is essential for post-disaster reconstruction and damage assessment, it neglects the more critical aspect of pre-disaster prediction. Considering that roads are important transportation lifelines, they have an irreplaceable role in the normal conduct of social operations and economic activities. It is particularly important to conduct a risk assessment of road networks to predict the impact of reducing road hazards. Therefore, this study applies a model that can be applied to multi-regional and natural disasters for disaster prediction for road networks. Road prediction can ensure that people are able to travel without issue. Additionally, road predication also provides a basis for the development of a natural disaster risk assessment and early warning system for road network after development to later stages.
In summary, this study mainly focuses the following: firstly, a multi-hazard risk assessment; secondly, establishing a unified risk evaluation index; finally, applying this to road networks. This study took Guangxi area as an example, adopted the neural network and fuzzy comprehensive evaluation method, and combined meteorological, geological, and human activities and other factors to introduce a multi-hazard natural disaster risk assessment model for road networks. A unified evaluation standard is established by selecting the influencing factors and applying them to the road network. The research carried out here provides predictions for the multi-hazard risk assessment of road networks, as well as theoretical and technical support for subsequent natural disaster warning systems.
This paper is organized as follows: Section 2 introduces a road network risk assessment model and its underlying principles. Section 3 details the data sources, processing, and training results through a case study. Section 4 applies the model to a study area and analyzes the results and prediction accuracy. Section 5 describes the contributions of this paper and gives some insights for future work. Section 6 summarizes the shortcomings of the research and looks at the future directions for this work.

2. Methodology

2.1. Road Network Risk Assessment Model

Fuzzy comprehensive evaluation (FCE) can effectively deal with the problem of fuzzy and uncertain information and synthesize the indicators to reflect the relative importance between the indicators. Neural networks have strong information integration ability, associative storage functions, and self-learning abilities. They can also express complex nonlinear relationships and can handle uncertain and incomplete data sets [22].
Therefore, this study combined FCE and neural networks to fully exploit the comprehensive evaluation advantages of FCE for various indicators and the nonlinear predictive ability of neural networks, constructing a risk estimation model. The logical relationships of this model are shown in Figure 1.
The model is divided into two cycles: training and application. In the training cycle, ten influencing factors are input to produce evaluation results through fuzzy comprehensive evaluation, which constitutes the training set. The data from the training set are input into the neural network for training. The Mean Absolute Error (MAE), Root Mean Square Error (RMSE), and R are used to determine whether the model was well trained or not. In the application cycle, the numerical values of the influencing factors in the study area are input into the trained neural network model, which outputs the prediction results for risk classification.

2.2. Fuzzy Comprehensive Evaluation

FCE is a comprehensive evaluation method that transforms qualitative problems into quantitative evaluations according to the theory of the membership degree of fuzzy mathematics. In this paper, fuzzy comprehensive evaluation based on the entropy value method [23] is used, assuming that the number of samples is n, the number of indicators is m, and x i j is the jth indicator of the ith sample.
Step 1: Data standardization.
x i j = x i j m i n x i m a x x i m i n x i
Step 2: Information entropy calculation for each indicator.
E j = 1 ln n i = 1 N p i j ln p i j
where p i j = x i j i = 1 n x i j .
Step 3: Calculation of the weights of the indicators.
w j = 1 E j m E j
Step 4: Weighted average computation of fuzzy operators.
Y = i = 1 n w i S i
where Y is the evaluation score, w i is the weight, and S i is the judgment matrix.
The advantage of this method is that it combines the objective weight determination of the entropy method and the ability of the fuzzy comprehensive evaluation method to handle fuzzy information, making it a suitable method for complex decision environments [24]. For road networks, unlike in evaluations of a single facility, this method has great advantages for the overall network evaluation. Therefore, this paper uses a fuzzy comprehensive evaluation model based on the entropy weight method as the training set data and participates in the training set shown in Figure 1.

2.3. Neural Networks

The mathematical expression of the neural network is as follows:
Y = f i = 1 N x i w i + b
where x i represents the input of neurons, w i represents the weights between connected neurons, b represents the threshold of neurons, and Y represents the output value of the neural network.
To improve the accuracy of the neural network model, an activation function is added to the model. There are three main types of activation functions commonly used, namely, Sigmoid, Tanh, and ReLU.
The Sigmoid function, compared to Tanh and ReLU, has the advantage of outputting values in the range of 0 to 1, making it particularly useful for binary classification tasks and providing probabilistic interpretations. Additionally, it is relatively easy to compute and differentiate, making it suitable for gradient-based optimization algorithms. However, compared to Tanh and ReLU, Sigmoid is more prone to the vanishing gradient problem, which can slow down learning in deep networks. Tanh and ReLU, on the other hand, have different activation ranges and can mitigate some of the issues associated with Sigmoid, especially regarding gradient saturation and computational efficiency.
The mathematical formula and function image of the Sigmoid function are given below:
f x = 1 1 + e x
In this study, Mean Absolute Error (MAE), Root Mean Square Error (RMSE), and R are used as indicators for model accuracy verification, as shown in Table 1.
The MAE indicates the average value of the error between the predicted and actual values. This metric evaluates the performance of the neural network by quantifying the deviation between the predicted and actual values, providing insight into the overall accuracy and reliability of the model.
RMSE quantifies the average error size between predicted and observed values, emphasizing the larger error due to the squared term. In neural networks, the RMSE is an important metric for assessing overall model performance, measuring the accuracy of the model’s predictions, and showing the distribution of the prediction error. This helps to understand how much the model predictions deviate from the actual values.
R is another important indicator in neural networks that measures how well a model’s predictions match the actual data, or the overall fit of the model, as well as the proportion of variance explained by the independent variables. In essence, it is useful to measure the predictive power of the model and the ability to capture the underlying relationships in the data.
Because of the large amount of data required by the models in risk assessment, it is difficult to adapt traditional fitting methods to meet the fitting requirements in multivariable scenarios. As a type of machine learning, neural networks are considered to have stronger predictive performance due to their nonlinear fitting ability and feature extraction ability. They also have good accuracy when processing big data [25]. Therefore, according to the characteristics of large-scale highway network data, this paper adopts a neural network to solve the problem of data training and prediction and participates in the “training” and “application” cycle shown in Figure 1.

2.4. Conditioning Factors

According to the Standard of Climatic Zoning for Highway (Ministry of Transport of the People’s Republic of China, JTJ 003-86) [26], the first division is based on temperature and topography, and the secondary division is based on rainfall. Therefore, the geological and climatic conditions are focused as the main influencing factors in this study. Furthermore, the literature [27] shows that geological conditions play a major role in the occurrence of natural hazards as induced environments, with elevation, slope, slope orientation, vegetation cover, and geologic lithology considered to be important factors affecting natural hazards. A total of 10 influences were selected as model inputs by superimposing human activities on meteorological and geological conditions, as shown in Table 2.
Elevation: Changes in elevation affect climate, rainfall, and vegetation distribution types. They lead to differences in soil and rock water content, which are important triggers for natural hazards.
Slope gradient: The slope gradient affects the stress distribution, degree of accumulation of loose material, and surface water runoff, and is an important trigger for landslide hazards.
Slope direction: The slope direction affects the slope water volume, degree of weathering, and vegetation cover according to the intensity of solar radiation, which in turn affect the slope stability.
The values for the elevation, slope gradient, and slope direction were obtained from the digital elevation model (DEM) using geo-information software (ArcGIS 10.8), as described in Section 3.1.
Fractional vegetation cover (VFC): Vegetation can block surface runoff [28] and increase the infiltration recharge of precipitation to the slope. Soil erosion is reduced by reinforcing the soil and increasing the shear strength. As shown in Table 3, the remotely sensed data were analyzed to obtain the normalized differential vegetation index (NDVI) and then calculate the VFC by using the Formula (7).
V F C = N D V I N D V I s N D V I v N D V I s
where NDVI is the NDVI value of the computed image, NDVIv is the NDVI value of the planted image, and NDVIs is the NDVI value of the image without vegetation cover.
Geological lithology: Geological lithology is the material basis for disaster occurrence, and different types of rock bodies and dissolution weathering have a great influence on the morphology of karst geomorphology. In general, geotechnical bodies can be categorized as magma, carbonate, clastic, metamorphic, clay, sandy, loess, or gravelly. Each geotechnical body is assigned a numerical value according to the hardness and integrity of the lithology. Generally, the harder and more intact the rock is, the lower the probability of geohazards occurring, so smaller values are assigned. The assigned values are shown in Table 3.
Road density: The road density responds to the level of urban development and the density of human activities. Based on the data sources in Section 3.1, the road vector data were obtained to calculate the road density using Equation (8).
Road   density = L S
where L is the length of the road and S is the area.
Historical impact factors: Historical hazards were obtained according to the National Geological Archive, as described in Section 3.1. Hazard points and risk levels were recorded in latitude and longitude coordinates. Historical impact factor values were determined by neural network interpolation calculations.
As climate warming drives changes in atmospheric circulation, increased water vapor transport will cause localized regional meteorological disasters [29].
Temperature: The effects of temperature are mainly in the form of freeze–thaw cycles and thermal expansion and contraction phenomena, which trigger cracks, potholes, and instability in pavement materials and roadbeds.
Precipitation: The hazards resulting from precipitation on roads are mainly in the form of water erosion, stress on drainage systems, and water damage. Heavy precipitation can lead to the flooding of road surfaces, which affects traffic safety and may cause erosion of the road infrastructure, reducing its structural stability.
Relative humidity: Relative humidity affects the deterioration process of road materials, especially asphalt materials, which accelerates their deterioration and softening, thereby reducing the adhesive properties and overall durability of pavement.
Based on the data sources in Section 3.1, meteorological conditions were obtained through World Weather’s official website, and Temperature, Relative humidity, and Precipitation were selected as the influencing factors in this study.

3. Model Training

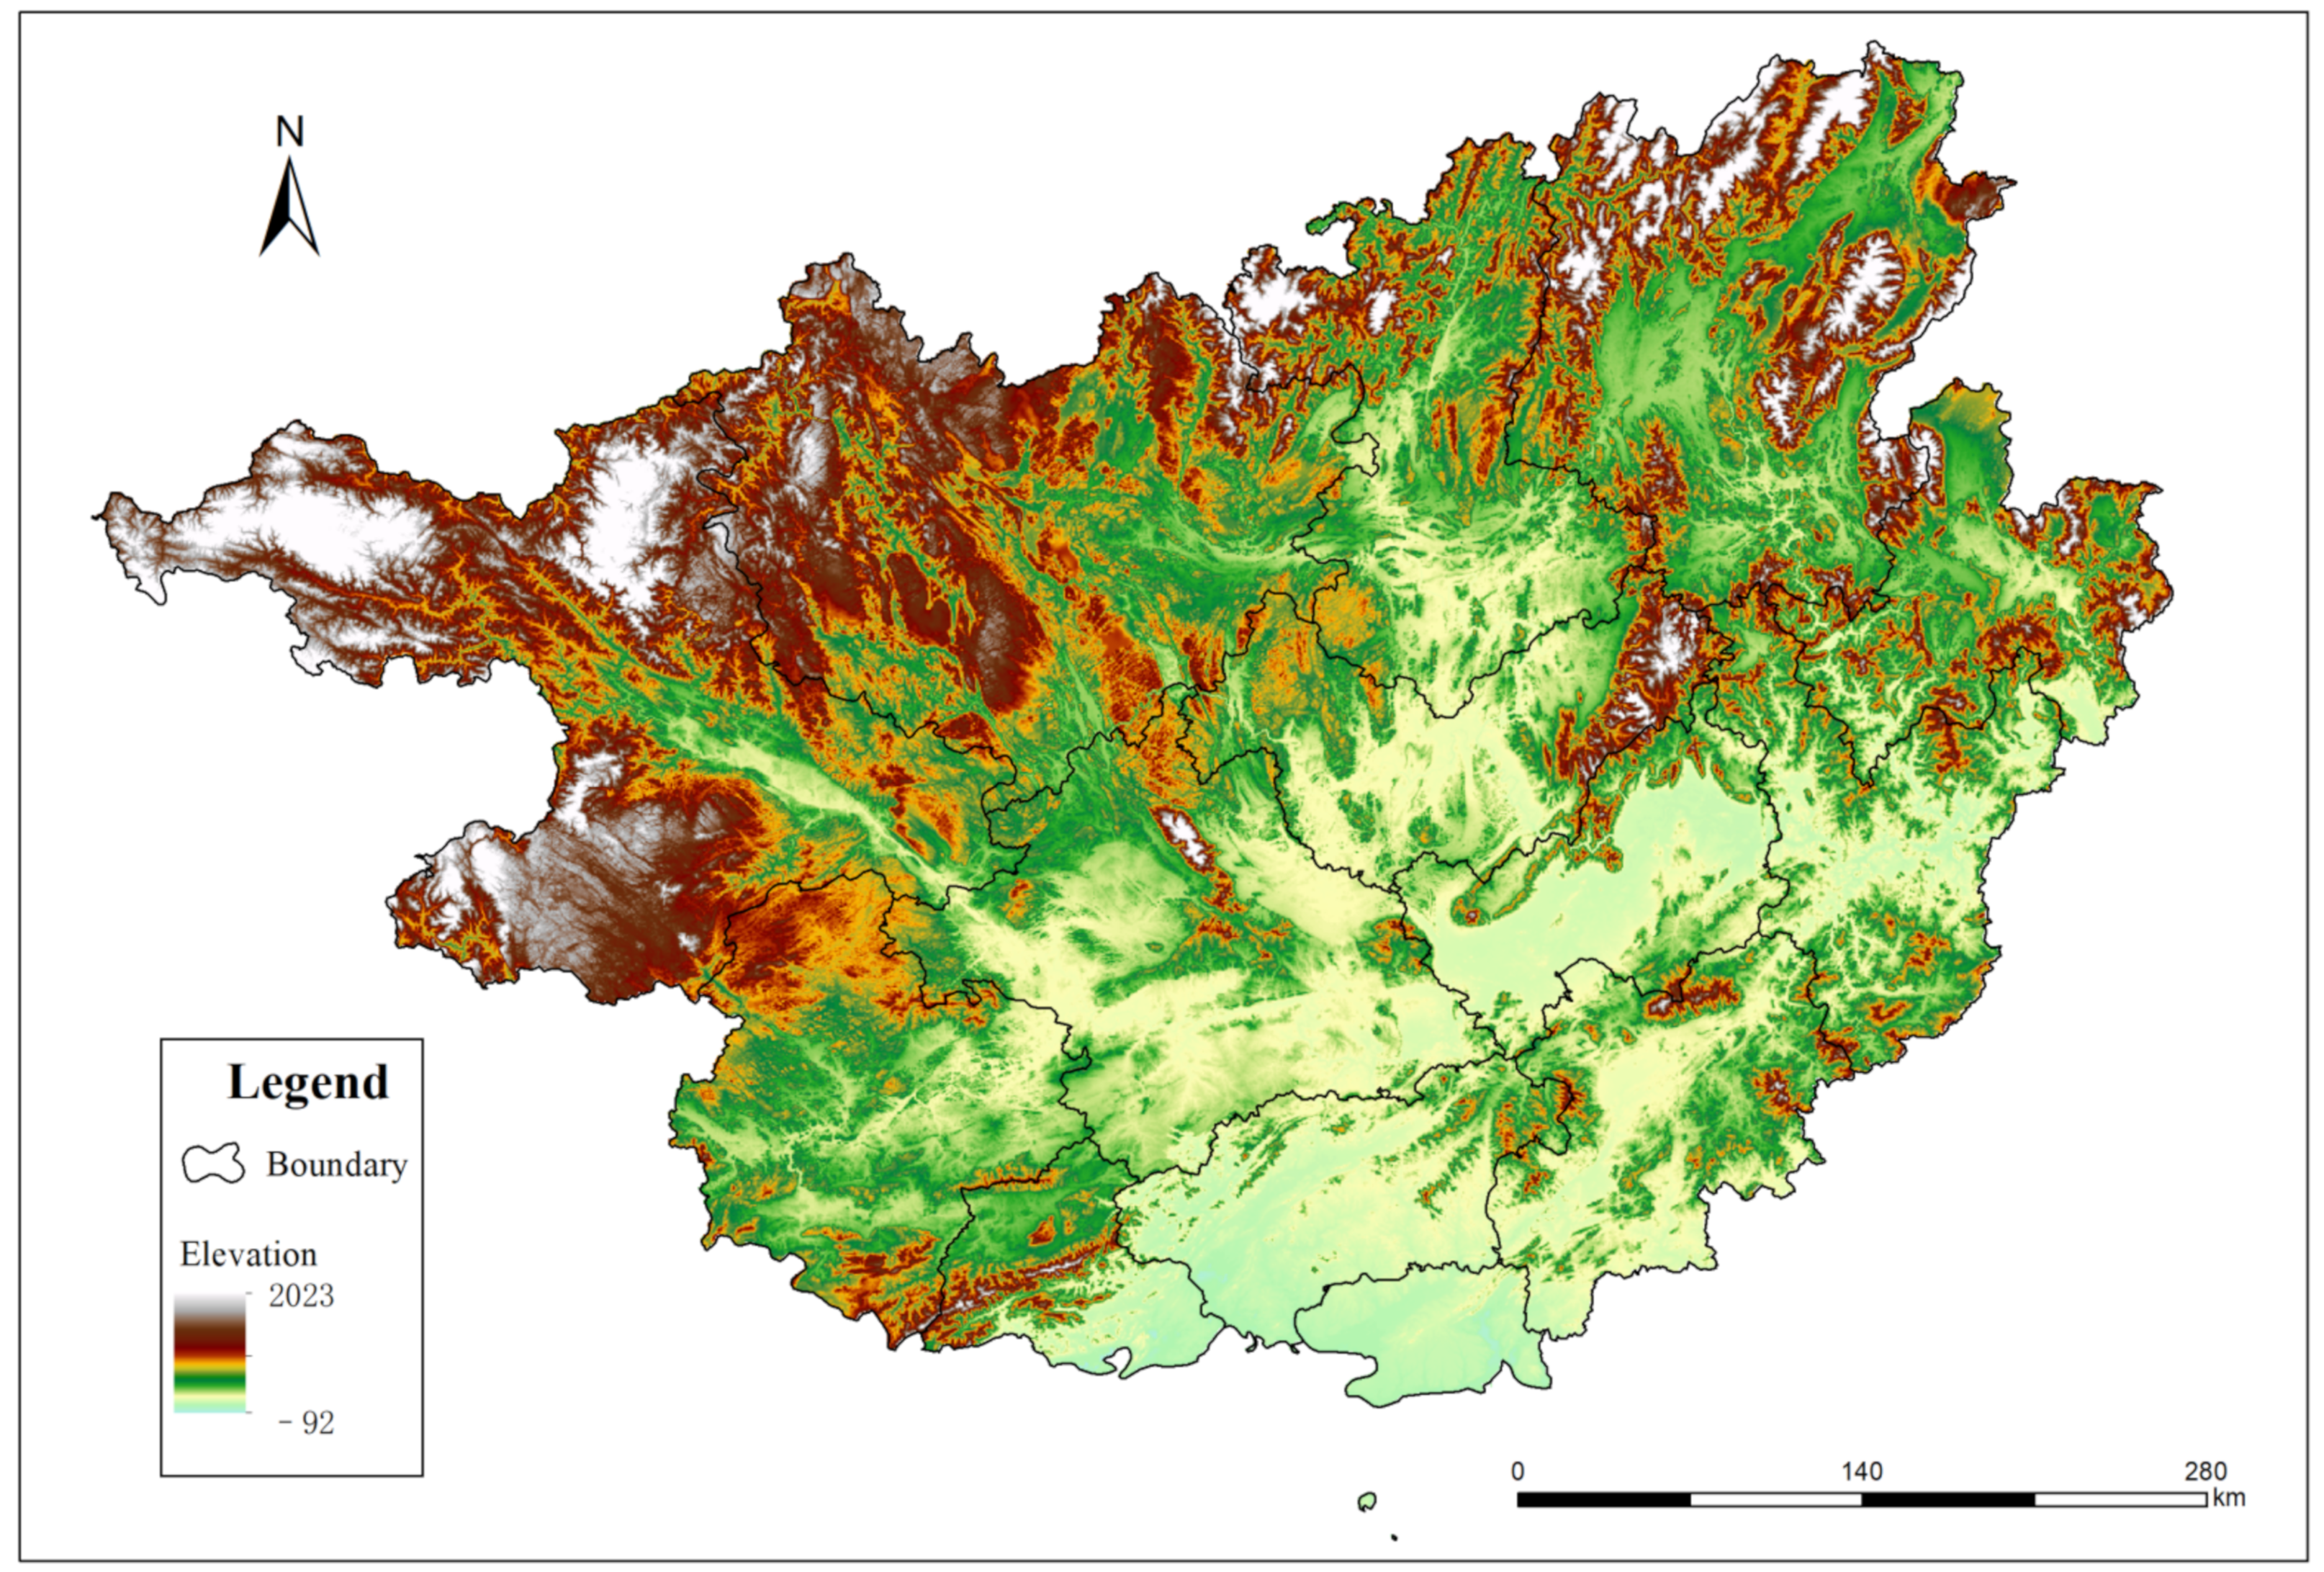
In this paper, the Guangxi Zhuang Autonomous Region (Figure 2) is selected as a case to study this model and put it into practice. Guangxi is located in the south of China, between 104°28′~112°04′ E longitude and 20°54′~26°24′ N latitude. The Tropic of Cancer crosses the center of the country, with the tropical ocean in the south, the Nanling Mountains in the north, and the Yunnan–Guizhou Plateau in the west. This region has a subtropical monsoon climate zone and a tropical monsoon climate. In summer, the sunshine time is long, the temperature is high, and the precipitation is high, while in winter, the sunshine time is short and the weather is dry and warm. The main distribution includes mountains, hills, plateaus, plains, and other types of landforms; the central and southern parts of the hilly plains are basin-shaped, known as the “Guangxi Basin”.

3.1. Data

Natural disasters in road networks are mainly affected by three major aspects: meteorological conditions, geological conditions, and human activities. This study selects ten influencing factors, including temperature, relative humidity, precipitation, elevation, slope, slope direction, lithology, vegetation cover, historical influence, and road density, as the disaster-causing factors to construct the datasets. These data are obtained from different data sources and need to be filtered to extract the key information needed for evaluation. To ensure the accuracy of the assessment, the processing and analysis of the data are essential.
The data on all the above-influencing factors can be collected free of charge on the public platform, and the data sources are listed in Table 4. According to Table 4, the obtained DEM data, satellite remote sensing data, road vector data, and geological information were analyzed using GIS-related software (ArcGIS 10.8) to derive the influencing factors of temperature, relative humidity, precipitation, elevation, slope, slope orientation, vegetation cover, geologic lithology, historical impact factors, and road density.
According to the historical disaster data of Guangxi, the past 10 years of disaster information (from 2011 to 2021) was collected to constitute the neural network dataset. For climate data, real-time data obtained at the time a disaster occurred were selected. An average value of ten years was used in the training process due to the small number changes in the geological data, and this same timeframe was also selected for human activity data, also due to the small changes in the data. In order to facilitate the calculation, we considered the influencing factors as x1, x2, …, x10, where Y is the score after fuzzy comprehensive evaluation, as shown in Table 5. When preparing the data set, it is necessary to pay attention to the corresponding data cleaning to ensure that there are no anomalies or data with obvious deviations.

3.2. Training

After several experimental tests, the final neural network model uses the Sigmoid function, in which the number of hidden layers is 4, the number of neurons is 5, the number of iterations is 1000, and the learning rate is 0.01.
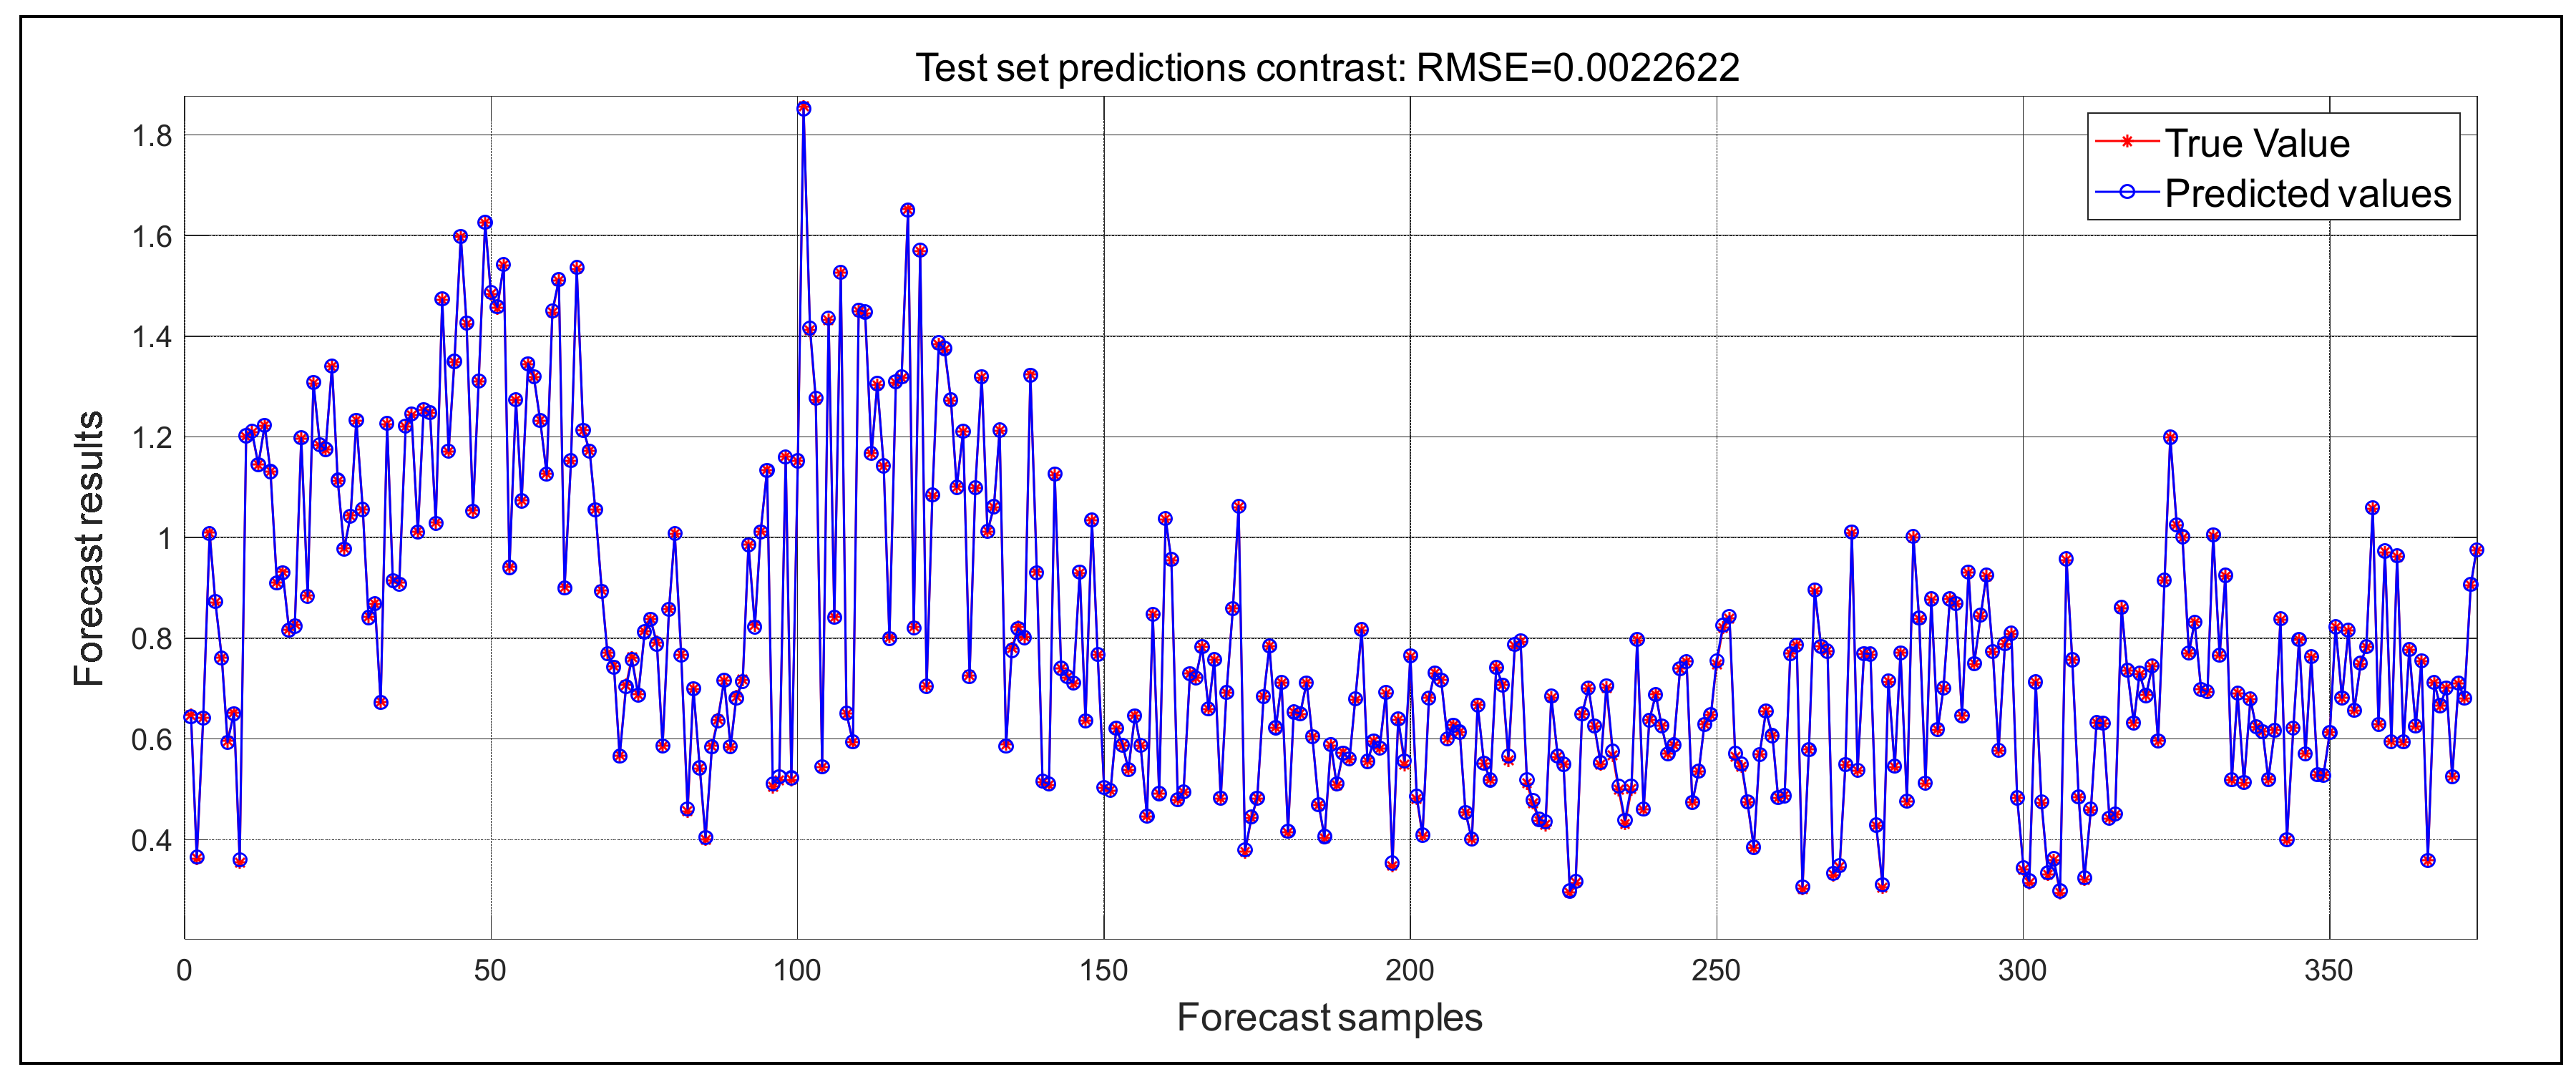
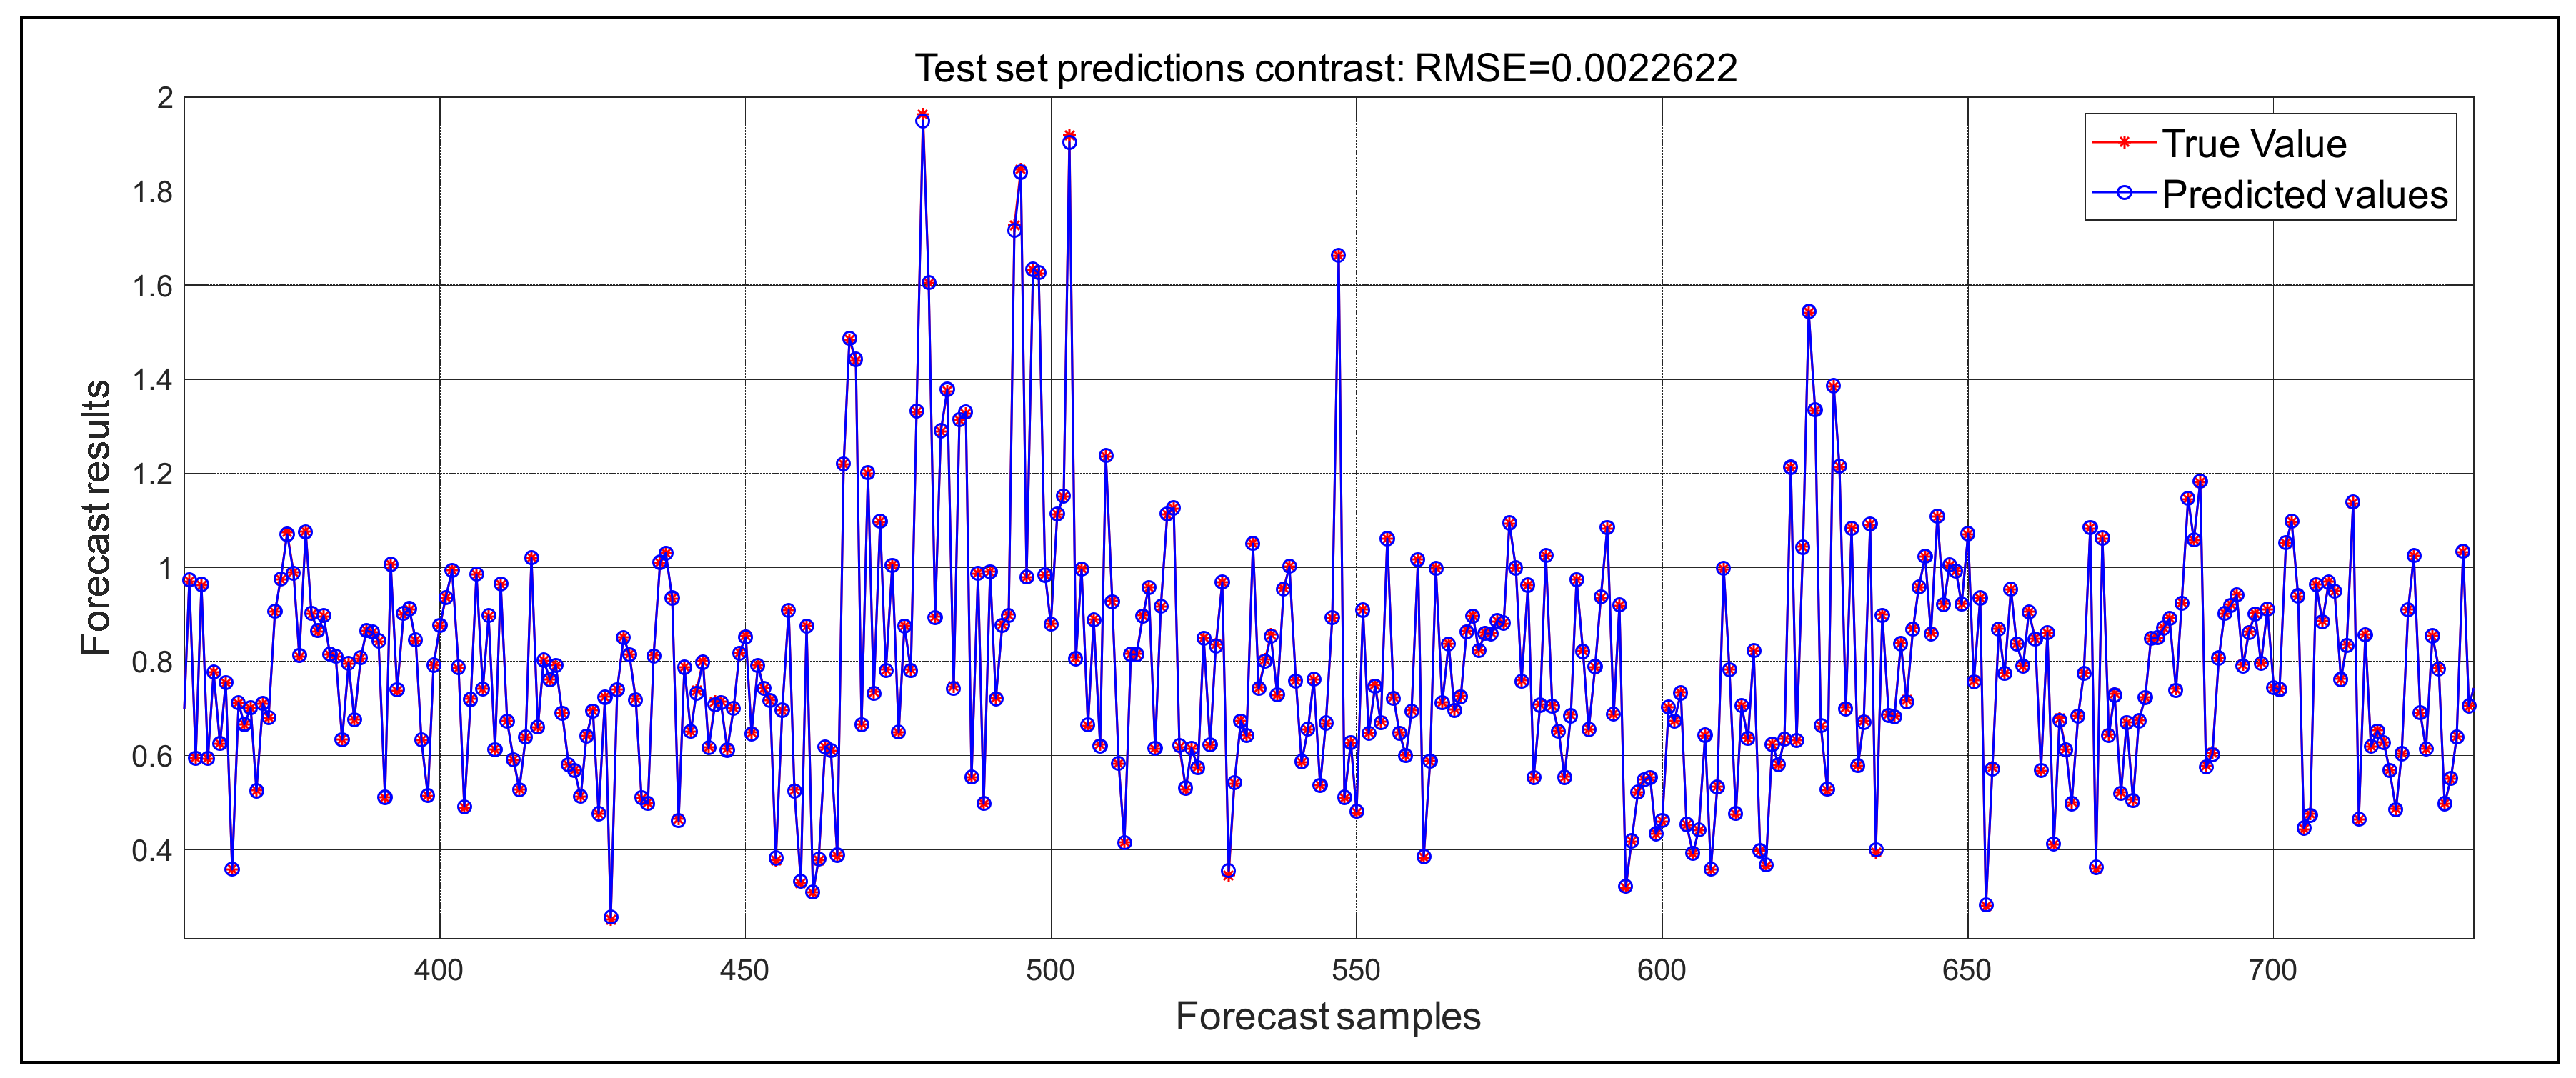
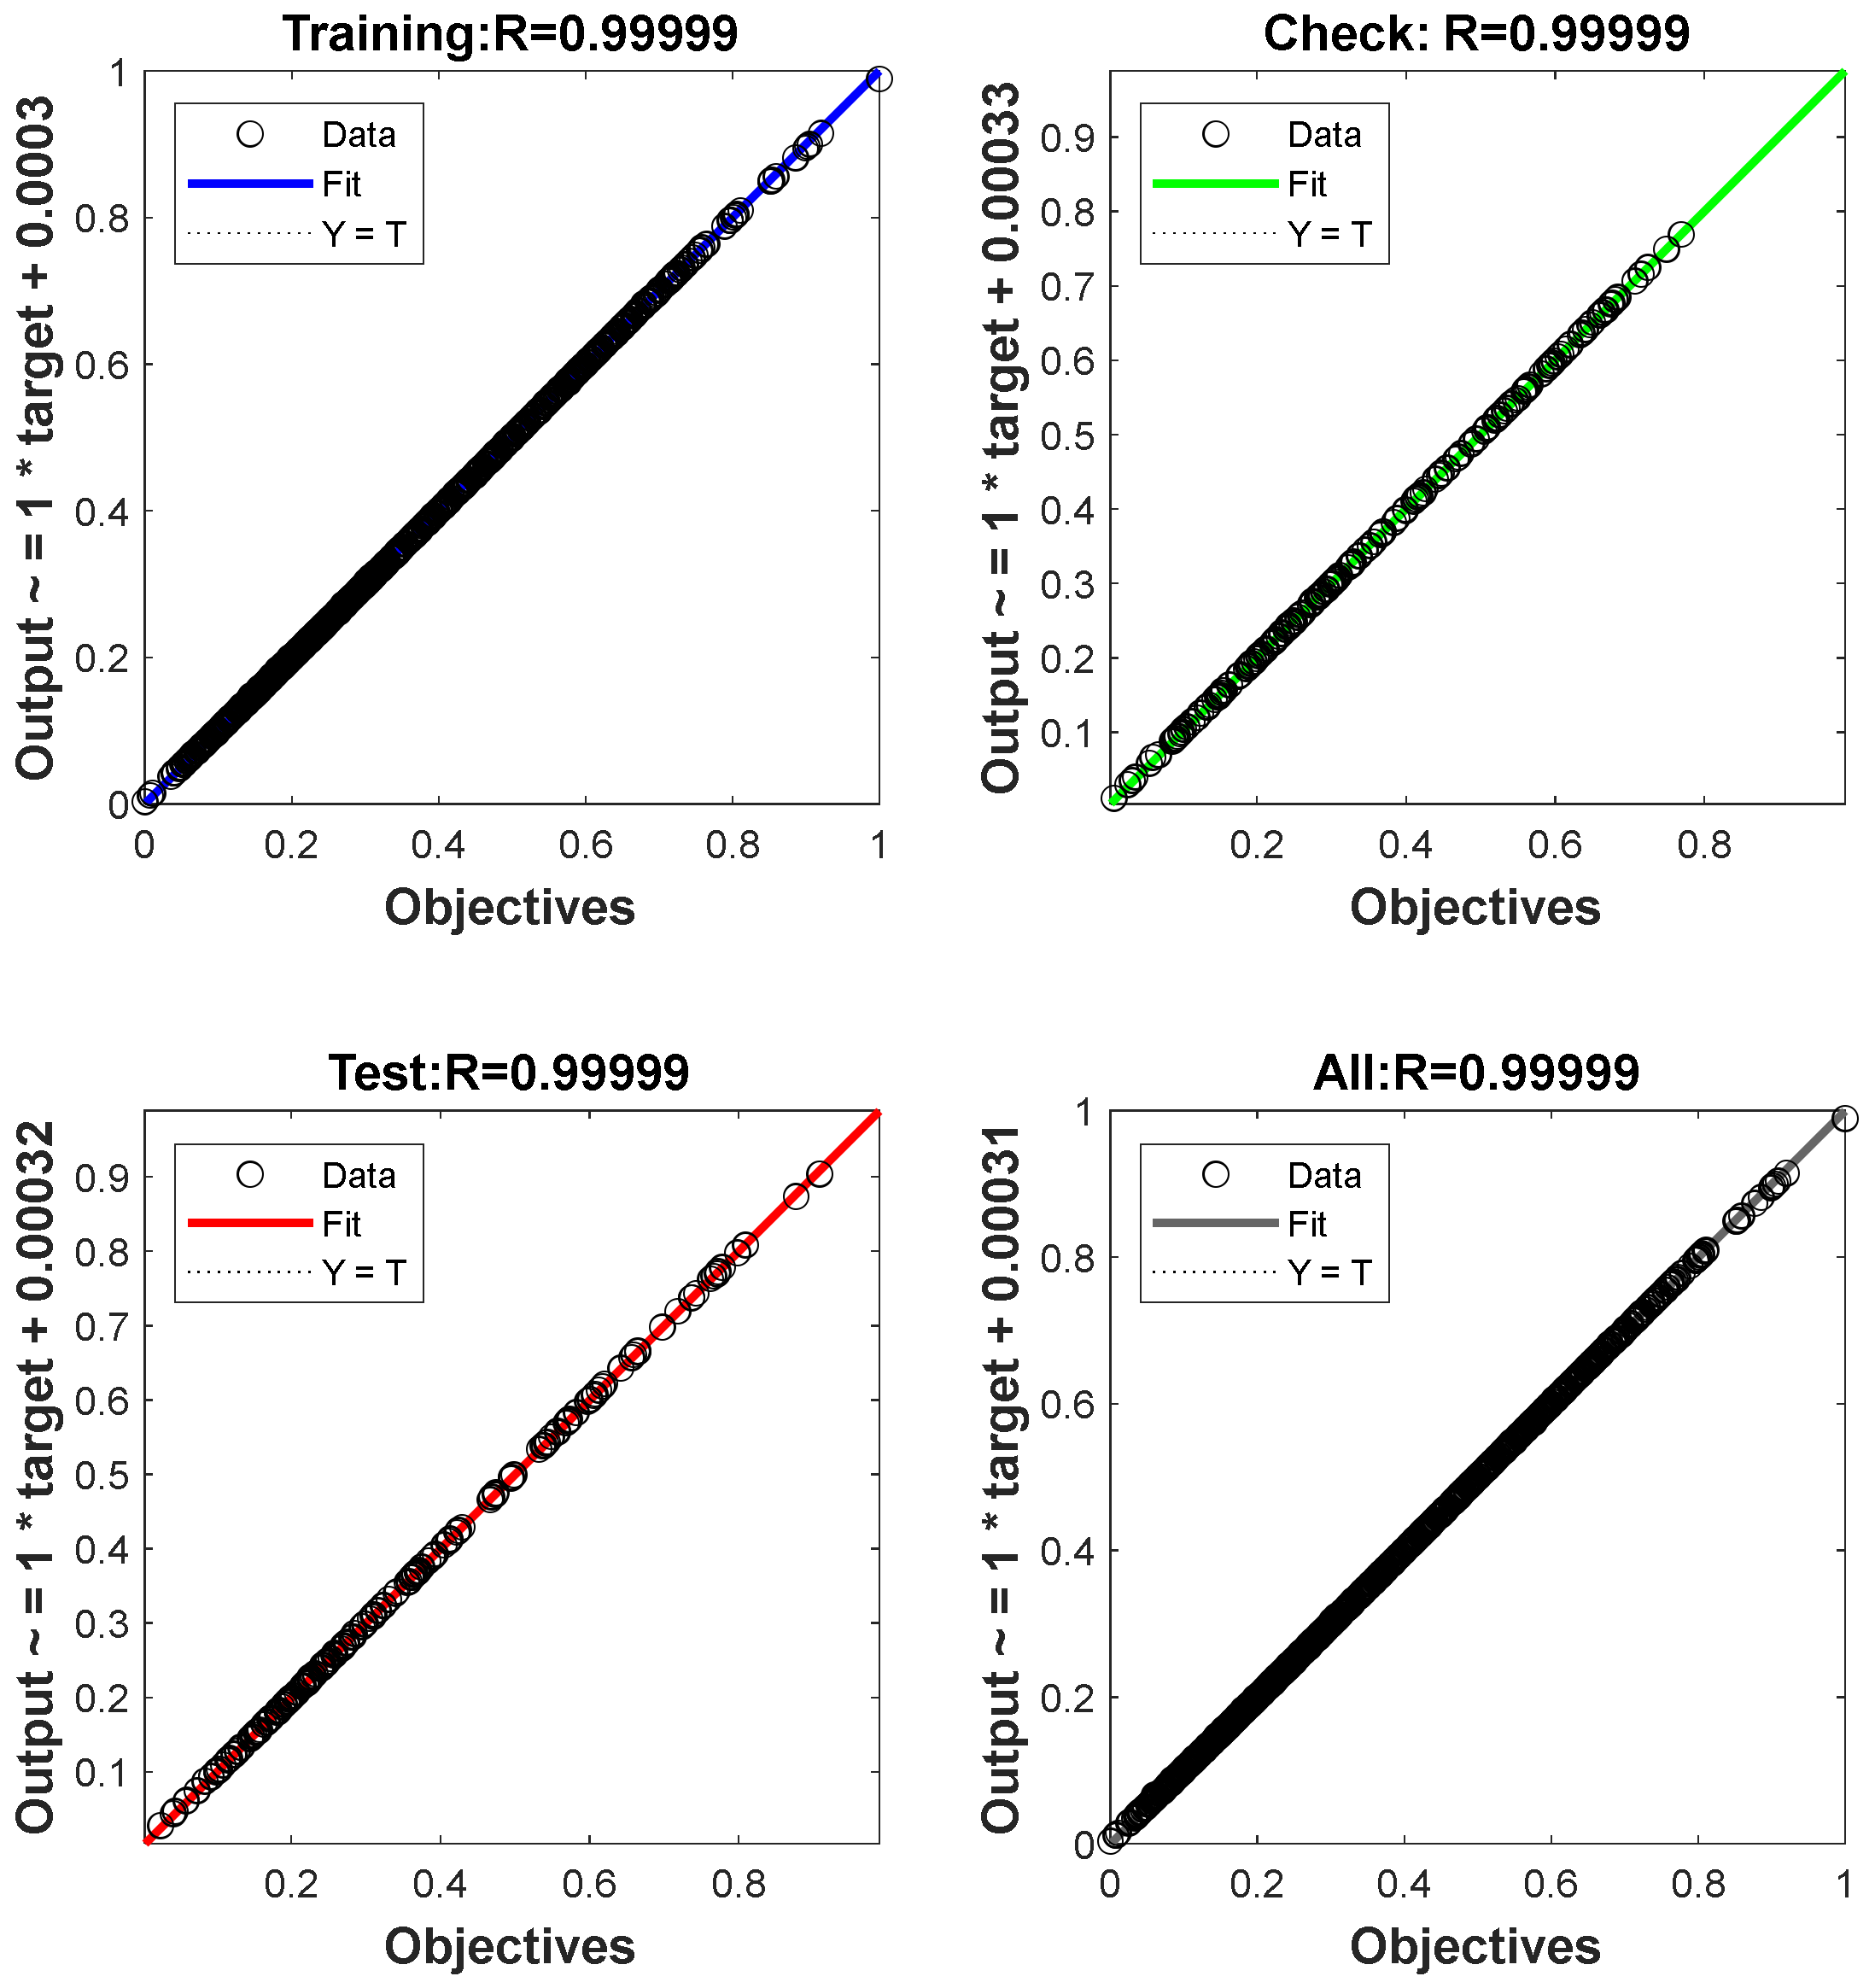
According to Table 5, there are a total of 1933 disaster records, of which 1160 (60%) records are used for training operations and the rest (773, 40%) are used for prediction. The results are shown in Table 6, Figure 3, Figure 4 and Figure 5. From these results, it can be found that the MAE and the RMSE values are small enough, and the correlation coefficient R is very high. At the same time, the linear regression plot of the training model presents a diagonal straight line, indicating that the model is trained very well. The prediction results are accurate, and the constructed model meets the accuracy requirements.

4. Case Study

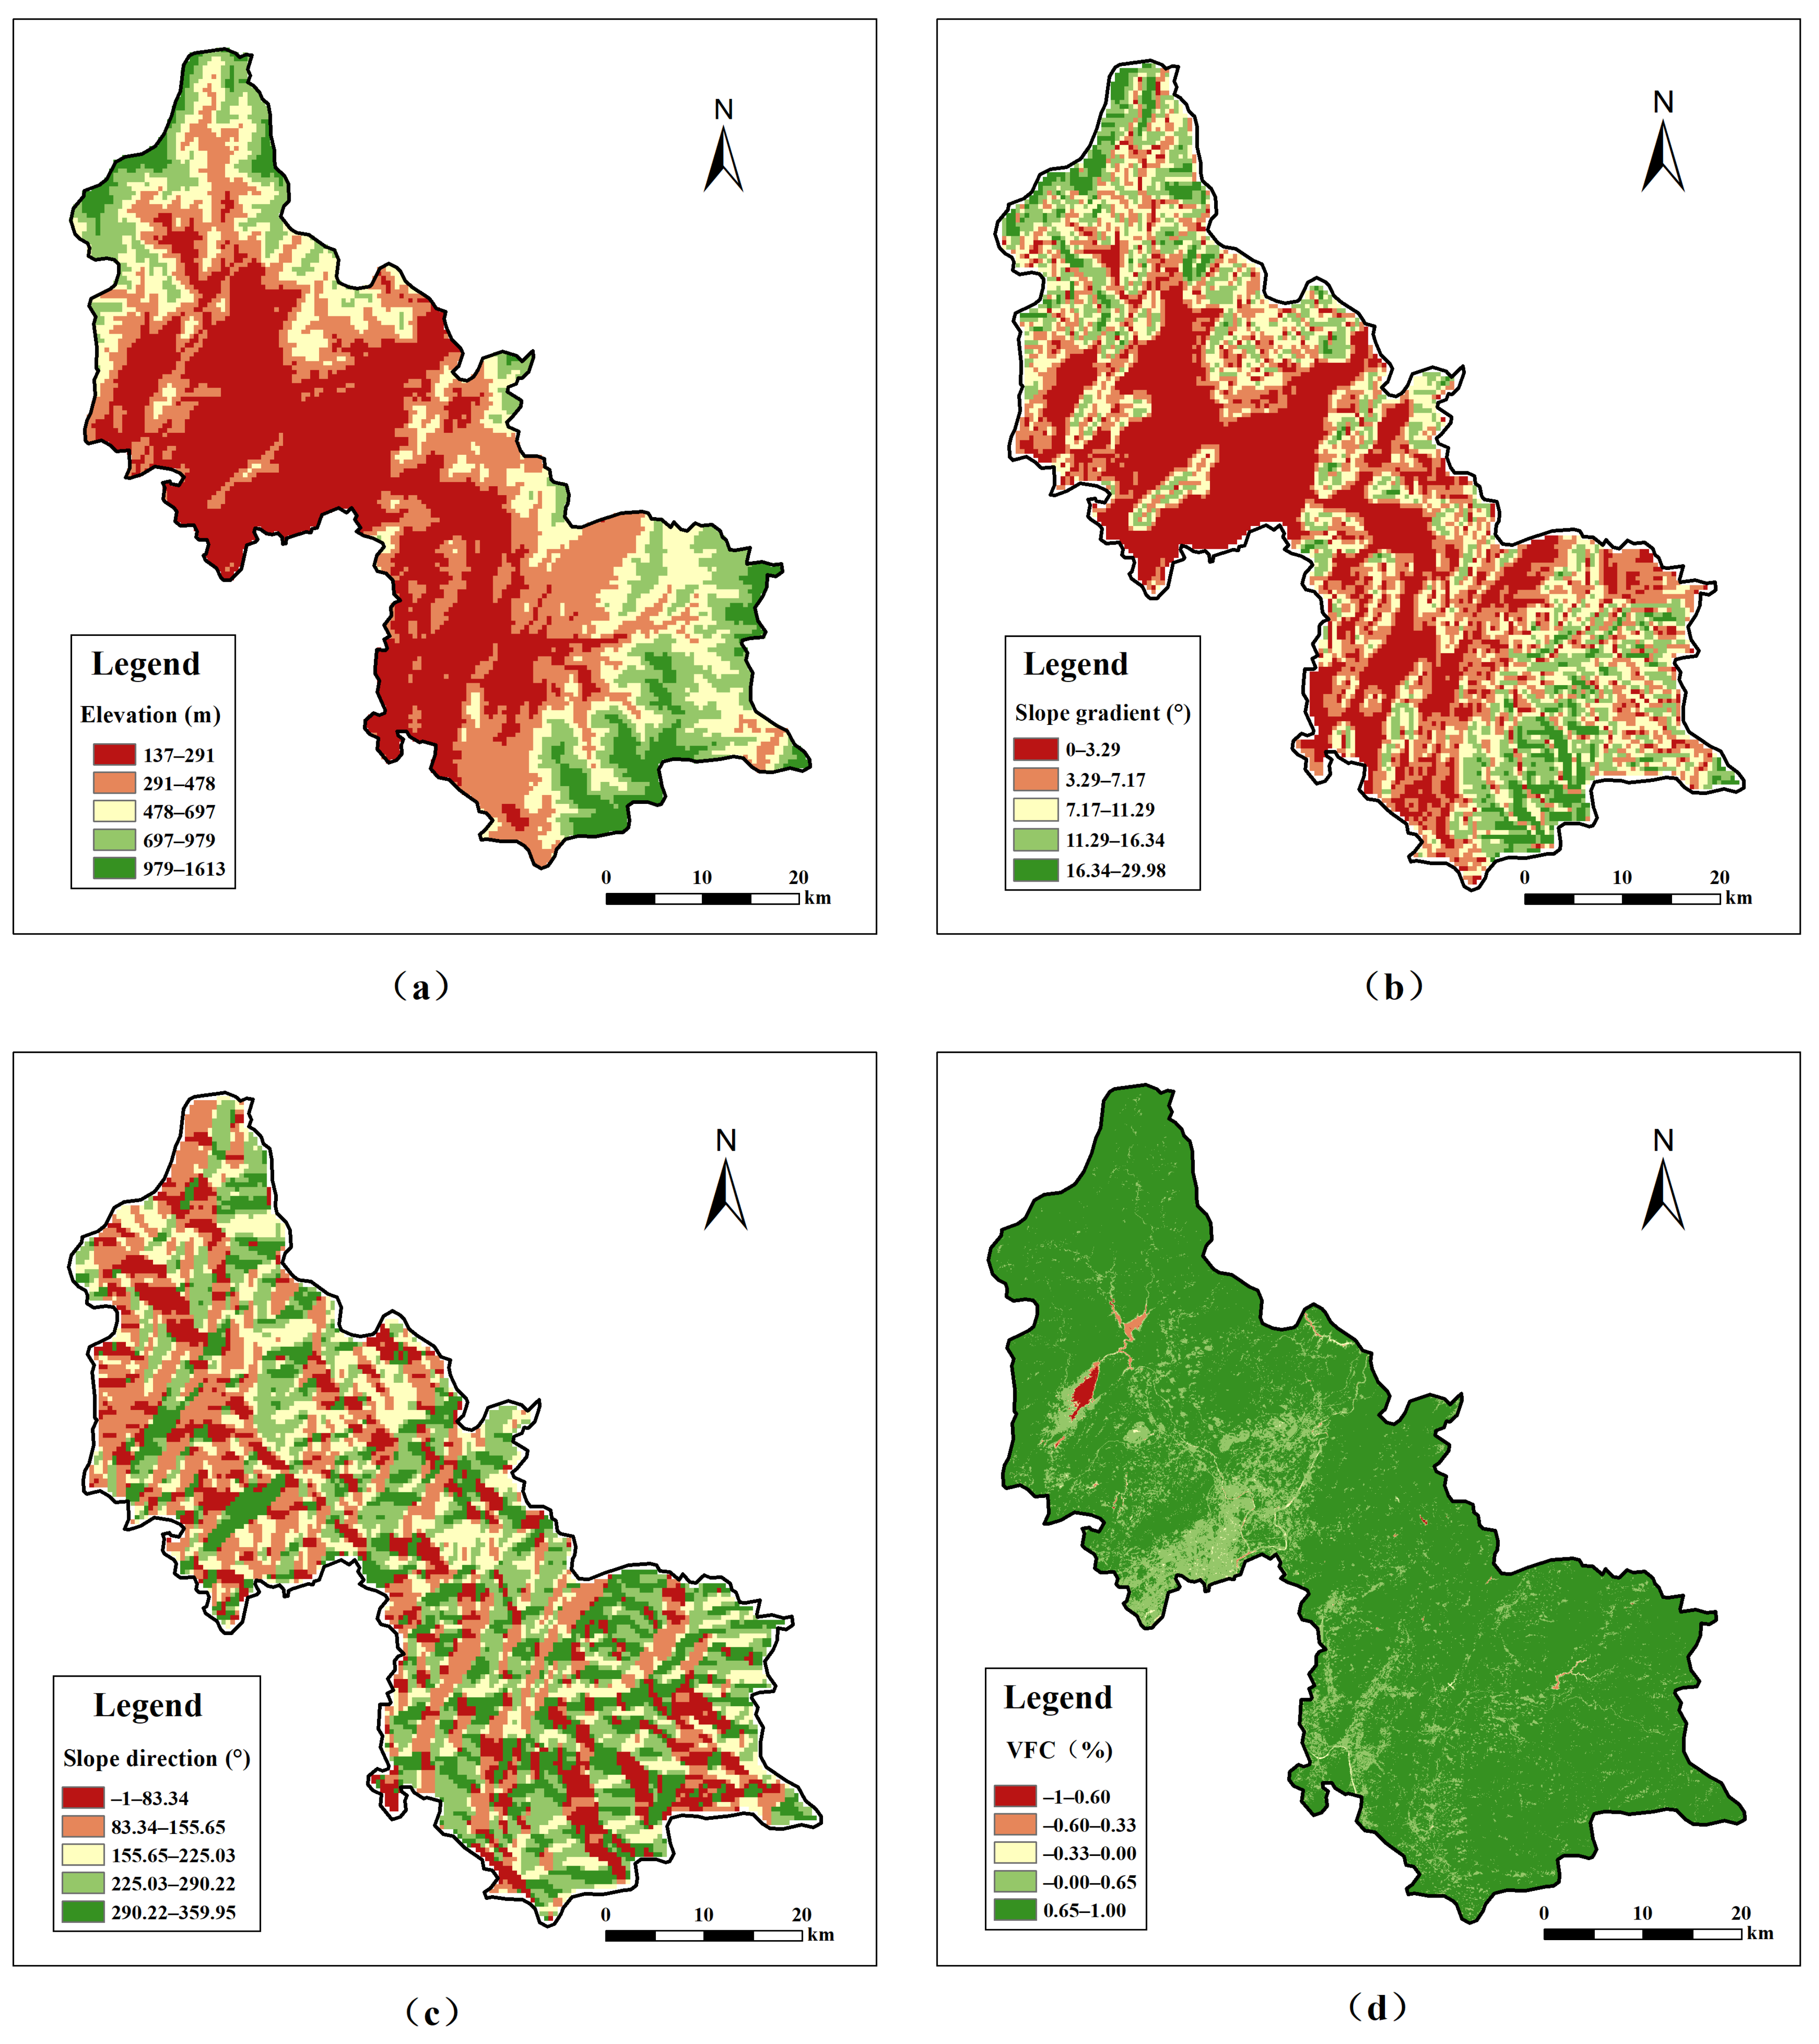
Based on the well-trained neutral networks using Guangxi data, Lingchuan County, part of Guilin City, Guangxi, is taken as an example to test the validity, accuracy, and reliability of this model constructed in this paper. Lingchuan has an administrative area of 2302 km2, between latitude 25°04′–25°48′ N and longitude 110°07′–110°47′ E. The area is in the middle-subtropical monsoon climate zone, with four distinct seasons and abundant rainfall. The geological structure of its territory is complex, characterized by “dorsal sloping into a mountain, sloping into a valley”. The fault strata in the study area are Ordovician, Devonian, Limestone, and Cretaceous, and many of them are buried by the Quaternary. The Guilin karst landscape extends into the hinterland of the county. It is distributed in groups, especially in Daxu, Chaotian, Haiyang, Dajing, Lingtian, Dingjiang, Jiuwu, Gongping, and Sanjie. The distribution of some of the influences mapped in the ArcGIS software (v10.8) is shown in Figure 6.

4.1. Risk Prediction

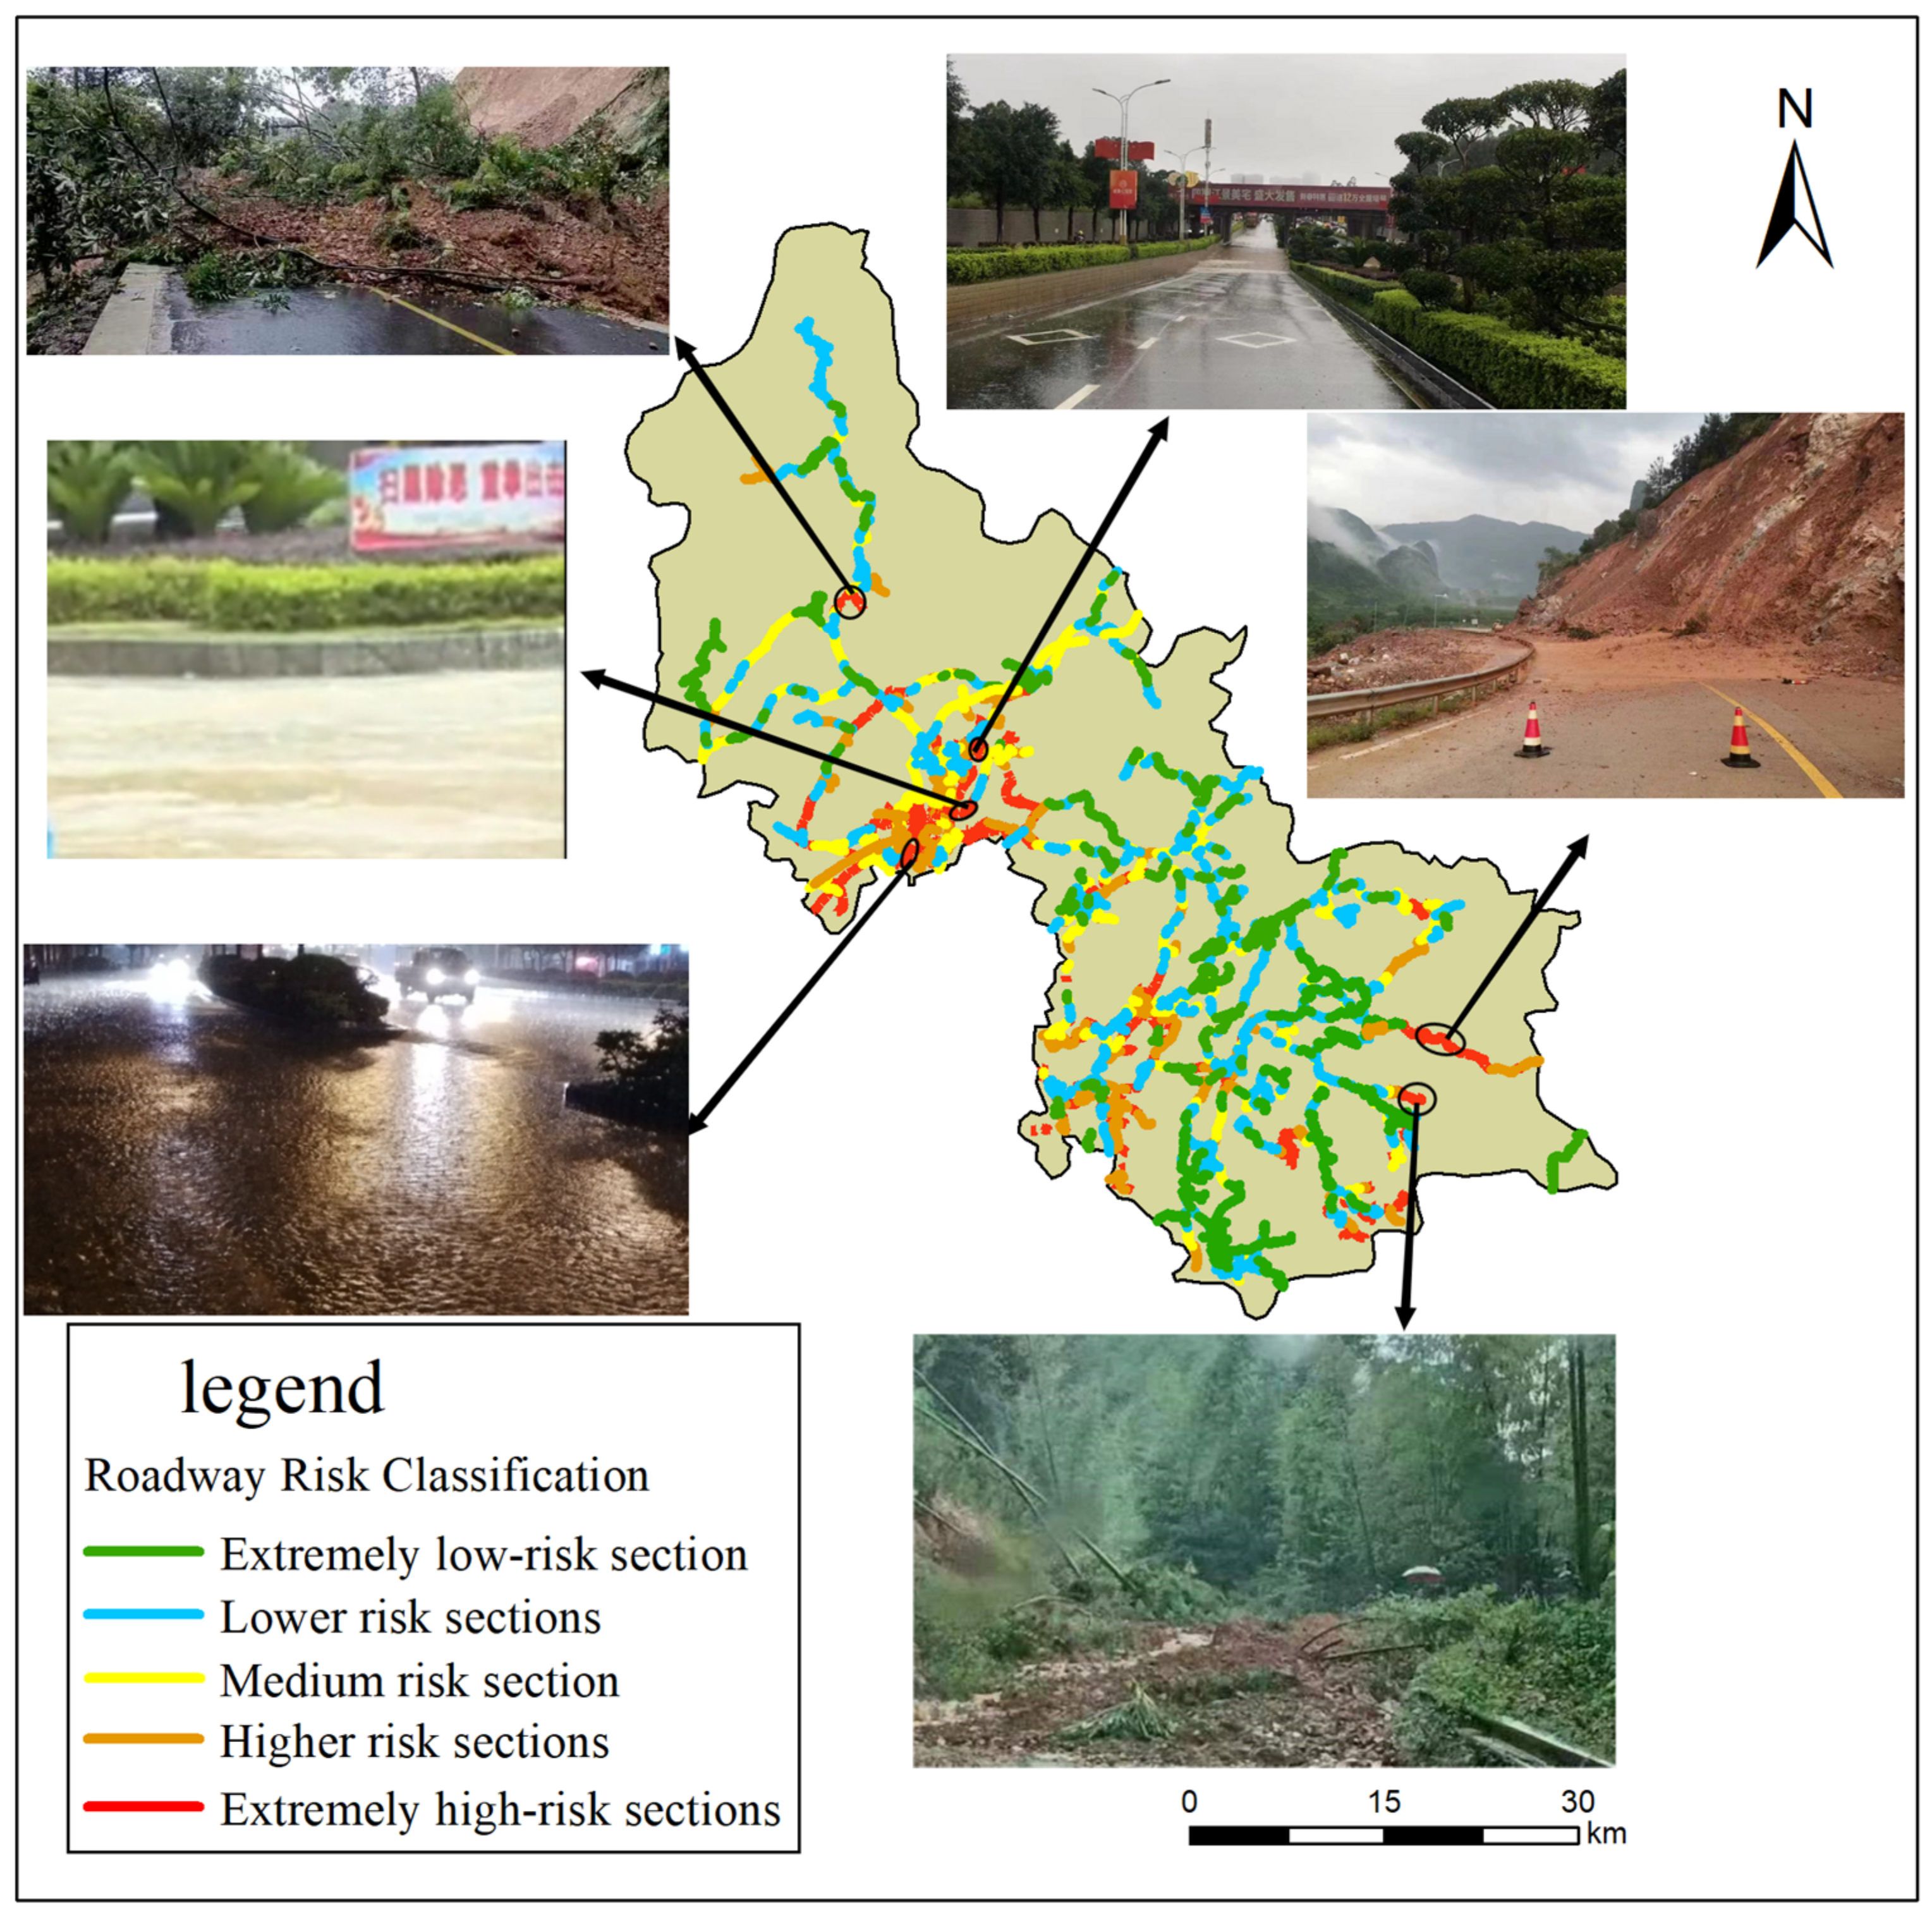
Based on the real-time data of the road network in Lincheon County in June 2022 (Table 7), the trained neural network model was used to calculate the road risk in Lincheon County. The prediction results are classified into risk levels according to Table 8. The natural disaster risk assessment map of roads in Lingchuan County was derived through GIS, as shown in Figure 7.
According to Figure 7, it can be seen that the roads in Lingchuan County are densest in Dingjiang Town, Daxu Town, and Lingchuan Town, followed by Lingtian Town, Haiyang Town, and Chaotian Town. The rest of the roads in Gongping Town, Jiuya Town, Haiyang Town, Sanjie Town, and Dajing Yao Town are less dense. Roads in Lingchuan County are mostly in medium-low risk level, and low-risk road sections are mostly distributed in Jiuya Town, Sanjie Town, Lingtian Town, and Haiyang Town. Dangerous road sections are found in the southwest of Lingchuan County, the northeast of Dingjiang Town, and the central part of Daxu Town, and the rugged surface and small thickness of the soil layer in the above areas are more prone to causing geologic hazards.

4.2. Validation

According to reports, there has been a round of heavy rainfall in Guilin City from 17 June to 18 June 2022. The news and local government reported damage to the road network after the heavy rainfall.
In Dajing Town, Lingchuan County, the Tiekeng road section experienced a mountain landslide with large safety hazards, and traffic was disrupted. The Putaoling road section experienced slope collapse. The landslide was about 500 m3, and the road could not be passed. In the road section from Gongping to Lantian, there were several landslides in Nanao and Huanghuping villages, which were temporarily impassable. Wenlan Highway experienced several landslides and collapses, consequently interrupting traffic. As can be seen from the figure, due to the occurrence of heavy rain and the geological conditions of the road section, landslide and collapse events occurred in the Wenlan Road section, causing a large amount of soil and tree debris and posing a threat to travel safety. Additionally, several locations experienced widespread hydrops, including East Ring Road, Yinqu Road, and Lingchuan Avenue, making it impossible for vehicles and pedestrians to pass through.
The landform of Lingchuan County is complex, with mountains and rolling hills in the east and north and small flat plains in the middle. According to Figure 7, there are mountains near Wenlan Road, Tiekeng Road, and Gongping Road. Due to the loose structure of the rock and the soil types of the mountain, resistance to weathering is low. The slope of some mountains is greater than 10°. The occurrence of continuous heavy rain disasters causes water to penetrate into the slope, increases pore water pressure, softens rock and soil, and increases the bulk density of the slope, thus promoting or inducing the occurrence of landslide and mountain collapse disasters. Additionally, as a city with high topography and low topography in certain areas, short-term heavy rainfall leads to fast surface runoff speeds, with rainwater flowing directly into low areas of the city through surface runoff, resulting in large overflow pressure and insufficient overflow capacity in the pipe network. In addition, heavy rainfall resulted in trees and vegetation, such as fallen leaves, and garbage to block the water intake to the pipe system, resulting in slow rain drainage and flooding on Yinqu Road, East Ring Road, and other roads.
During this period of heavy rainfall, severe natural disasters occurred in six sections of roads, all of which are included in the list of sections with a high risk level predicted by this model. However, the model predicts a total of eight sections with this risk level, so the prediction accuracy can be considered to be 75%. It should be noted that this accuracy rate may not be lower than 75% because the fact that the remaining two road sections did not experience natural disasters at that time does not mean that they will not experience them in the future. Therefore, the model has a high degree of practicality.

5. Conclusions

With the continuous development of the economy and society, crisscrossing road networks have become essential lifelines for human activities. Therefore, it is significant to perform a risk assessment of natural disasters on road networks. This paper constructs a prediction model based on the method of the neural network combined with a fuzzy comprehensive evaluation and draws the following conclusions:
  • The FCE can effectively handle ambiguous and uncertain information, while neural networks have strong information-processing capabilities and autonomous learning abilities. This paper utilizes both to construct a road natural disaster risk assessment model, enabling the full play of their respective strengths and achieving good predictions for the natural disaster risk in road networks.
  • Based on the statistical analysis of natural disasters in road networks, ten influencing factors were selected from meteorological, geological, and human activity aspects as input parameters for the road natural disaster risk model. Through case studies, it has been demonstrated that the selected influencing factors adequately express and reflect the model’s characteristics, meeting the requirements for road natural disaster risk assessment.
  • Taking Guangxi as an example, this paper completed the training of a road natural disaster risk assessment model. The training results were satisfactory, and the model was used to predict the natural disaster risk in Lingchuan County, Guangxi. The results indicated a high precision in the predictions, providing technical support for road disaster prevention.
The objectives of this study are to address the following three key issues: perform multi-hazard assessment adapted to the needs of human development, establish a unified assessment index system, and complement the existing research on road networks. To this end, we selected 10 representative influencing factors. We constructed an assessment model using the fuzzy comprehensive evaluation method and neural network technology to achieve an accurate assessment of natural disaster risk in road networks. The accuracy of the model’s assessment was verified through case studies, and the results showed high data accuracy. The modeling provides theoretical support and technical means for developing subsequent early warning systems for road networks.

6. Recommendations

Due to limited data and other reasons, natural disaster risk assessments of road networks still require further research. In addition to the influencing factors discussed here, the characteristics of the road itself, such as its material [30], service life, slope [31], etc., may also affect the occurrence of road hazards. When used, the model parameters can be adjusted according to specific conditions, as the input variables can be adjusted the neural network structure can be changed, and more representative factors can be adopted for the study area to help the model better adapt to different regional environments. Similarly, the evaluation model is constantly being optimized to determine if other types of neural networks can be used or combined with other algorithms [32]. Determining the prediction accuracy of this method and improving it will be topics for future research.
The ultimate goal of this study was to combine big data obtained from pavement management systems with climate and natural disaster information to create a data management system with practical application value that can be used for prediction and early warning. This method will improve the efficiency of road network management, maintenance and traffic organization. However, due to the huge workload, detailed road data have not been fully presented in this study and represents an avenue for future research.

Author Contributions

Conceptualization, C.Z. and M.C.; methodology, C.Z. and M.C.; software, C.Z. and M.C.; validation, Y.C. and J.C.; formal analysis, M.C.; investigation, Y.C.; resources, W.C. and C.Z.; data curation, J.C.; writing—original draft preparation, M.C.; writing—review and editing, C.Z.; visualization, M.C. and J.C.; supervision, W.C.; project administration, W.C.; funding acquisition, W.C. All authors have read and agreed to the published version of the manuscript.

Funding

This research was supported by the National Natural Science Foundation of China (No. 52168061), the Guangxi Natural Science Foundation (No. 2022JJA160201), and the Innovation Project of GUET Graduate Education (No. 2023YCXS188).

Institutional Review Board Statement

Not applicable.

Informed Consent Statement

Not applicable.

Data Availability Statement

Data are contained within the article.

Conflicts of Interest

The authors declare no conflicts of interest.

References

  1. Zhu, Z.J.; Zhang, Y. Flood disaster risk assessment based on random forest algorithm. Neural Comput. Appl. 2021, 34, 3443–3455. [Google Scholar] [CrossRef]
  2. Gill, J.C.; Malamud, B.D. Hazard interactions and interaction networks (cascades) within multi-hazard methodologies. Earth Syst. Dyn. 2016, 7, 659–679. [Google Scholar] [CrossRef]
  3. Kappes, M.S.; Keiler, M.; von Elverfeldt, K.; Glade, T. Challenges of analyzing multi-hazard risk: A review. Nat. Hazards 2012, 64, 1925–1958. [Google Scholar] [CrossRef]
  4. Sekhri, S.; Kumar, P.; Fürst, C.; Pandey, R. Mountain specific multi-hazard risk management framework (MSMRMF): Assessment and mitigation of multi-hazard and climate change risk in the Indian Himalayan Region. Ecol. Indic. 2020, 118, 106700. [Google Scholar] [CrossRef]
  5. Dilley, M.; Mundial, B. Natural Disaster Hotspots: A Global Risk Analysis; World Bank, Hazard Management Unit: Washington, DC, USA, 2005. [Google Scholar]
  6. Carreño, M.L.; Cardona, O.; Barbat, A.H.; Suarez, D.C.; Perez, M.D.P.; Narvaez, L. Holistic Disaster Risk Evaluation for the Urban Risk Management Plan of Manizales, Colombia. Int. J. Disaster Risk Sci. 2017, 8, 258–269. [Google Scholar] [CrossRef]
  7. Shome, P.; Afroj, S. Local Level multi-hazards mapping for natural and manmade hazards: A case study of Chittagong Division. J. Environ. Eng. Its Scope 2019, 2, 1–9. [Google Scholar]
  8. Araya-Munoz, D.; Metzger, M.J.; Stuart, N.; Wilson, A.M.W.; Carvajal, D. A spatial fuzzy logic approach to urban multi-hazard impact assessment in conception, Chile. Sci. Total Environ. 2017, 576, 508–519. [Google Scholar] [CrossRef] [PubMed]
  9. Nadim, F.; Kjekstad, O. Assessment of Global High-Risk Landslide Disaster Hotspots. In Landslides—Disaster Risk Reduction; Springer: Berlin/Heidelberg, Germany, 2009; pp. 213–221. [Google Scholar]
  10. Peduzzi, P.; Dao, H.; Herold, C.; Mouton, F. Assessing global exposure and vulnerability towards natural hazards: The Disaster Risk Index. Nat. Hazards Earth Syst. Sci. 2009, 9, 1149–1159. [Google Scholar] [CrossRef]
  11. Xu, W.; Ming, X.D.; Ma, Y.J.; Zhang, X.H.; Shi, P.J.; Zhuo, L.; Lu, B.Q. Quantitative Multi-Hazard Risk Assessment of Crop Loss in the Yangtze River Delta Region of China. Sustainability 2019, 11, 922. [Google Scholar] [CrossRef]
  12. Liu, H.; Chen, H.; Hong, R.; Liu, H.; You, W. Mapping knowledge structure and research trends of emergency evacuation studies. Saf. Sci. 2020, 121, 348–361. [Google Scholar] [CrossRef]
  13. Choe, T.; Kim, J.; Shin, M.; Kim, K.; Kim, M. Complex disaster response framework to reduce urban disaster vulnerability. Sci. Prog. 2023, 106, 1. [Google Scholar] [CrossRef]
  14. Dong, S.J.; Esmalian, A.; Farahmand, H.; Zachry, A.M. An integrated physical-social analysis of disrupted access to critical facilities and community service-loss tolerance in urban flooding. Comput. Environ. Urban Syst. 2022, 93. [Google Scholar] [CrossRef]
  15. Lin, C.Y.; Lai, Y.C.; Wu, S.W.; Mo, F.C.; Lin, C.Y. Assessment of potential sediment disasters and resilience management of mountain roads using environmental indicators. Nat. Hazards 2022, 111, 1951–1975. [Google Scholar] [CrossRef]
  16. Pellicani, R.; Argentiero, I.; Spilotro, G. GIS-based predictive models for regional-scale landslide susceptibility assessment and risk mapping along road corridors. Geomat. Nat. Hazards Risk 2018, 8, 1012–1033. [Google Scholar] [CrossRef]
  17. Huang, G.W. Enhancing Dialogue between Flood Risk Management and Road Engineering Sectors for Flood Risk Reduction. Sustainability 2018, 10, 1773. [Google Scholar] [CrossRef]
  18. Wang, J.H.; Qin, Q.M.; Zhao, J.H.; Ye, X.; Feng, X.; Qin, X.B.; Yang, X.C. Knowledge-Based Detection and Assessment of Damaged Roads Using Post-Disaster High-Resolution Remote Sensing Image. Remote Sens. 2015, 7, 4948–4967. [Google Scholar] [CrossRef]
  19. Zhao, K.; Liu, J.J.; Wang, Q.N.; Wu, X.J.; Tu, J.H. Road Damage Detection from Post-Disaster High-Resolution Remote Sensing Images Based on TLD Framework. IEEE Access 2022, 10, 43552–43561. [Google Scholar] [CrossRef]
  20. Tadano, K.; Maeno, Y.; Carnevali, L. Road Repair Sequencing for Disaster Victim Evacuation. Adv. Soc. Simul. 2015 2017, 528, 401–412. [Google Scholar]
  21. Kim, J.; Park, J.; Kim, K.; Kim, M. RnR-SMART: Resilient smart city evacuation plan based on road network reconfiguration in outbreak response. Sustain. Cities Soc. 2021, 75, 103386. [Google Scholar] [CrossRef]
  22. Malakar, S.; Rai, A.K.; Gupta, A.K. Earthquake risk mapping in the Himalayas by integrated analytical hierarchy process, entropy with neural network. Nat. Hazards 2023, 116, 951–975. [Google Scholar] [CrossRef]
  23. Meng, X.J.; Chang, J.X.; Wang, X.B.; Wang, Y.; Wang, Z. Flood control operation coupled with risk assessment for cascade reservoirs. J. Hydrol. 2019, 572, 543–555. [Google Scholar] [CrossRef]
  24. Chen, H.; Xu, Z.X.; Liu, Y.; Huang, Y.X.; Yang, F. Urban Flood Risk Assessment Based on Dynamic Population Distribution and Fuzzy Comprehensive Evaluation. Int. J. Environ. Res. Public Health 2022, 19, 16406. [Google Scholar] [CrossRef]
  25. Jiang, J.C.; Wang, F.; Wang, Y.Z.; Jiang, W.Y.; Qiao, Y.M.; Bai, W.F.; Zheng, X.X. An Urban Road Risk Assessment Framework Based on Convolutional Neural Networks. Int. J. Disaster Risk Sci. 2023, 14, 475–487. [Google Scholar] [CrossRef]
  26. JTJ 003-86[S/OL]; Standard of Climatic Zoning for Highway. Standards Press of China: Beijing, China, 1986.
  27. Santini, M.; Grimaldi, S.; Nardi, F.; Petroselli, A.; Rulli, M.C. Pre-processing algorithms and landslide modelling on remotely sensed DEMs. Geomorphology 2009, 113, 110–125. [Google Scholar] [CrossRef]
  28. Liu, X.; Zhou, P.; Lin, Y.C.; Sun, S.W.; Zhang, H.L.; Xu, W.Q.; Yang, S.D. Influencing Factors and Risk Assessment of Precipitation-Induced Flooding in Zhengzhou, China, Based on Random Forest and XG Boost Algorithms. Int. J. Environ. Res. Public Health 2022, 19, 16544. [Google Scholar] [CrossRef]
  29. Rahimi, D.; Hasheminasab, S.; Abdollahi, K. Assessment of temperature and rainfall changes in the Karoun River basin. Theor. Appl. Climatol. 2019, 137, 2829–2839. [Google Scholar] [CrossRef]
  30. Bordoni, M.; Persichillol, M.G.; Meisina, C.; Crema, S.; Cavalli, M.; Bartelletti, C.; Galanti, Y.; Barsanti, M.; Giannecchini, R.; Avanzi, G.D. Estimation of the susceptibility of a road network to shallow landslides with the integration of the sediment connectivity. Nat. Hazards Earth Syst. Sci. 2018, 18, 1735–1758. [Google Scholar] [CrossRef]
  31. Wang, Y.X.; Li, S.Y.; Li, B. Deformation Prediction of Cihaxia Landslide Using InSAR and Deep Learning. Water 2022, 14, 3990. [Google Scholar] [CrossRef]
  32. Zhang, S.; Li, C.; Peng, J.Y.; Peng, D.L.; Xu, Q.; Zhang, Q.; Bate, B. GIS-based soil planar slide susceptibility mapping using logistic regression and neural networks: A typical red mudstone area in southwest China. Geomat. Nat. Hazards Risk 2021, 12, 852–879. [Google Scholar] [CrossRef]
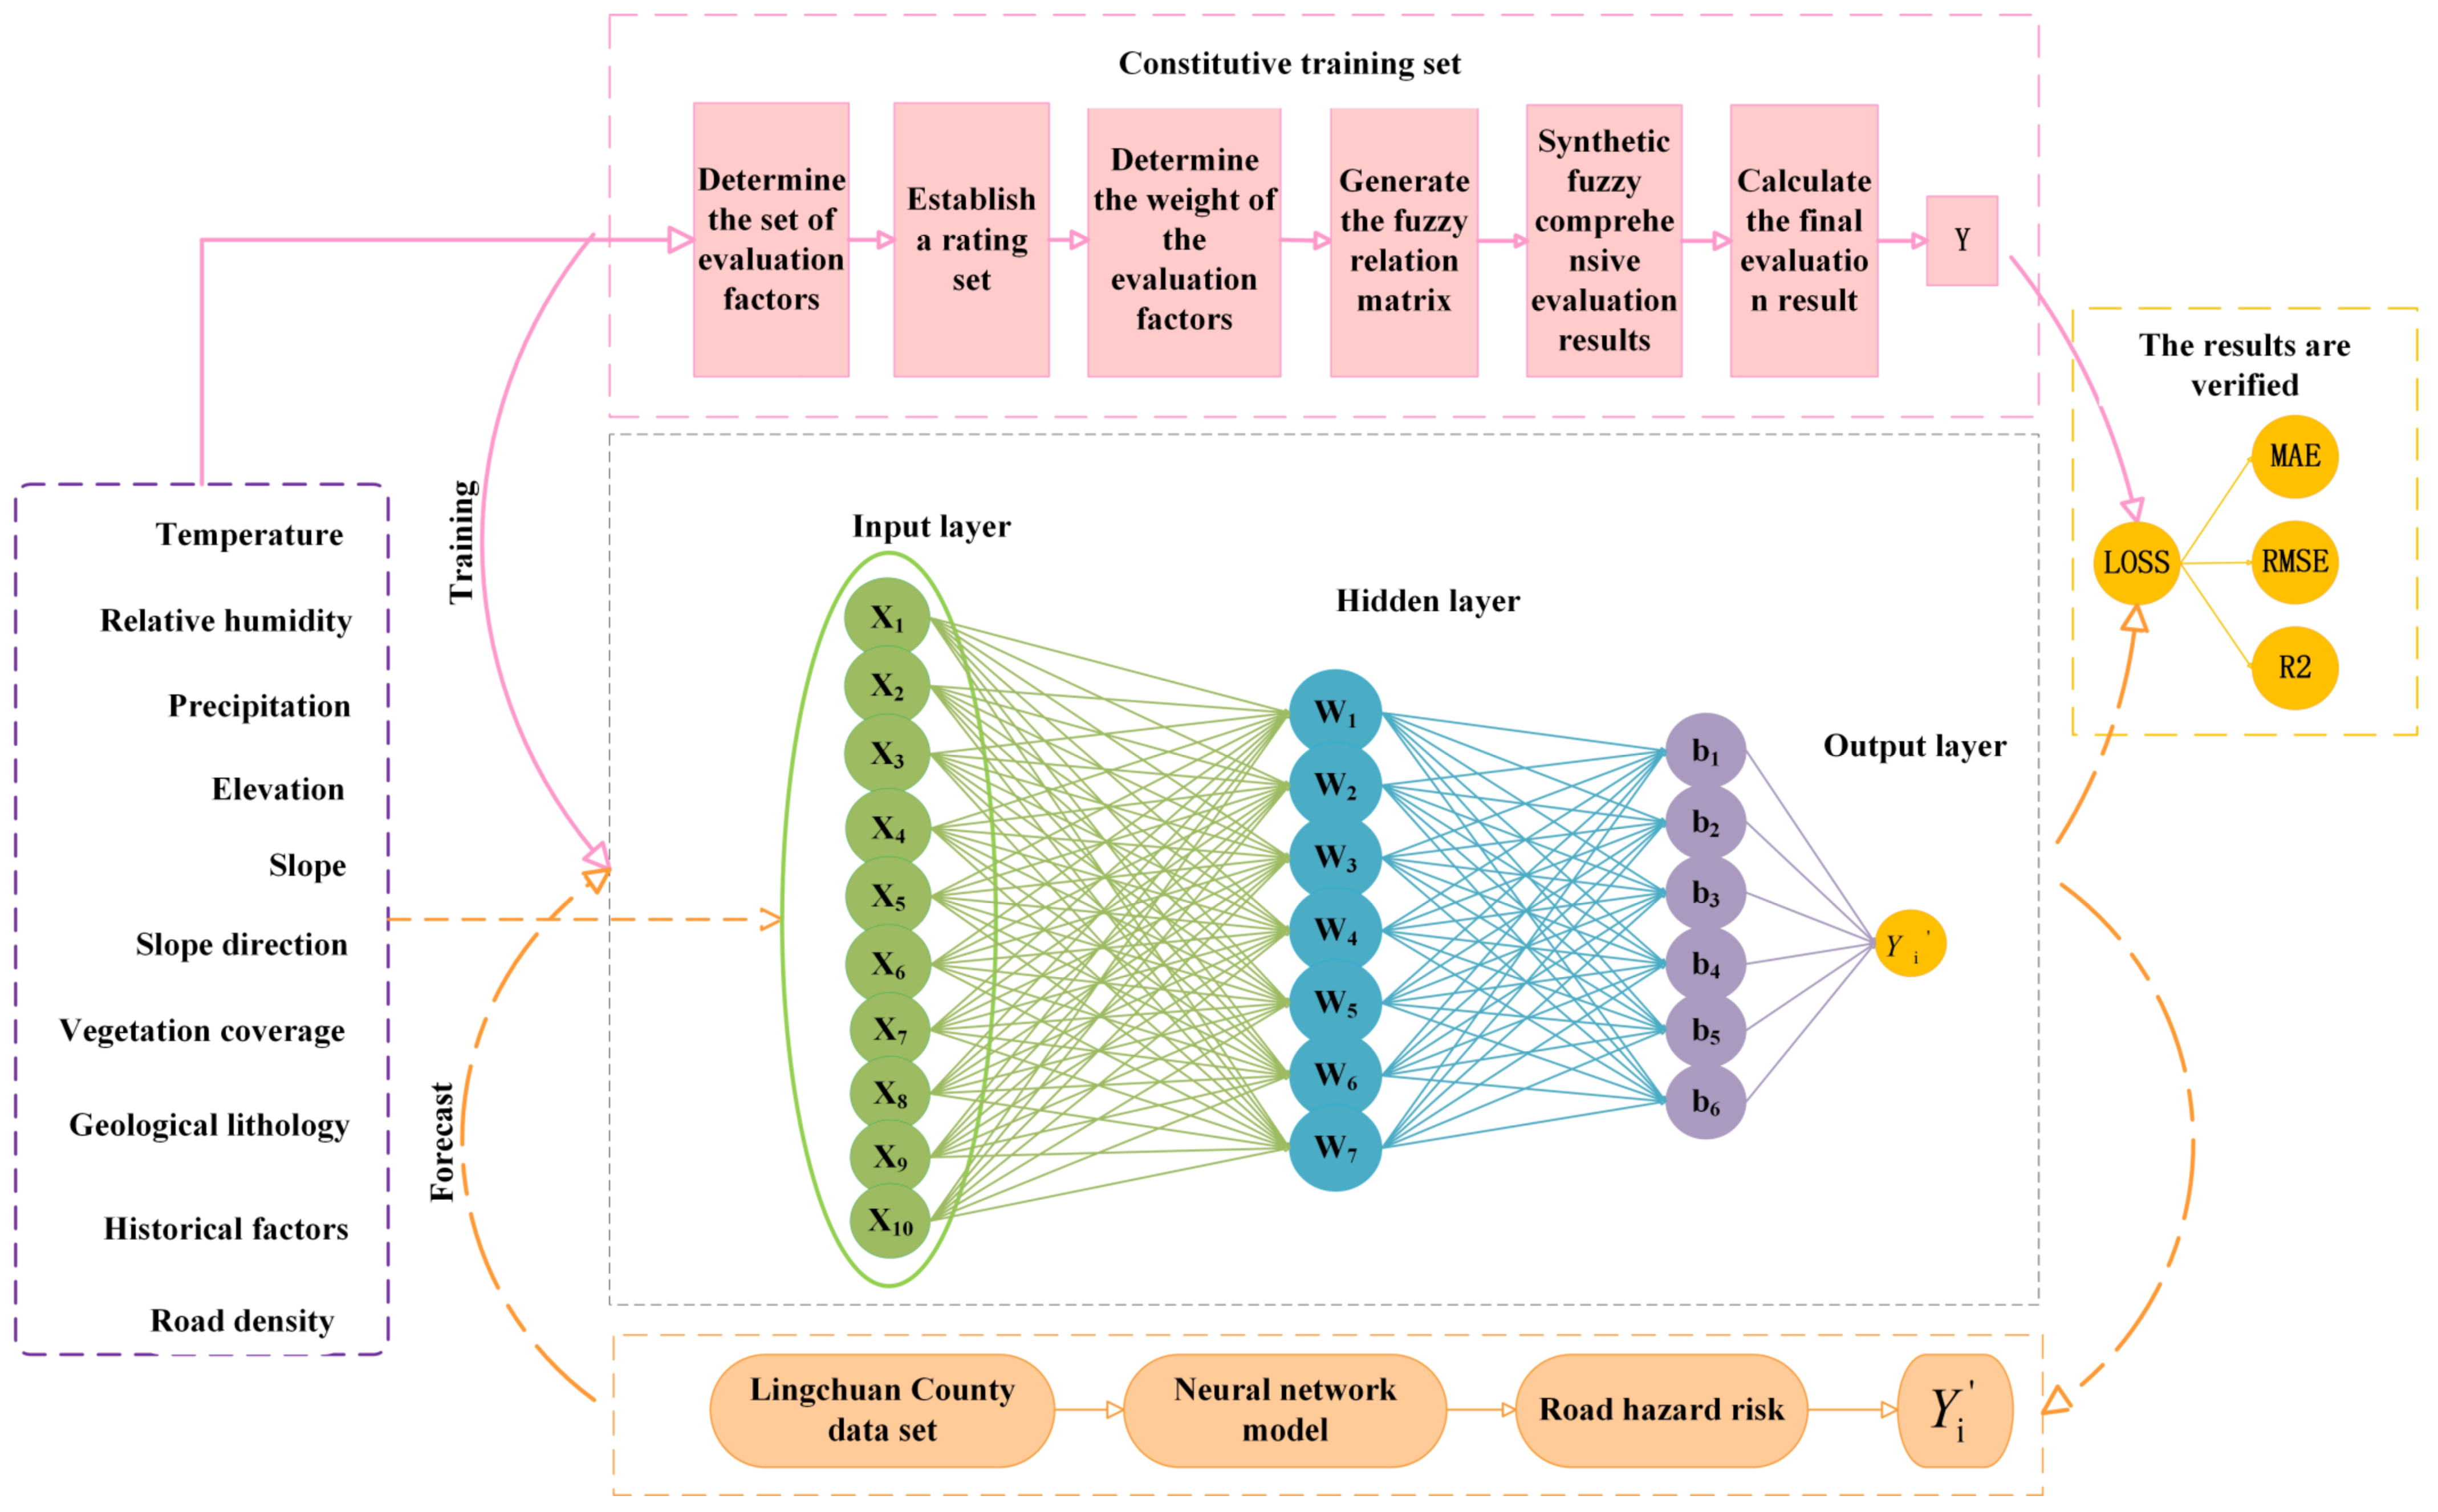
Figure 1. Diagram of natural hazard risk assessment model for roads.
Sustainability 16 02429 g001
Figure 2. Digital Elevation Model (DEM) of Guangxi Zhuang Autonomous Region.
Sustainability 16 02429 g002
Figure 3. Comparison diagram of training set results.
Sustainability 16 02429 g003
Figure 4. Comparison diagram of prediction set results.
Sustainability 16 02429 g004aSustainability 16 02429 g004b
Figure 5. Neural network linear regression diagram.
Sustainability 16 02429 g005
Figure 6. Geological mapping of Lingchuan County. (a) Elevation; (b) slope gradient; (c) slope direction; (d) VFC.
Sustainability 16 02429 g006
Figure 7. Road risk map of the study area.
Sustainability 16 02429 g007
Table 1. Loss function.
LOSSMAERMSER
Expression M A E = 1 N i = 1 N Y i Y i R M S E = 1 N i = 1 N Y i Y i 2 R = 1 i Y i Y i 2 i Y i ¯ Y i 2
Note: In particular, N is the number of training samples,   Y i is the actual value, Y i   is the forecast value, and Y i ¯ is the average value of the actual value.
Table 2. Classification of influencing factors.
GroupCategoryIndex (Id)
IMeteorological conditionsTemperature (x1); relative humidity (x2); precipitation (x3).
IIGeological conditionsElevation (x5); slope gradient(x6); slope orientation (x7);
Geologic lithology (x8); vegetation cover (x9).
IIIHuman activity conditionHistorical impact factors (x4); road density (x8).
Table 3. Reference values assigned to different types of rocks.
Rock TypeMagmaCarbonateClasticMetamorphicClaySandyLoessGravelly
Reference Value0.10.20.30.40.50.60.70.8
Table 4. Data sources.
Data TypeData SourceInformation ObtainedData Obtained
Weather DataWorld Weather’s official website
https://worldweather.wmo.int/zh/home.html
Climatic conditionsTemperature, relative humidity, and precipitation
DEM DataGeospatial Data Cloud 30 M Resolution Data
https://www.gscloud.cn/
Digital Elevation ModelElevation, slope, and slope orientation
Vegetation CoverageESA Glob Cover
https://earthexplorer.usgs.gov/
Satellite remote sensing dataFractional vegetation cover ( V F C )
Road Vector DataOSM (Open Street Map) official website of the latest data
https://openmaptiles.org/languages/zh/#0.55/0/0
Road vector dataRoad density
Geological lithologyNational Geological Archive
https://www.ngac.cn/125cms/c/qggnew/index.htm
Geological informationGeologic lithology and Historical impact factors
Table 5. Training set for disaster risk assessment.
Idx1
(Temperature, °C)
x2
(Relative Humidity, %)
x3
(Precipitation, mm)
x4
(Historical Impact Factors)
x5
(Elevation, m)
x6
(Slope Gradient, °)
x7
(Slope Orientation, °)
x8
(Geologic Lithology)
x9
(VFC, %)
x10
(Road Density, km2)
Y
(Evaluation Results)
130.27200.98324257.208.740.30.7900.48
2028.58300.98395316.496.720.30.851.000.62
187323.19510.984401106.011.850.20.743.160.73
1933196700.984536160.561.130.30.8900.91
Table 6. Neural network model output results.
ResultsMAERMSER
Training set0.00124030.00186390.99998
Prediction set0.00156970.00228240.99993
Table 7. Lingchuan County forecast dataset and output results.
Idx1
(Temperature, °C)
x2
(Relative Humidity, %)
x3
(Precipitation, mm)
x4
(Historical Impact Factors)
x5
(Elevation, m)
x6
(Slope Gradient, °)
x7
(Slope Orientation, °)
x8
(Geologic Lithology)
x9
( V F C ,   % )
x10
(Road Density, km2)
Y
(Evaluation Results)
17.57100.987369248.542.540.60.825.110.42
789246200.987246163.337.570.20.564.690.24
238818.64500.987378249.435.750.30.8312.510.13
Table 8. Road risk classification based on forecasting results.
Forecast Result (Y)Road Risk ClassificationPolyline ColorsPredicted Number of Damaged RoadsThe Actual Number of Damaged Roads
Y < 0.2Extremely low-risk sectionGreen200
0.2 ≤ Y < 0.4Lower-risk sectionBlue130
0.4 ≤ Y < 0.6Medium-risk sectionYellow70
0.6 ≤ Y < 0.8Higher-risk sectionOrange110
Y > 0.8Extremely high-risk sectionRed86
Disclaimer/Publisher’s Note: The statements, opinions and data contained in all publications are solely those of the individual author(s) and contributor(s) and not of MDPI and/or the editor(s). MDPI and/or the editor(s) disclaim responsibility for any injury to people or property resulting from any ideas, methods, instructions or products referred to in the content.