

Color Authenticity for the Sustainable Development of Historical Areas: A Case Study of Shiquan


Abstract
1. Introduction
1.1. Problems Existing in Historical Areas
1.2. Color Authenticity of Historical Areas
1.3. Quantitative Methods for Exploring True Colors
2. Introduction
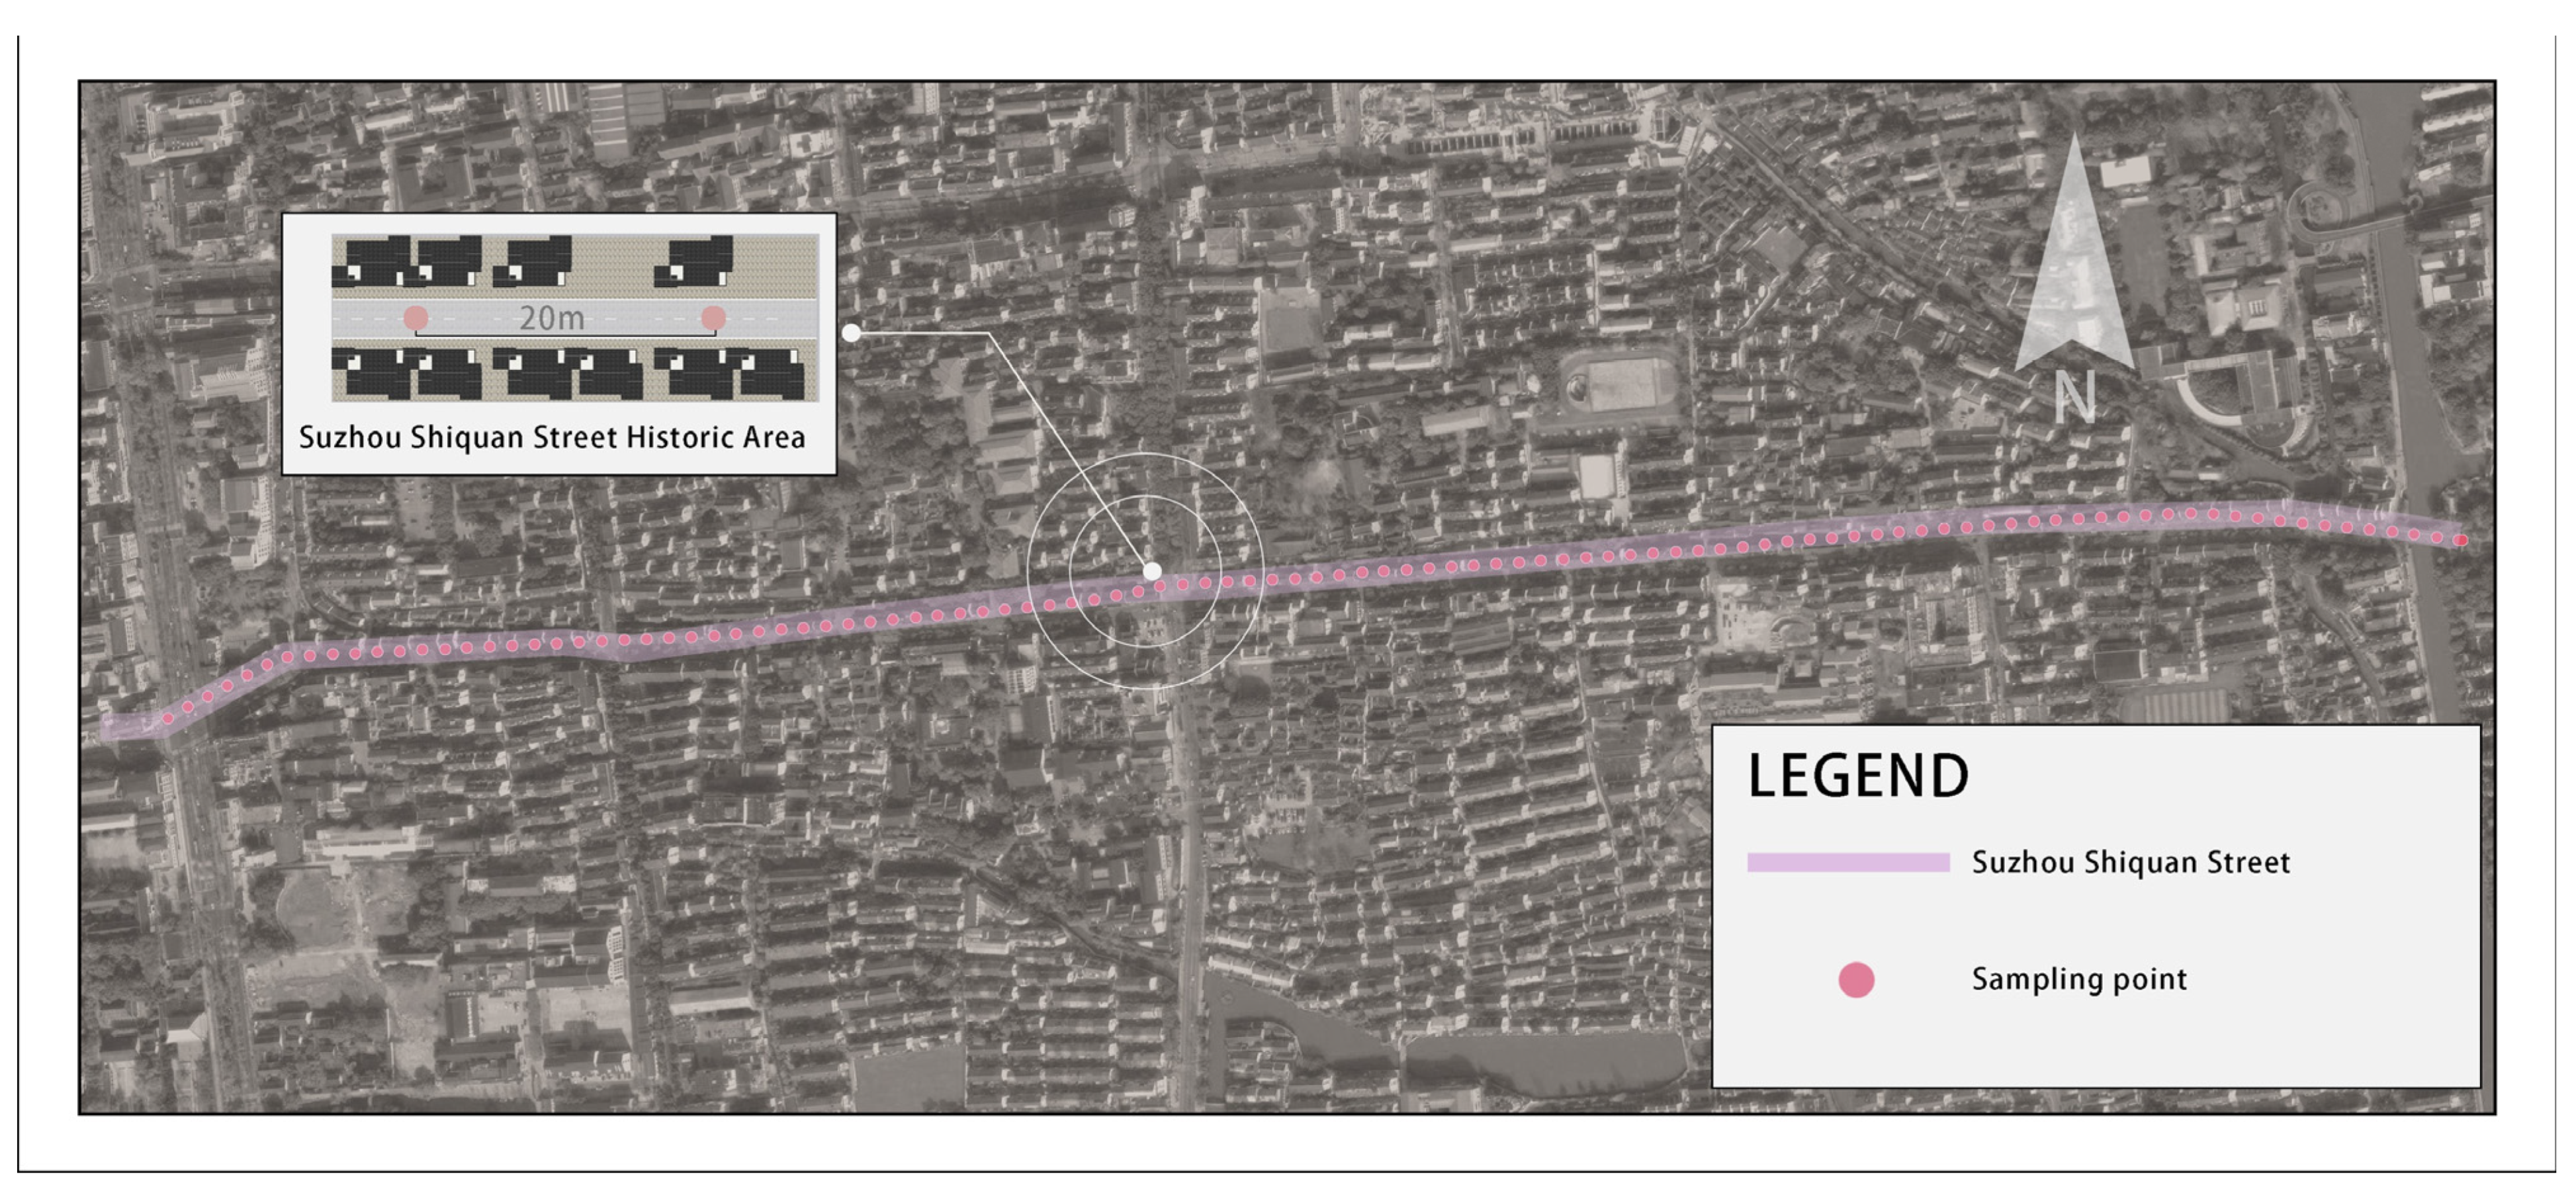
2.1. Study Area
2.2. Research Methods
2.2.1. Overview of the Overall Research Process
2.2.2. Street-View Photo Sample Acquisition
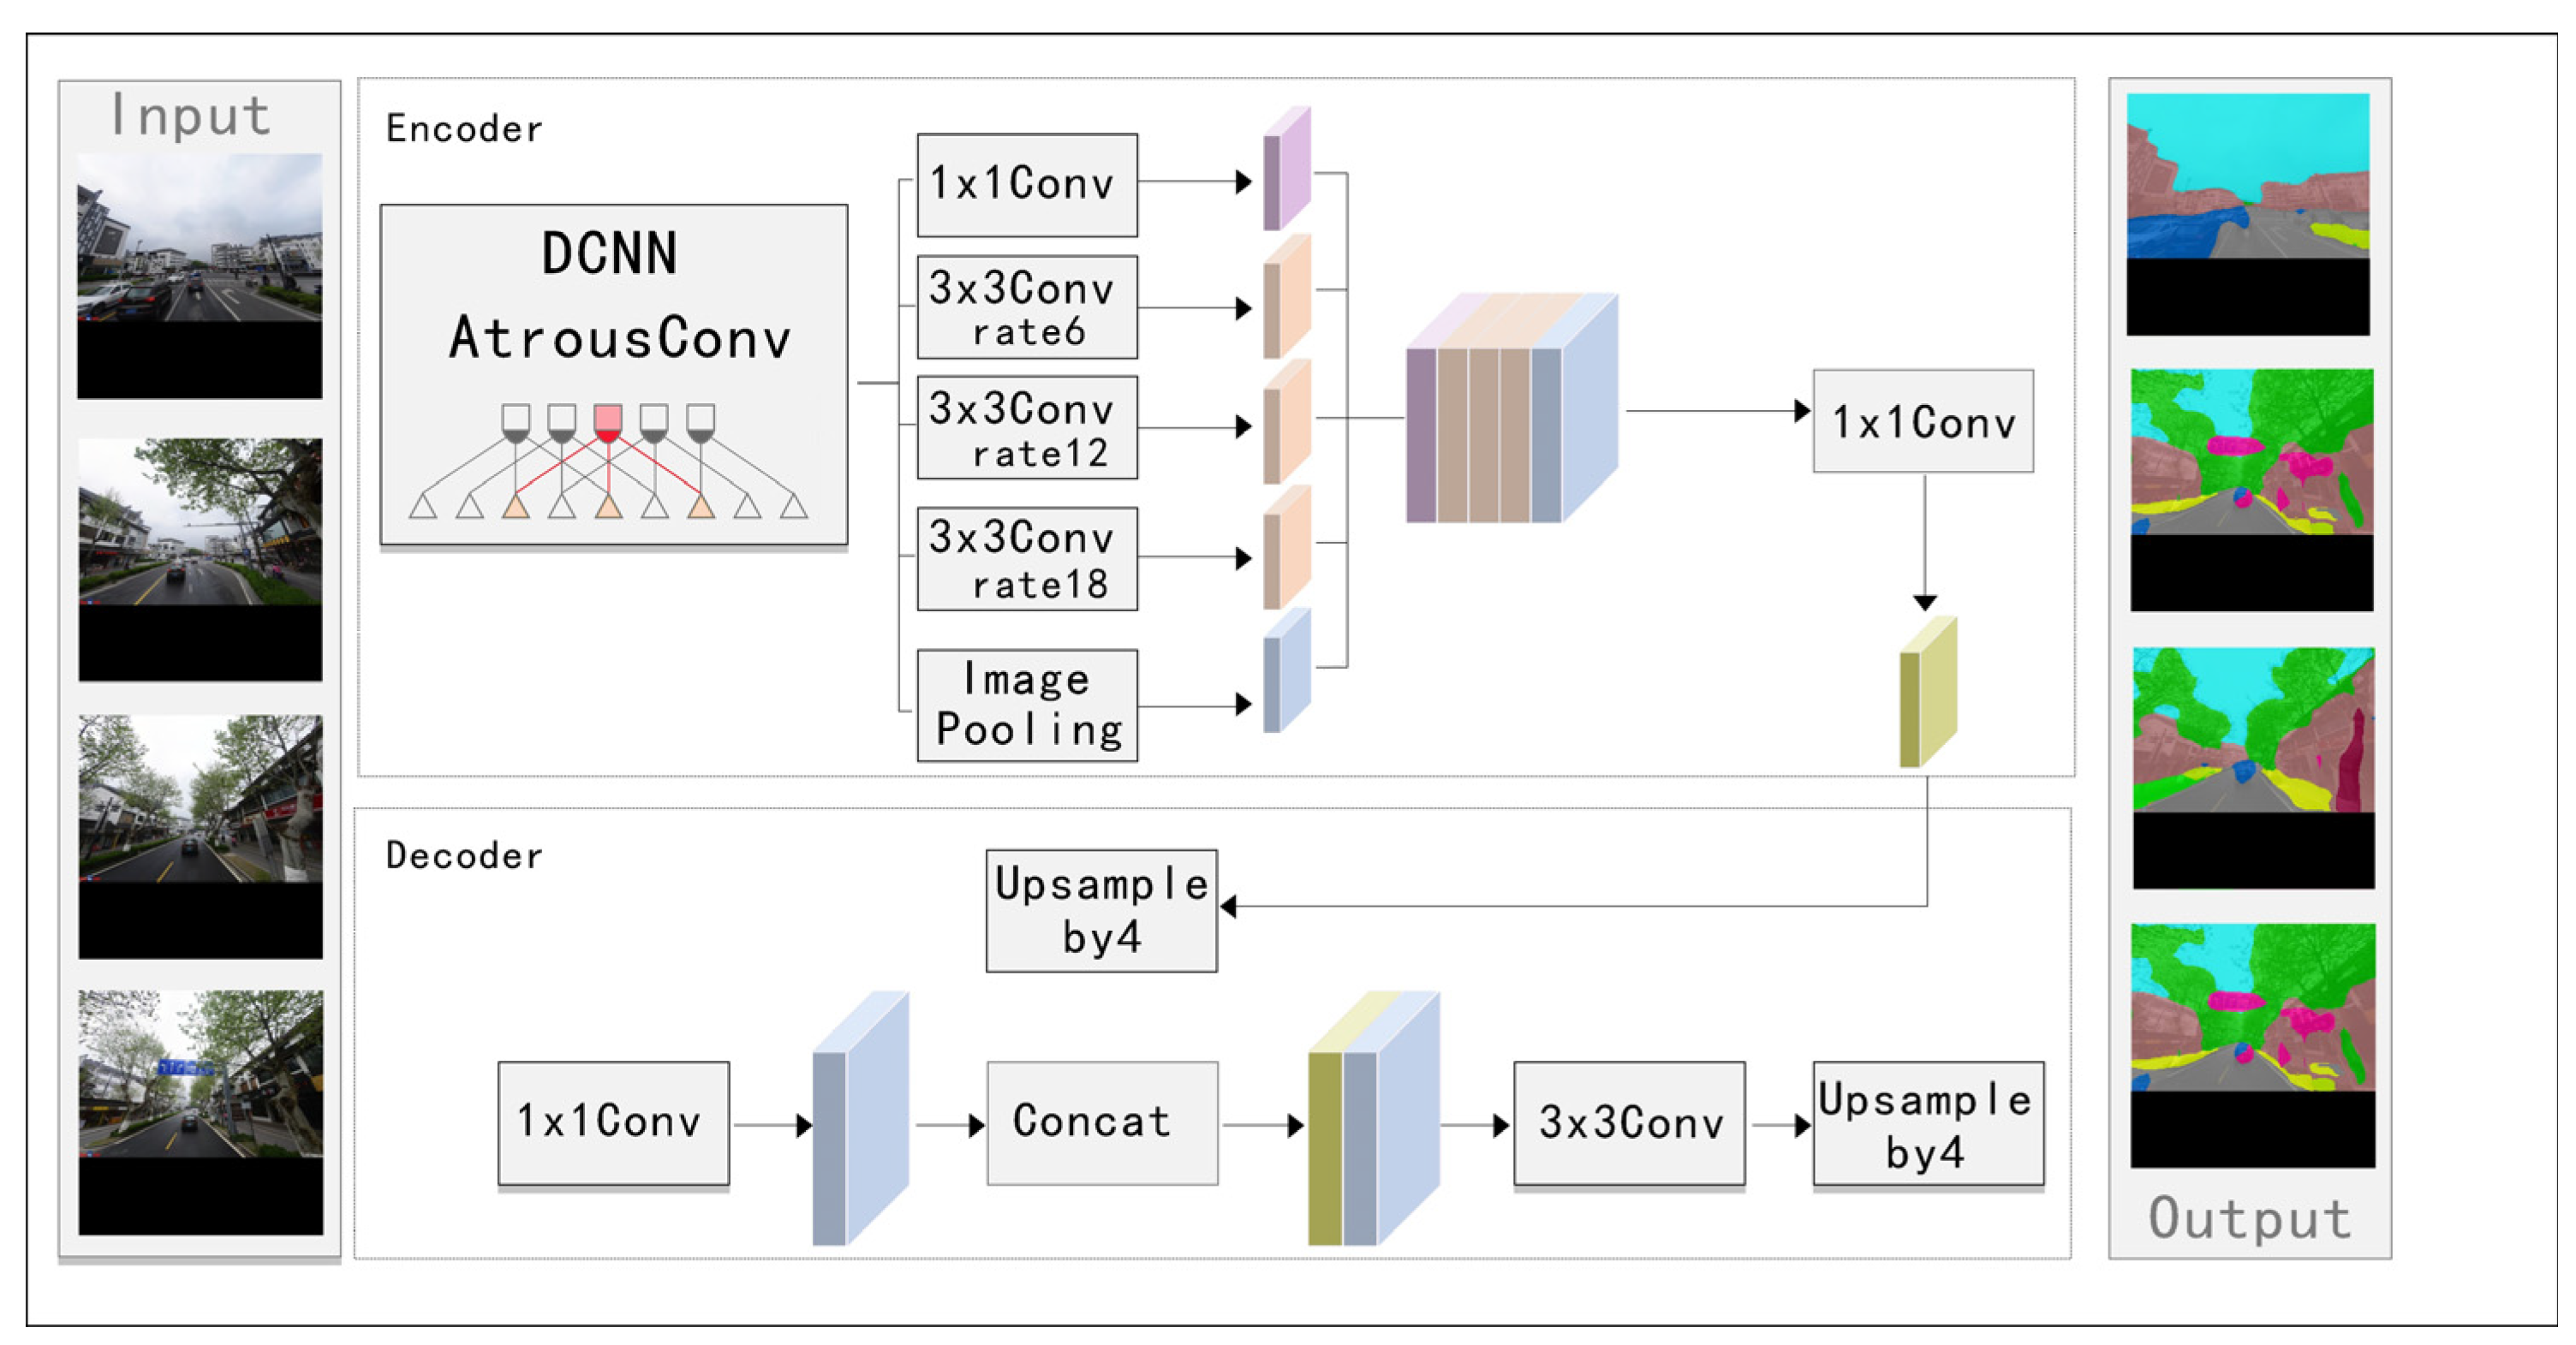
2.2.3. Street-View Photo Sample Processing
2.2.4. Block Color Model Generation
3. Results
3.1. Visualized Analysis of Environmental Colors in Street Block
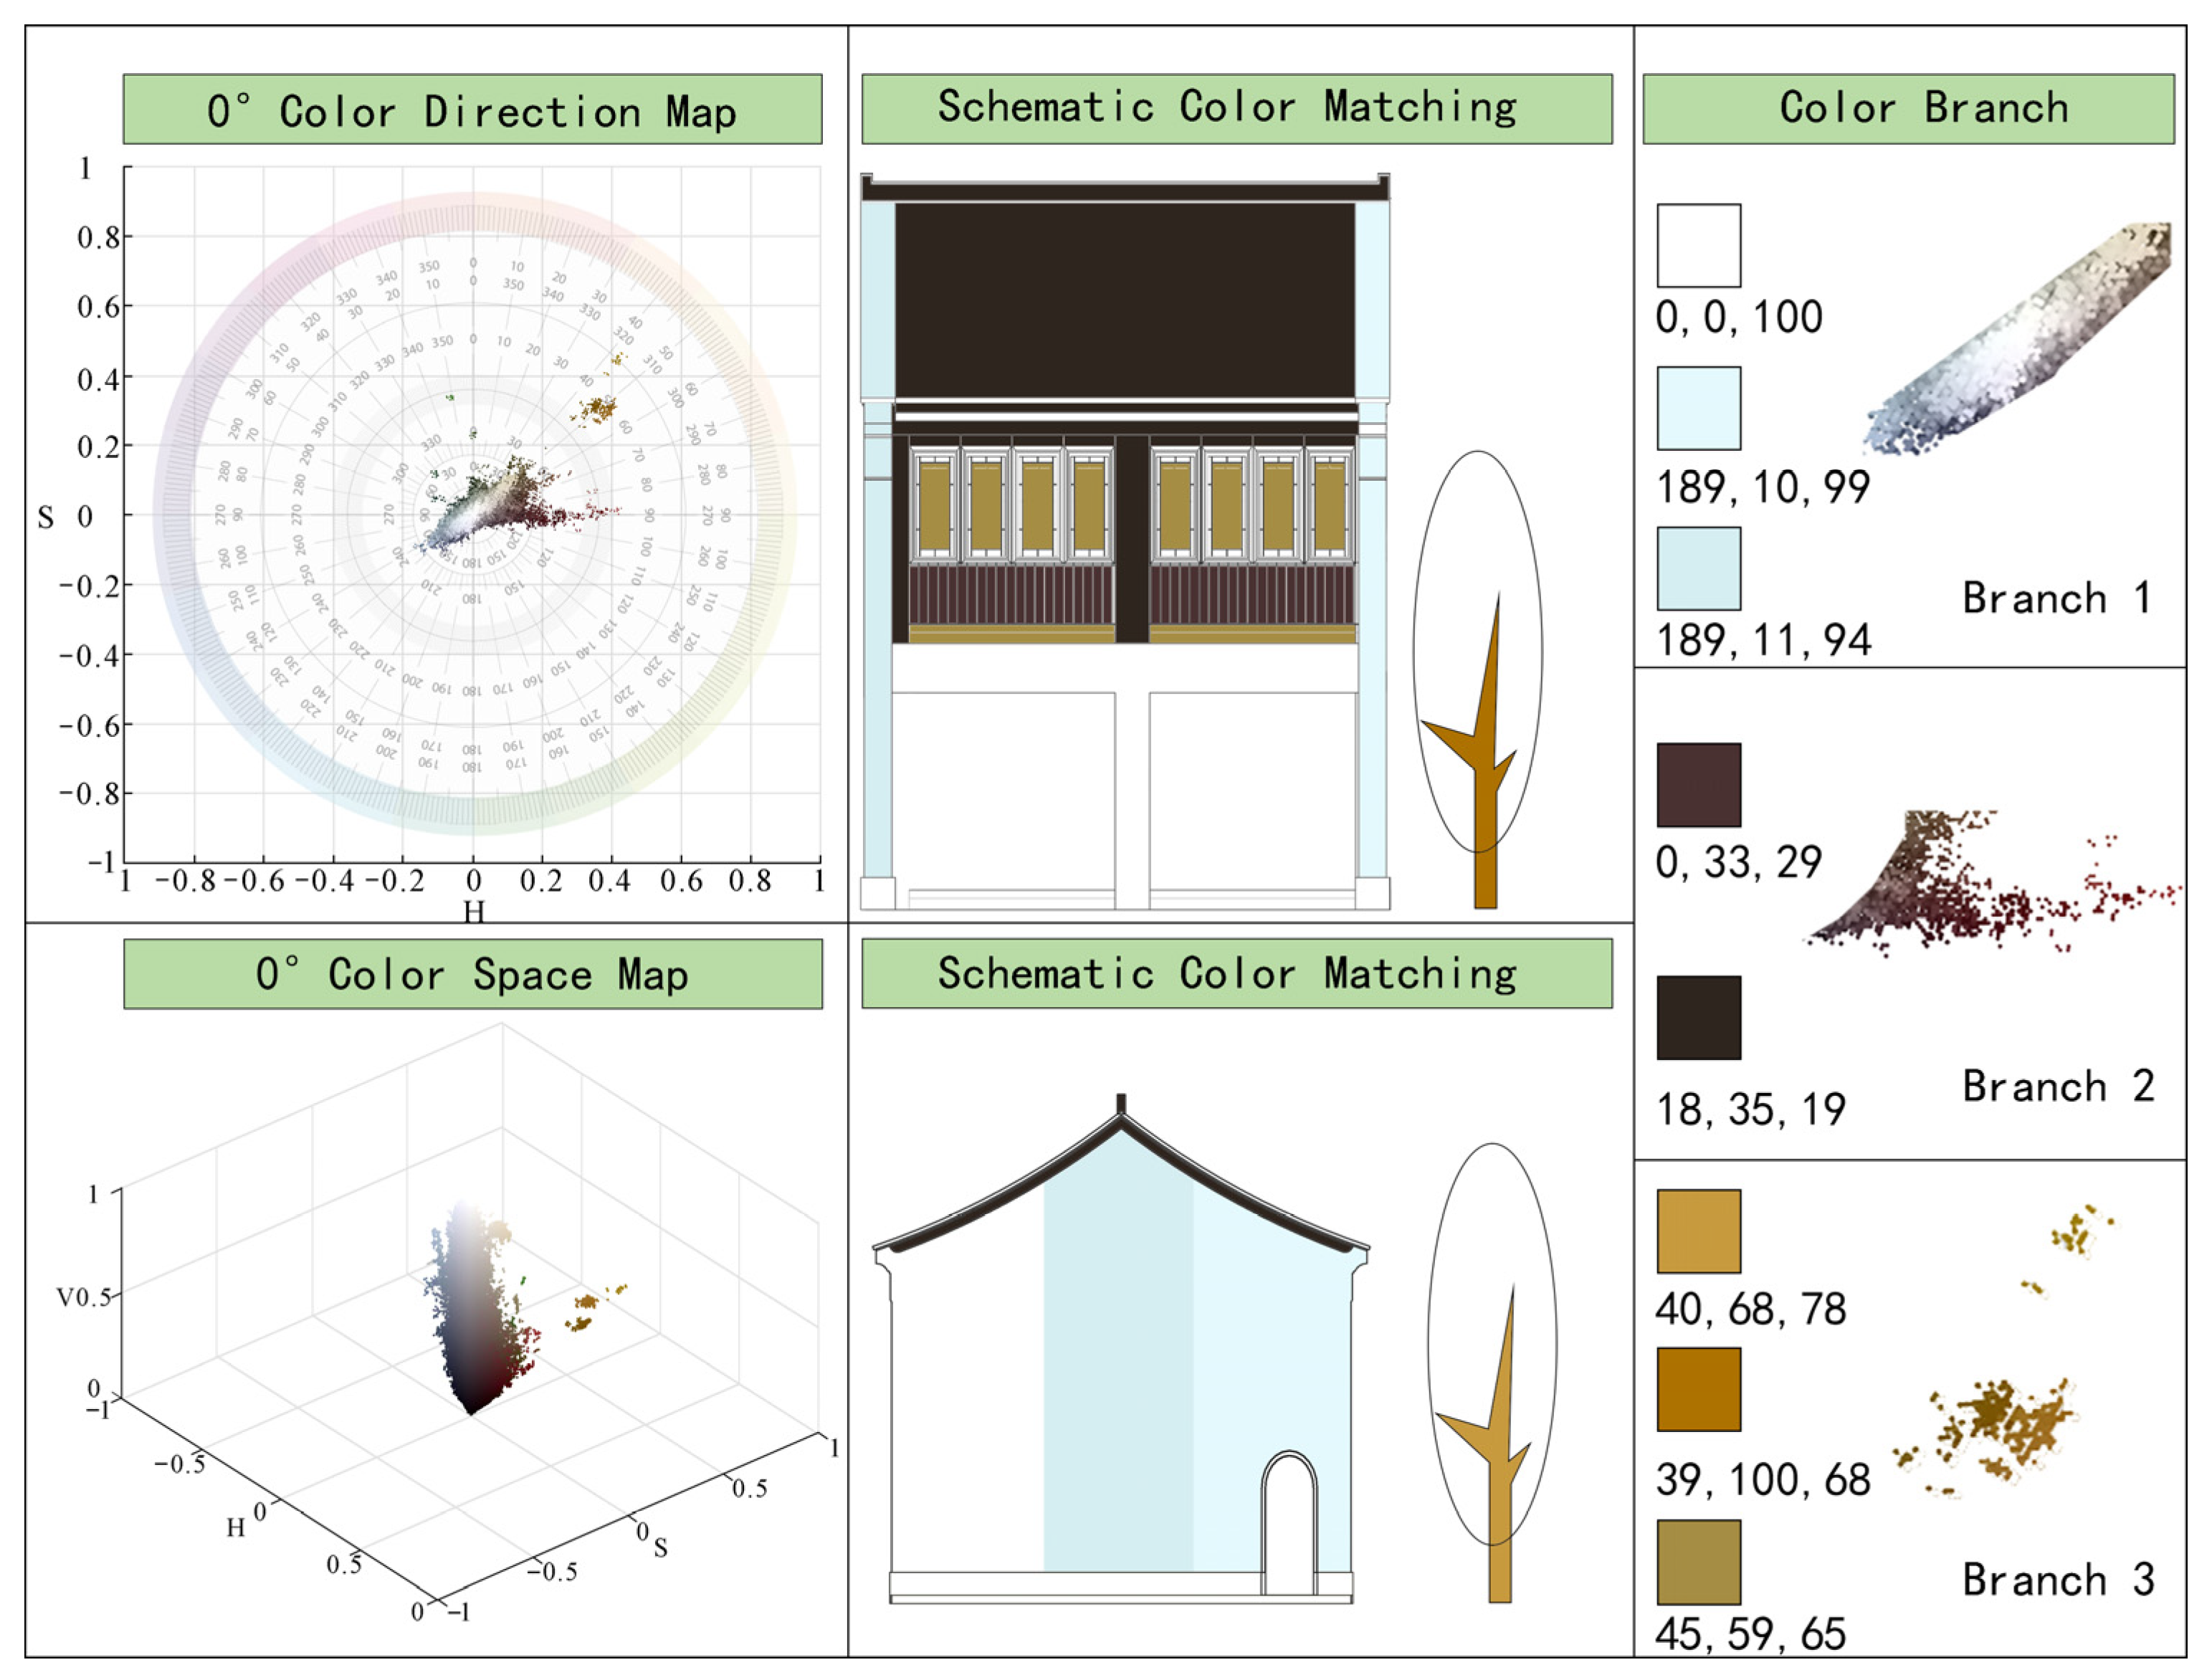
3.1.1. Visualized Analysis of Color from View Angle 0°
3.1.2. Visualized Analysis of Colors at the Perspectives of 90° and 270°
3.2. Visualized Analysis of Color Point Spectra in Shiquan Street
3.3. Visualized Analysis of Node Clustering Color in Suzhou Shiquan Street
4. Discussion on the Application of Traditional Chinese Colors in Suzhou Historical Block
- (1)
- Colors of building facades
- (2)
- Colors of the door header
- (3)
- Colors of the environmental atmosphere
5. Conclusions
- (1)
- Adhering to and carrying over traditional color
- (2)
- Expanding and innovating color combinations
- (3)
- Establishing and planning color system
- (4)
- Innovation of this article
- (5)
- Limitations of this study
Author Contributions
Funding
Informed Consent Statement
Data Availability Statement
Conflicts of Interest
References
- Zhu, Y.; González Martínez, P. Heritage, values and gentrification: The redevelopment of historic areas in China. Int. J. Herit. Stud. 2022, 28, 476–494. [Google Scholar] [CrossRef]
- Qian, Z.H.U. Historic district conservation in China: Assessment and prospects. Tradit. Dwell. Settlem. Rev. 2007, 19, 59–76. [Google Scholar]
- Salah Ouf, A.M. Authenticity and the sense of place in urban design. J. Urban Des. 2001, 6, 73–86. [Google Scholar] [CrossRef]
- Wang, F.; Liu, Z.; Shang, S.; Qin, Y.; Wu, B. Vitality continuation or over-commercialization? Spatial structure characteristics of commercialservices and population agglomeration in historic and cultural areas. Tour. Econ. 2019, 25, 1302–1326. [Google Scholar] [CrossRef]
- Tong, B.; Wang, S.; Zhang, Y. Analysis of the Current Situation of Cultural Continuity in the Commercialization of Historical and Cultural Blocks. In Proceedings of the 2022 International Conference on Sport Science, Education and Social Development (SSESD 2022), Kunming, China, 15–17 July 2022; pp. 4–15. [Google Scholar]
- Cheris, R.; Rosetia, A. Conservation and utilization on Sawahlunto ex mining area for cultural landscape. In Proceedings of the IOP Conference Series: Earth and Environmental Science; IOP Publishing: Bristol, UK, 2022; Volume 1041, p. 012049. [Google Scholar]
- Mehanna, W.A.E.H. Urban renewal for traditional commercial streets at the historical centers of cities. Alex. Eng. J. 2019, 58, 1127–1143. [Google Scholar] [CrossRef]
- Furlan, R.; Petruccioli, A.; Jamaleddin, M. The authenticity of place-making: Space and character of the regenerated historicdistrict in Msheireb, Downtown Doha (State of Qatar). Archnet-IJAR Int. J. Archit. Res. 2019, 13, 151–168. [Google Scholar] [CrossRef]
- Abastante, F.; Lami, I.M.; Mecca, B. How to revitalise a historic district: A stakeholders-oriented assessment framework of adaptive reuse. In Values and Functions for Future Cities; Springer: Berlin, Germany, 2020; pp. 3–20. [Google Scholar]
- Yao, Y. Research on Planning Environment of Historical Color Surrounding the Imperial Palace. Master’s Thesis, Politecnico di Milano, Milano, Italy, 2014. [Google Scholar]
- Al-hagla, K.S. Sustainable urban development in historical areas using the tourist trail approach: A case study of the Cultural Heritage and Urban Development (CHUD) project in Saida, Lebanon. Cities 2010, 27, 234–248. [Google Scholar] [CrossRef]
- Wang, S. Application of computer-aided CAD in urban planning heritage protection. Soft Comput. 2023, 1–10. [Google Scholar] [CrossRef]
- Hong, X.; Ji, X.; Wu, Z. Architectural colour planning strategy and planning implementation evaluation of historical and cultural cities based on different urban zones in Xuzhou (China). Color Res. Appl. 2022, 47, 424–453. [Google Scholar] [CrossRef]
- Teng, Y.; Yang, S.; Huang, Y.; Barker, N. Research on space optimization of historic blocks on Jiangnan from the perspective of place construction. Appl. Math. Nonlinear Sci. 2021, 6, 201–210. [Google Scholar]
- Li, Z.; Sun, X.; Zhao, S.; Zuo, H. Integrating eye-movement analysis and the semantic differential method to analyze the visual effect of a traditional commercial block in Hefei, China. Front. Archit. Res. 2021, 10, 317–331. [Google Scholar] [CrossRef]
- Leng, H.; Shi, T.; Zhao, J. Study on Authenticity Protection and Restoration of Residential Historic District. Appl. Mech. Mater. 2013, 357, 1886–1889. [Google Scholar] [CrossRef]
- Li, H.Y.; Wang, F. Cultural Identity and Continuity-Case Study of Authentic Conservation of Xi’an Bei Yuan Men Historic District. Appl. Mech. Mater. 2013, 357, 1840–1846. [Google Scholar] [CrossRef]
- Santopuoli, N.; Pecoraro, I. Historic Centers Restoration and Ancient Buildings Energetic Efficiency Improvement. J. Build. Constr. Plan. Res. 2014, 2, 209–215. [Google Scholar] [CrossRef][Green Version]
- Hong, L.; Pang, S.; Geng, M.; Wang, S. The GIS study on the spatial structure and visual perception of historical districts in winter cities. Arab. J. Geosci. 2021, 14, 1142. [Google Scholar]
- Grimmer, A.E. The Secretary of the Interior’s Standards for the Treatment of Historic Properties: With Guidelines for Preserving, Rehabilitating, Restoring & Reconstructing Historic Buildings; Government Printing Office: Washington, DC, USA, 2017.
- Diaz-Parra, I.; Jover, J. Overtourism, place alienation and the right to the city: Insights from the historic centre of Seville, Spain. J. Sustain. Tour. 2021, 29, 158–175. [Google Scholar] [CrossRef]
- Li, K.R.; Yang, Y.Q.; Zheng, Z.Q. Research on color harmony of building façades. Color Res. Appl. 2020, 45, 105–119. [Google Scholar] [CrossRef]
- Gouaich, Y.; Mebrouki, A.; Ghariri, R.; Mebarki, A.; Belabbas, A.; Manav, B.; Serra, J.; Llopis, J.; Torres, A. A Novel Method for Assessing the Chromatic Integration of Architecture in the Ksourian Landscape of M’zab Valley, Algeria. Color Res. Appl. 2018, 43, 760–778. [Google Scholar] [CrossRef]
- Yadav, N.K.; Saraswat, M. A Novel Fuzzy Clustering Based Method for Image Segmentation in RGB-D Images. Eng. Appl. Artif. Intell. 2022, 111, 104709. [Google Scholar] [CrossRef]
- Jégou, L. Expanding the Sémiologie Graphique for contemporary cartography, some ideas from visual semiotics, art history and design. Cartogr. Geogr. Inf. Sci. 2019, 46, 182–188. [Google Scholar] [CrossRef]
- Zhong, T.; Ye, C.; Wang, Z.; Tang, G.; Zhang, W.; Ye, Y. Cityscale mapping of urban façade color usingstreet-view imagery. Remote Sens. 2021, 13, 1591. [Google Scholar] [CrossRef]
- Fu, Q.; Wang, X.; Huang, Y. Extraction and Analysis of Architectural Color Gene in the Main Urban Areas of Changsha City. J. Chang. Univ. 2021, 35, 30–37. [Google Scholar]
- Miao, M.-R.; Xiong, J.-H.; Feng, L.-H. Research on the application of color in paper packaging based on regional characteristics of multi-source data and K-means clustering. China Pap. 2023, 42, 95–103. [Google Scholar]
- Wu, K.; Yang, N.-H. Analysis and application of color characteristics of Mawangdui silk painting based on K-means clustering. Packag. Eng. 2023, 44, 305–314. [Google Scholar]
- Chen, T.-Y.; Xiao, W.-Q. Product color design method based on PCCS color system and gray correlation analysis. Packag. Eng. 2023, 1–12. Available online: https://kns.cnki.net/kcms/detail/50.1094.TB.20230522.1635.002.html (accessed on 1 February 2024).
- Hasler, D.; Suesstrunk, S.E. Measuring colorfulness in natural images. In Human Vision and Electronic Imaging VIII; International Society for Optics and Photonics: Houston, TX, USA, 2003; Volume 5007, pp. 87–95. [Google Scholar]
- Jiang, H.-B.; Lu, S.; Xiao, Y. Method of Urban Color Evaluation for Historic and Cultural Areas in Shanghai Based on Street View Technology. Urban Plan. J. 2022, 111–118. [Google Scholar]
- Wu, Z.-Y.; Zhang, Y. Research on Urban Color Quantification Method Based on Large-Scale Streetscape Images; Urban Planning Society of China, Hangzhou Municipal People’s Government: Hangzhou, China, 2018; Volume 8.
- Hu, W. Analysis on the characteristics of regional culture integration into decoration design based on visual communication design: A case study of Chengdu subway station. Urban Rail Transit Res. 2023, 26, 301–302. [Google Scholar]
- Morton, W.B. The Secretary of the Interior’s Standards for Rehabilitation and Illustrated Guidelines for Rehabilitating Historic Buildings; National Park Service: Washington, DC, USA, 1992.
- Guthrie, S. Main Street Historic District, Van Buren, Arkansas: Using HCRS Grant-in-Aid Funds for Storefront Rehabilitation/Restoration within a Districtwide Plan; US Department of the Interior, Heritage Conservation and Recreation Service, Technical Preservation Services: Washington, DC, USA, 1980.
- Bradecki, T.; Uherek-Bradecka, B. Preservation, Reconstruction or Conversion-Contemporary Challenge for Historic Urban Areas and Historic Buildings. In Advanced Engineering Forum; Trans Tech Publications Ltd.: Wollerau, Switzerland, 2014; Volume 12, pp. 115–121. [Google Scholar]
- Santopuoli, N.; Pecoraro, I. Historic Centers Restoration and Ancient Buildings Energetic Efficiency Improvement. Adv. Asp. Eng. Res. 2021, 8, 82–90. [Google Scholar] [CrossRef]
- Garcia-Codoñer, A.; Verdu, J.L.; Barchino, A.T.; Guillen, R.V.; Lluch, J.S. Colour as a structural variable of historical urban form. Color Res. Appl. 2009, 34, 253–265. [Google Scholar] [CrossRef]
- Chahardowli, M.; Sajadzadeh, H. A strategic development model for regeneration of urban historical cores: A case study of the historical fabric of Hamedan City. Land Use Policy 2022, 114, 105993. [Google Scholar] [CrossRef]
- Koç, C.; Kejanli, D.T. Evaluation of urban preservation in historical environment by visual perception: Midyat and surici cases. In Archdesign’19/vi. International Architectural Design Conference Proceedings; Dakam Yayınları: Beyoglu, Turkiye, 2019; p. 309. [Google Scholar]
- Doleżyńska-Sewerniak, E. Color of the façades of historic buildings from the turn of 19th and 20th centuries in northeast Poland. Color Res. Appl. 2019, 44, 139–149. [Google Scholar] [CrossRef]
- Zhao, P.; Liao, W.; Xue, H.; Lu, X. Intelligent design method for beam and slab of shear wall structure based on deep learning. J. Build. Eng. 2022, 57, 104838. [Google Scholar] [CrossRef]
- Metwally, E. Achieving the visual perception and gestalt psychology in sultan Hassan mosque building. Open J. Appl. Sci. 2021, 11, 21–40. [Google Scholar] [CrossRef]
- Sultana, R.; Rashedi, A.; Khanam, T.; Jeong, B.; Hosseinzadeh-Bandbafha, H.; Hussain, M. Life cycle environmental sustainability and energy assessment of timber wall construction: A comprehensive overview. Sustainability 2022, 14, 4161. [Google Scholar] [CrossRef]
- Cabral, M.R.; Blanchet, P. A state of the art of the overall energy efficiency of wood buildings—An overview and future possibilities. Materials 2021, 14, 1848. [Google Scholar] [CrossRef]
- Du, Y.; He, Y. Environment· Feature· Culture—Inheritance and Innovation of Traditional Regional Architecture in Jiangnan—Take Suzhou Museum as an Example. Acad. J. Archit. Geotech. Eng. 2023, 5, 20–26. [Google Scholar]
- Gu, X. The Analysis of Architecture Design Elements of Jiangnan Traditional Residence Based on AHP. In IOP Conference Series: Earth and Environmental Science; IOP Publishing: Bristol, UK, 2021; Volume 768, p. 012137. [Google Scholar]
- Xu, H.; Mamat, M.J. Showcasing Tradition, Innovative Design Regional Culture in Chinese Museum Interiors. Migr. Lett. 2023, 20, 1388–1400. [Google Scholar]
- Song, Y.; Liao, C. Research on the Architectural Features and Artistic Elements of Traditional Buildings in Different Regions of Jiangxi, China. Buildings 2023, 13, 1597. [Google Scholar] [CrossRef]
- Bailey, B. The Army in the marketplace: Recruiting an all-volunteer force. J. Am. Hist. 2007, 94, 47–74. [Google Scholar] [CrossRef]
- Li, Y.; Xu, Y. A Study on Landscape VR Design of Special Neighborhood Based on Traditional Culture. Wirel. Commun. Mob. Comput. 2022, 2022, 7596883. [Google Scholar] [CrossRef]
- Chen, S.-H. The application of regional characteristics in packaging design. Sichuan Drama 2018, 70–71. [Google Scholar]
- Zhu, R. Urban Memory and Urban Form: Exploring the Continuity of Urban History and Culture from the Perspectives of Psychology and Sociology. South. Archit. 2006, 5–9. [Google Scholar]
- Wang, J. Innovative application of color elements in visual communication design. Packag. Eng. 2021, 42, 378–381. [Google Scholar]
- Hao, Y.-C.; Chen, F. Research on the application of color aesthetics in building façade design. Build. Sci. 2021, 37, 177. [Google Scholar]
- Liu, Z.-S.; Zhang, X.-L.; Zhang, L.-W. Research on the Progress and Trend of Architectural Color in China from the Perspective of Mapping Knowledge Domain. ZHUANGSHI 2022, 136–138. [Google Scholar]
- Yang, C.-F. The art of architectural painting and its application of color. Archit. J. 1992, 51–53. [Google Scholar]
- Zhang, N.-N. Exploration of urban color planning and management in Hangzhou. Planners 2009, 25, 48–52. [Google Scholar]


Disclaimer/Publisher’s Note: The statements, opinions and data contained in all publications are solely those of the individual author(s) and contributor(s) and not of MDPI and/or the editor(s). MDPI and/or the editor(s) disclaim responsibility for any injury to people or property resulting from any ideas, methods, instructions or products referred to in the content. |
© 2024 by the authors. Licensee MDPI, Basel, Switzerland. This article is an open access article distributed under the terms and conditions of the Creative Commons Attribution (CC BY) license (https://creativecommons.org/licenses/by/4.0/).
Share and Cite
Miao, M.; Feng, L.; Wu, Y.; Zhu, R.; Xu, D. Color Authenticity for the Sustainable Development of Historical Areas: A Case Study of Shiquan. Sustainability 2024, 16, 2417. https://doi.org/10.3390/su16062417
Miao M, Feng L, Wu Y, Zhu R, Xu D. Color Authenticity for the Sustainable Development of Historical Areas: A Case Study of Shiquan. Sustainability. 2024; 16(6):2417. https://doi.org/10.3390/su16062417
Chicago/Turabian StyleMiao, Mingrui, Lyuhang Feng, Yao Wu, Rong Zhu, and Dawei Xu. 2024. "Color Authenticity for the Sustainable Development of Historical Areas: A Case Study of Shiquan" Sustainability 16, no. 6: 2417. https://doi.org/10.3390/su16062417
APA StyleMiao, M., Feng, L., Wu, Y., Zhu, R., & Xu, D. (2024). Color Authenticity for the Sustainable Development of Historical Areas: A Case Study of Shiquan. Sustainability, 16(6), 2417. https://doi.org/10.3390/su16062417