1. Introduction
What determines the length of time it takes a species to go through the Endangered Species Act (ESA) process, from candidacy to proposal as a threatened or endangered species, to actual listing? (Throughout this paper we use the term “species” not in its strict biological sense, but in the categorical sense used by the EPA.) This is an important question, as the time it takes can affect the survival rates and long-term viability and sustainability of a species population. (Once a species is officially listed, it is protected from extinction by the prohibition of the taking, possession, selling, and transportation of the species. Official listing also legally prohibits the destruction of critical habitats. Of course, it is still possible for a species to go extinct even after listing, but it at least becomes less likely to do so.) A range of ideas has been explored previously in the literature, including that, as specified in the ESA, scientific factors matter [
1] that the charismatic/anthropomorphic characteristics of a species matter [
2], and that political influences [
3,
4].
No research of which we are aware, however, has yet looked into the possible effects of media attention. This is an omission of increasingly significant importance. As one paper [
5] points out, the implementation of the ESA has increasingly been influenced by non-agency actors, including interest groups, environmental NGOs, and outside organizations. While ESA decisions are supposed to be scientific, ultimately, it is a political process that private citizens and interest groups influence through political pressure, something greatly facilitated on all sides by media coverage (see, for example, [
6]). Media coverage may have tremendous power to raise concerns about species and biodiversity loss on one side, or about the degradation of private property rights on the other, making it a potentially important consideration in the ESA listing process. Citizens care about sustainability, and their views of it are likely affected by media attention.
Whether or not the media directly affects public policy and political sentiment (or simply mirrors it), has been debated [
7,
8]. This research finds, in the context of the ESA, that the media does appear to have a significant effect on final policymaking decisions, with impacts on endangered species protection and ultimate long-term survival and viability.
Timing is important in ESA decision making. There is huge variation in the time from initial candidacy or proposal to listing, with some decisions being made quickly and others taking decades. Species with small or rapidly decreasing populations face increased risk of extinction as a result of delays in listing and receiving associated protections [
9], and it is possible that species have slipped past the point of possible recovery while waiting to be listed [
10]. At the same time, longer decision-making processes can be characterized as more thorough, and possibly involve greater stakeholder input. This paper does not attempt a benefit–cost analysis of the timing of species listing decisions at the EPA (we leave that to others, including [
11,
12]). This paper’s focus is instead an inquiry into whether media attention in particular appears to affect the important time-to-listing decision itself, as well as ultimate species sustainability.
Our hypothesis is that the level of media attention received by a candidate species will affect the time it takes for that species to move through the listing process. It should be noted, however, that like many environmental issues, a species’ listing can be controversial and media coverage can motivate people on opposing sides, perhaps intensifying the battle but ultimately having no impact on its duration or outcome. A priori, media attention could conceivably speed or slow the listing decision. This matters because, as others have pointed out [
5,
11,
13,
14], resources are scarce at the EPA, and listing decisions, when they occur, involve opportunity costs for other agency efforts, as well as effects on long-term species viability. (Not to mention the real dollars to promote species recovery. One estimate [
5] is that between 1989 and 2014, state and federal agencies spent at least USD 30 billion on species recovery efforts. That figure does not include the additional species protection funds spent by private and nonprofit groups.)
2. Background
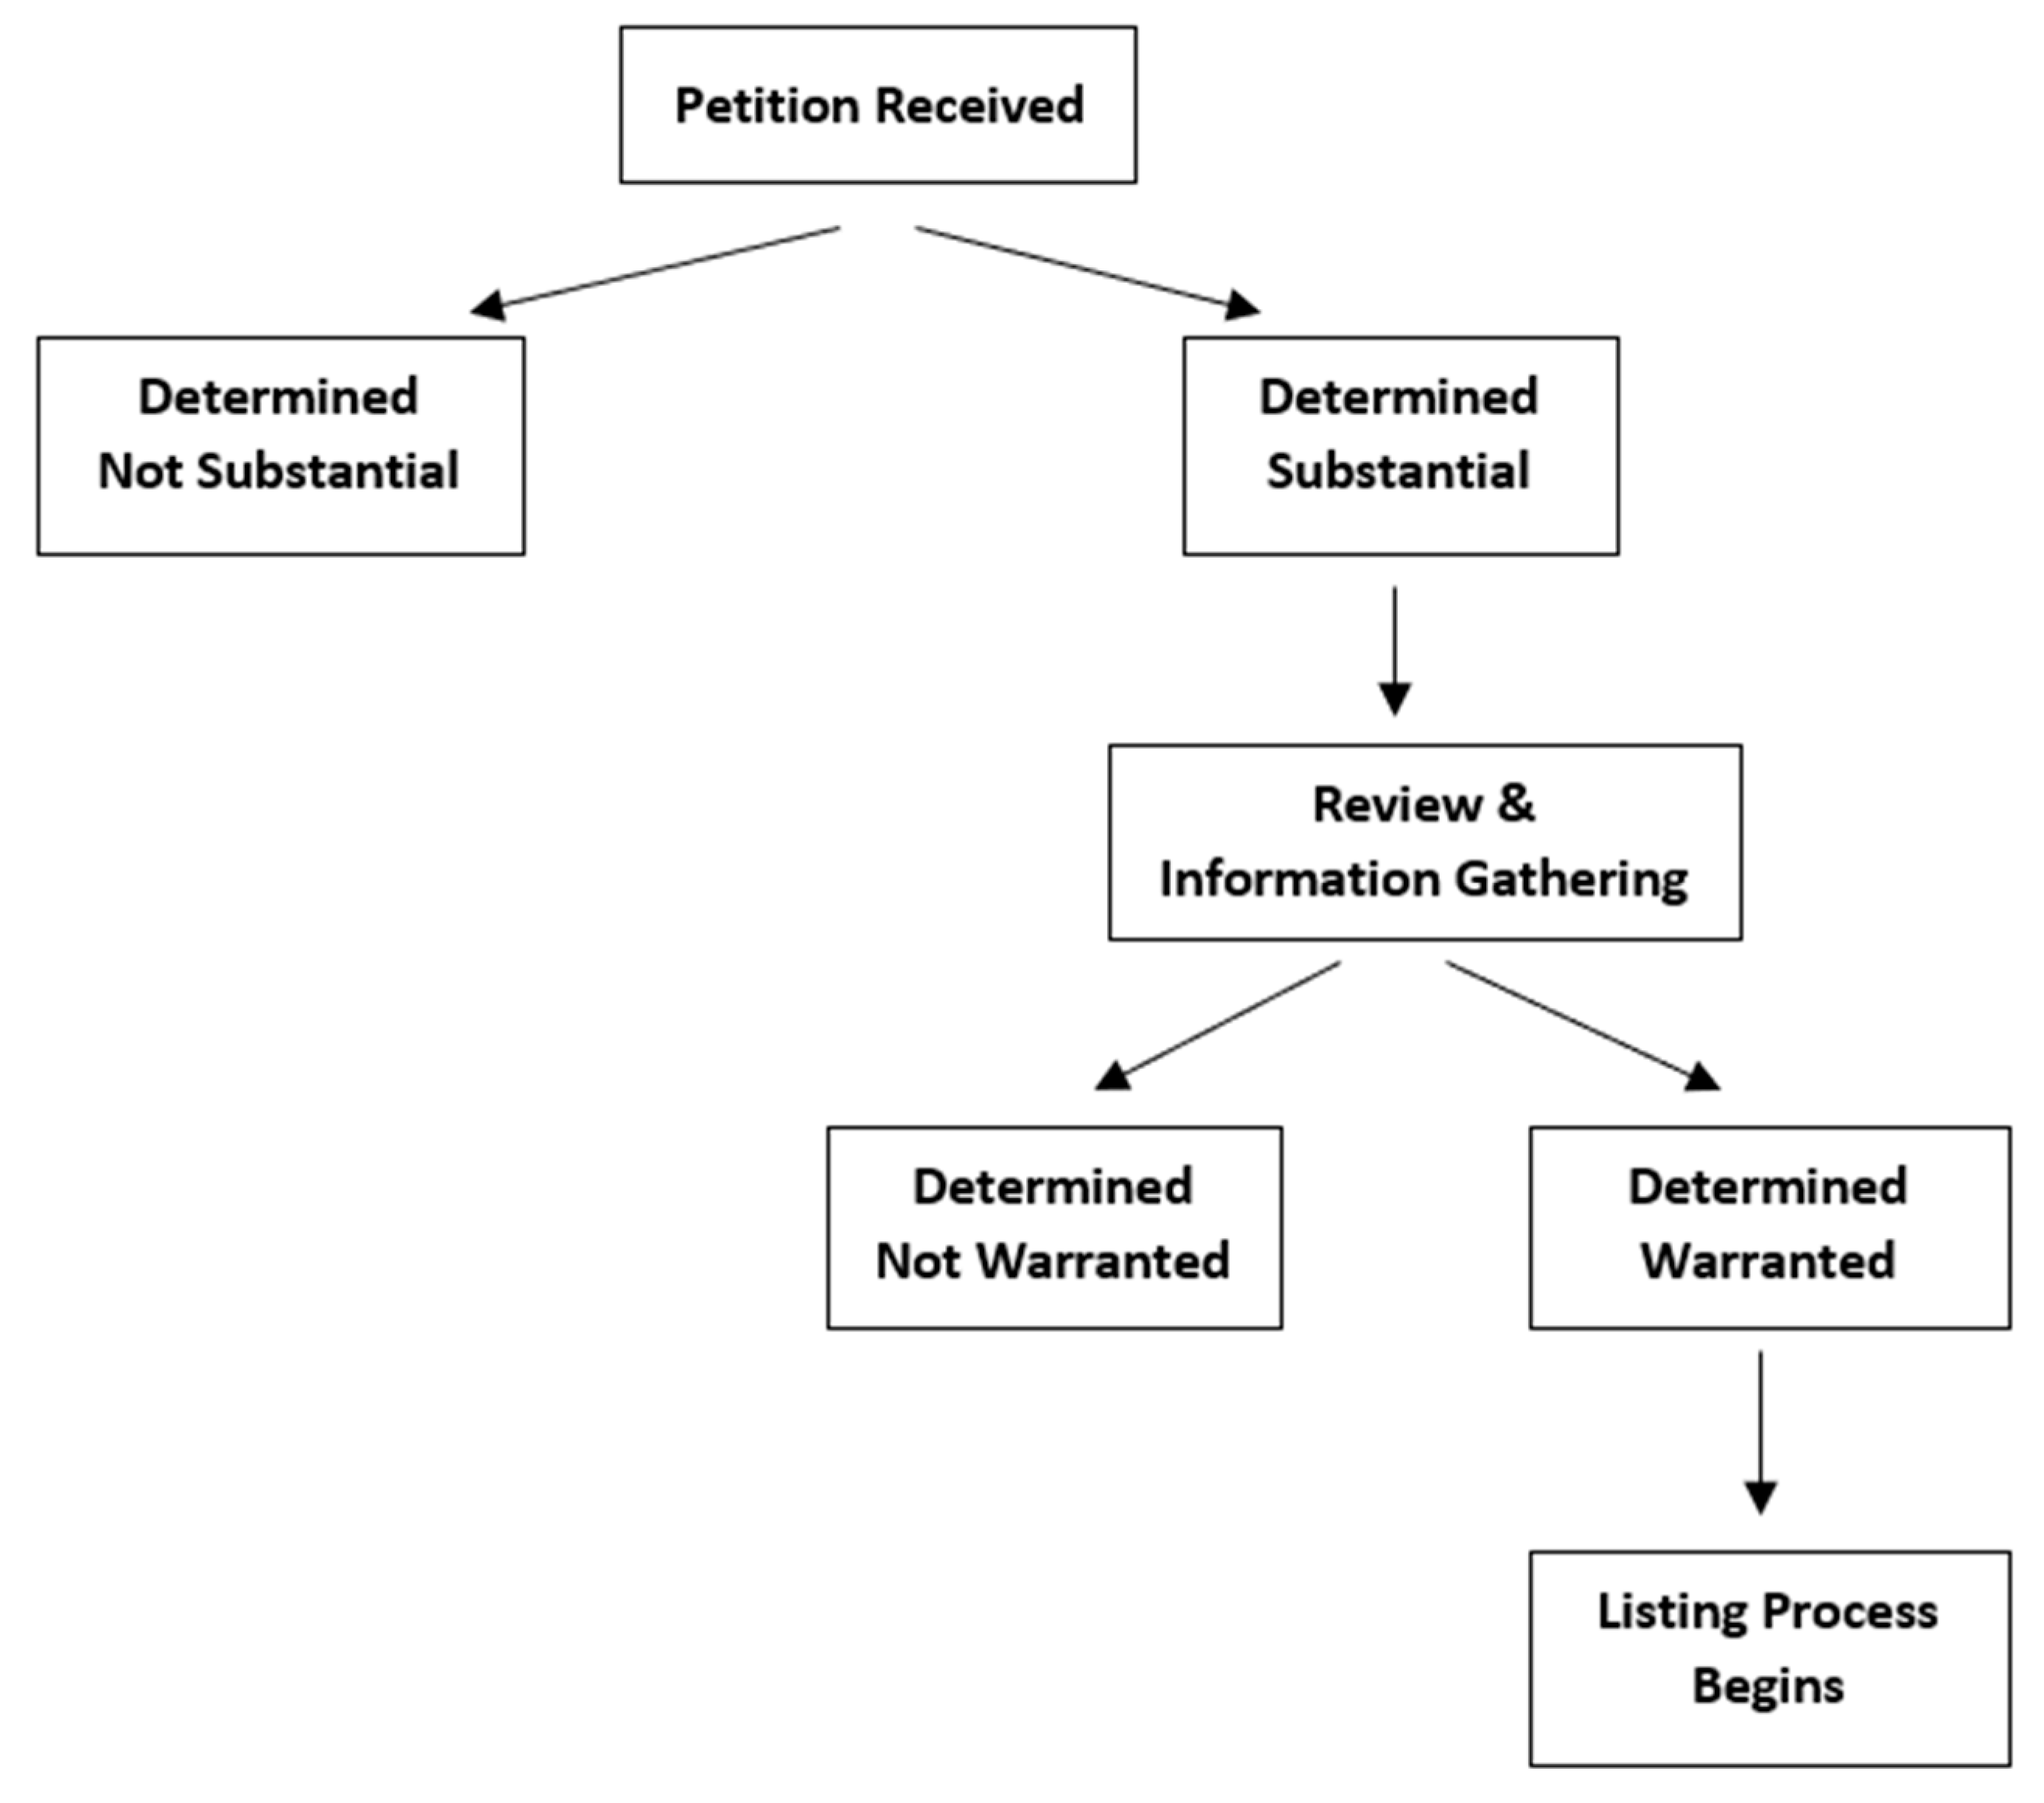
Candidate species enter the listing process in one of two ways: either directly as a candidate from the FWS, or by a petition from an individual or organization. Once the procedure begins, all candidate species are investigated and scientific evidence is reviewed. In the early stages, a candidate listing can be found to be “not warranted”, and if this is the case, the listing process quickly comes to an end (
Scheme 1). However, if the candidate species is found to be “warranted”, then a longer, more formal proposal process begins, including a solicitation of comments from the public, the gathering of more scientific evidence, and expert guidance sought from outside specialists. It is this second, “warranted”, group that is the focus of this study (Details on the initial listing process can be found here:
https://www.fws.gov/media/petition-process).
The 1973 Endangered Species Act (ESA) (16 U.S.C. §1531 et seq. (1973)) defines two categories of extinction risk: endangered and threatened. Endangered is when a species faces the possibility of extinction throughout all, or a sizable portion, of its habitat. Threatened is when a species appears likely to become endangered, throughout all or a sizable portion of its habitat, in the near future. The ESA is the primary law at the federal level to both protect and aid the recovery of plant, marine, and animal species in the U.S. Section 4 of the law lays out the threatened or endangered species designation, while Section 7 lays out the authority of federal agencies to aid in the conservation of such listed species. The ESA is implemented by the U.S. Fish and Wildlife Service (FWS) for freshwater fish and other species, and by the National Marine Fisheries Service (NMFS) for marine species. In this paper, we concentrate on animal species protected through the activities of the FWS.
While guidelines exist in setting time limits on certain parts of the overall listing process (i.e., 90 days for public comment, 45 days to request a public hearing, final rules “within a year” of warranted status), in practice, with extensions and delays, some listing processes have taken decades to complete. There is, therefore, regardless of predetermined guidelines on any part of the process, variability in the overall time-to-listing decision. This study seeks a greater understanding of what sorts of variables appear to affect the overall time-to-listing decisions by the FWS.
As discussed by several authors [
15,
16,
17,
18], the listing process is inherently political and related to perceived benefits and costs of species listings. Parties in favor of a species being listed might tend to be less geographically concentrated because the benefits of species preservation are broadly shared and would generally prefer a faster listing to enhance the probability of long-term preservation. Parties opposing a listing, by contrast, may be local landowners seeking to delay or prevent the development or land-use restrictions that would likely accompany a listing and would work for a slower listing process, with the hope of ultimate defeat or rejection. The FWS is overseen by committees in both the House and Senate, and interested parties are able to appeal to their representatives on these committees to exert influence over processes and decisions. Of course, this political process does not exist in a vacuum. Media coverage is likely to play a role in this process, as it has the power to attract attention nationally from interested environmentalists or even locally from concerned landowners and residents interested regional economic development.
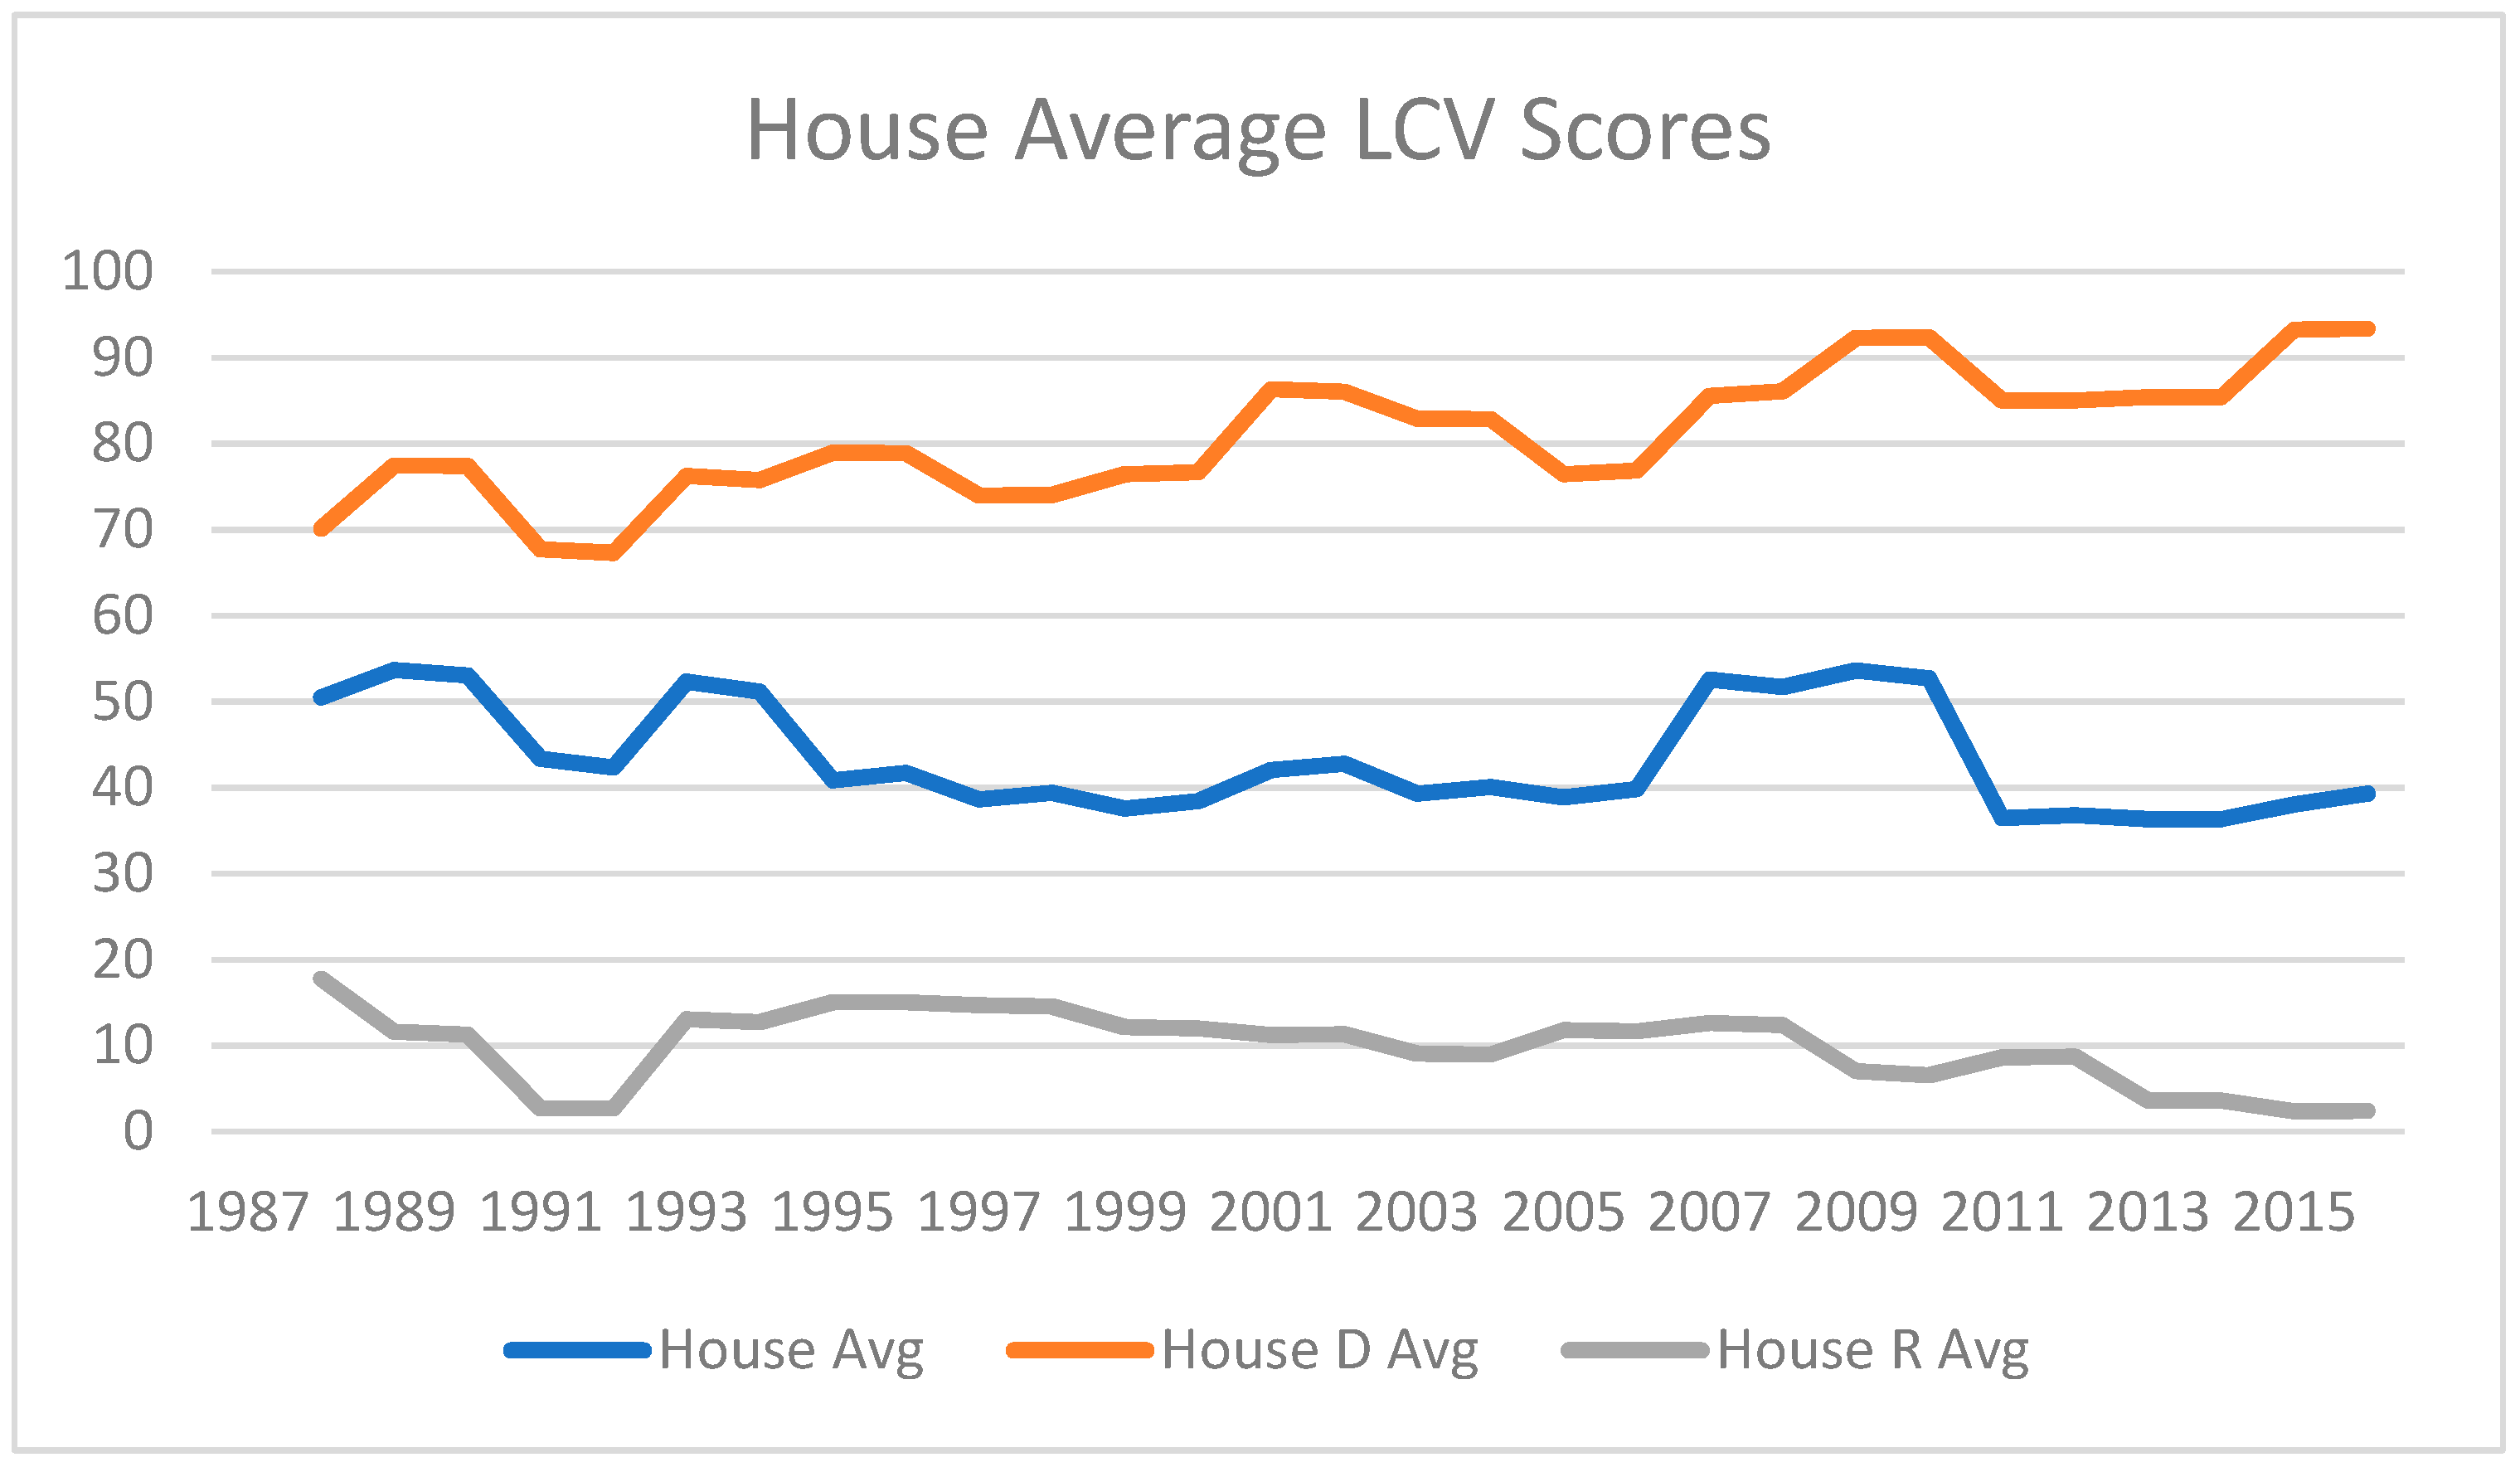
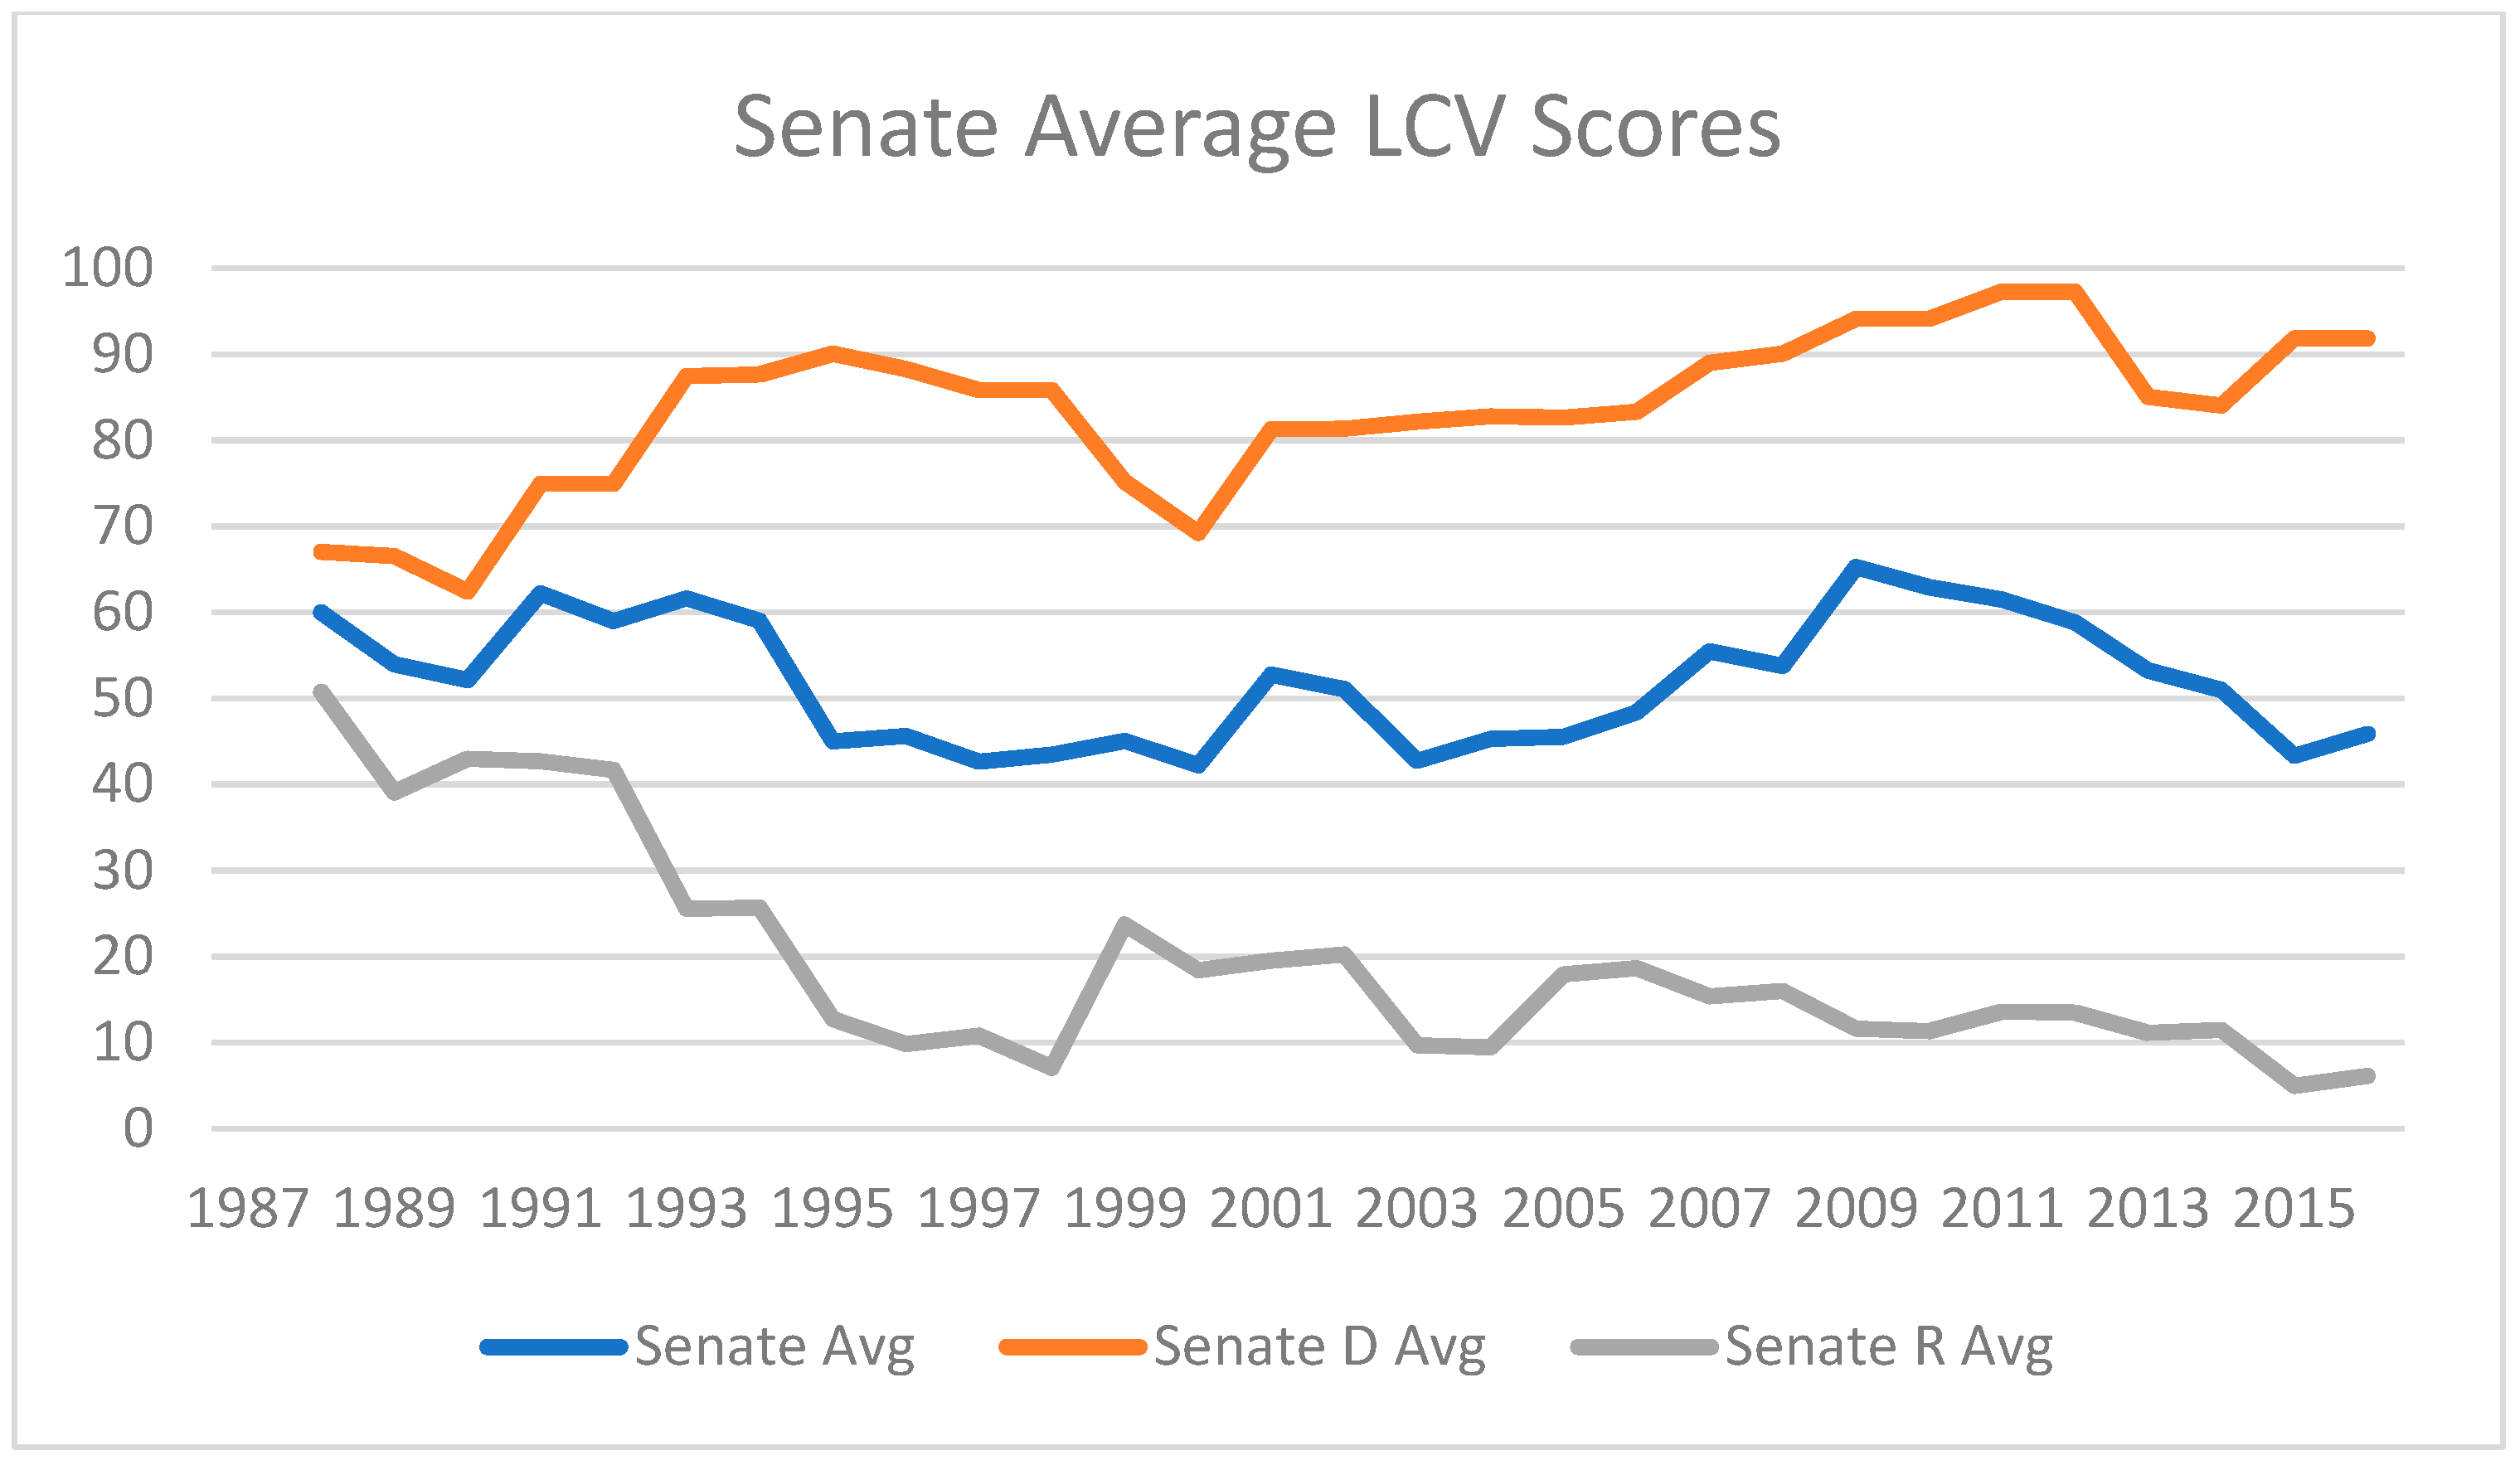
The dual nature of news coverage exists in a historical context of increasing national division about environmental issues and species’ sustainability. While important environmental measures such as the 1970 Clean Air Act Amendments received broad, bi-partisan support, environmental positions in the ensuing decades have been characterized by progressively more entrenched party and identity politics. As an illustration of this increasing division, the League of Conservation Voters (LCV) offers annual ratings of all members of Congress based on their votes on important pieces of environmental legislation. Both the House of Representatives and the Senate have committees that oversee the Fish and Wildlife Service, the primary implementer of the ESA. The time trend of the mean LCV rating of the Democratic and Republican members of these oversight committees is presented in
Figure 1 and
Figure 2 and demonstrates the increasing division. It is entirely possible that, in this increasingly divisive landscape, media coverage might simply inflame battles rather than impacting their duration or outcome.
3. Literature Review
There has been extensive previous work looking into aspects of ESA implementation. Most of this work has examined determinants of whether or not a species is listed as well as determinants of post-listing funding for species and habitat preservation. Fewer papers have examined time-to-listing decisions for those that ultimately receive protection under the Act. The examination of the impact of media coverage on any aspect of the ESA process does not appear to have been previously investigated.
Early work in this area [
19,
20] examines the decision to list a species as well as funding for its preservation post-listing and find that scientific as well as taxonomic factors matter, but particularly at the funding stage are outweighed by visceral/emotional (i.e., “charismatic megafauna”) characteristics such as size and the perception of a “higher form of life”. Overall, they find that it is the visceral characteristics of a species that matter much more than the scientific characteristics for overall protection by the EPA. They also find that species believed to be in conflict with development or economic activities receive greater post-listing funding for preservation, suggesting that political concerns matter. They do not investigate the impact of media coverage on either the decision to list or post-listing funding.
Another seminal paper [
15] is one of the few that investigates the time-to-listing decision. This paper finds that interest groups, Congress, and species characteristics can all affect the time to decision, emphasizing that it is believed that species have gone extinct while awaiting listing.
A number of later papers look at post-listing species preservation expenditures and investigate both the factors that affect expenditures and their impact [
2,
3,
4,
17,
21]. Other work suggests [
13] that as species face increasing threats as a result of climate change, spending related to preservation is likely to increase.
Finally, a unique paper [
22] provides justification for this paper’s investigation into the possible effects of the media on listing decisions. This same paper provides a tally of the degree of coverage of the ESA statute in four major newspapers (including the ones used in this paper) over a single year. While the time-span is limited, the conclusion is that there is a quite a lot of coverage of the ESA, and endangered species specifically, in the media—much more so than of other federal-level regulatory processes, including the Clean Water Act, the Comprehensive Environmental Response, the Compensation and Liability Act (Superfund), the Surface Mining Control and Reclamation Act, and numerous other regulatory processes. This result spearheads this paper’s investigation into whether any of this coverage actually matters to the timing of the regulatory process itself.
A separate body of literature exists that investigates the media and its influence (or lack thereof) on politics and public opinion. Three papers [
7,
8,
23] for example, find that there is an agenda-setting function of the media, and with it, an effect on public opinion. Also another study [
24] finds that the emphasis the media gives an issue influences the degree of salience it has for the general public. These effects can then influence politics and public policy. The results found here fit squarely into this research of an ongoing and significant effect of the media on public policy, and not just a reflective role.
4. Methodology and Data
The dependent variable in this study takes one of two forms:
Candidacy-to-Listing and
Proposal-to-Listing. The first,
Candidacy-to-Listing is the number of days a species took to go from first being brought forth as a possible candidate, all the way through to eventual listing. The second,
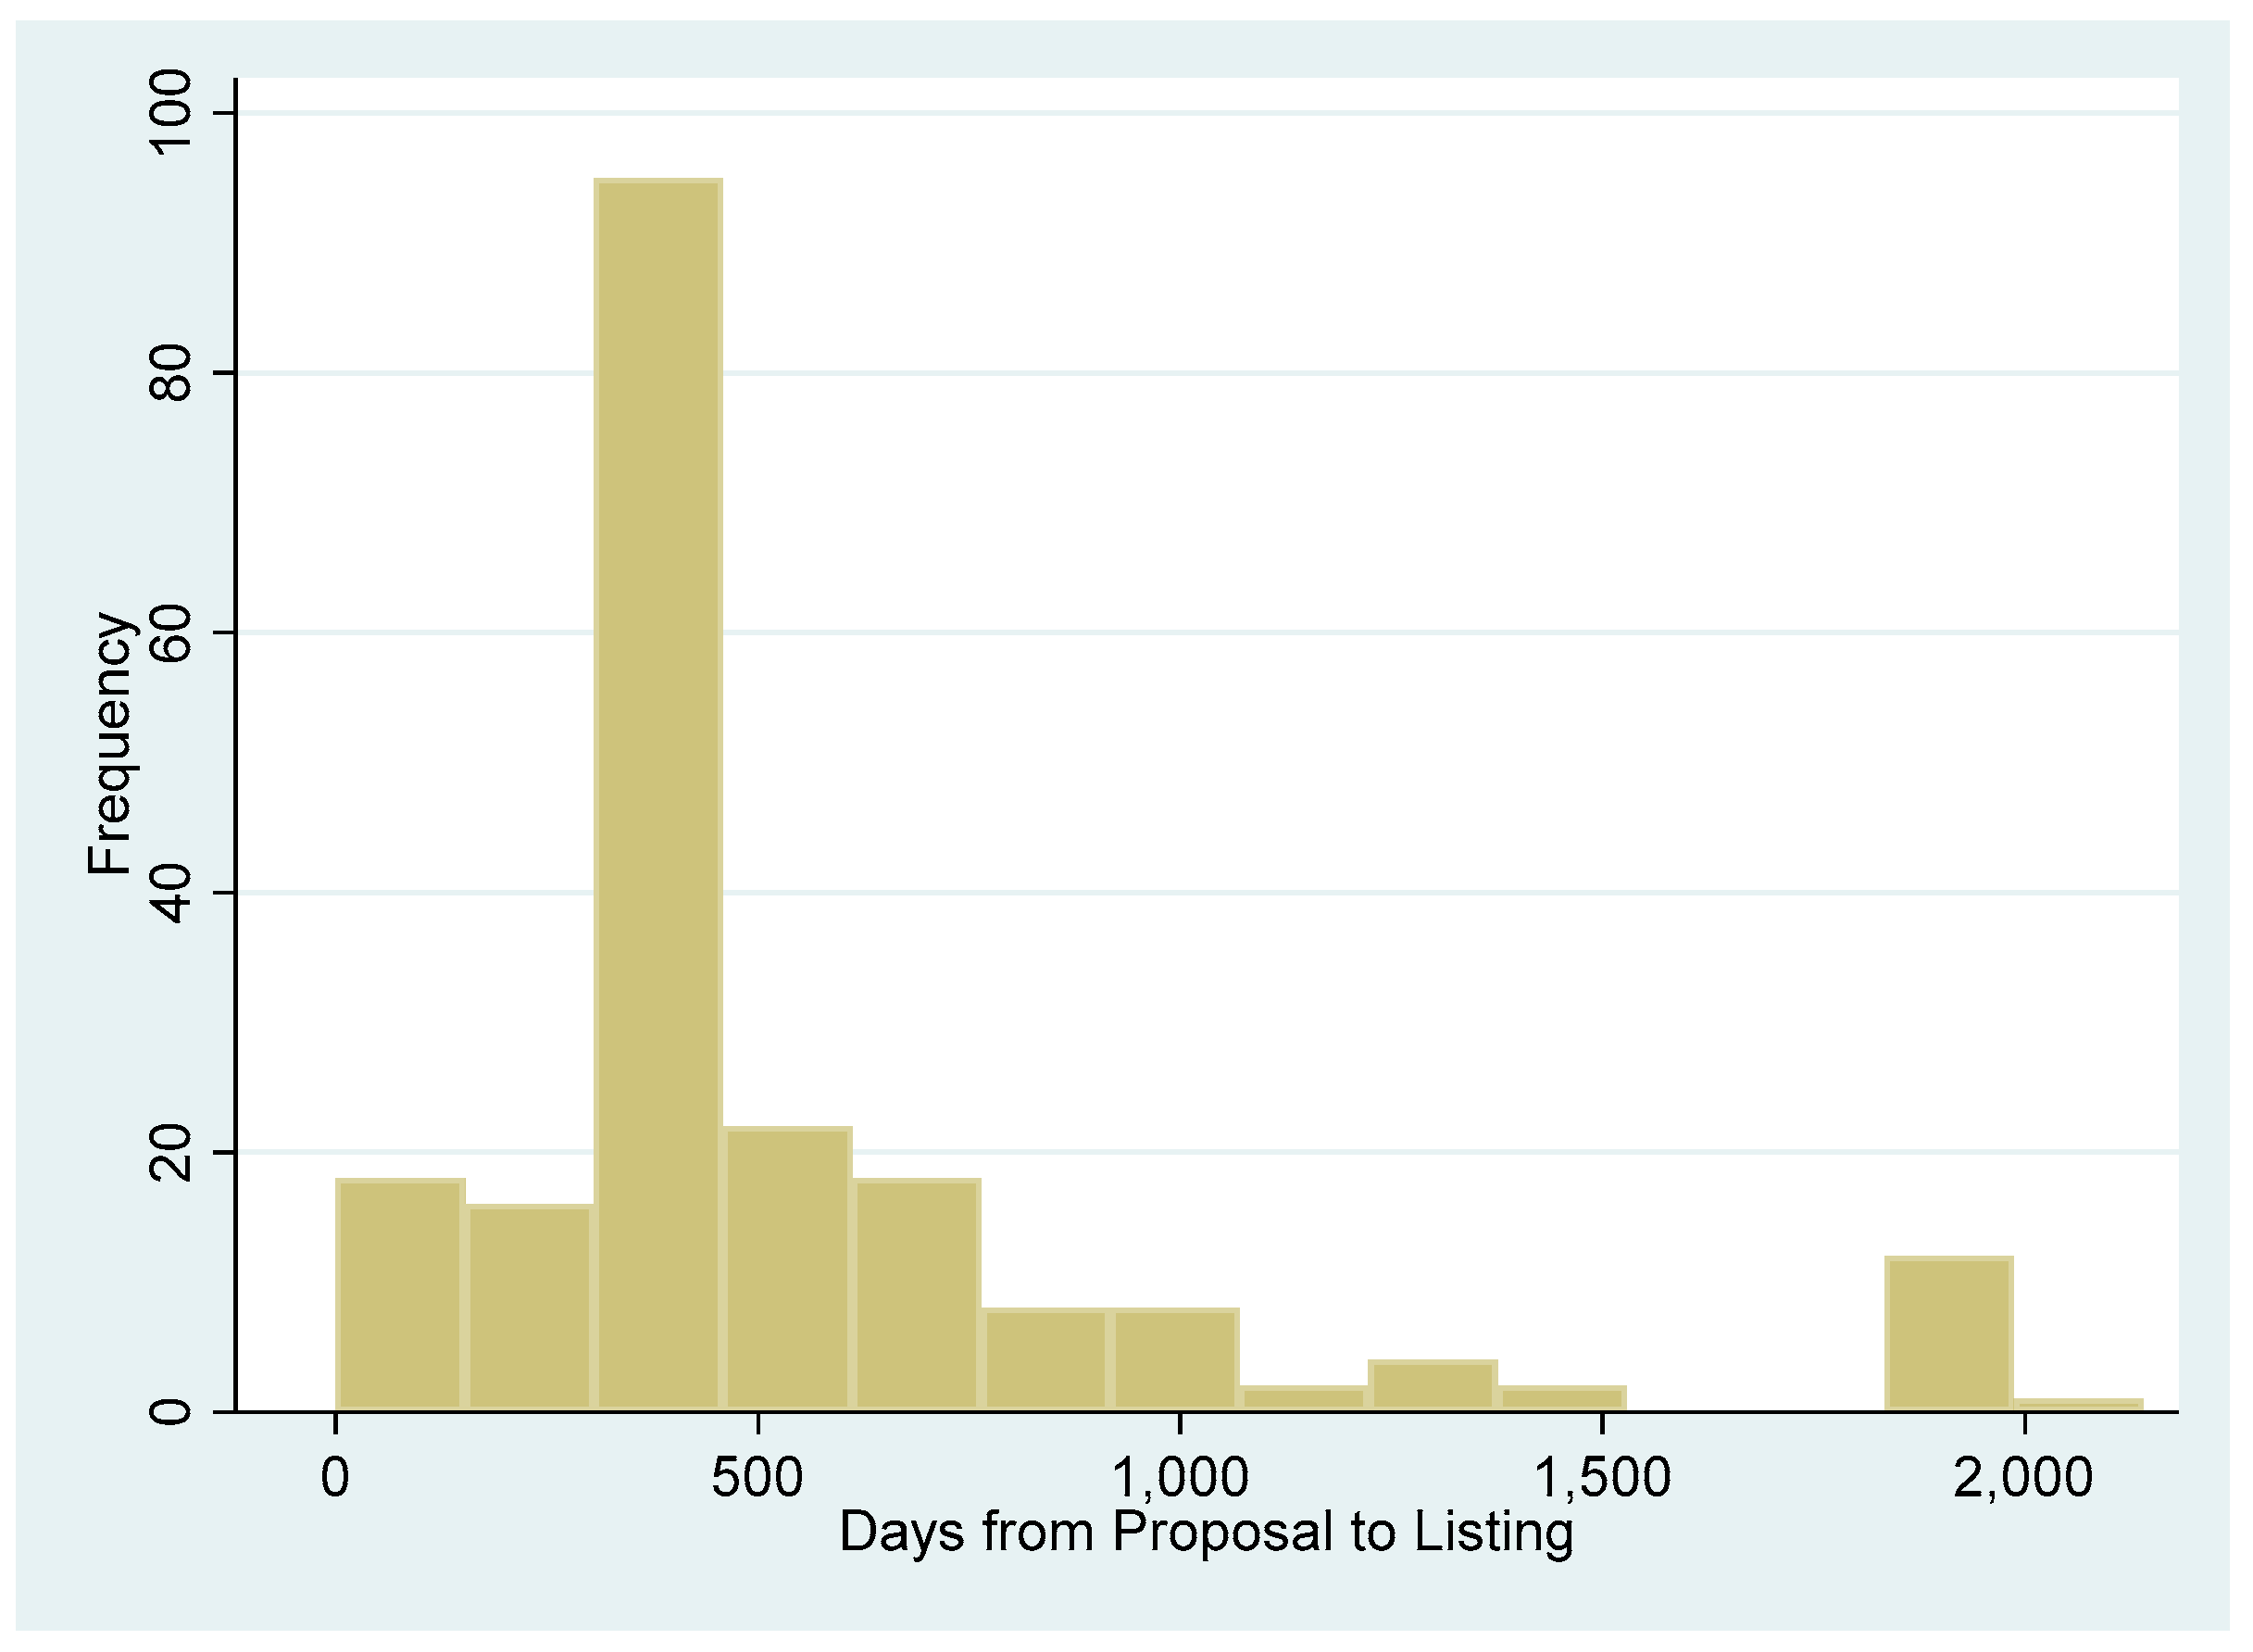
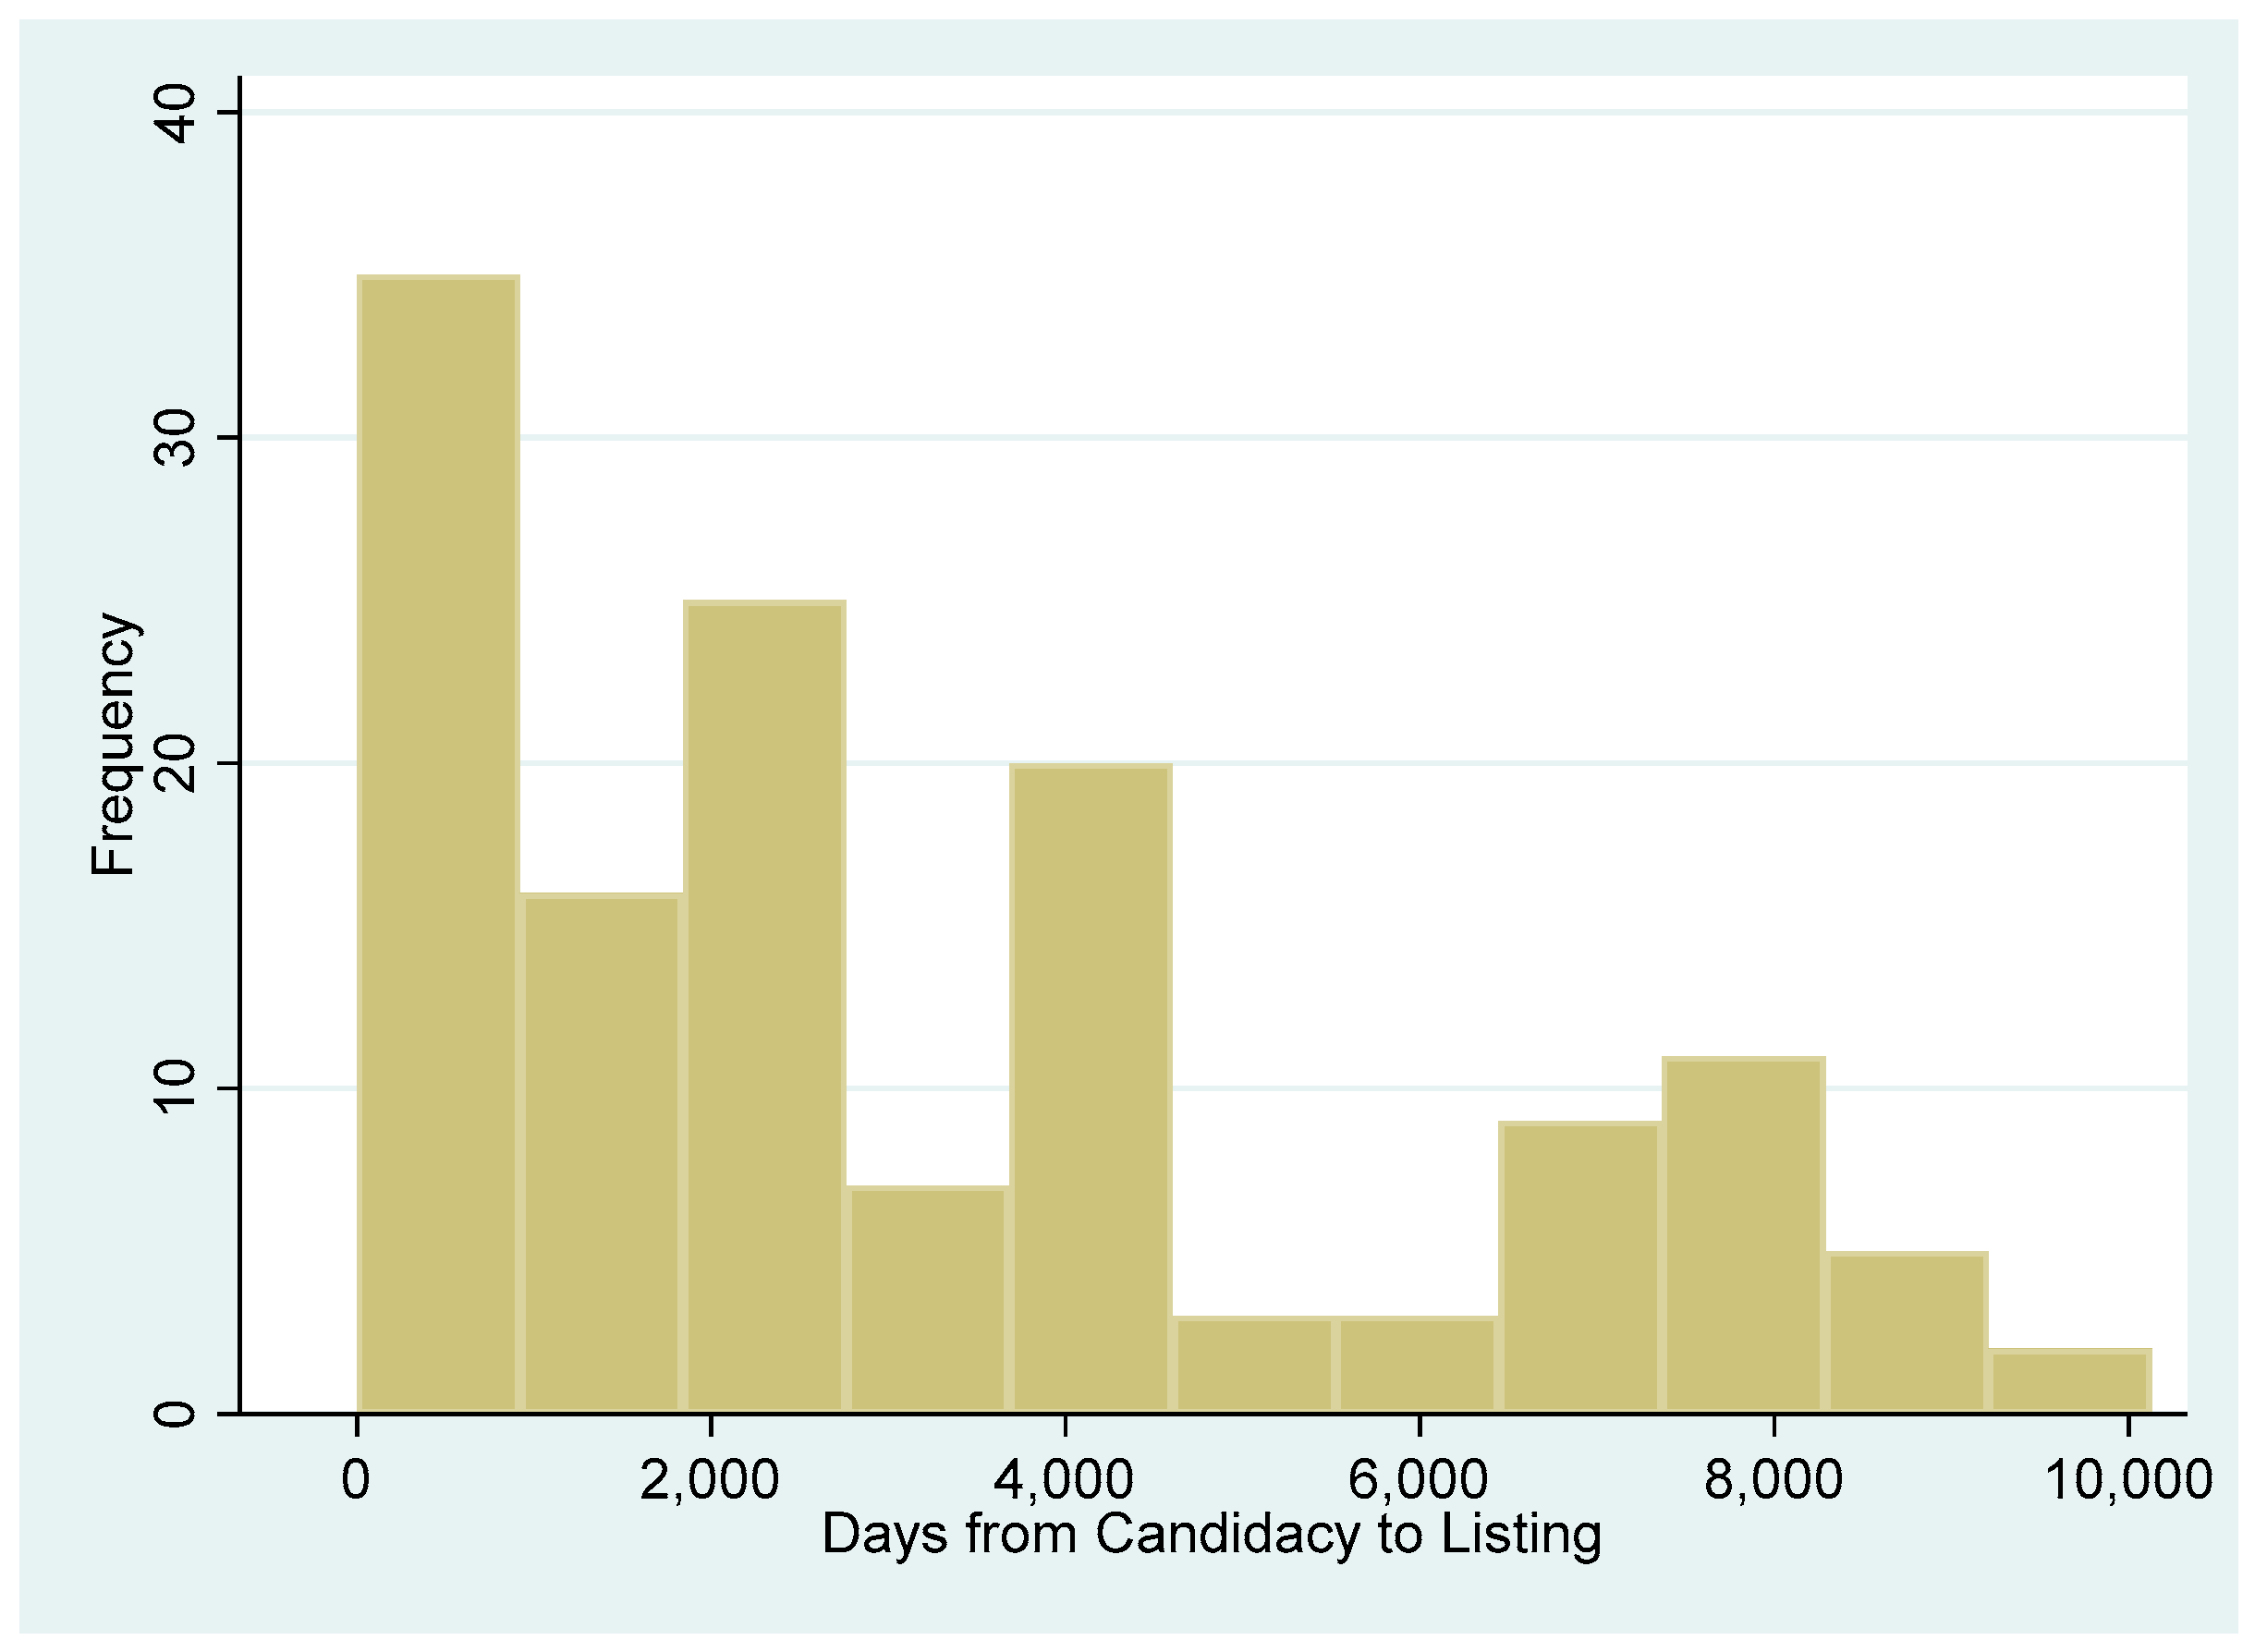
Proposal-to-Listing is the number of days a species took to go from official proposal, either as threatened or endangered, to eventual listing. As can be seen in
Figure 3 and
Figure 4, there is great heterogeneity in these times, from mere months to nearly four decades. This is, in part, because the FWS has limited resources and limited staff and cannot process all warranted candidates immediately. A species that has been determined to be warranted, therefore, can either proceed straight to a proposal-to-listing process, or more commonly, it can remain a mere candidate and sit on a waitlist while other higher-priority or earlier-in-time candidates are processed first. Candidate species that are determined to be warranted for further study but are not high-priority are annually reviewed, but they are also kept in something of a holding pattern until there are enough resources and staff to enter them into the more formal (with tighter deadlines and strict requirements) review process.
Candidacy-to-Listing includes the time on this waitlist, while the shorter
Proposal-to-Listing timeline does not. A priori, there is no reason to assume that any media variables will affect either dependent variable more or less than the other, but we keep track of them both to investigate the possibility. Frequencies and means for the dependent and media variables for each species group are presented in
Table 1.
The media variables,
National Articles and
Local Articles, are counts of the total number of articles (from three newspapers with national circulation and one newspaper from each of the fifty states for local circulation) that mention a species (either its common or scientific name) during that time period (see
Table 2). The range of the dataset is from 1989 to 2017, a full 28 years. This range was dictated by the availability of media articles through LexisNexis Academic/Nexis Use and ProQuest. Earlier time periods had substantial gaps in coverage, so the analysis was limited to years with full coverage from
The New York Times,
USA Today, and
The Washington Post. (
The New York Times,
USA Today, and
The Washington Post have been, and continue to be, three of the most widely circulated newspapers throughout the United States, regularly topping rankings for circulation numbers and subscribers in the multiple millions.) We had hoped to also include
The Wall Street Journal and the
Los Angeles Times in our analysis just to expand the observation set, but coverage of those newspapers was incomplete. The correlation between the number of
National Articles and the number of
Local Articles was 0.3320 (
p-value < 0.0001). Of 225 species, 112 had zero national news articles.
Our primary interest is the impact of media coverage on the time to listing. However, as discussed in the literature review, many factors have been found to affect EPA decision making, and so we include a number of these other factors in the regression analysis.
First are the scientific factors. All threatened or endangered animal species listings under the directive of the Fish and Wildlife Service, from 1989 to 2016, are included in the analysis, for a total of 225 species. With this list, we have information on a species’ taxonomic unit, in particular, the categories amphibian, arachnid, bird, insect, mammal, reptile, and snail. We also include a dummy variable indicating whether the species was part of a multispecies listing (multispecies). (There may be economies of scale in ESA administration. The use of multi-species listing packages is an attempt to consider species as components of a larger ecosystem.)
Also included are a range of political variables for each biennium. The states included in each species’ habitat are listed by the FWS, which is overseen by committees in both the Senate and the House of Representatives. The political explanatory variables include dummy variables indicating whether the Democrats held majorities in the Senate and House in each year (meaning that a member of that party would chair the relevant oversight committees),
Democratic Senate Control and
Democratic House Control, respectively, and whether the President was a Democrat. The Senate, House, and Presidential dummy variables are used to construct trifecta dummy variables indicating biennia in which the Democrats held overall control,
Democratic Control, or in which the Republicans held overall control,
Republican Control. We also include dummy variables indicating whether at least one of a species’ habitat states has a Democratic or a Republican representative on one of the oversight committees,
House/Senate Democratic/Republican Species Representation, and the average LCV scores of these Democrats and of these Republicans. Finally,
House/Senate Democratic Species Majority indicates whether a species’ habitat states had majority Democratic representation on the oversight committees. These political variables were included directly in various combinations in different models. The overall structure of the estimated models is presented in
Table 2. For example, Model 1 includes species group dummy variables and a dummy variable indicating whether the species is part of a multi-species listing. Model 2 adds the number of local articles while Model 3 adds the number of national articles. Subsequent models add various combinations of political variables. The estimated coefficients on our media variables, both national and local newspaper coverage, were extremely robust to which political variables were included in the model.
In sum, while our primary focus is on the impact of media on the listing process, our empirical analysis mimics the previous literature by having a number of variables that have been shown to affect ESA decision making on endangered species and sustainability in the past, including scientific and political variables.
5. Model and Results
A Cox proportional hazard model is estimated over the time from Candidacy to Listing and from Proposal to Listing. Explanatory variables include dummy variables for each taxonomic group (mammals were the excluded group), the media variables National Articles and Local Articles, a multispecies dummy variable, and myriad combinations of political variables. (The choice of an excluded taxonomic group is mathematically arbitrary but necessary to avoid catastrophic collinearity. We chose to exclude mammals because they are frequent examples of charismatic megafauna and serve as a good comparison for other taxonomic units.)
Note that the coefficients are hazard ratios, so positive values imply increased speed in the listing process, and negative estimated coefficients imply that the explanatory variables delay the listing process and extend a species’ wait to be officially listed as either threatened or endangered.
Results from the primary hazard model analysis of the period from candidacy to listing and from proposal to listing are presented in
Appendix B and
Appendix C, respectively. The tables present estimated coefficients and
p-values for those coefficients. Pseudo R
2 figures are presented for each model to give a sense of the explanatory power of the model relative to a null model, or an estimation with no explanatory variables. Chi square statistics from a hypothesis test in which the null hypothesis is that the model has no explanatory power are also presented. All models rejected the null hypothesis of no explanatory power with
p-values of less than 0.05. Additional results reflecting the inclusion of a broader range of political variables are presented in
Appendix D and
Appendix E.
The candidacy-to-listing results suggest that media coverage, both at the national and local level, speeds the process significantly, a boon to species’ sustainability prospects and a result that is robust across many different specifications and the inclusion of various political variables. These results lend credence to the “mediatization” effect [
7], and imply, along with [
6], that the media can affect public policy outcomes. Republican control of the House, the Senate, and the White House (the trifecta) significantly slows the process, while Democratic control of the White House significantly speeds the listing process. Arachnids and insects seemed to enjoy faster listing processes, while amphibians and species that were part of multi-species listings endured slower processes.
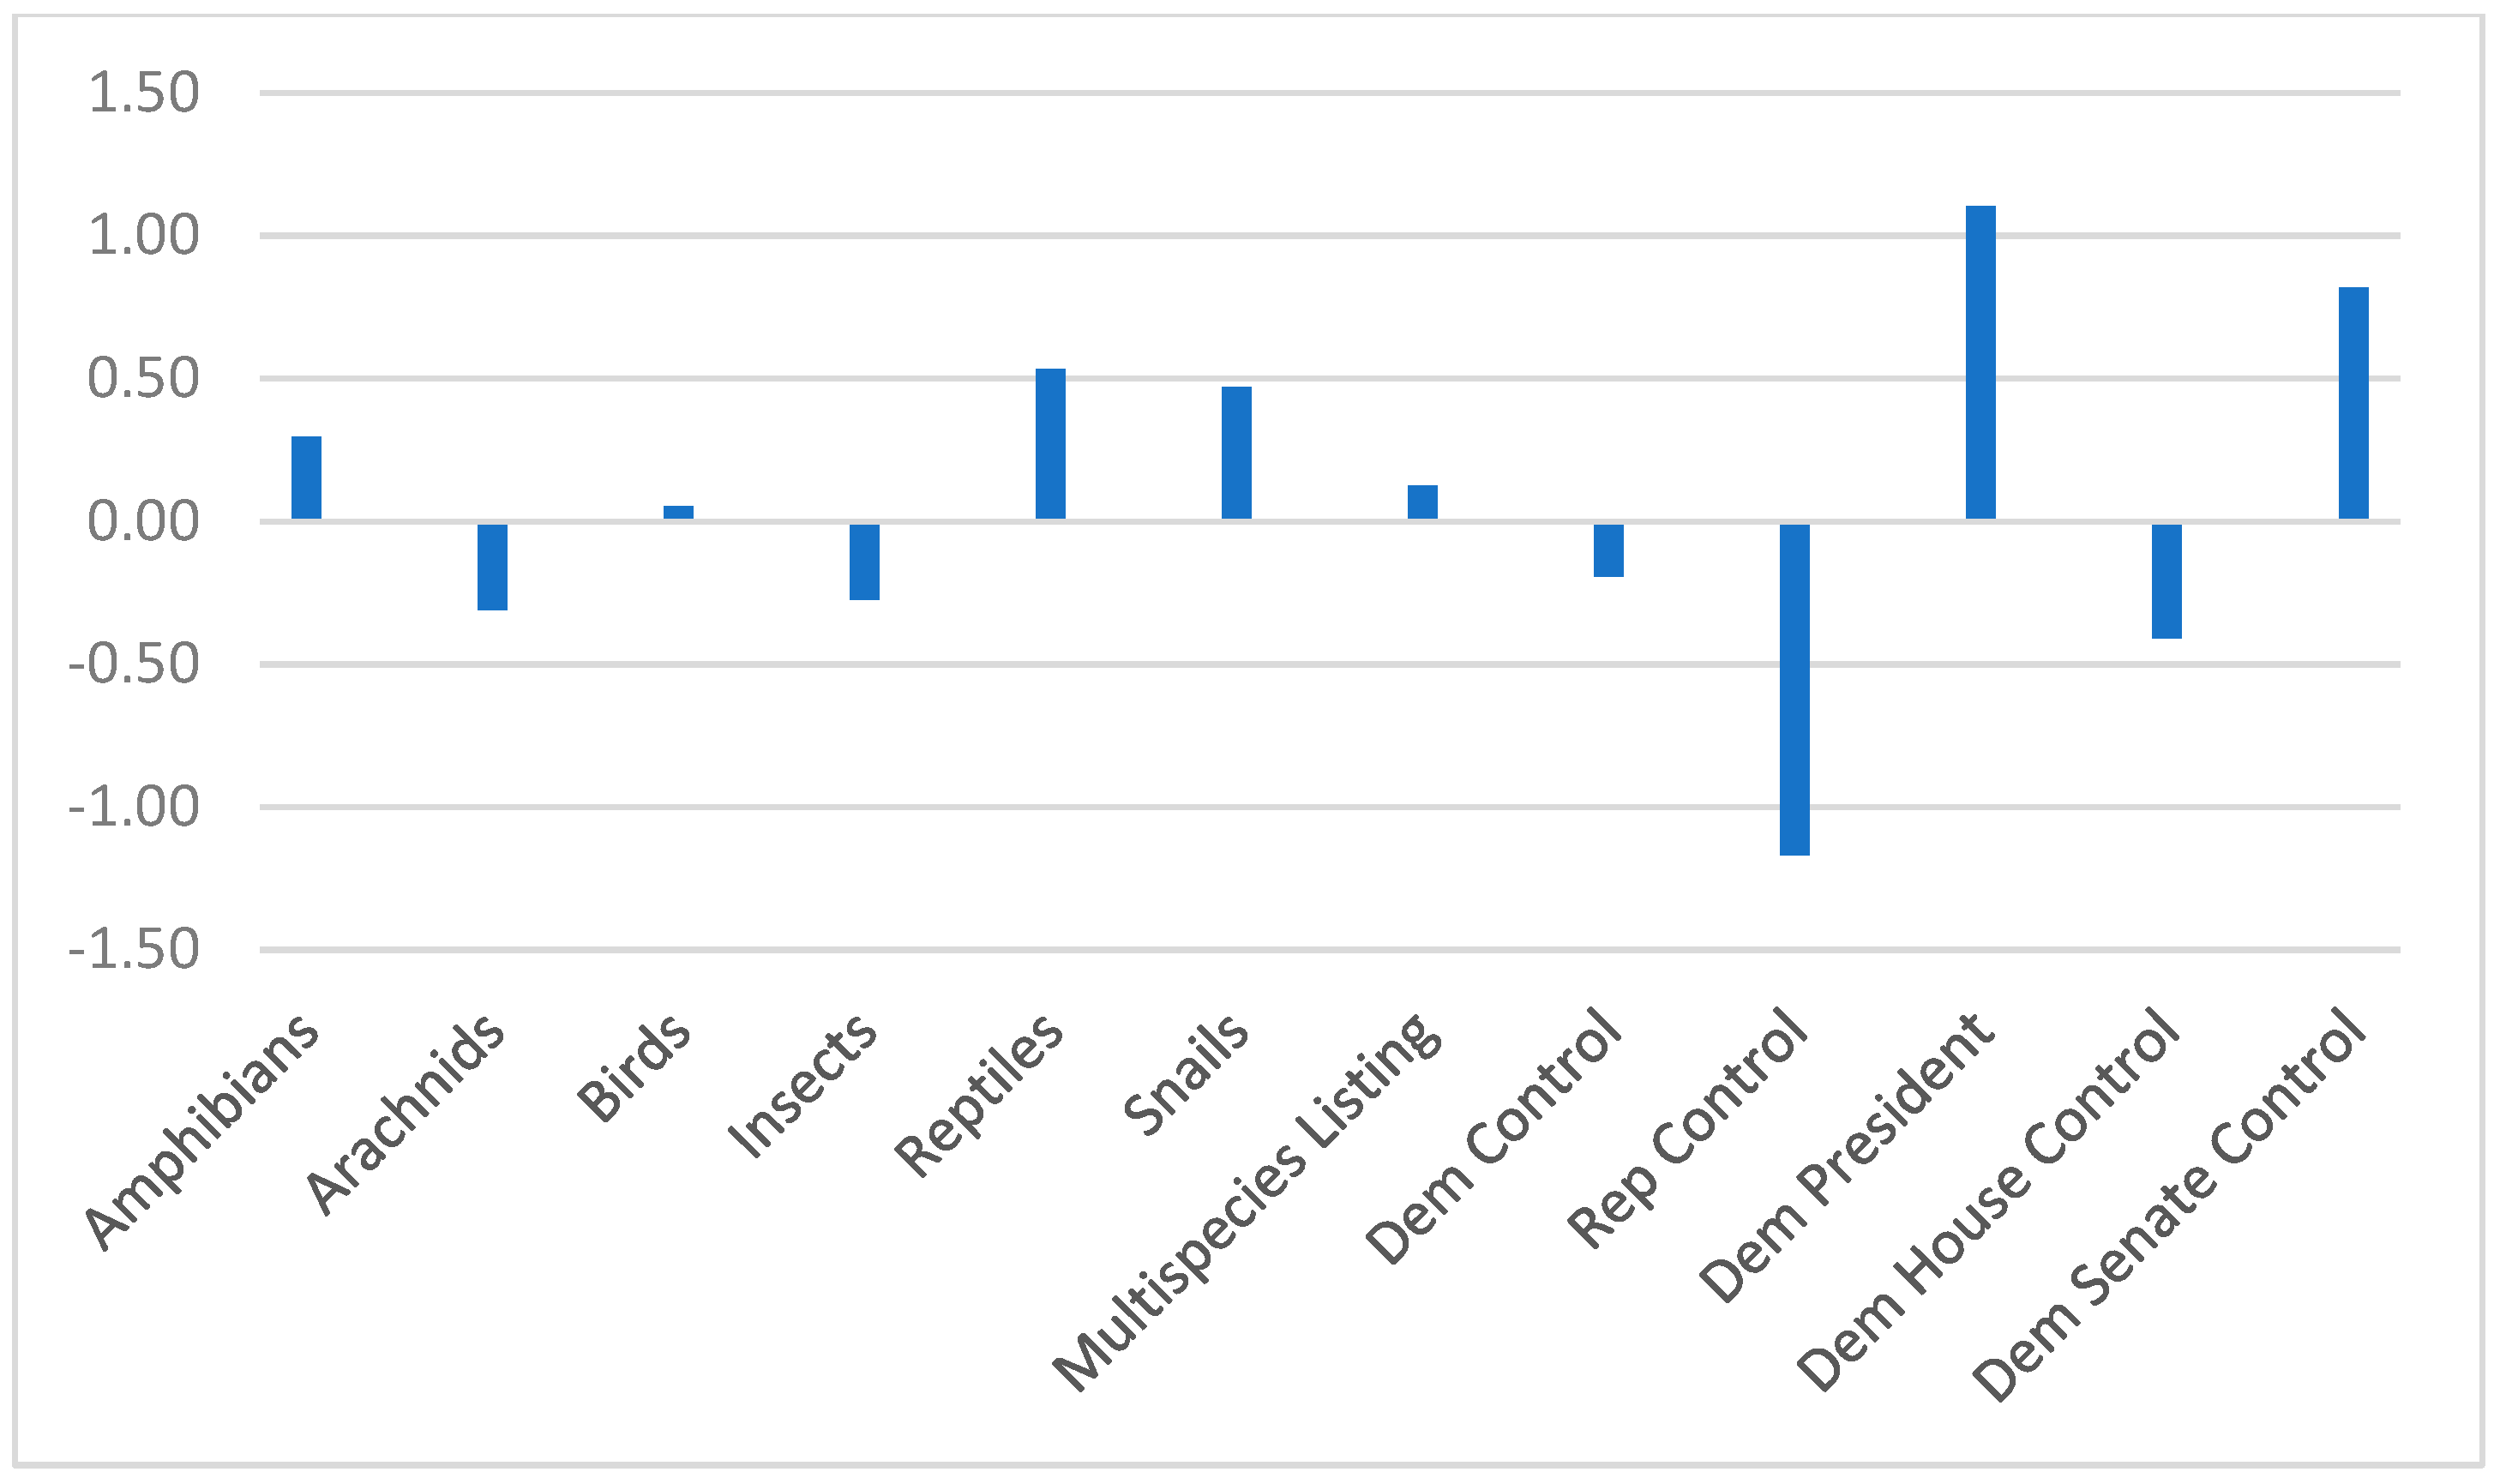
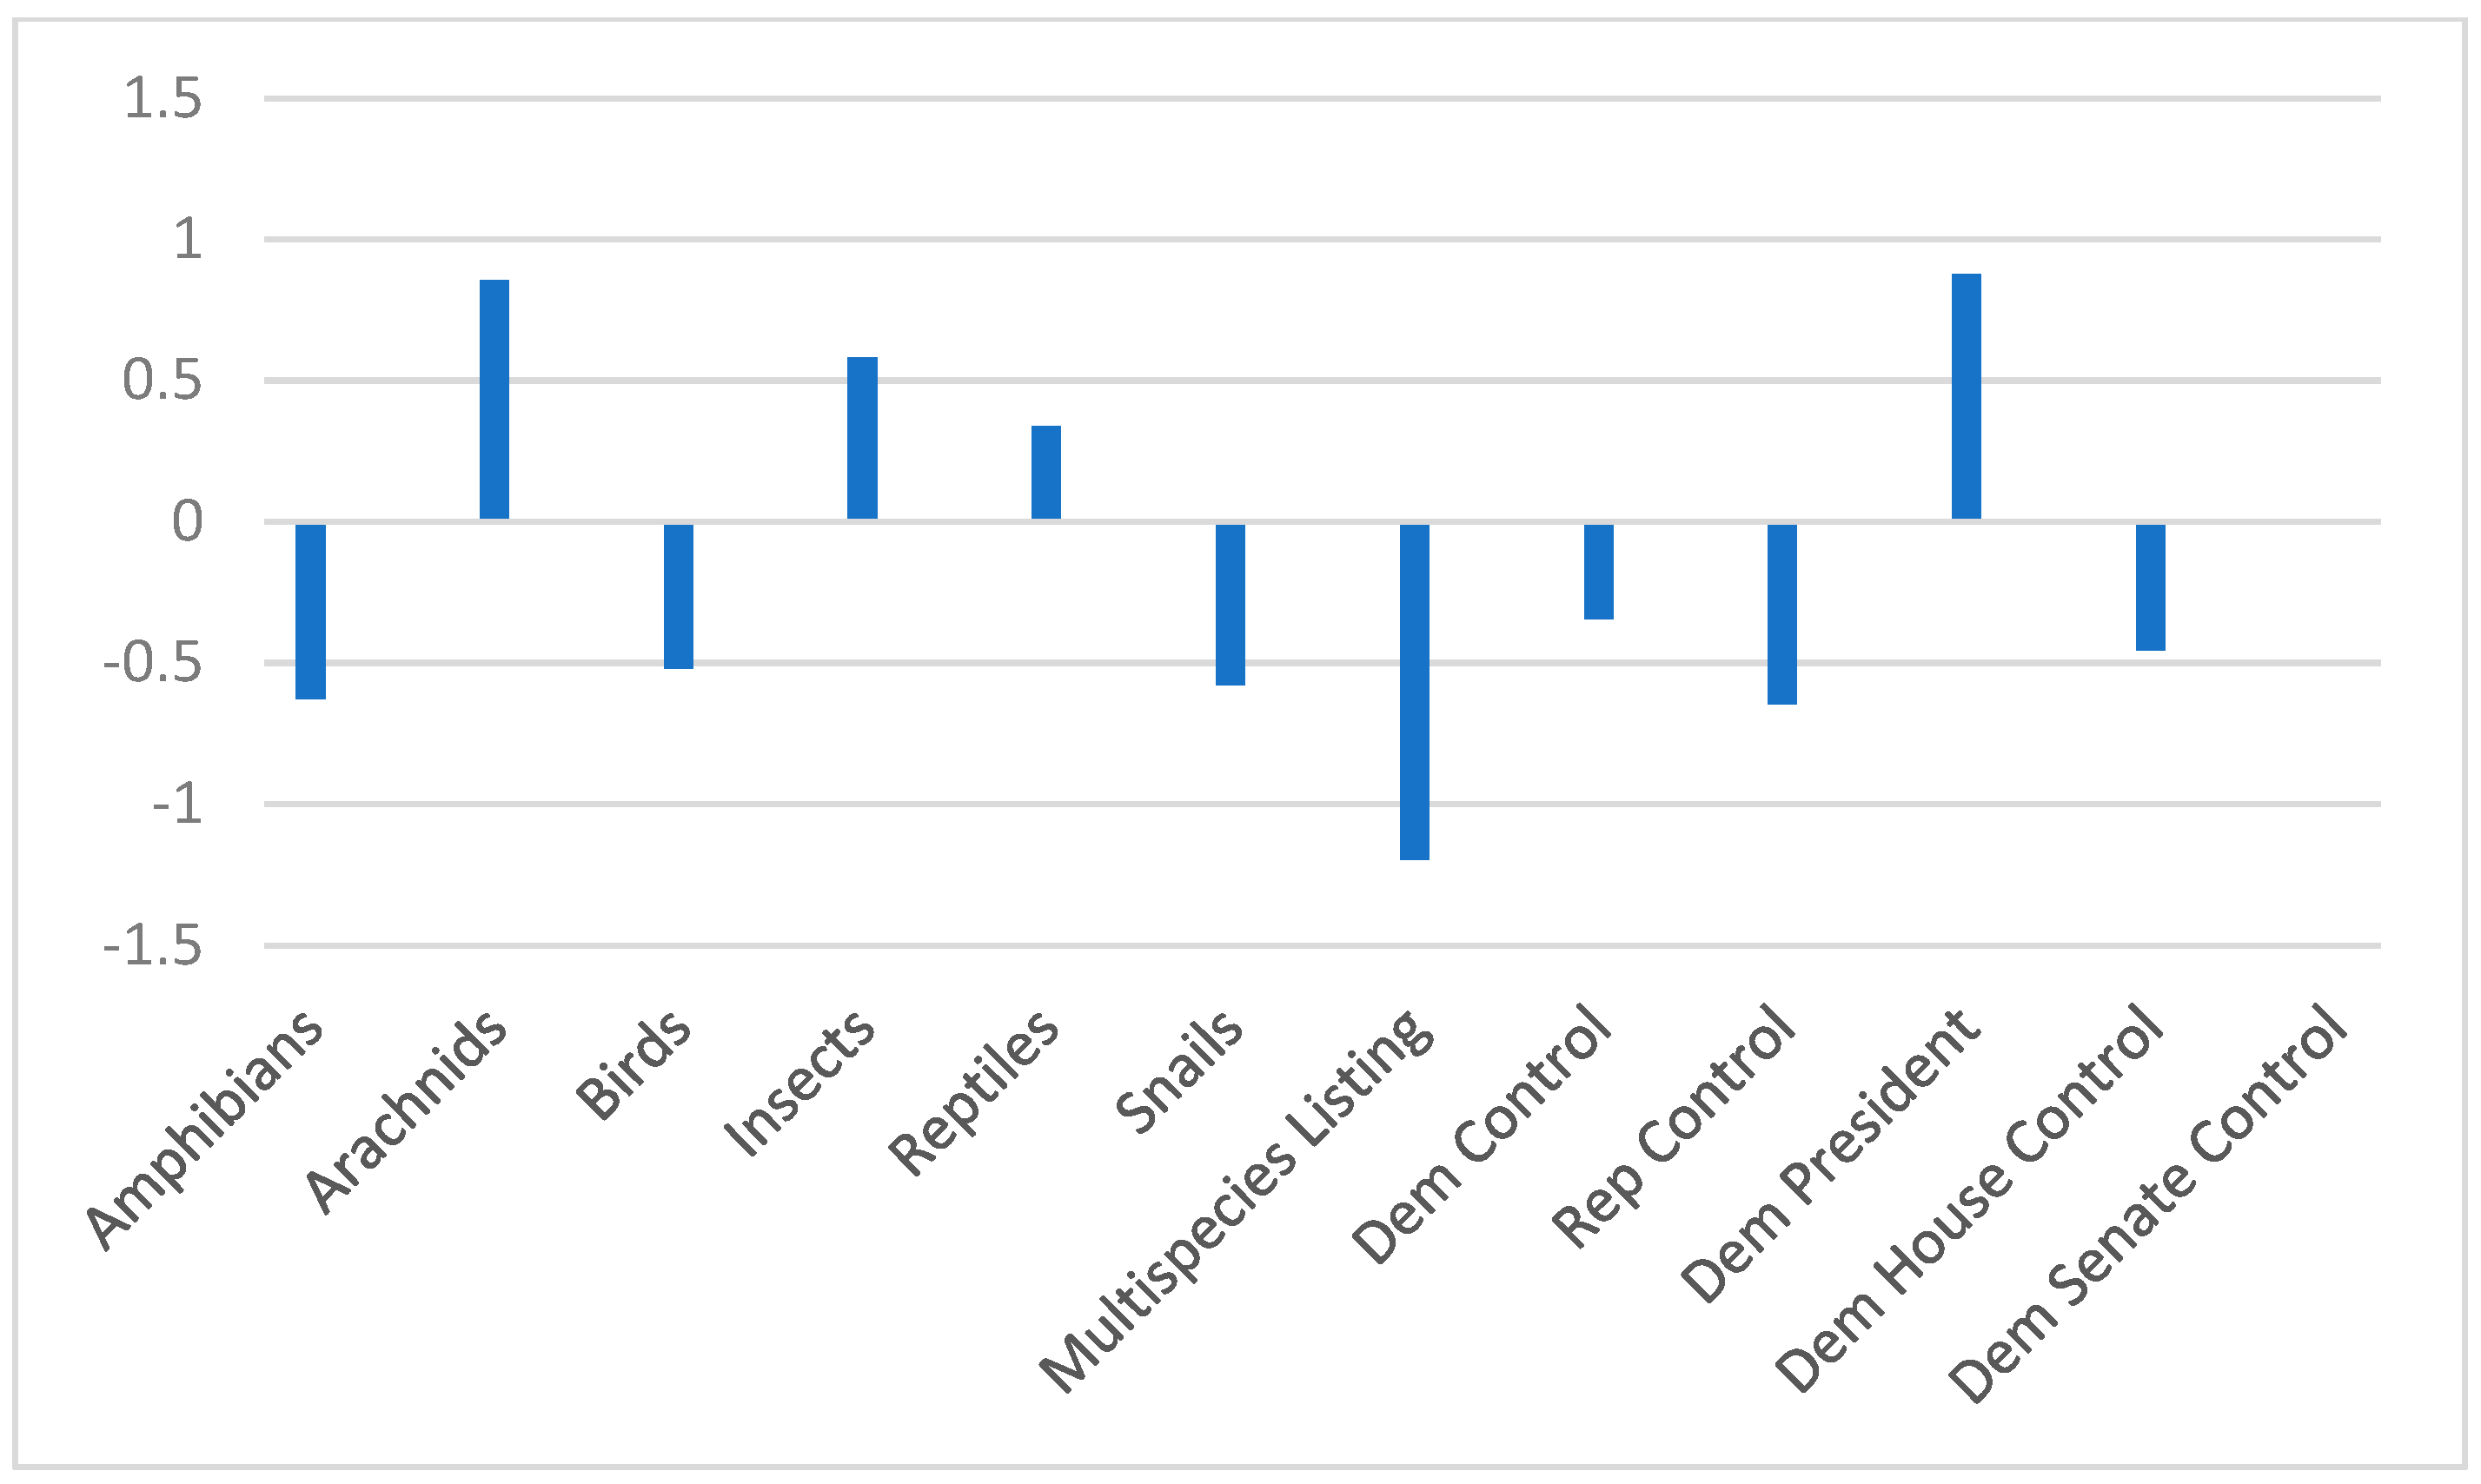
Results from the proposal-to-listing time suggest that media coverage, either at the national or local level, has no significant impact on the speed of this part of the listing process, and so is insignificant with relation to sustainability concerns. Political influences persist, with the Republican trifecta again significantly slowing the listing process, even after proposal, while the presence of a Democratic president or Democratic control of the Senate significantly sped the listing process. Reptiles and snails may have enjoyed slightly faster processes from proposal to listing. A graphical representation of the estimated coefficients on the species group and political variables is presented in
Figure 5 for candidacy to listing and in
Figure 6 for proposal-to-listing models.
The important result is that media coverage, as measured by both national and local news articles published while a species is under consideration, seem to speed the process from candidacy, but not proposal, to listing. This result is robust across the results presented here and across a wide range of combinations of the political variables, as shown in
Appendix B,
Appendix C,
Appendix D and
Appendix E. This suggests that there is an important public role for the media to play in accelerating the endangered species process and affecting species’ sustainability rates, but it must be played relatively early on.
6. Conclusions
Being an administrative process, the movement of species from candidacy to proposal to listing under the Endangered Species Act is necessarily political and, in a democratic system, also subject to public opinion and input. Our results suggest that both the candidacy-to-listing and proposal-to-listing processes favor some species groups in terms of significantly slower or faster paths—which has important implications for these species’ ultimate sustainability—and that political factors also exert some influence.
Media attention also plays a role for candidate species. Our results suggest that more media coverage, at both the local and national level, seems to speed the movement from candidacy to listing, as indicated by the estimated coefficients from the Cox proportional hazards model, but this effect does not extend to the movement from proposal to listing, perhaps suggesting that this final stage of the process is more insulated from external impacts and less concerned with ultimate species sustainability or viability. The lack of media impact in this final stage may be a result of more stringent timelines governing the process from proposal to listing.
Our results demonstrate the importance of including some measure of media coverage in future work on the ESA and species’ sustainability. The “mediatization” of not just politicians but public policy itself and agency decision making is an important implication of these results. Rather than merely intensifying the struggle over species’ protections, early media coverage seems to speed the process to listing. Additionally, future research might investigate the nature of that coverage and identify the differential impacts of coverage, emphasizing the popular versus obstructionist view of proposed species.


