Article

Evaluating Drivers and Barriers of Integrated Waste Management System Implementation in Indonesian Construction Industry: A DEMATEL-Based Analytical Network Process

1
Department of Industrial Engineering, Faculty of Engineering, Universitas Indonesia, Depok 16424, Indonesia
2
Department of Architectural Engineering, Kyung Hee University 1732, Deogyeong-daero, Giheung-gu, Yongin-si 17104, Gyeonggi-do, Republic of Korea
*
Author to whom correspondence should be addressed.
Sustainability 2024, 16(6), 2264; https://doi.org/10.3390/su16062264
Submission received: 15 February 2024 / Revised: 2 March 2024 / Accepted: 6 March 2024 / Published: 8 March 2024
(This article belongs to the Section Waste and Recycling)

Abstract

:
The growth of construction industries in Indonesia creates an increasing level of generated construction waste. The limited implementation of ISO 14001 in the Indonesian construction industry might indicate the limited implementation of waste management based on sustainability principles. Therefore, this study aims to explore the drivers and barriers to implementing integrated waste management in construction industries. The Content Validity Index (CVI) and Modified Kappa methods were utilized to validate the indicators from the literature review. A total of 18 driver factors and 21 barrier factors in six dimensions were assessed by seven experts. This study then employs the decision-making evaluation and laboratory-based analytical network process (DEMATEL-based ANP) to find the weight and relation between each indicator and dimension. The results show that environmental awareness is the most important factor that drives construction industries to implement waste management in their company. In contrast, a lack of education about waste management is the most significant factor that inhibits construction industries from implementing sound waste management systems.

1. Introduction

As the fourth most populous country in the world, waste is an ongoing problem in Indonesia [1]. According to the ASEAN Post [2], Indonesia has the second highest rate of waste generation in the world after China, with 34.29% of waste still not appropriately managed. Based on a report from The Ministry of National Development Planning (Bappenas), five sectors are inefficient in managing their waste, generating high waste levels [3]. This includes food loss and waste, textile, and construction waste. According to Kulatunga et al. [4], 40% of waste in the world comes from construction and demolition, which forms a high potential for solid waste discharged in landfills. This could create land scarcity, as based on Tafesse et al. [5]; construction waste has the highest volume compared to other waste.
In Indonesia, the development of the construction industry is increasing yearly. In 2021, the level increased by 12% from 2020 [6]. Along with the rise in the construction industry in Indonesia, construction waste will also increase by 82% by 2030 [3]. According to Widhiawati et al. [7], construction waste is all unused material resulting from the construction or repair of any item produced from any process that cannot be directly used in that place without further treatment [7]. The composition of construction waste may include stones, concrete, bricks, plasters, roofing, plumbing, and electrical installation materials.
Several harmful conditions might happen if construction waste is not managed correctly. As stated by Yahya, K. & Boussabaine, A.H. [8], waste from construction or demolition significantly impacts the environment, and one of the biggest environmental polluters is the construction industry [8]. One of the negative impacts of construction waste is the pollution and degradation of groundwater quality. This is caused by groundwater contamination with chemicals produced from construction waste [9]. The negative impacts of construction waste are described as follows [9]:
  • Affecting human health, such as respiratory diseases;
  • Air pollution occurs in the form of dust and hazardous compounds;
  • Water pollution appears in both ground and surface water;
  • Esthetically unappealing surrounding environment;
  • Reducing the quality and productivity of the soil.
Hence, it is the responsibility of the construction firms to ensure proper waste management of the waste that the company has generated. Accordingly, ISO 14001 is a crucial certification as it ensures that the production process has fulfilled commitments to the environment, primarily the fulfillment of environmental regulations and pollution prevention and a commitment to continuous improvement [10]. However, only 1.32% of construction firms in Indonesia implemented ISO 14001 certifications [11]. Therefore, it is possible that many construction companies have yet to implement sound waste management.
From a global perspective, the implementation of waste management in various industries was addressed through a diverse array of objectives and methodologies in prior studies. Numerous works delved into the challenges hindering the effective adoption of waste management practices within the construction industry. For instance, Mhatre et al. [12] employed the decision-making evaluation and laboratory (DEMATEL) method to examine the barriers impeding the integration of a circular economy in the Indian construction sector. Their findings underscore the prevalence of environmental barriers, a deficiency in environmentally safe material recovery processes, and the substantial operational costs acting as formidable obstacles to implementing circular economy practices. Lee et al. [13] utilize the DEMATEL method to analyze the interaction between drivers and barriers of the Industrial Revolution 4.0 transition in the construction industry, revealing the significant challenge of the incompatibility of innovations as a key barrier that needs to be addressed. Moreover, a study by Yadav et al. [14] employs a fuzzy DEMATEL methodology to identify the lack of strict government regulatory policies, proper financial planning, and benchmarking processes as key barriers hindering the adoption of IoT-based smart waste management in developing economies like India.
Similarly, Al-Otaibi et al. [15] identified the insufficient attention given to construction and demolition waste management as a prominent barrier, impacting the pursuit of sustainable waste management in the construction sector by both developed and developing countries. Ratnasabapathy et al. [16] highlighted technical barriers and the absence of consistent waste data as significant hindrances to implementing waste trading within the Australian construction and demolition sector.
Several studies explored the factors driving the successful implementation of waste management practices in the construction industry. Kabirifar et al. [17] emphasized that effective construction waste management necessitates a strategic focus on reuse, reduction, and recycling. In the United Kingdom, Ajayi et al. [18] proposed that cultural shifts are essential to minimizing waste in the construction sector, thereby enhancing both sustainability and profitability. Furthermore, Zhao’s [19] study underscored stakeholder-related factors, including the regulatory environment, government supervision, and the recycling market. Collectively, these studies contribute valuable insights into the multifaceted challenges and key drivers shaping the waste management landscape in the global construction industry.
However, stakeholders still need to pay more attention to the studies on waste management in the construction industry, especially in Indonesia. This work aims to explore the relationship between the drivers and the barriers in the dimensions for the successful implementation of waste management in the construction industry in Indonesia.
Using the Decision-Making Trial and Evaluation Laboratory (DEMATEL) method, our study evaluated the drivers and barriers. It is a method for identifying criteria interactions and visualizing the structure of cause-and-effect models through matrices and graphs [20]. Furthermore, our work used the DEMATEL-based analytical network process (DEMATEL-based ANP) method to include interactions and dependencies between dimensions and criteria [21]. The study by Kamranfar et al. [22] applies a hybrid decision-making method that integrates DEMATEL and Delphi techniques with an analytical network process (ANP) to identify and rank barriers to green construction development in Tehran, Iran. A combination of DEMATEL and ANP approaches is applied in the construction industry and effectively evaluates and selects knowledge management strategies, providing valuable insights applicable to companies across various industries [23].
While previous analysis explored various aspects of waste management in the construction industry, this study contributes to the field by employing the DEMATEL method to assess the drivers and barriers associated with waste management practices, specifically within the Indonesian construction sector. Unlike previous studies that primarily focused on other geographic regions or broader industrial contexts, our work is uniquely positioned to examine the drivers and barriers of waste management in the Indonesian construction sector, shedding light on issues particularly relevant to developing countries with similar problems. Additionally, our study incorporates the DEMATEL-based analytical network process method to comprehensively analyze interactions and dependencies, enhancing our findings’ depth and robustness. By elucidating the unique challenges and opportunities in waste management within the Indonesian construction industry, our study contributes novel insights that can inform more effective strategies for sustainable waste management practices.
This manuscript is organized as follows: Section 2 discusses the materials and information needed for processing the data. Section 3 provides the results using the DEMATEL-based ANP method. Section 4 includes a critical discussion of the results obtained. Finally, Section 5 concludes this study.

2. Materials and Methods

To enhance reader comprehension and provide a clear roadmap for the subsequent sections, we included a methodology flowchart, as depicted in Figure 1. This visual aid outlines the main techniques employed in this study, facilitating an understanding of the overall data acquisition, processing, and evaluation procedure.
Our studies examine previous works, including Guerrero et al. [24], Al-Otaibi et al. [15], Park and Tucker [25], Kabirifar et al. [17], and Ajayi et al. [18] to identify the initial list of drivers and barriers of integrated construction waste management. The driving factor here is the factor that pushes construction industries to implement waste management properly, while the barrier factor holds them back from doing so. Afterward, the identified barriers and drivers for construction waste management implementation are grouped into six dimensions: financial, institutional, environmental, socio-cultural, technical, and legal.
Our study gathered 21 drivers and 24 barrier indicators for implementing waste management in construction industries. To ascertain the relevancy of the indicators within the context of Indonesia, the indicators that were gathered need to be validated by several Indonesian experts. Baker et al. state that the expert characteristic encompasses three facets [26]:
  • Knowledge: an individual who has a predetermined and proper knowledge and experience base.
  • Experience: an individual who worked in a specific area for a certain period.
  • Policy Influence: an individual recognized as an opinion-maker within national organizations.
Based on the characteristics that were defined by Baker et al., this study breaks the expert characteristics into several qualifications [26]:
  • Hold, at minimum, bachelor’s degree;
  • From the company: minimum position within a managerial level;
  • Has worked in the construction industry for more than five years;
  • Has a role that deals with waste management within the company.
The contextualization process was then performed by distributing questionnaires to the experts in Table 1. The data were then assessed using the I-CVI combined with the Modified Kappa method. The Content Validity Index (CVI) method represents the most appropriate formula for assessing the content validity of interactive learning media aligned with the creative problem-solving model that involves judges or validators in the validation testing process [27]. Based on Yusoff’s [28], the minimum acceptable expert number to validate a factor is two experts; however, the recommendation is six. It states that the requirement for an I-CVI score for three to five experts is 1.00, and for at least six experts, it is 0.83.
The I-CVI calculation involves counting the experts who gave an item a rating of 3 or 4 and then dividing that count by the total number of experts. Essentially, it gives us the proportion of agreement among experts regarding an item’s content validity [29].
One limitation of the CVI method is its exclusive reliance on agreement proportions, which do not provide a value indicating disagreement. This can potentially inflate agreement due to a chance [30,31]. The modified Kappa method addresses this limitation, where the kappa statistic tests agreement between two individuals (evaluators or observers) on categorical variables [32].
Modified Kappa method can be calculated by using the value of Pc (probability of change agreement) and I-CVI by using the following equation [29]:
1.
Calculate the probability of change agreement (Pc)
P c = N ! A ! N A ! ( 5 N )
where
N = Number of experts;
A = Number of those agreeing on good relevance.
2.
Calculate the Modified Kappa score (k*)
k = I C V I P c 1 P c
Based on Cicchetti and Sparrow [33], kappa scores below 0.40 indicate poor factors. Moreover, scores above 0.40 are indicative of a factor that is relevant; the details of the evaluation score are shown in Table 2.
After calculating the score using CVI and Modified Kappa, three driver factors and four barrier factors are considered irrelevant for the construction industries in Indonesia to implement waste management in their companies. These factors include additional profit, investment, expertise, separating recycled materials, performance standards, lack of skilled operators, and regulation support. This work obtains 18 valid driving factors and 20 relevant barrier factors through this contextualization process. The details of the remaining factors are provided in Table 3 and Table 4.

DEMATEL-Based ANP

This work uses DEMATEL-based ANP, which can provide a comprehensive decision-making support tool to evaluate performance [34]. It is appropriate for exploring interactions and dependencies between dimensions and criteria [21]. The ANP method weighs the criteria, while DEMATEL produces a Network Relationship Map (NRM). Each element is normalized using the ANP method.
The previous Modified Kappa eliminated three irrelevant driving factors, i.e., additional profit (FE09), investment (TECH08), and expertise (TECH09), and four irrelevant barriers factors, which are separate recycled materials (FE04), work standards (IN04), lack of skilled operators (IN05), and reassurance (SOC03). Afterward, a questionnaire was formed from the 18 relevant driving factors and 20 relevant barrier factors to weigh the relationship between driving factors and barrier factors. The results (for example, please see Supplementary Material) will be processed using the DEMATEL-based ANP method. To calculate the method according to Khan et al. [35]:
1.
Obtain the matrix of direct influence from the expert panel that shows the impact of factor i on factor j represented by
x h = x i j h
2.
The next stage is to form a direct relation matrix (Z). The matrix can be obtained using the following equation:
z = z 11 z 12 z 21 z 22 z 1 m z 2 m z n 1 z n 2 z n m
3.
The third stage is to form a normalized direct relation matrix (D). Normalized direct relation matrix (D) can be calculated using
Z = H h = 1 Z h H ,   h = 1 ,   2 ,   ,   H   and   D = λ × H
4.
Calculate total relation matrix (T)
λ = min 1 m a x 1 i n   j n z i j , 1 m a x 1 i n   j n z i j
5.
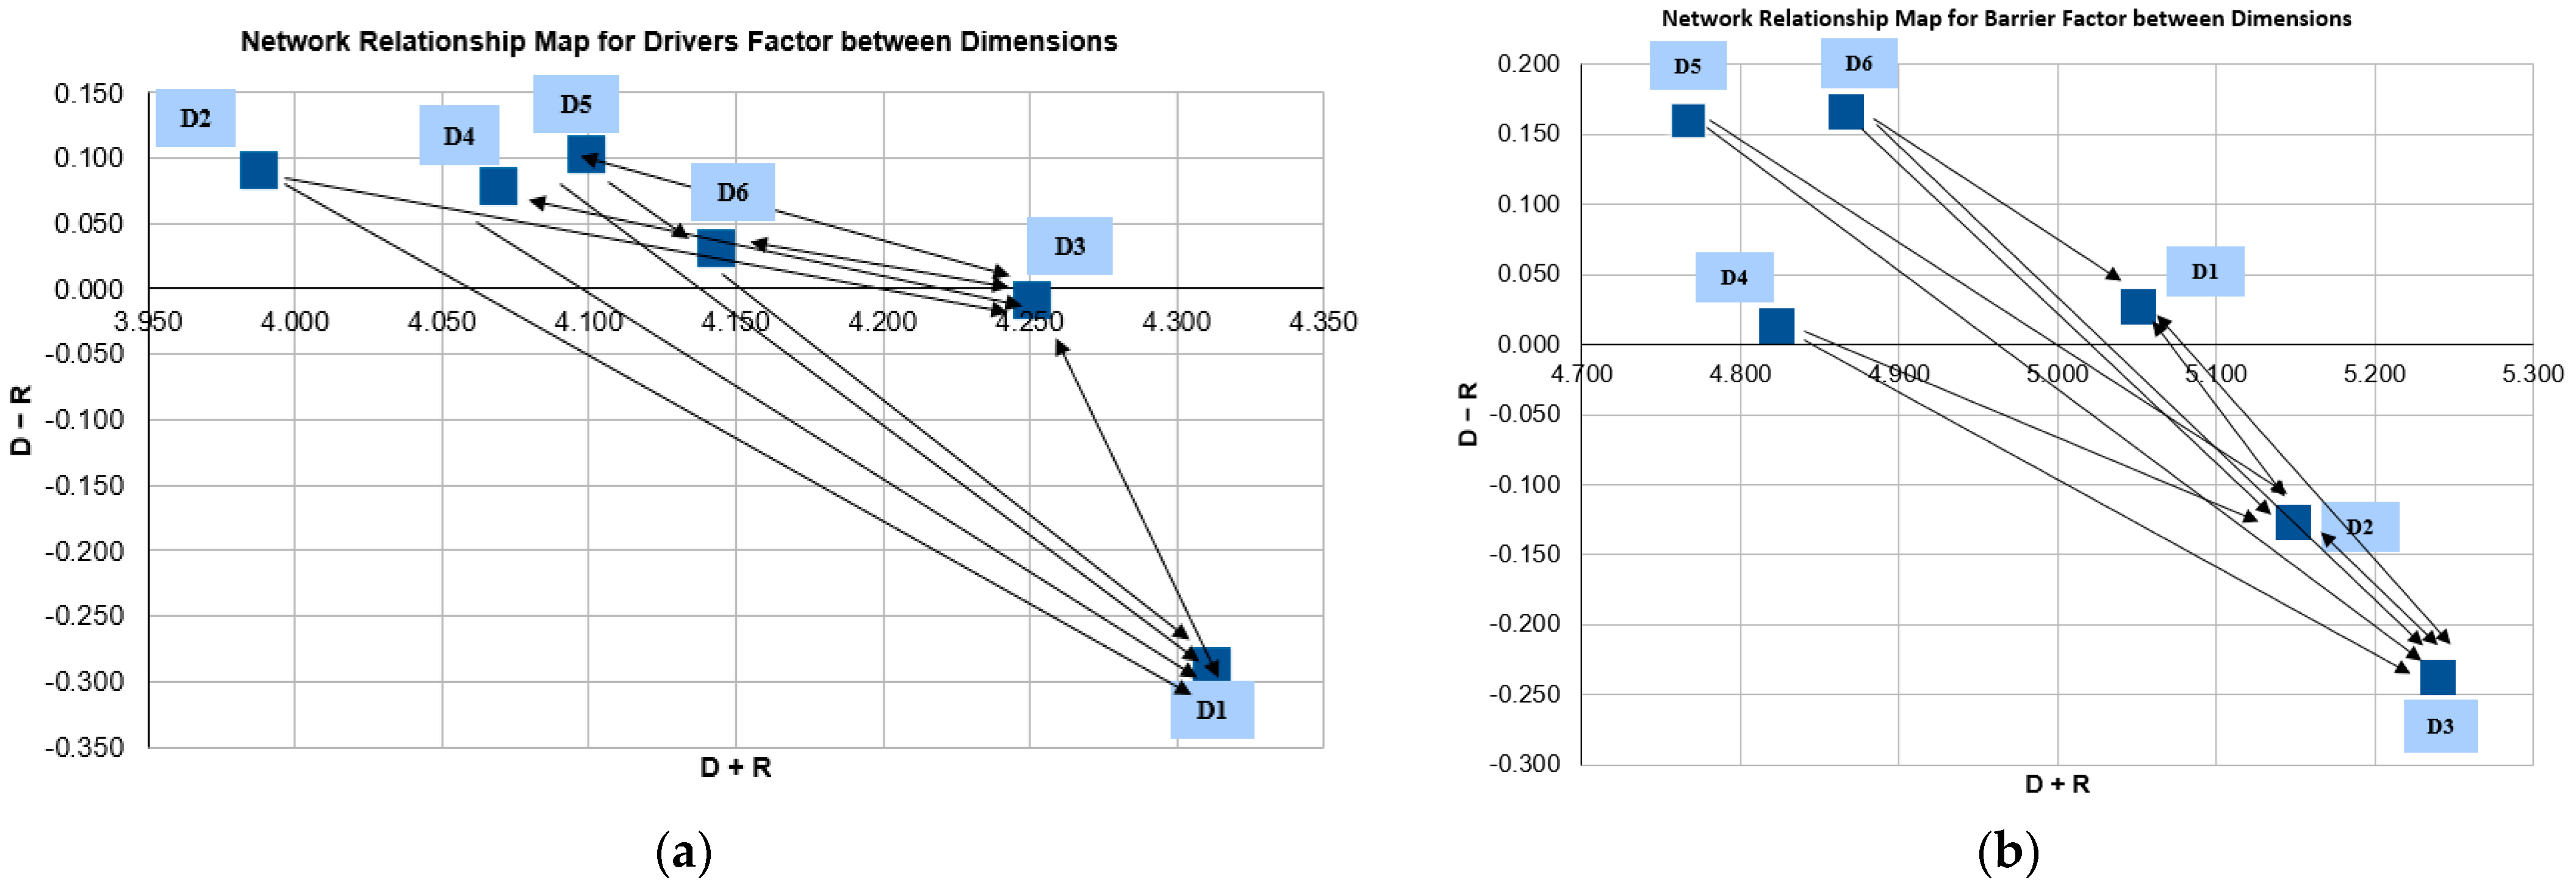
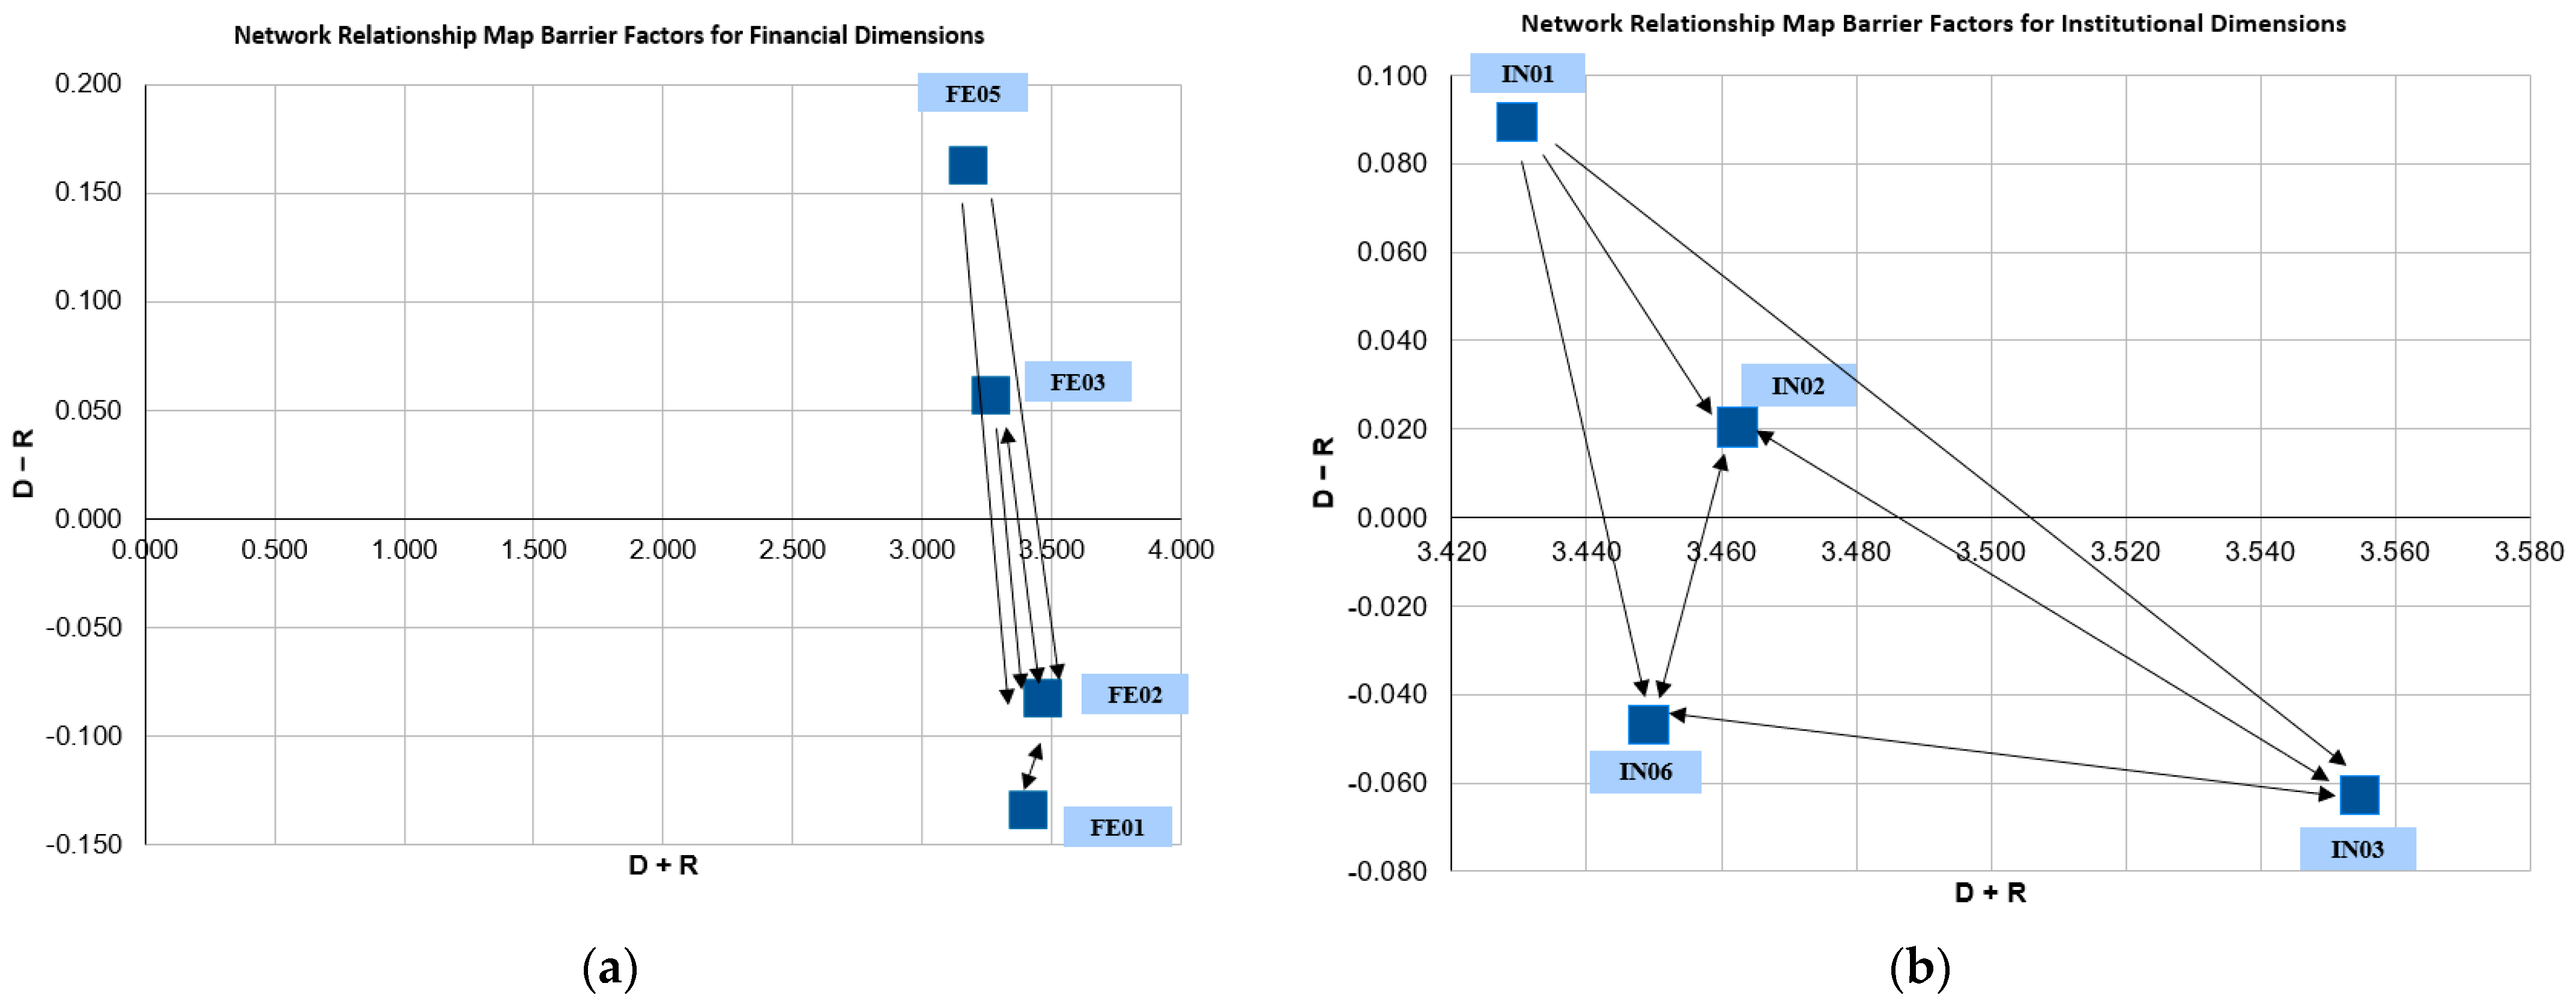
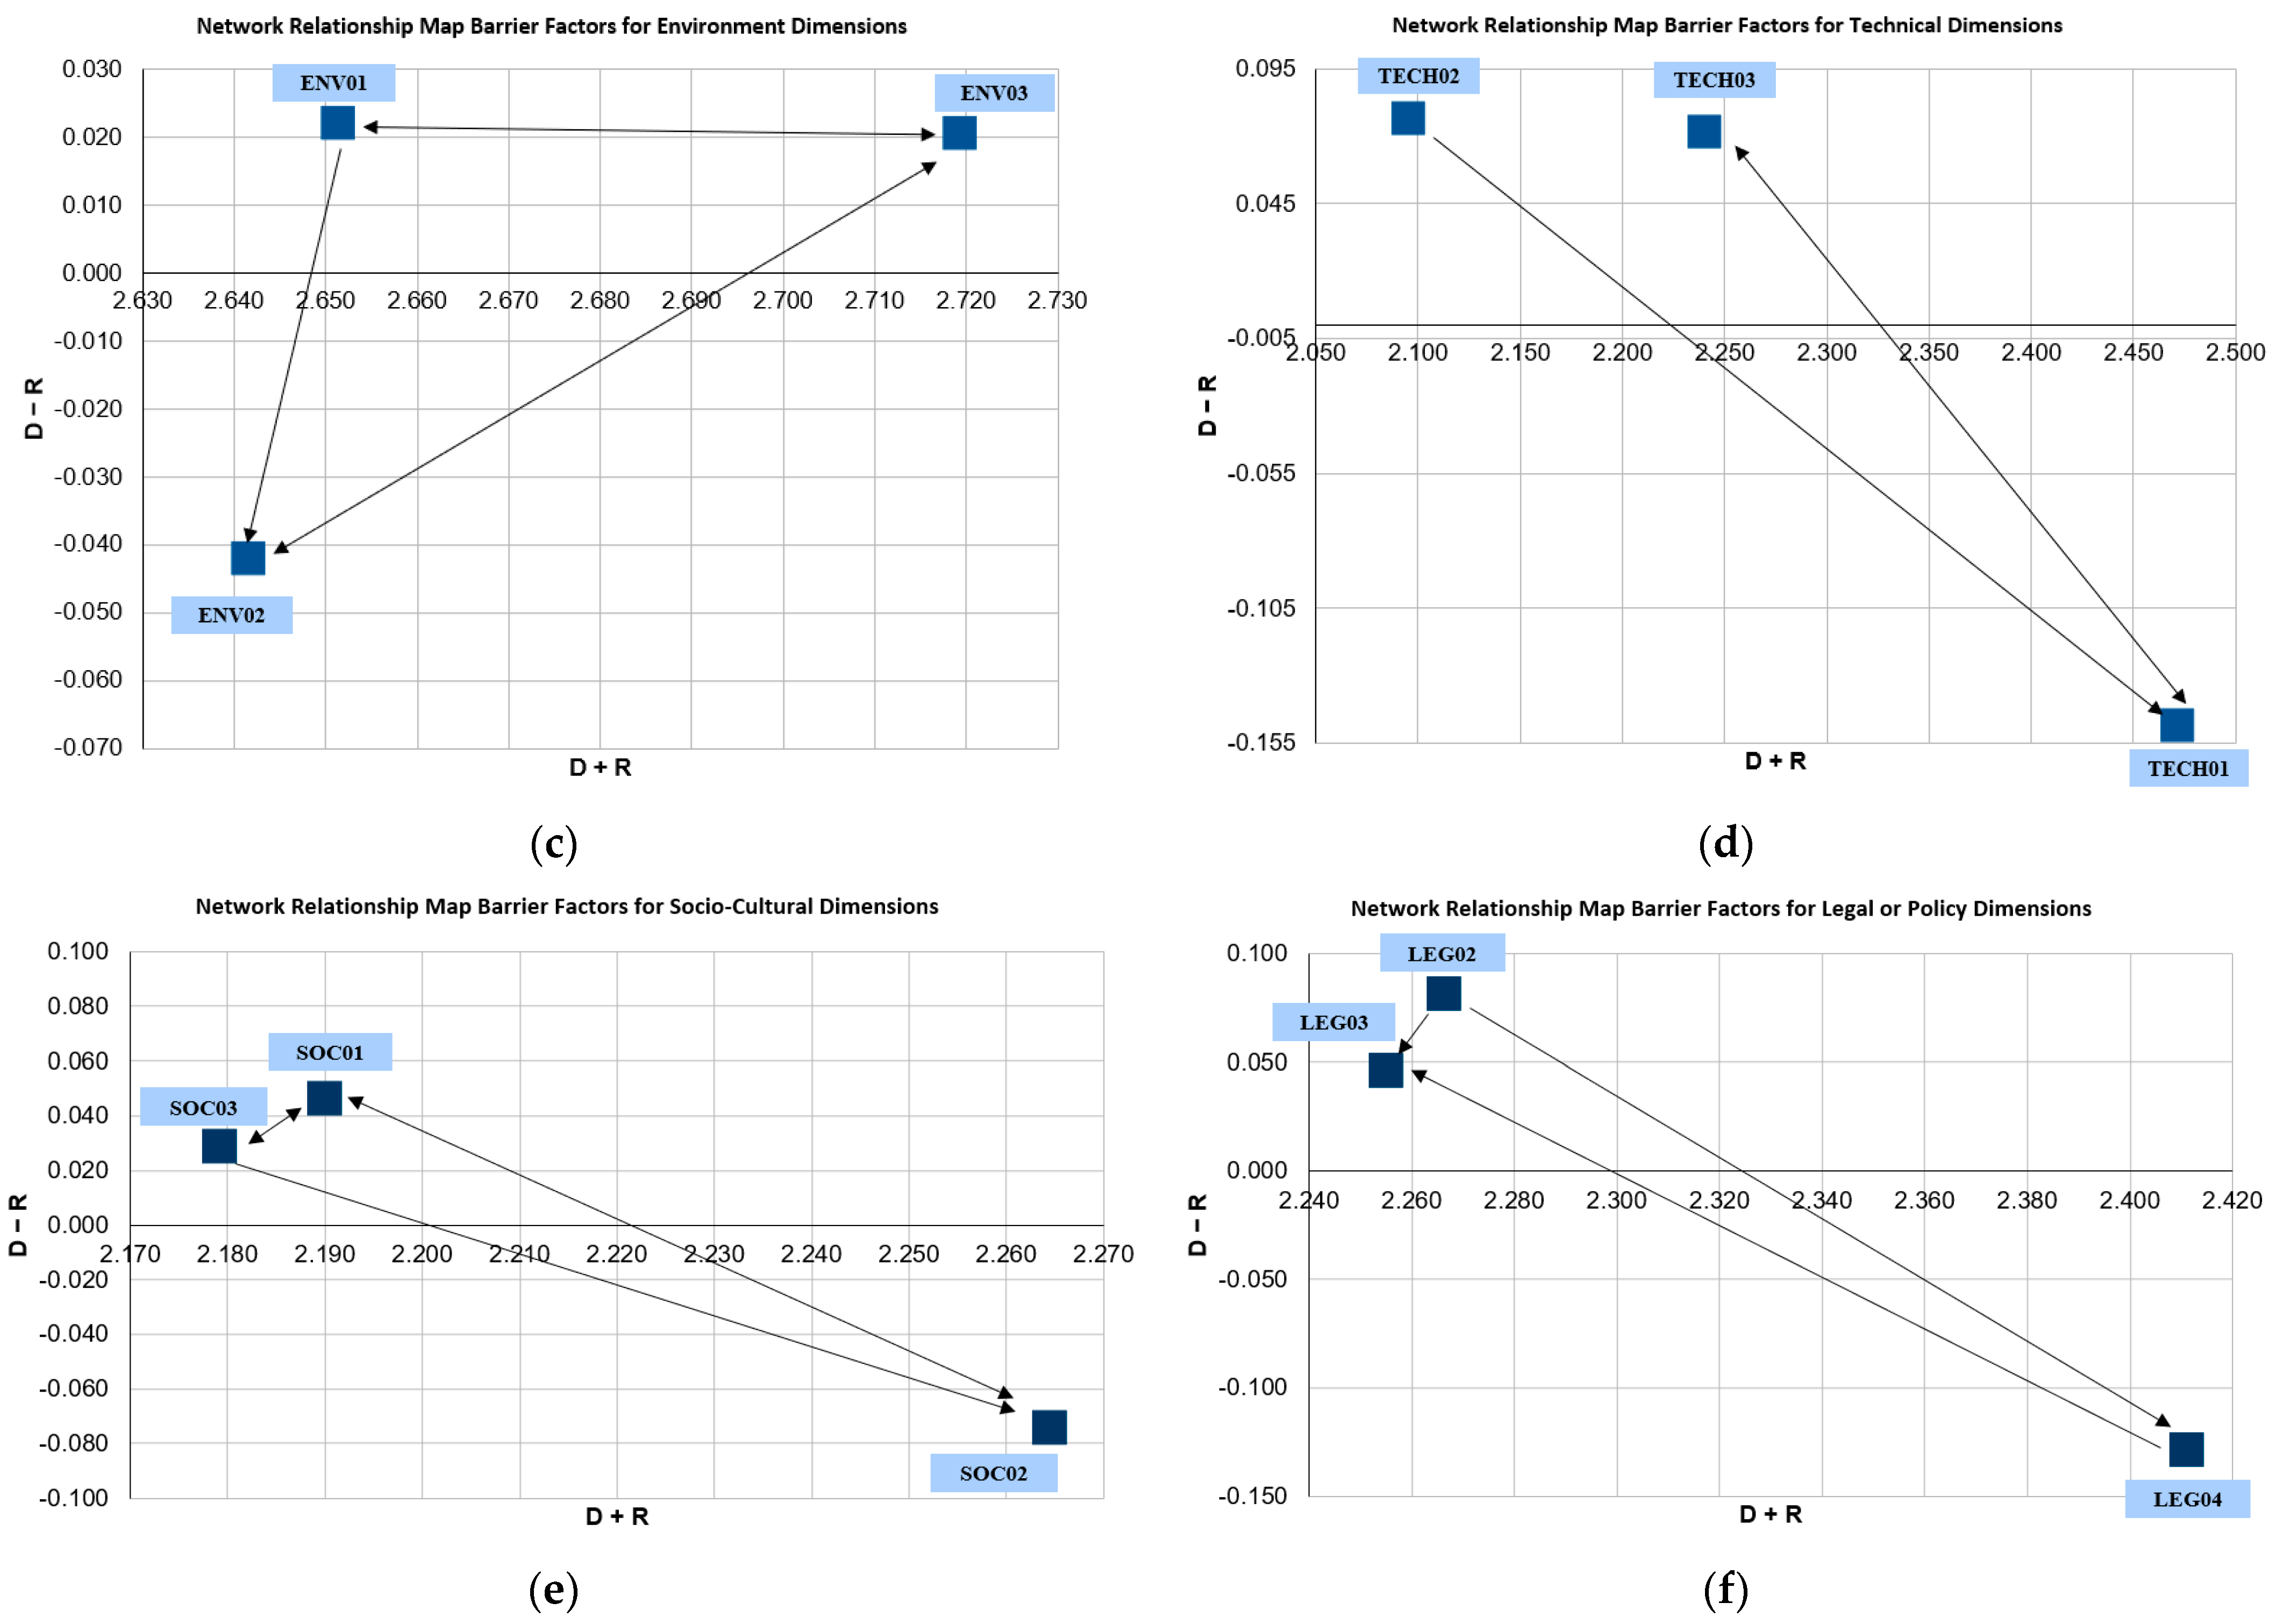
The fifth stage is to calculate the Network Relationship Map (NRM) obtained from the following parameters:
T = [ t i j ] n x n   i , j = 1 ,   2 ,   ,   n   and   D i = [ i = 1 n t i j ] n x 1 = [ t i j ] n x 1
6.
The sum of the rows of the T matrix is represented by Di, which shows the effect of factor i on the other factors. Furthermore, the sum of the columns of the T matrix is represented by Ri, which shows the influence on factor j by other factors. Based on the values of Di + Ri and DiRi, a Network Relationship Map (NRM) can be formed. The individual influence of one factor on another is represented through arrows on the NRM. A threshold value needs to be selected to determine the individual influence between factors. This threshold value is calculated through the total relation matrix (T) average for each dimension and factor. When the value of the elements in the total relation matrix (T) exceeds the threshold value, an arrow will be drawn on the NRM. This indicates a direct relationship between factors. The sixth step is to form a normalized total relation matrix. The total relation matrix (T) includes TD for dimensions and TC for factors.
7.
The next stage is to form an unweighted supermatrix (W). The T C n o r m matrix is obtained after normalizing total relation matrix (T). Next, the T C n o r m matrix is transposed to obtained unweighted supermatrix (W). The weighted supermatrix is obtained by multiplying unweighted supermatrix (W) with T D n o r m transpose.
8.
The last step is to obtain the factor weights. The factor obtained by limiting the weighted supermatrix ( w ) until the supermatrix is stable. The element values in the limit supermatrix are the weights of each factor.

3. Results

The initial results of the DEMATEL-based ANP method produce weights to determine the priority and importance of each dimension and indicator that was shown in Table 5 and Table 6.
Based on Table 5, the greater the global weight of the dimensions, the greater the influence of the driving factor for implementing waste management in construction industries. The top three global driving factors are financial or economic, environmental, and legal or policy-based factors. Moreover, the top five global driver factors are awareness, protection area, client request, cost reduction awareness, and compensation.
Based on Table 6, the greater the global weight of the dimensions, the greater the influence of the barrier factor for implementing waste management in construction industries. The top three driving global factors are environmental, institutional, and financial or economic factors. Moreover, the top five global barrier factors are knowledge, environmental awareness, training, education, and policy enforcement.
Figure 2 and Figure 3 show that the higher the position of a dimension, the more it influences other dimensions. Figure 2 shows that for the driving factor, the institutional dimension is the dimension that most influences other dimensions, and the financial/economic dimension is the dimension that tends to be influenced by other dimensions. Meanwhile, Figure 3 shows that the socio-cultural dimension of the barrier factors is the dimension that most influences other dimensions, and the environmental dimension is the dimension that tends to be influenced by other dimensions.
Figure 3 shows the relationship between the driving factors in each dimension. In the financial/economic dimension, the high disposal cost factor (FE06) is dominant over the other factors; this shows that the FE06 factor has a greater influence on other factors. This happen because the D − R score for F06 is the highest score compared with other factors. The D − R score for FE06 is 0.093. Meanwhile, the factor most influenced by other factors is the compensation factor (FE08). This is so because the D − R score for FE08 is the lowest at −0.053. In the social–cultural dimension, the client demand factor (SOC05) is dominant over other factors; this shows that the SOC05 factor has a greater influence on other factors. The D − R score for SOC05 is 0.049. Meanwhile, the factor most influenced by other factors is the Protection Area (SOC04), with a D − R score of −0.049. For the legal/policy dimension, the factor that has the greatest influence on other factors is Authorization (LEG05), with a D − R score of 0.067, and the factor most influenced by other factors is Special Regulations (LEG07), with a D − R score of −0.045. In the institutional dimension, the factor that has the greatest influence on other factors is the competitors’ factor (IN10), with a D − R score of 0.109, and the factor most influenced by other factors is culture (IN07), with a D − R score of −0.121. In the technical dimension, the factor that has the greatest influence on other factors is Low-Waste Technology (TECH07), with a D − R score of 0.150, while the factor that is most influenced by other factors is procedure development (TECH 05), with a D − R score of −0.100.
Figure 4 shows the relationship between the barrier factors in each dimension. In the financial or economic dimension, profit prioritization (FE05) is in the highest position of the other factors. This is caused by the higher D − R score of 0.168; this shows that the FE05 factor has a more significant influence on other factors, while the factor that is most influenced by other factors is the higher project cost factor (FE01) with a D − R score of −0.135. Meanwhile, in the social–cultural dimension, the demand factor (SOC01) is predominant over other factors. This shows that the SOC01 factor significantly influences other factors, with a D − R score of 0.046. The factor most influenced by other factors is the conventional procedure (SOC02), with a D − R score of −0.075. In the legal/policy dimension, the factor that has the most significant influence on other factors is the operation factor (LEG02), with a D − R score of 0.082, and the factor most influenced by other factors is information (LEG04), with a D − R score of −0.128. In the institutional dimension, the factor with the most significant influence on other factors is the coordination factor (IN01), with a D − R score of 0.089. The factor most influenced by other factors is the support and commitment factor (IN03), with a D − R score of −0.063. In the technical dimension, the factor that has the most significant influence on other factors is space limitations (TECH02), with a D − R score of 0.077, while the factor that is most influenced by other factors is knowledge (TECH 01), with a D − R score of −0.149. In the environmental dimensions, education (ENV01) significantly influences other factors, with a D − R score of 0.022. In contrast, the factor most influenced by other factors is training (ENV02), with a D − R score of −0.042.

4. Discussion

4.1. Financial or Economic Dimensions

In the financial dimension, the driver’s high disposal cost (FE06) is a motivating factor that tends to influence other financial dimensions. This can be seen in the NRM graph, where the high disposal cost holds the highest position compared to other factors. This indicates that the high cost of disposing of construction waste directly in landfills can impact awareness in reducing costs through raw material savings and minimizing penalty costs. This is supported by Nawaz et al. [36], which suggests that penalty costs could force construction managers to control the waste generated.
Profit prioritization (FE05) is the barrier that tends to influence other financial dimensions. From the NRM, FE05 holds the highest position compared to other factors. This indicates that a company’s primary focus on profitability over environmental concerns can affect its reluctance to incur expenses for waste management due to the perceived high costs, creating the perception that waste reduction activities do not lead to cost savings. According to Udawatta et al. [37], profit maximization treats waste management as an activity contributing significantly to project expenses. The author asserts that organizations prioritize profit maximization as their primary objective, leading to the hesitancy in adopting environmentally friendly measures for waste management unless they prove to be profitable.

4.2. Institutional Dimensions

In the institutional dimension, competitors (IN10) are a driver that tends to influence other institutional dimensions. This is evident in the NRM graph, where the IN10 factor holds the highest position compared to other factors. This indicates that mimicking competitors by implementing waste management in their companies to stay competitive can have an impact on enhancing the company’s reputation and fostering a culture of waste management. Therefore, with an improved corporate reputation, consumer interest in the produced goods can be heightened. This can also be supported by Foltean et al. [38], who found that using social media is influenced by what customers and competitors are doing, and how well a company performs is indirectly affected by how they manage relationships with customers using technology.
On the other hand, coordination (IN01) is a barrier factor that tends to influence other institutional dimensions due to its higher position in the NRM compared to other factors. This suggests that a lack of coordination among different divisions of the company regarding the implementation of waste management can lead to inadequate support, commitment, and waste management standard operating procedures (SOPs). According to Nykvist et al. [39], barriers such as communication problems involving stakeholders, institutional issues, and limited resources can make it challenging to carry out a project.

4.3. Environmental Dimensions

Awareness (ENV04) is the only factor encompassed in the environmental dimension, thus neither influencing nor being influenced by other driving factors in the environmental dimension. Conversely, education (ENV01) as a barrier factor in the environmental dimension occupies the highest position in the NRM. This indicates that the ENV01 factor influences other hindrance factors; in other words, a lack of education related to sustainable building can affect waste management practices in construction workers and contribute to a lack of environmental awareness within the industry, decision-makers, policymakers, and relevant stakeholders. This notion is supported by Yusuf and Fajri [40], who emphasize that environmental education imparts knowledge, shapes attitudes toward waste management, and guides individuals toward sound and proper waste management intentions and behaviors [40].

4.4. Technical Dimensions

In the technical dimension, Low-Waste Technology (TECH07) is a driving factor influencing other technical dimensions. This is because implementing methods that minimize waste production with a focus on efficiency and recycling can impact procedure development (TECH05) or the development of specifications for using recycled materials. For example, further identification of procedures is required to implement Low-Waste Technology (LWT), specifically waste handling and disposal measures [41].
On the barrier factor, space limitations (TECH02) tend to influence other factors, such as knowledge (TECH01) and operator skills (TECH03). Limited space intensifies the need for advanced and optimized waste management practices, including eco-technologies. A comprehensive approach considering knowledge enhancement and operator skills is necessary for developing and implementing effective waste management strategies in confined construction site spaces.

4.5. Socio-Cultural Dimensions

In the driving factor of client request (SOC05), a cohesive relationship exists between the increasing demand from clients for sustainable buildings and projects located near environmentally protected areas. In accordance with the opinion of Pollington [42], achieving sustainable development involves using different ways to obtain resources that consider ethics, human rights, better environmental standards, performance specifications, and taking into account the cultural values of clients. The rise in client demand reflects an awareness of sustainability and can motivate the construction industry to adopt more environmentally friendly construction practices. On the other hand, project locations near environmentally protected areas necessitate implementing high standards for construction waste management to minimize negative impacts. Both these factors, client demand focusing on sustainability and project locations considering environmental protection, collectively provide incentives for the construction industry to engage in and enhance waste management practices. Consequently, this overall context urges the construction industry to integrate more effective waste management strategies to impact the surrounding environment positively.
As for the barrier factor, demand (SOC01) is the most influential among other factors. In other words, low client demand for purchasing sustainable buildings can complicate the construction industry’s transition to waste management practices. This happens because, without a demand for sustainable construction, the construction industry may neglect waste management in building those structures, leading to the belief that efforts to reduce waste are never sufficient. This is supported by Udawatta et al. [37], who state that Australian construction projects encounter significant challenges in managing waste, and human factors play a more prominent role.

4.6. Legal or Policy Dimensions

Authorization (LEG05) is a driver factor that tends to influence other legal or policy dimensions. This is evident in the NRM graph, where the LEG05 factor holds the highest position compared to other factors. This indicates that when the government grants authority to a company to manage construction waste within its premises, it can alter the company’s perception of utilizing materials that can be recycled. For instance, in Indonesia, the government mandates all developers and managers of tall buildings to adhere to green building principles, where one requirement is recyclable materials [43].
As for the barrier factor, operation (LEG02) is a factor that tends to influence other legal or policy dimensions. This suggests that lax and unclear policies can make waste management more challenging. For example, Australia, China, and India implemented regulations regarding the operation of construction waste management [44].

4.7. Priority Level

Based on global weight, the most influential factor driving the implementation of waste management in the construction industry is awareness (ENV03). This indicates that a high level of environmental awareness among industry stakeholders, political decision-makers, and clients can enhance the adoption of waste management practices in construction companies. This assertion aligns with the findings of Hasan [45], where he suggests that awareness and participation can lead to successful waste management [45]. According to Ramos et al. [46], awareness is essential for promoting construction waste management on a local scale [46].
Another top two factors that drive Indonesian construction industries to implement waste management in their companies are Protection Area and client request. Research by Wilson [47] identifies six broad groups of drivers for development in waste management, with environmental protection or Protection Area emerging as a key driver in the 1970s, characterized by an initial focus on eliminating uncontrolled disposal and a systematic increase in technical standards. Yilmaz’s research [48] highlights the impact of client demand on sustainable construction practices, including eco-friendly and smart buildings, signifying the increasing importance of environmental concerns and resource conservation within the construction industry.
For the barrier factor, the highest global weight is attributed to the knowledge factor (TECH01). This suggests that a lack of knowledge on how to implement waste management effectively and properly can hinder the adoption of waste management in the construction industry. This is consistent with the research of Munaro et al. [49], which states that a lack of knowledge serves as a barrier to implementing awareness of waste management in society [49]. Zhang et al. [50] emphasize that smart waste management encounters barriers primarily due to a deficiency in regulatory pressures and environmental awareness. These factors hinder the transition towards a circular economy and pose significant challenges to waste management sustainability. Also, Park and Tucker [25] suggest that inadequate training poses a significant barrier to the reuse of construction waste, undermining the proactive and sustainable implementation of waste reuse strategies.

4.8. Waste Management in Indonesian Construction Industries

Bappenas has been focused on enhancing waste management within the construction industry, considering an anticipated 82% rise in construction industry waste by 2030. To comprehend this matter, Bappenas examined the potential impediments to implementing waste management in Indonesia [3].
Initially, one of the reasons for the low and impeded waste management is the lack of education regarding waste management. This aligns with the findings of the research conducted by the authors, indicating that a lack of knowledge is one of the barriers to implementing waste management in Indonesia. Moreover, based on the environmental barrier diagram, it is evident that a lack of education can diminish policymakers’ awareness of waste management, as elucidated in the report by Bappenas. The report suggests that efforts to enhance waste management awareness can make the government more aware and launch various programs to improve the construction waste management rate. To address the abovementioned barrier, the government recommends increasing awareness regarding the environment within the construction industry by enhancing education and training [3].
Moreover, due to the company’s primary emphasis on profitability over environmental considerations, it is also supported by the Green Building Council Indonesia (GBCI). GBCI mentions that many developers perceive adopting environmentally friendly building practices as costly, prompting the Indonesian government to suggest implementing project financing that supports waste management to avoid capital shortages and demonstrate a greater willingness to allocate expenses towards waste management [3].
Research on construction and demolition (C&D) waste generated in projects in Indonesia highlights that slow decision-making, improper decision-making practices, and unskilled labor contribute to waste generation. Consequently, a lack of knowledge regarding these factors among project managers can hinder waste reduction at the site [3]. This deficiency may stem from insufficient information on environmental norms by the government to companies.
Furthermore, various drivers can address several barriers. For example, the perception that waste reduction activities are not cost-effective can be mitigated by using more sustainable materials. Additionally, low client requests can be addressed through the reuse and recycling of materials, while insufficient information can be tackled through strict regulation and special regulation [3].

5. Conclusions

This research examines the factors that most encourage and hinder the construction industry in Indonesia from implementing waste management in their companies. This study also explores the relationships and interconnections among factors and dimensions.
  • Awareness is the foremost driving factor for the construction industry’s implementation of waste management. This is supported by Hasan’s research in 2004 [45], where he stated that awareness and participation can lead to successful waste management.
  • Knowledge can hinder the construction industry’s implementation of waste management. Insufficient knowledge regarding properly implementing construction waste management can impede its adoption.
  • Research limitation: This research only relies on questionnaires. Therefore, interviews or focus group discussions (FGDs) could be conducted for future research to obtain more accurate and insightful responses. Additionally, further analysis of the specific results of this research can be undertaken by subsequent researchers.
  • Future studies: Since there is much data involved, the authors recommend, for future studies, the use of machine learning techniques to identify patterns and analyze the data.

6. Practical Implications

Recommendations for the government include enhancing awareness and knowledge among the construction industry and its workers regarding waste management. This could contribute to achieving the target adoption of circular economy practices in the construction industry by 2030. This research examines the factors that most encourage and hinder the construction industry in Indonesia from implementing waste management in their companies. This study also explores the relationships and interconnections among factors and dimensions.

Supplementary Materials

The following supporting information can be downloaded at: https://www.mdpi.com/article/10.3390/su16062264/s1.

Author Contributions

Conceptualization, S.N.I. and R.A.; Methodology, S.N.I.; Validation, S.N.I.; Formal analysis, S.N.I., R.A. and S.A.P.; Data curation, S.N.I. and S.A.P.; Writing—original draft, S.N.I.; Writing—review & editing, R.A., S.K. and S.A.P.; Visualization, S.N.I. and S.A.P.; Supervision, R.A. and S.K.; Project administration, R.A.; Funding acquisition, R.A. and S.K. All authors have read and agreed to the published version of the manuscript.

Funding

This study was funded by Universitas Indonesia, Depok, Indonesia, through Hibah Publikasi Terindeks Internasional (PUTI) Q2 2023–2024, grant number NKB-835/UN2.RST/HKP.05.00/2023.

Institutional Review Board Statement

Not applicable.

Informed Consent Statement

Not applicable.

Data Availability Statement

The data presented in this study are available on request from the corresponding author.

Conflicts of Interest

The authors declare no conflicts of interest.

References

  1. Indonesia Population. 2023. Available online: https://www.worldometers.info/world-population/indonesia-population/ (accessed on 6 January 2024).
  2. 7,2 Juta Ton Sampah di Indonesia Belum Terkelola Dengan Baik. 2023. Available online: https://www.kemenkopmk.go.id/72-juta-ton-sampah-di-indonesia-belum-terkelola-dengan-baik#:~:text=7%2C2JutaTonSampahdiIndonesiaBelumTerkelolaDenganBaik,-Gatot%3AButuhRevolusi&text=Daritotalproduksisampahnasional,tonbelumterkeloladenganbaik (accessed on 6 January 2024).
  3. Bappenas. Manfaat Ekonomi, Sosial, dan Lingkungan dari Ekonomi Sirkular di Indonesia. 2021. Available online: https://lcdi-indonesia.id/wp-content/uploads/2021/02/Ringkasan-Eksekutif-Manfaat-Ekonomi-Sosial-dan-Lingkungan-dari-Ekonomi-Sirkular-di-Indonesia.pdf (accessed on 10 January 2024).
  4. Kulatunga, U.; Amaratunga, D.; Haigh, R.; Rameezdeen, R. Attitudes and perceptions of construction workforce on construction waste in Sri Lanka. Manag. Environ. Qual. Int. J. 2006, 17, 57–72. [Google Scholar] [CrossRef]
  5. Tafesse, S.; Girma, Y.E.; Dessalegn, E. Analysis of the socio-economic and environmental impacts of construction waste and management practices. Heliyon 2022, 8, e09169. [Google Scholar] [CrossRef]
  6. Perkembangan Industri Konstruksi Indonesia. Available online: https://www.archive.bps.go.id/ (accessed on 10 January 2024).
  7. Widhiawati, I.A.R.; Astana, Y.; Indrayani, N.L.A. Kajian Pengelolaan Limbah Konstruksi Pada Proyek Pembangunan Gedung di Bali. Ilm. Tek. Sipil 2019, 23, 55–61. [Google Scholar]
  8. Yahya, K.; Halim Boussabaine, A. Eco-costing of construction waste. Manag. Environ. Qual. Int. J. 2006, 17, 6–19. [Google Scholar] [CrossRef]
  9. Kong, L.; Ma, B. Evaluation of environmental impact of construction waste disposal based on fuzzy set analysis. Environ. Technol. Innov. 2020, 19, 100877. [Google Scholar] [CrossRef]
  10. ISO 14001:2015; Environmental Management Systems. International Organization for Standardization: Geneva, Switzerland. Available online: https://www.iso.org/obp/ui/#iso:std:iso:14001:ed-3:v1:en (accessed on 10 January 2024).
  11. Jumlah Perusahaan yang Menerapkan ISO 14001. Available online: https://www.bps.go.id/id/statistics-table/2/MTc0NCMy/jumlah-perusahaan-yang-menerapkan-sertifikasi-sni-iso-14001.html (accessed on 14 January 2024).
  12. Mhatre, P.; Gedam, V.V.; Unnikrishnan, S.; Raut, R.D. Circular economy adoption barriers in built environment- a case of emerging economy. J. Clean. Prod. 2023, 392, 136201. [Google Scholar] [CrossRef]
  13. Lee, C.; Chen, M.; Zainudin, N.; Fauzi, M.; Toh, T. Transformation of Industrial Revolution 4.0 in the Construction Industry: Understanding Drivers Barriers with Dematel Algorithm. Int. J. Ind. Manag. 2022, 16, 31–43. [Google Scholar] [CrossRef]
  14. Yadav, H.; Soni, U.; Kumar, G. Analysing Challenges to Smart Waste Management for a Sustainable Circular Economy in Developing countries: A fuzzy DEMATEL study. Smart Sustain. Built Environ. 2021, 12, 361–384. [Google Scholar] [CrossRef]
  15. Al-Otaibi, A.; Bowan, P.A.; Abdel Daiem, M.M.; Said, N.; Ebohon, J.O.; Alabdullatief, A.; Al-Enazi, E.; Watts, G. Identifying the Barriers to Sustainable Management of Construction and Demolition Waste in Developed and Developing Countries. Sustainability 2022, 14, 7532. [Google Scholar] [CrossRef]
  16. Ratnasabapathy, S.; Alashwal, A.; Perera, S. Exploring the barriers for implementing waste trading practices in the construction industry in Australia. Built Environ. Proj. Asset Manag. 2021, 11, 559–576. [Google Scholar] [CrossRef]
  17. Kabirifar, K.; Mojtahedi, M.; Wang, C.; Tam, V.W.Y. Construction and demolition waste management contributing factors coupled with reduce, reuse, and recycle strategies for effective waste management: A review. J. Clean. Prod. 2020, 263, 121265. [Google Scholar] [CrossRef]
  18. Ajayi, S.O.; Oyedele, L.O.; Akinade, O.O.; Bilal, M.; Owolabi, H.A.; Alaka, H.A.; Kadiri, K.O. Reducing waste to landfill: A need for cultural change in the UK construction industry. J. Build. Eng. 2016, 5, 185–193. [Google Scholar] [CrossRef]
  19. Zhao, X. Stakeholder-Associated Factors Influencing Construction and Demolition Waste Management: A Systematic Review. Buildings 2021, 11, 149. [Google Scholar] [CrossRef]
  20. Ullah, F.; Sepasgozar, S.M.E.; Jamaluddin Thaheem, M.; Cynthia Wang, C.; Imran, M. It’s all about perceptions: A DEMATEL approach to exploring user perceptions of real estate online platforms. Ain Shams Eng. J. 2021, 12, 4297–4317. [Google Scholar] [CrossRef]
  21. Chiu, W.Y.; Tzeng, G.H.; Li, H.L. A new hybrid MCDM model combining DANP with VIKOR to improve e-store business. Knowl. Based Syst. 2013, 37, 48–61. [Google Scholar] [CrossRef]
  22. Kamranfar, S.; Azimi, Y.; Gheibi, M.; Fathollahi-Fard, A.; Hajiaghaei-Keshteli, M. Analyzing Green Construction Development Barriers by a Hybrid Decision-Making Method Based on DEMATEL and the ANP. Buildings 2022, 12, 1641. [Google Scholar] [CrossRef]
  23. Wu, W. Choosing knowledge management strategies by using a combined ANP and DEMATEL approach. Expert Syst. Appl. 2008, 35, 828–835. [Google Scholar] [CrossRef]
  24. Abarca-Guerrero, L.; Maas, G.; van Twillert, H. Barriers and Motivations for Construction Waste Reduction Practices in Costa Rica. Resources 2017, 6, 69. [Google Scholar] [CrossRef]
  25. Park, J.; Tucker, R. Overcoming barriers to the reuse of construction waste material in Australia: A review of the literature. Int. J. Constr. Manag. 2017, 17, 228–237. [Google Scholar] [CrossRef]
  26. Baker, J.; Lovell, K.; Harris, N. How expert are the experts? An exploration of the concept of ‘expert’ within Delphi panel tech-niques. Nurs. Res. 2006, 14, 59–70. [Google Scholar] [CrossRef] [PubMed]
  27. Sugiharni, G.A.D. Pengujian Validitas Konten Media Pembelajaran Interaktif Berorientasi Model Creative Problem Solving. J. Penelit. Dan Pengemb. Pendidik. 2018, 2, 88. [Google Scholar] [CrossRef]
  28. Yusoff, M.S.B. ABC of Content Validation and Content Validity Index Calculation. Educ. Med. J. 2019, 11, 49–54. [Google Scholar] [CrossRef]
  29. Almanasreh, E.; Moles, R.; Chen, T.F. Evaluation of methods used for estimating content validity. Res. Soc. Adm. Pharm. 2019, 15, 214–221. [Google Scholar] [CrossRef]
  30. Garvin, B.J.; Kennedy, C.W.; Cissna, K.N. Reliability in category coding systems. Nurs. Res. 1988, 37, 52–55. [Google Scholar] [CrossRef] [PubMed]
  31. Topf, M. Three estimates of interrater reliability for nominal data. Nurs. Res. 1986, 35, 253–255. [Google Scholar] [CrossRef] [PubMed]
  32. Crocker, L. Content Validity. In International Encyclopedia of the Social Behavioral Sciences, 2nd ed.; Elsevier Ltd.: Amsterdam, The Netherlands, 2015; Volume 1, pp. 774–777. [Google Scholar] [CrossRef]
  33. Cicchetti, D.V.; Sparrow, S.A. Developing criteria for establishing interrater reliability of specific items: Applications to assessment of adaptive behavior. Am. J. Ment. Defic. 1981, 86, 127–137. [Google Scholar]
  34. Chen, F.H.; Hsu, T.S.; Tzeng, G.H. A balanced scorecard approach to establish a performance evaluation and relationship model for hot spring hotels based on a hybrid MCDM model combining DEMATEL and ANP. Int. J. Hosp. Manag. 2011, 30, 908–932. [Google Scholar] [CrossRef]
  35. Khan, S.; Maqbool, A.; Haleem, A.; Khan, M.I. Analyzing critical success factors for a successful transition towards circular economy through DANP approach. Manag. Environ. Qual. Int. J. 2020, 31, 505–529. [Google Scholar] [CrossRef]
  36. Nawaz, A.; Chen, J.; Su, X.; Zahid Hassan, H.M. Material Based Penalty-Cost Quantification Model for Construction Projects Influencing Waste Management. Front. Environ. Sci. 2022, 10, 807359. [Google Scholar] [CrossRef]
  37. Udawatta, N.; Zuo, J.; Chiveralls, K.; Yuan, H.; Zillante, G.; Elmualim, A. Major factors impeding the implementation of waste management in Australian construction projects. J. Green Build. 2018, 13, 101–121. [Google Scholar] [CrossRef]
  38. Foltean, F.S.; Trif, S.M.; Tuleu, D.L. Customer relationship management capabilities and social media technology use: Consequences on firm performance. J. Bus. Res. 2019, 104, 563–575. [Google Scholar] [CrossRef]
  39. Nykvist, B.; Borgström, S.; Boyd, E. Assessing the adaptive capacity of multi-level water governance: Ecosystem services under climate change in Mälardalen region, Sweden. Reg. Environ. Chang. 2017, 17, 2359–2371. [Google Scholar] [CrossRef]
  40. Yusuf, R.; Fajri, I. Differences in behavior, engagement and environmental knowledge on waste management for science and social students through the campus program. Heliyon 2022, 8, e08912. [Google Scholar] [CrossRef]
  41. Zhang, X.; Wu, Y.; Shen, L. Application of low waste technologies for design and construction: A case study in Hong Kong. Renew. Sustain. Energy Rev. 2012, 16, 2973–2979. [Google Scholar] [CrossRef]
  42. Pollington, C. Legal and procurement practices for sustainable development. Build. Res. Inf. 1999, 27, 409–411. [Google Scholar] [CrossRef]
  43. Kompas. Tahun 2010, Pengelola Gedung Tinggi di Jakarta Wajib Terapkan “Green Building.” 2009. Available online: https://biz.kompas.com/read/2009/09/10/18490643/~Megapolitan~News (accessed on 4 March 2024).
  44. Pidugu, A.; Khandelwal, U.; Rathi, R. C and D Waste Treatment and Policies in Australia, China, and India: A Comparative Study. NICMAR-J. Constr. Manag. 2023, 37, 227–233. [Google Scholar]
  45. Hasan, S.E. Public Awareness Is Key to Successful Waste Management. J. Environ. Sci. Health—Part A Toxic/Hazard. Subst. Environ. Eng. 2004, 39, 483–492. [Google Scholar] [CrossRef]
  46. Ramos, M.; Martinho, G.; Pina, J. Strategies to promote construction and demolition waste management in the context of local dynamics. Waste Manag. 2023, 162, 102–112. [Google Scholar] [CrossRef]
  47. Wilson, D. Development drivers for waste management. Waste Manag. Res. 2007, 25, 198–207. [Google Scholar] [CrossRef]
  48. Yilmaz, M. Sustainability in Construction Sector. Procedia—Soc. Behav. Sci. 2015, 195, 2253–2262. [Google Scholar] [CrossRef]
  49. Munaro, M.R.; Tavares, S.F. A review on barriers, drivers, and stakeholders towards the circular economy: The construction sector perspective. Clean. Responsible Consum. 2023, 8, 100107. [Google Scholar] [CrossRef]
  50. Zhang, A.; Venkatesh, V.; Liu, Y.; Wan, M.; Qu, T.; Huisingh, D. Barriers to smart waste management for a circular economy in China. J. Clean. Prod. 2019, 240, 118198. [Google Scholar] [CrossRef]
Figure 1. Research process flowchart.
Sustainability 16 02264 g001
Figure 2. NRM between dimensions: (a) Drivers Dimensions, (b) Barriers Dimension. The direction of the arrow from the ith factor to the jth factor shows the influence of the “factor i” on “factor j”.
Sustainability 16 02264 g002
Figure 3. Network Relationship Map between driver factors in dimension: (a) financial dimensions, (b) institutional dimension, (c) technical dimensions, (d) socio-cultural dimension (e) legal or policy dimension. The direction of the arrow from the ith factor to the jth factor shows the influence of the “factor i” on “factor j”.
Sustainability 16 02264 g003
Figure 4. Network Relationship Map between barrier factors in dimension: (a) financial dimensions, (b) institutional dimension, (c) technical dimensions, (d) socio-cultural dimension, (e) socio-cultural dimension, (f) legal or policy dimension. The direction of the arrow from the ith factor to the jth factor shows the influence of the “factor i” on “factor j”.
Sustainability 16 02264 g004aSustainability 16 02264 g004b
Table 1. Experts’ information.
ExpertBackgroundExperienceContribution
Expert 1Academia>20 yearsValidating Factors and Pairwise Comparison Questionnaire
Expert 2Quality and Human Safety Environment Manager>20 yearsValidating Factors and Pairwise Comparison Questionnaire
Expert 3Operational Director>20 yearsValidating Factors and Pairwise Comparison Questionnaire
Expert 4Project Engineering Manager5–10 yearsValidating Factors and Pairwise Comparison Questionnaire
Expert 5Commitment-maker15–20 yearsValidating Factors and Pairwise Comparison Questionnaire
Expert 6Head of Commercial Environment5–10 yearsPairwise Comparison Questionnaire
Expert 7Site Engineer Manager5–10 yearsPairwise Comparison Questionnaire
Table 2. Modified Kappa evaluation score [29].
Kappa ScoreInterpretation
<0.40Poor
0.40–0.59Fair
0.60–0.74Good
0.75–1.00Excellent
Table 3. Collected driving factors.
DimensionCodeFactorsDescriptionsKappa ScoreInterpretation
Financial or
Economics (D1)
FE06High
Disposal Cost
The cost of disposal is high when disposing of construction waste directly to the final disposal site0.76Excellent
FE07Cost
Reduction Awareness
There is an awareness of the need to reduce costs by minimizing material loss and conserving raw materials1.00Excellent
FE08CompensationDecreasing legal expenses related to environmental issues (fines, compensation)1.00Excellent
FE09Additional ProfitGaining extra profit by reselling construction waste that can be reused0.13Poor
Institutional (D2)IN07CultureA culture of construction waste management exists within the company0.76Excellent
IN08PromotionProper waste management can enhance the company’s reputation1.00Excellent
IN09Increase Market
Share
Increasing market share and consumer appeal for the produced goods1.00Excellent
IN10CompetitorsFollowing what actions competitors have performed to remain competitive0.42Fair
Environmental (D3)ENV04AwarenessAwareness of the importance of protecting the environment and avoiding environmental pollution by the company1.00Excellent
Technical (D4)TECH04ExperienceThe company already has experience in construction waste management1.00Excellent
TECH05Procedure DevelopmentDevelopment of procedures and specifications for recyclable materials0.76Excellent
TECH06SpaceAdequate space is available for construction waste management0.42Fair
TECH07Low-Waste Technology (LWT)Methods and systems designed to minimize waste production during various processes focusing on efficiency, recycling, and reducing environmental impact0.42Fair
TECH08InvestmentPurchasing equipment or machinery to minimize construction waste as an investment0.05Poor
TECH09ExpertiseImproving the skills of operators in managing construction waste0.05Poor
TECH10Relationship Between SuppliersImproving relationships with suppliers to obtain assistance and information regarding waste management1.00Excellent
Socio-cultural (D5)SOC04Protection AreaProximity to or within the vicinity of local environmental protection areas (water, soil, and air)0.76Excellent
SOC05Client RequestIncreasing client demand for the construction of sustainable buildings0.42Fair
Legal or Policy
(D6)
LEG05AuthorizationGovernment authorization to manage waste independently0.76Excellent
LEG06Strict RegulationStringent government regulations regarding construction waste management1.00Excellent
LEG07Special RegulationsSpecific regulations for the use of recyclable and reusable materials0.76Excellent
Table 4. Collected barriers factors.
DimensionCodeFactorsDescriptionsKappa ScoreInterpretation
Financial or Economics (D1)FE01Higher
Project Cost
Reluctance to engage in construction waste management that could result in higher project costs due to intense competition1.00Excellent
FE02Legal
Stringency
Insufficient legal rigor in economic waste management for contractors0.76Excellent
FE03PerceptionThe perception that waste reduction activities are not cost-effective, efficient, and aligned with core construction activities0.76Excellent
FE04Separating Recycled MaterialsReluctance to separate recyclable or reusable materials from those with low economic value or difficult reusability0.13Poor
FE05Profit PrioritizationThe primary priority is profit for the company rather than environmental concerns0.42Fair
Institutional (D2)IN01CoordinationLack of coordination regarding the implementation of construction waste management across different company divisions0.76Excellent
IN02Standard Operating ProcedureAbsence of standardized operating procedures for waste management0.42Fair
IN03Support and CommitmentLack of support and commitment from company management regarding waste issues0.76Excellent
IN04Performance StandardsThe absence of performance standards for managing waste from both the government and companies0.13Poor
IN05Lack of Skilled
Operator
The lack of expertise and experience among operators in the process of managing construction waste0.13Poor
IN06Plan DevelopmentLimited time for developing waste reduction or management plans0.76Excellent
Environmental (D3)ENV01EducationInadequate education on sustainable building practices at the university level0.76Excellent
ENV02TrainingInsufficient training for construction workers on waste-handling issues1.00Excellent
ENV03Environmental AwarenessLack of environmental awareness among the political decision-makers and clients1.00Excellent
Technical (D4)TECH01KnowledgeLack of knowledge on how to implement eco-technology1.00Excellent
TECH02Space LimitationsIneffective construction waste management due to space limitations1.00Excellent
TECH03Operator SkillsPoor skills in construction waste management practices by on-site operators0.76Excellent
Socio-cultural (D5)SOC01DemandLow demand or orders from clients to purchase sustainable buildings0.76Excellent
SOC02Conventional ProcedureDifficulty in transitioning conventional practices and procedures toward waste management in the workforce1.00Excellent
SOC03ReassuranceBelief that efforts to reduce waste will never be sufficient to eliminate waste problems0.76Excellent
Legal or Policy
(D6)
LEG01Regulation SupportThe lack of regulatory support from the government0.13Poor
LEG02OperationExisting regulations on waste management are challenging to implement in the real world0.76Excellent
LEG03Policy EnforcementLack of policy enforcement in waste management regulations in the construction industry1.00Excellent
LEG04InformationInsufficient information available regarding environmental norm requirements1.00Excellent
Table 5. Dimensional and indicator driver factors weighting results.
Risk
Dimension
WeightFactors CodeDriving FactorsLocal WeightLocal RankGlobal WeightGlobal Rank
Financial or Economics (D1)0.185FE06High Disposal Cost0.31230.0586
FE07Cost Reduction Awareness0.34410.0644
FE08Compensation0.34420.0645
Institutional (D2)0.157IN07Culture0.27410.04310
IN08Promotion0.25720.04011
IN09Increase Market Share0.24230.03812
IN10Competitors0.22840.03613
Environmental (D3)0.171ENV04Awareness1.00010.1711
Technical
(D4)
0.161TECH04Experience0.21020.03415
TECH05Procedure
Development
0.21810.03514
TECH06Space0.18740.03017
TECH07Low Waste
Technology (LWT)
0.17950.02918
TECH10Relationship
Between Suppliers
0.20530.03316
Socio-cultural (D5)0.161SOC04Protection Area0.52810.0852
SOC05Client Request0.47220.0763
Legal or Policy (D6)0.165LEG05Authorization0.30530.0509
LEG06Strict Regulation0.34810.0587
LEG07Special Regulations0.34720.0578
Table 6. Dimensional and indicator barrier factors weighting results.
Risk
Dimension
WeightFactors CodeBarrier FactorsLocal WeightLocal RankGlobal WeightGlobal Rank
Financial or Economics
(D1)
0.168FE01Higher Project Cost0.26420.04515
FE02Legal Stringency0.26810.04514
FE03Perception0.24030.04019
FE05Profit Prioritization0.22840.3820
Institutional (D2)0.177IN01Coordination0.23940.04218
IN02Standard Operating Procedure0.24930.04417
IN03Support and Commitment0.26110.04613
IN06Plan Development0.25120.04416
Environmental (D3)0.183ENV01Education0.32730.0604
ENV02Training0.33520.0613
ENV03Environmental Awareness0.33810.0622
Technical
(D4)
0.161TECH01Knowledge0.38610.0621
TECH02Space Limitations0.29530.04812
TECH03Operator Skills0.31920.0517
Socio-cultural (D5)0.154SOC01Demand0.32330.05011
SOC02Conventional Procedure0.35210.0546
SOC03Reassurance0.32520.0509
Legal or Policy (D6)0.159LEG02Operation0.31430.05010
LEG03Policy Enforcement0.36710.0585
LEG04Information0.31920.0518
Disclaimer/Publisher’s Note: The statements, opinions and data contained in all publications are solely those of the individual author(s) and contributor(s) and not of MDPI and/or the editor(s). MDPI and/or the editor(s) disclaim responsibility for any injury to people or property resulting from any ideas, methods, instructions or products referred to in the content.

