Article

Temporal and Spatial Evolution of Meteorological Drought in Inner Mongolia Inland River Basin and Its Driving Factors

1
Yinshanbeilu Grassland Eco-Hydrology National Observation and Research Station, China Institute of Water Resources and Hydropower Research, Beijing 100038, China
2
Institute of Water Resources of Pastoral Area Ministry of Water Resources, Hohhot 010020, China
3
School of Water Conservancy, North China University of Water Resources and Electric Power, Zhengzhou 450046, China
*
Author to whom correspondence should be addressed.
Sustainability 2024, 16(5), 2212; https://doi.org/10.3390/su16052212
Submission received: 15 January 2024 / Revised: 25 February 2024 / Accepted: 1 March 2024 / Published: 6 March 2024

Abstract

:
In order to analyze the temporal and spatial evolution of meteorological drought and explore its driving factors, the inland river basin of Inner Mongolia (IMIRB) was taken as a typical research area, the Standardized Precipitation Evapotranspiration Index (SPEI) of various scales was calculated, and the spatio-temporal trend change characteristics of meteorological drought were analyzed combined with the modified Mann–Kendall trend test (MMK). The typical meteorological drought events were analyzed by using the three-dimensional identification method, and the spatio-temporal evolution characteristics and dynamic evolution law of meteorological drought were analyzed comprehensively and accurately. The driving effects of Pacific Decadal Oscillation (PDO), North Atlantic Multidecadal Oscillation (AMO), Arctic Oscillation (AO), El Niño-Southern Oscillation (ENSO), North Atlantic Oscillation (NAO), and sunspot on meteorological drought were investigated by using the cross wavelet method. The results are as follows: (1) with the increase of SPEI time scale, the frequency of meteorological drought decreased, but the duration and intensity of drought increased; (2) the trend was greatest in spring, with the largest number of areas showing a significant downward trend in SPEI, the strongest persistence in intensity, and significant aridification characteristics; (3) summer meteorological droughts had the largest area of high intensity drought but the smallest area of high frequency areas, and winter droughts had the smallest area of high intensity drought but the largest percentage of high frequency areas; (4) the meteorological drought event that occurred from April 2017 to December 2017 was the most serious, and reached its maximum value in June 2017, which mainly experienced five processes: occurrence—intensification—attenuation—re-intensification—extinction; (5) atmospheric circulation factor, sunspot, and meteorological drought of IMIRB were correlated, and ENSO had the greatest effect on drought. This study provides effective theoretical support for IMIRB drought prevention and disaster reduction.

1. Introduction

In the context of global warming, the frequency and intensity of extreme weather events such as droughts, floods and high temperatures have increased significantly [1,2,3]. Among many meteorological disasters, drought is one of the most extensive and destructive natural hazard, which has the characteristics of high frequency, long duration, and wide impact, causing serious impacts on ecology, economy, and society [4,5,6,7]. At present, drought in the world is divided into four types as follows: meteorological drought, agricultural drought, hydrological drought, and socio-economic drought, among which meteorological drought is the most common and basic type of drought, and the natural state is the prerequisite for inducing other types of drought [8,9,10]. Therefore, analyzing the spatial and temporal evolution of meteorological droughts and quantifying their characteristics are essential for early warning about droughts and sustainable economic and social development.
There are many kinds of meteorological drought index; commonly used are the Palmer Drought Severity Index (PDSI), the Standardized Precipitation Index (SPI), and the Standardized Precipitation Evapotranspiration Index (SPEI) [11,12,13]. Among them, PDSI was proposed earliest and applied more frequently. For example, Raphael et al. analyzed the spatiotemporal drought variability in the Tana River Basin based on PDSI, reflecting the spatial and temporal heterogeneity of drought [14]. Pandžić Krešo et al. used the self-calibrating Palmer Drought Severity Index (scPDSI) and SPI to assess the impact of the 2017 and 2018 drought on maize seed grain yield [15]. SPI is applied widely to drought early warning and risk analysis. Lorenzo et al. characterized the spatial change characteristics of drought in the Liberian peninsula since 2000 based on SPI, indicating that the meteorological drought intensity in the eastern part of the Liberian Peninsula showed an increasing trend [16]. Zhang et al. analyzed the stress effect of meteorological drought on vegetation growth on the Chinese mainland based on SPI, which provided a theoretical reference for the management and restoration of plant communities in this region [17]. Mupepi et al. constructed a mixed drought detection method suitable for the Zvishawane region of Zimbabwe by coupling SPI, Vegetation Condition Index (VCI), and human observation methods, and comprehensively analyzed the drought conditions in the region [18]. However, the spatial comparability of PDSI is poor, the time scale is single, there is no variable time scale, and the SPI also does not take into account the influence of evapotranspiration fluctuations caused by temperature changes on drought [19,20]. Therefore, Vicente-Serrano et al. proposed SPEI, which combines the advantages of SPI and PDSI, considers the influence of temperature has the characteristics of spatial comparability, and has been widely used at home and abroad [21,22]. Kamruzzaman et al. investigated the spatial and temporal characteristics of drought in Bangladesh using SPI and SPEI, and the results showed that SPEI was more usable than SPI [23]. Qaisrani et al. showed that SPEI detected a higher level of extreme drought events than SPI, indicating the importance of temperature in drought assessment [24]. Lotfirad et al. analyzed drought conditions in Iran from 1960 to 2019 using multi-time scale SPI and SPEI, and the results showed that SPEI predicted drought conditions more accurately [25]. The above results show that SPEI is more suitable for the monitoring, evaluation, and prediction of meteorological drought because it comprehensively considers the effects of temperature and precipitation.
According to the calculation results of drought index, the characteristics of temporal and spatial evolution and development law of drought can be further analyzed. However, identifying drought events and extracting drought characteristic variables from historical drought time series is the prerequisite for analyzing the spatio-temporal evolution characteristics and development laws of drought. Ma et al. calculated the SPEI and Normalized Difference Vegetation Index (NDVI) at different scales in Jilin Province from 2000 to 2017, and used the run theory to detect the SPEI of the optimal response time of vegetation drought, and analyzed the drought events in the study area [26]. Du et al. calculated the Meteorological Drought Composite Index (MCI) based on the meteorological stations data in the Beijing–Tianjin–Hebei region of China from 1961 to 2023, and analyzed the variation characteristics of drought in this region based on the MCI [27]. Based on the monthly SPEI from 1960 to 2020, Ling et al. revealed the spatio-temporal evolution of drought in the Haihe River Basin [28]. However, the above research only analyzed drought events from a two-dimensional perspective, but drought events are essentially dry and wet anomalies in three-dimensional space, and it is particularly important to quantitatively analyze the evolutionary characteristics of the whole process of drought events and the developmental patterns of regional drought events in a continuous spatial and temporal scale from a three-dimensional perspective [29,30]. Therefore, Xu et al. established a three-dimensional cluster identification method for drought events in China from 1961 to 2012 based on multiple drought indexes, and comprehensively analyzed their temporal and spatial changes by extracting five characteristic variables, including drought duration, area, severity, intensity, and centroid [31]. Based on SPEI-3 and a three-dimensional clustering algorithm, Guo et al. identified severe drought events in Central Asia from 1966 to 2015, and extracted drought indicators such as duration, intensity, severity, centroid, and area to characterize them, so as to study the characteristics of drought in more depth [32]. Feng et al. analyzed the drought events in the Heihe River Basin over the past 60 years based on a three-dimensional drought identification method, and analyzed the spatial and temporal characteristics of drought events in detail according to several drought characteristic variables [33]. Therefore, it is necessary to analyze drought from a three-dimensional perspective, which is helpful for extracting multiple drought characteristic variables and accurately revealing the evolution of drought events.
As a strong signal affecting climate change, atmospheric circulation factors are important factors driving the occurrence and change of drought. In this paper, atmospheric circulation factors (Pacific Decadal Oscillation (PDO), North Atlantic Multidecadal Oscillation (AMO), Arctic Oscillation (AO), El Niño-Southern Oscillation (ENSO), North Atlantic Oscillation (NAO)), and sunspot are selected to study the driving force of meteorological drought in this region. Among them, PDO is a strong and periodic ocean atmosphere climate change model with a 10-year periodic-scale change centered on the mid-latitude Pacific basin, which is closely related to the decadal-scale precipitation pattern of south waterlogging and north drought in China. AMO is a quasi-periodic warm and cold anomaly of sea surface temperature (SST) that occurs in the North Atlantic region with a basin scale in space and a multi-decade scale in time, which affects the distribution pattern of decadal scale precipitation in eastern China. AO is one of the most important modes of exoplanet-scale atmospheric circulation in winter in the Northern Hemisphere, and has a significant impact on temperature changes in the northern Hemisphere and at the regional scale. ENSO is an oscillation of wind field and sea surface temperature in the equatorial winter Pacific, which is a significant signal of global interannual and interdecadal climate change. NAO is the most significant mode of the atmosphere in the North Atlantic region and has some influence on the climate in Asia. The motion of the sunspot can have an effect on the upper atmosphere.
The Inner Mongolia inland river basin (IMIRB) is located in arid and semi-arid areas, with low precipitation and large evaporation, and the trend of warming and drying has been significant in recent years [34,35]. As climate change intensifies, meteorological drought events in IMIRB are becoming more and more frequent, but the relevant studies ignore the spatiotemporal continuity of drought and the lack of three-dimensional analysis of drought events, resulting in the inability to comprehensively and accurately assess the spatiotemporal dynamic evolution of drought [36,37]. In addition, atmospheric circulation factors, as a strong signal affecting climate change, are important driving factors of the occurrence and change of drought, but the mechanism driving atmospheric circulation factors affecting drought in Inner Mongolia is not clear [38]. Aiming at the above problems, this paper adopts the three-dimensional identification method to comprehensively reveal the evolution law of meteorological drought, and uses the cross wavelet method to analyze the mechanism driving atmospheric circulation factors affecting meteorological drought.
Therefore, this study will be conducted in the following areas: (1) to study the temporal and spatial trends of meteorological drought at different scales from 1961 to 2021; (2) to analyze meteorological drought intensity and frequency space distribution characteristics; (3) from the perspective of three dimensions, to reveal the meteorological drought evolution law of space and time; (4) to analyze the driving mechanism of atmospheric circulation factors on meteorological drought. The research results have revealed the evolutionary pattern of meteorological drought and improved the ability to predict meteorological drought, which can guide decision-making more accurately, so as to realize the change from passive response to drought to active risk reduction.

2. Materials and Methods

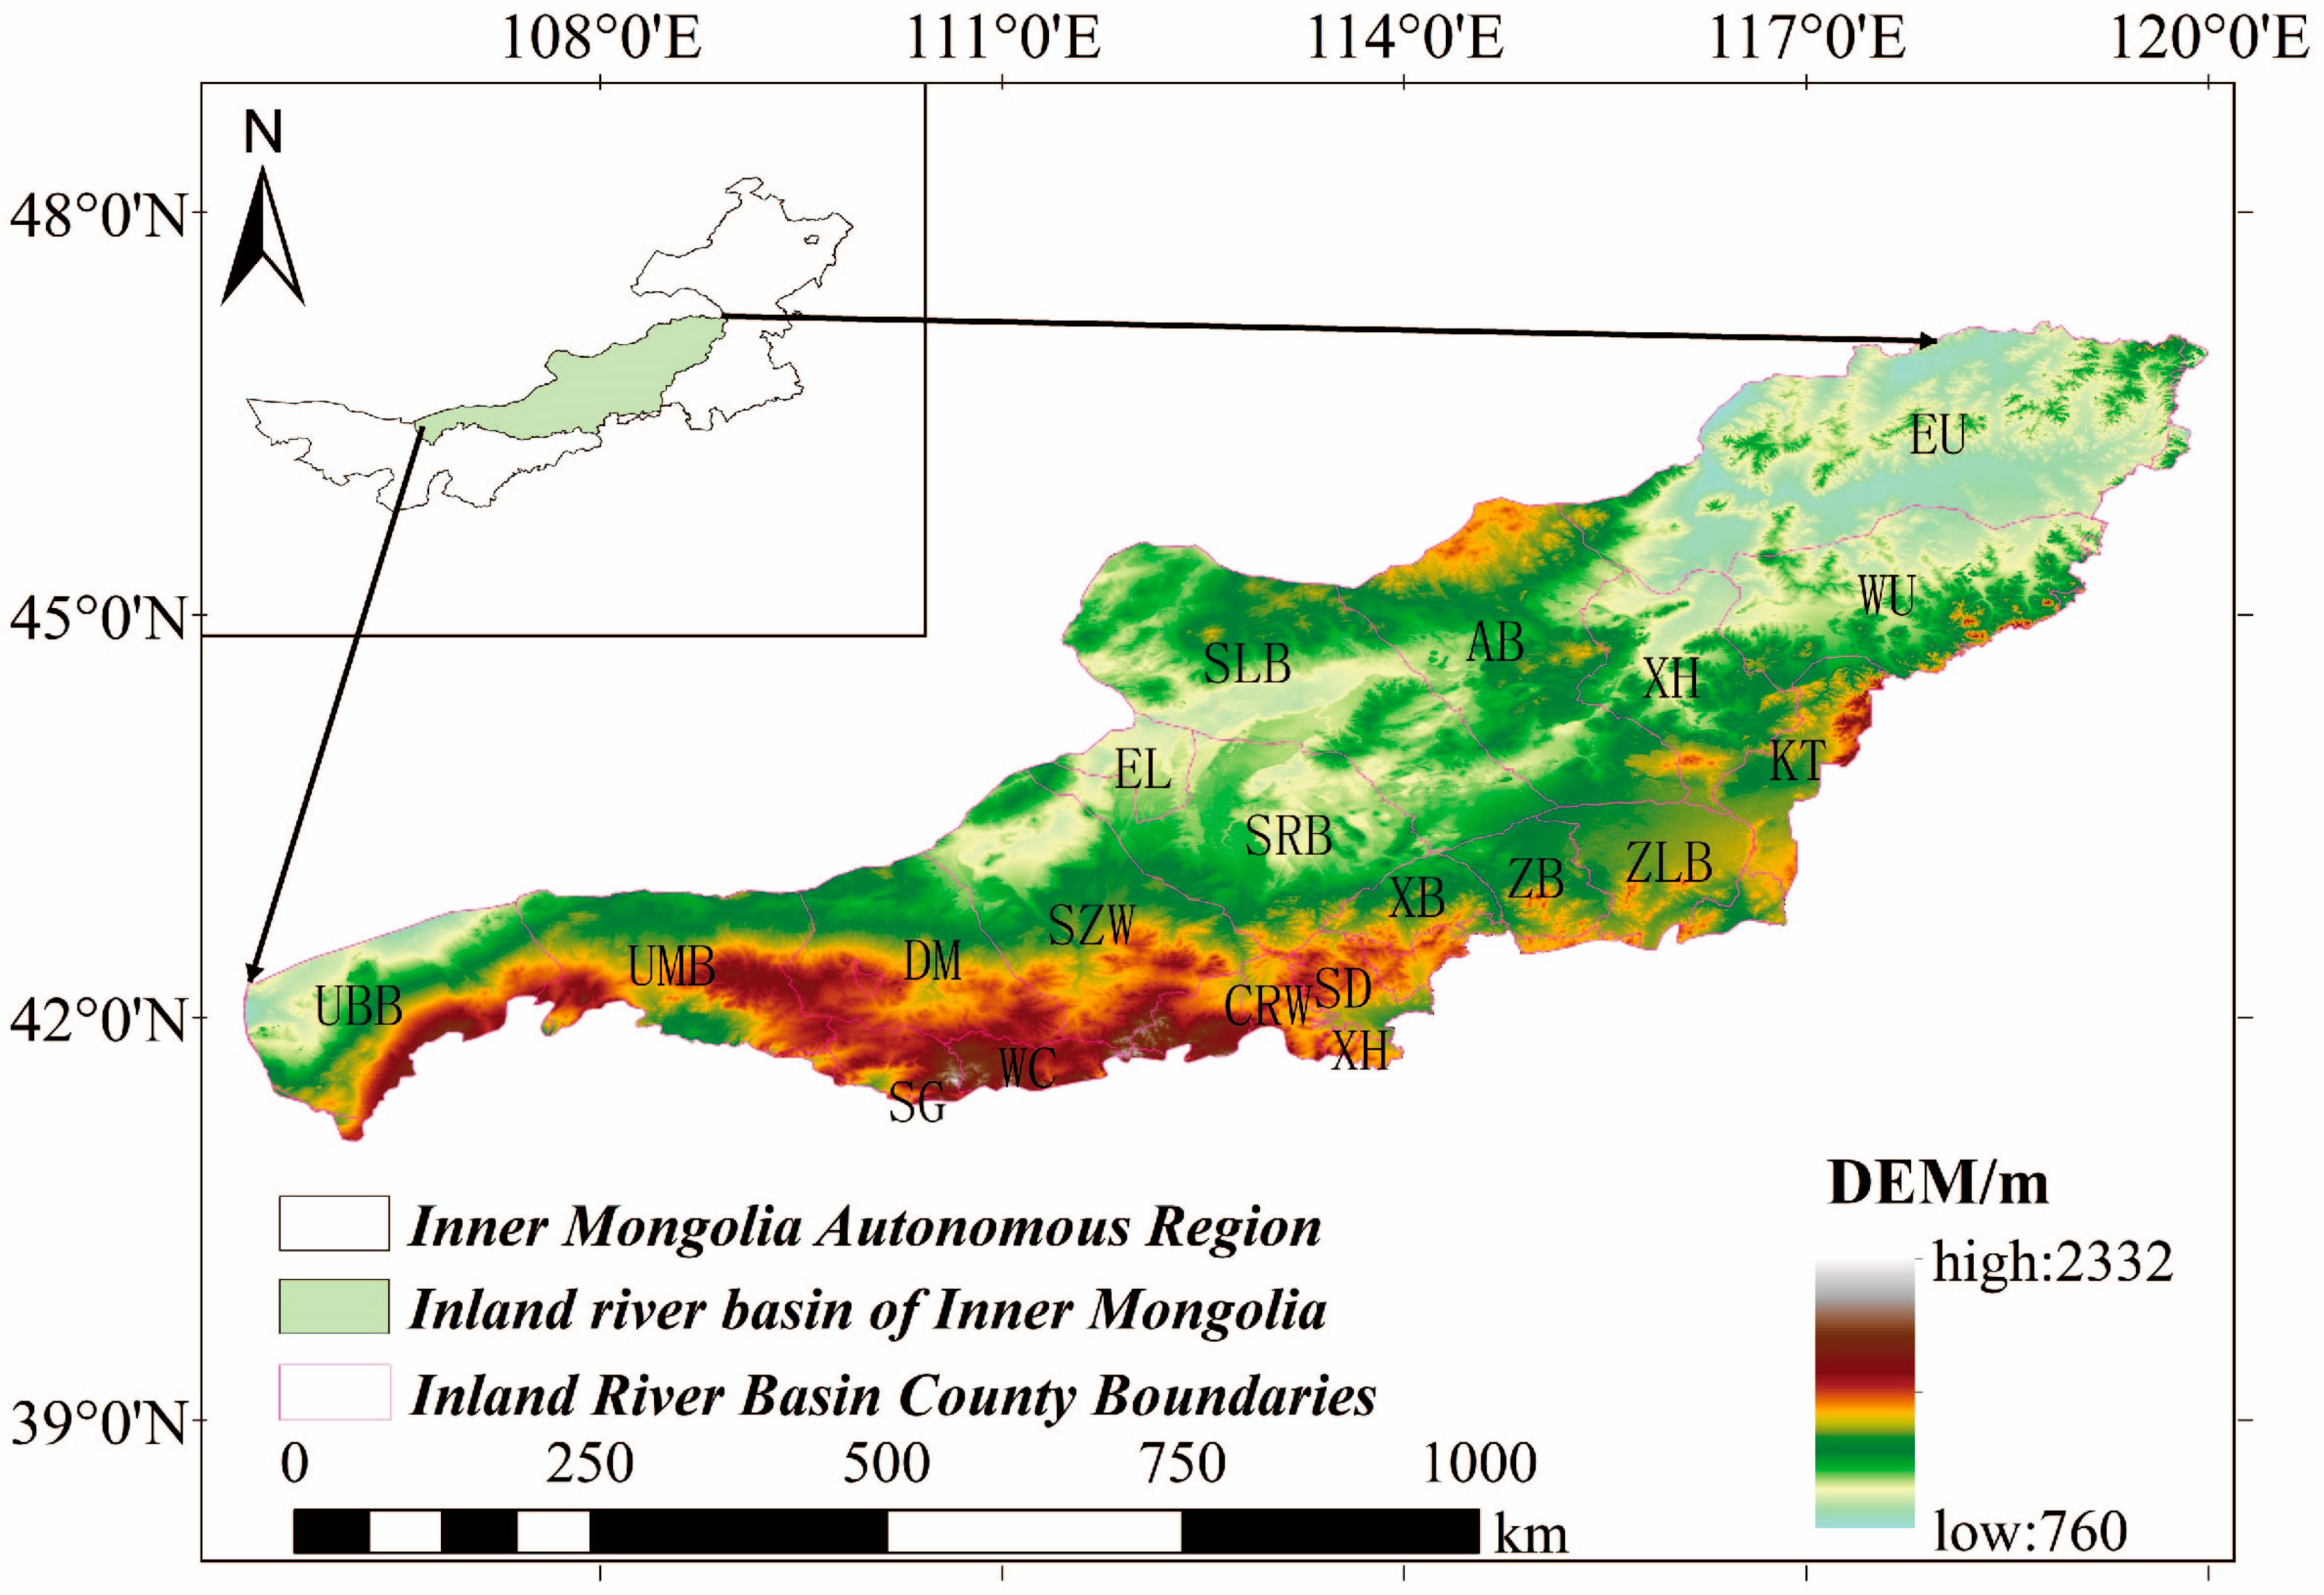
2.1. Overview of the Study Area

IMIRB is located in central Inner Mongolia, at 105°11′~120°7′ E, 40°32′~46°51′ N, with an area of about 320,000 km², an average precipitation of 295 mm, an average temperature of 2–6 °C, and a trend of continuous increase in drought in recent years. Figure 1 shows the basic overview of the research area.

2.2. Data Source

In this paper, monthly precipitation and potential evapotranspiration grid data from 1961 to 2021 provided by the CRU TS v.4.07 dataset (https://crudata.uea.ac.uk/cru/data/hrg/cru_ts_4.07 (accessed on 26 September 2023)) were used to calculate SPEI on different time scales (1 to 12 months) with a spatial resolution of 0.5° × 0.5°. The dataset, produced by the UK’s National Centre for Atmospheric Science, is one of the most widely used.
In this paper, atmospheric circulation factors and sunspot are selected. Table 1 provides data sources for atmospheric circulation factors.

2.3. Standardized Precipitation Evapotranspiration Index

In this paper, SPEI is chosen to characterize meteorological drought. SPEI uses the difference between precipitation and potential evapotranspiration to characterize drought conditions [39].
(1) The difference sequence D i between monthly precipitation and potential evaporation is established:
D i = P i P E T i ,
where i is the month; D i is the difference between monthly precipitation and potential evapotranspiration, mm; P i is monthly precipitation, mm; and P E T i is the monthly potential evapotranspiration, mm.
Construct the accumulated water surplus and deficit series X with meteorological significance at different time scales:
X i k = i k + 1 i D i ,
where k is the time scale, k = 1, 2, …, 12.
(2) The 3-parameter Log-logistic probability distribution function is used to fit the X i k sequence and calculate the probability density function f(x) and probability distribution function F(x):
f x = β α x γ α β 1 1 + x γ α β 2
F x = 1 + α x γ β 1 ,
where α is the scale parameter; β is the shape parameter; and γ is a positional parameter, which can be fitted by linear moment method:
β = 2 w 1 w 0 6 w 1 w 0 6 w 2
α = w 0 2 w 1 β Γ 1 + 1 / β Γ 1 1 / β
γ = w 0 α Γ 1 + 1 / β Γ 1 1 / β ,
where Γ 1 + 1 / β is the Gamma distribution function of 1 + 1 / β ; w s is the probabilistic weighted moment (s = 0, 1, 2) of the original data sequence D i , which is calculated as follows:
w s = 1 n i = 1 n 1 j 0.35 n s D i .
(3) The corresponding SPEI sequence can be obtained by standardizing the probability distribution function F(x):
S P E I = W C 0 + C 1 + C 2 W 2 1 + d 1 W + d 2 W 2 + d 3 W 3
W = 2 ln P ,
where, when P ≤ 0.5, P =1 − F(x). When P > 0.5, P = F(x). The other parameters are C 0 = 2.515517, C 1 = 0.802853, C 2 = 0.010328, d 1 = 1.432788, d 2 = 0.189269, and d 3 = 0.001308.
The criteria for classifying SPEI drought levels are determined as shown in Table 2. When SPEI is less than −1, drought is considered to occur.

2.4. Modified Mann-Kendall Test

The modified Mann–Kendall trend test (MMK) can be used to study temporal trends in drought indices [40,41]. In this method, the trend and significance of changes in the time series are characterized by first calculating the estimated trend of the time series, then calculating the autocorrelation coefficient, finding the variance of the trend statistic based on the autocorrelation coefficient, and finally calculating the value of the trend of the time series based on the variance. The detailed calculation steps are given in the literature [42].

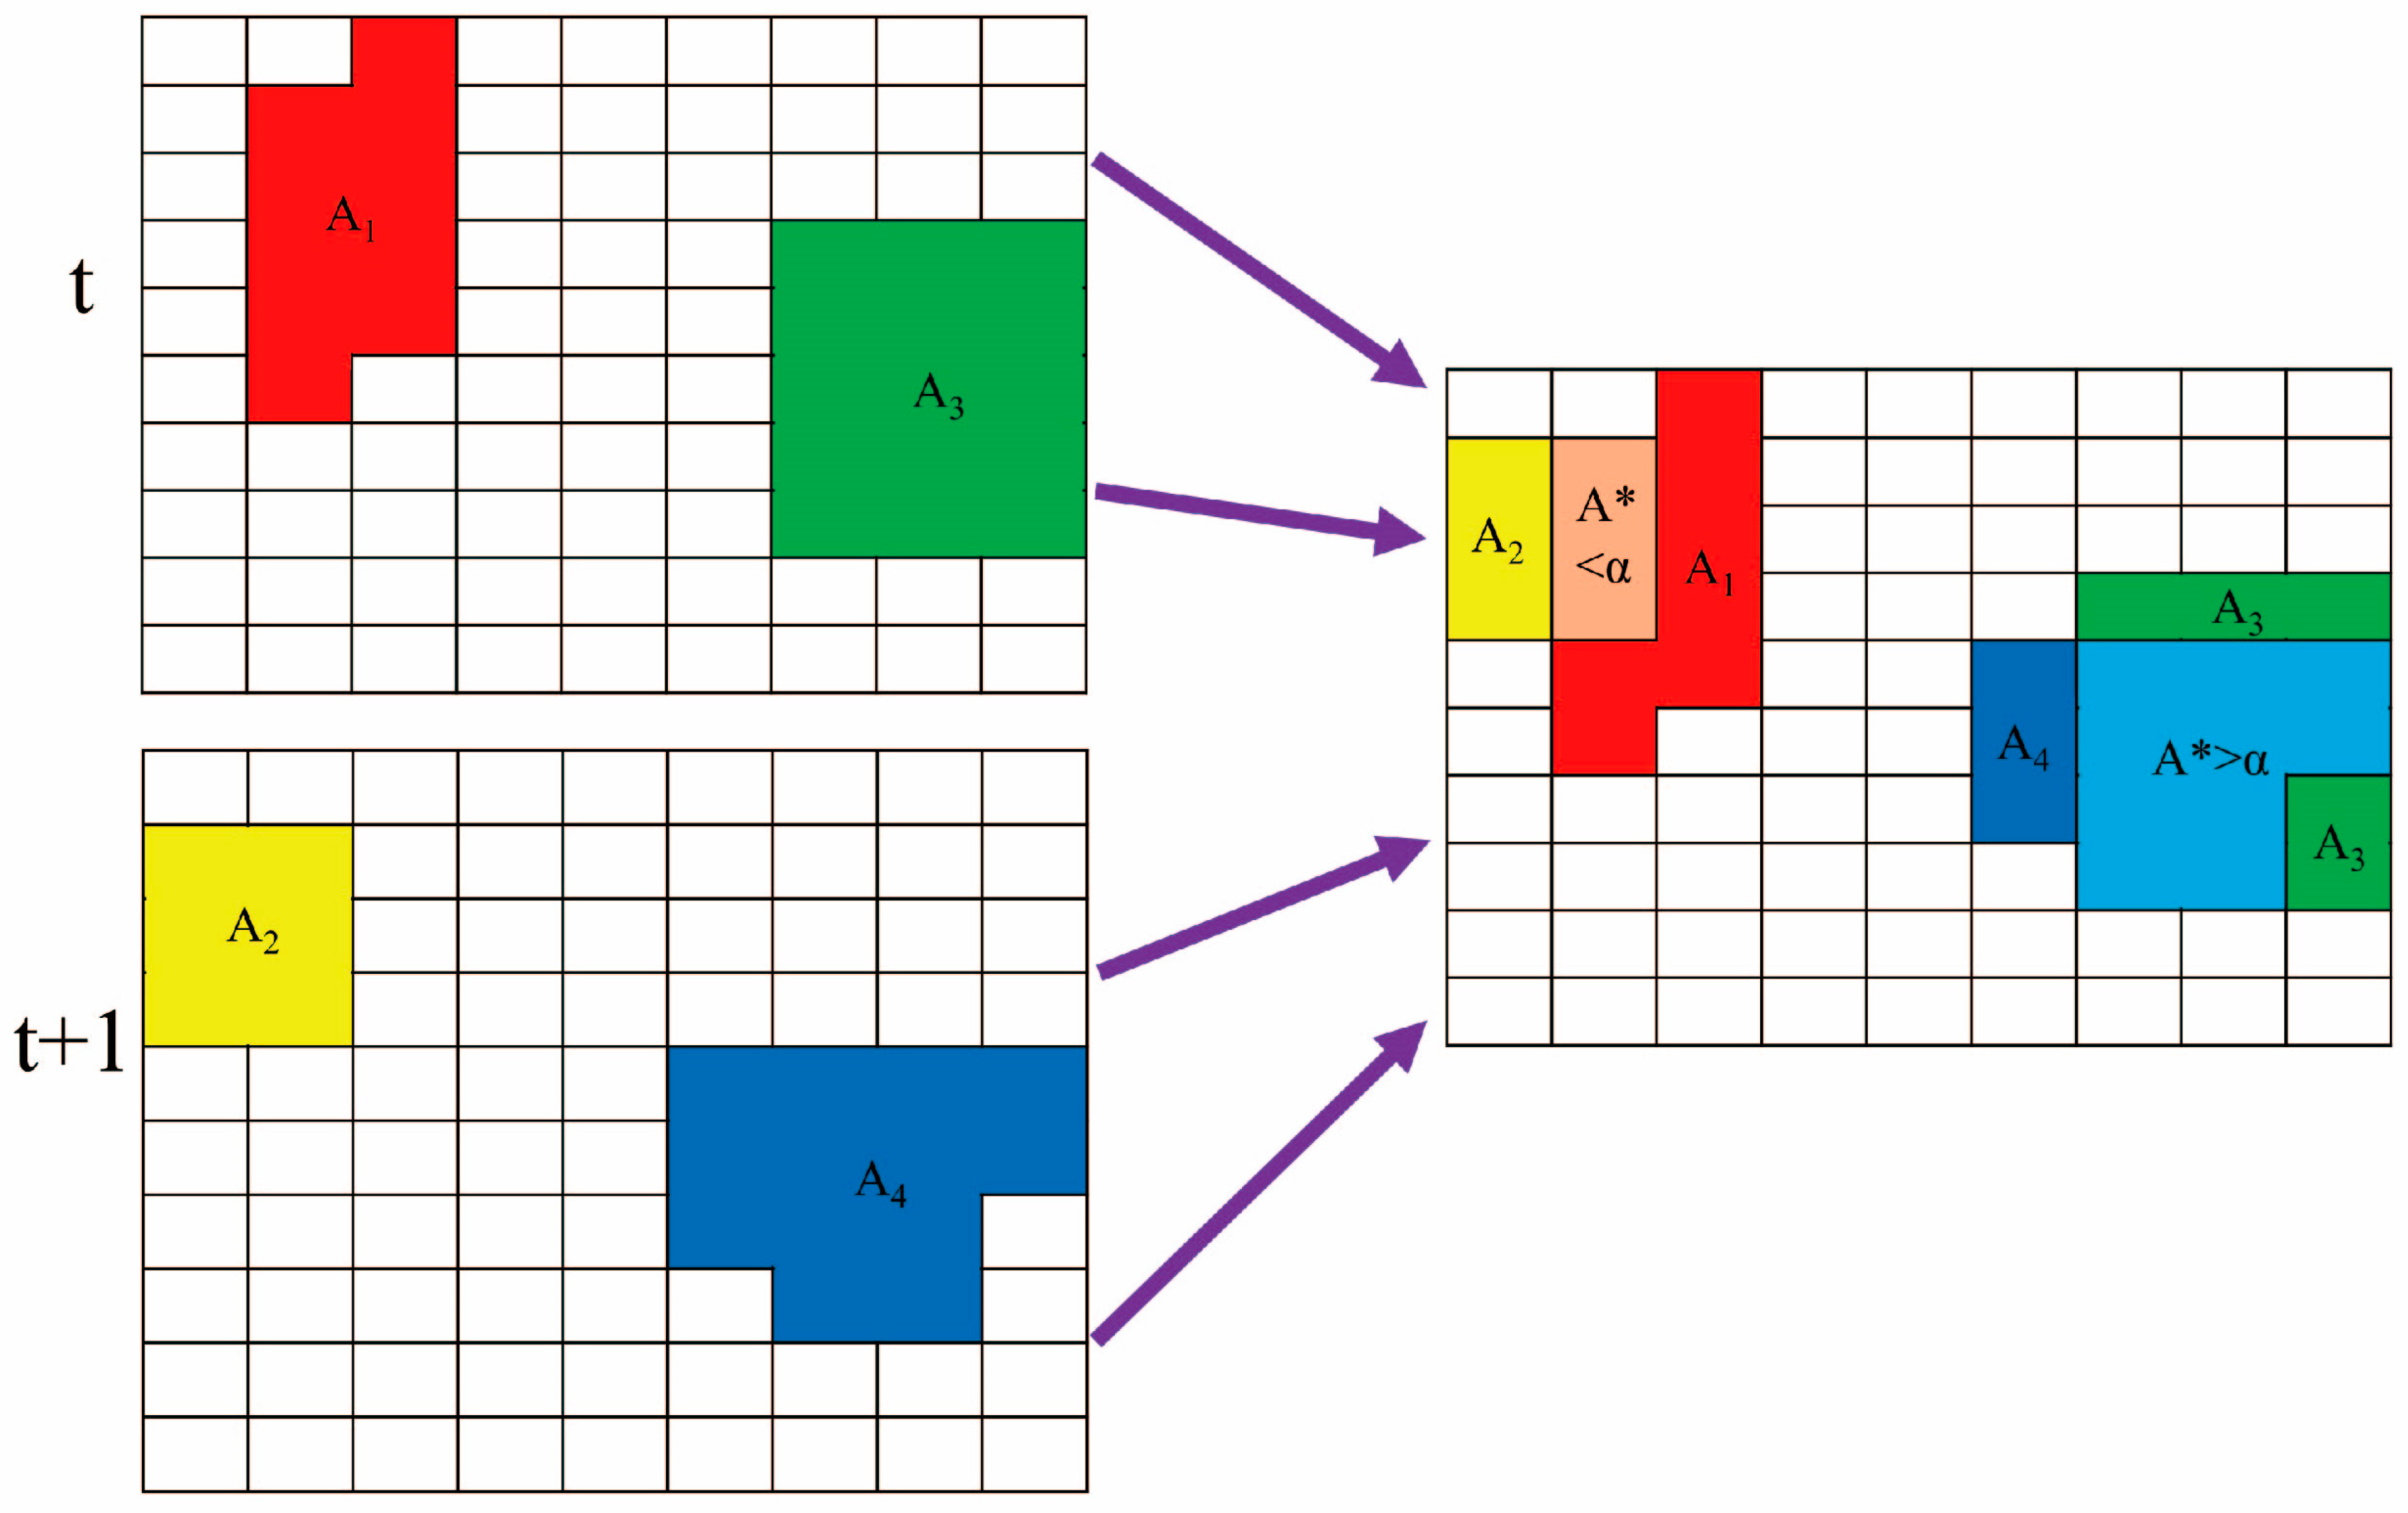
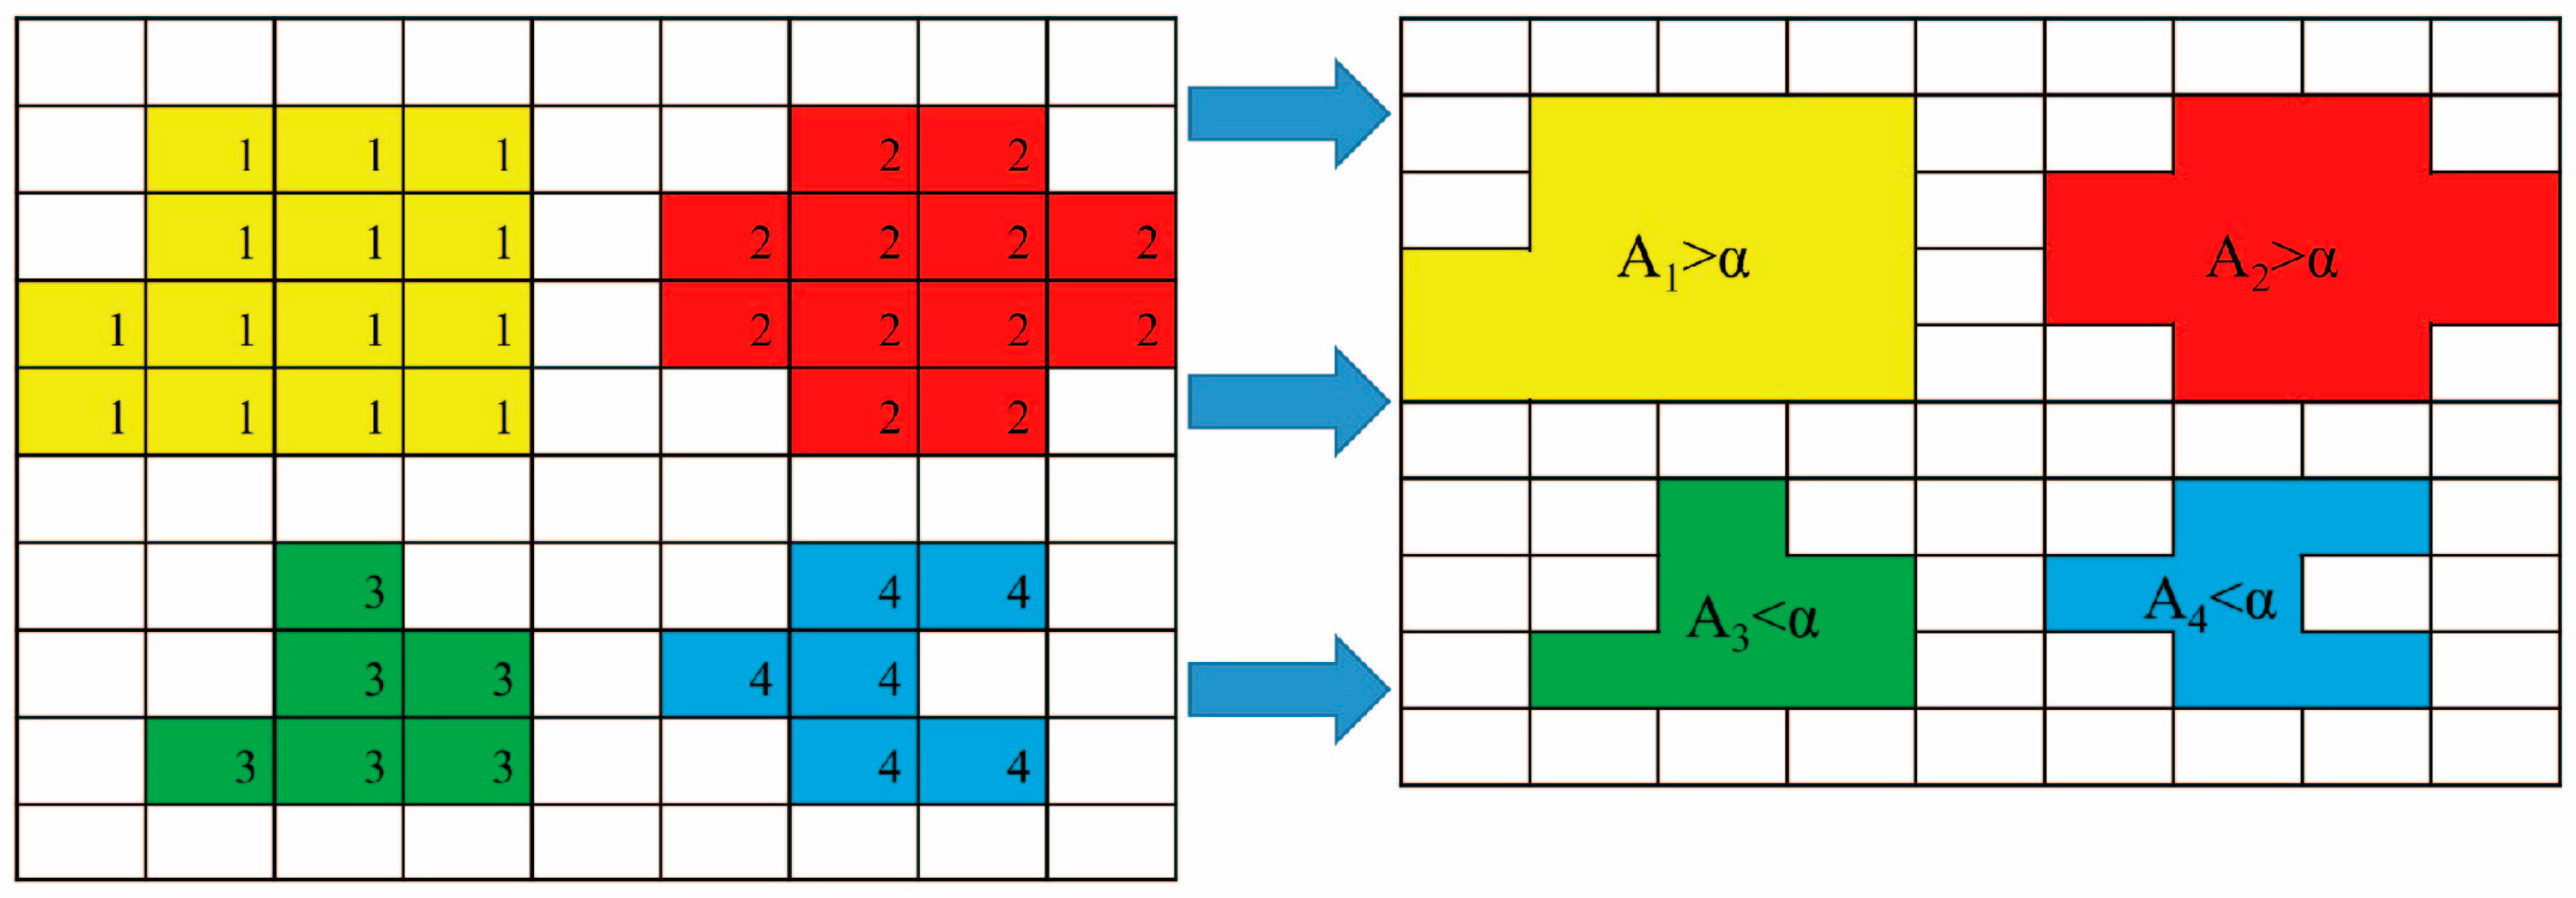
2.5. Drought Three-Dimensional Identification Method

2.5.1. Drought Patch Identification

The drought patch identification method starts with classifying spatially proximate grids, that is, grids with simultaneous droughts in adjacent locations (SPEI < −1) are grouped together and labeled with the same number, after which they are merged into a single drought patch; if there are no other drought grids in locations adjacent to the current drought raster, a new number is labeled for the creation of the next drought patch, and the procedure is repeated until no drought grids are present in the neighboring region. A minimum drought area threshold (α) is then established and, if the area of the identified drought area is less than α, it is determined that a drought event is not occurring (A3 and A4 in Figure 2). In addition, this area threshold can also be used to determine the temporal continuity between drought patches, avoiding the merging of otherwise poorly related or completely unrelated drought events within two adjacent months [43]. According to relevant literature studies, the α of the global scale should be 500,000 km2, the α of the Chinese scale should be 150,000 km2, and the drought research in other regions can be scaled according to the area proportion (1.6%) [44]. Therefore, this paper only considers the drought pattern spots with an area larger than 1.6% of the whole study area.

2.5.2. Drought Patch Time-History Connection

For the identified drought patches, determine if there is a connection between the temporal drought patches. As shown in Figure 3, if the area of overlap (A*) between a certain drought patch At and an adjacent drought patch At+1 is greater than threshold α, it is considered that At and At+1 are continuous in time and belong to the same drought event. This step is repeated from month 2 until layer checking is complete for all months, and drought bodies are extracted and given a unique number, i.e., a 3D drought event.

2.5.3. Extraction of Drought Event Characteristic Variables

This study measures drought events based on the following five drought characteristics:
(1)
drought duration is the number of months between the start time of the drought and the end time of the drought;
(2)
drought area is the maximum area covered by a drought event;
(3)
drought severity is the absolute value of the cumulative SPEI value during the drought event;
(4)
drought center is the weighted center of the gravity of the SPEI values in 3D space;
(5)
drought migration drought is the line of the center of mass of a month-by-month drought.

2.6. Cross Wavelet Transform

The cross wavelet transform can reveal the degree of correlation between two signals from the perspective of time-frequency distribution, the larger the amplitude value, the more obvious the degree of correlation between the two signals [45]. In this paper, a cross wavelet method is used to reveal the driving role of atmospheric circulation factors and sunspot on meteorological drought in the study area. Assuming that the continuous wavelet transforms of two time series X = (x1, x2, …, xn) and Y = (y1, y2, …, yn) are W n x ( s ) and W n y ( s ) , the cross wavelet transforms between them are as follows:
W n x y s = W n x s W n y * ( s ) ,
where W n y * ( s ) denotes the complex conjugate of W n y ( s ) and s denotes the time lag.

3. Results

3.1. Characteristics of the Temporal Evolution of Meteorological Drought

In this paper, we calculated the SPEI at the 1- to 24-month scale of IMIRB from 1961 to 2021, and plotted Hovmoller diagrams to characterize the temporal variation of meteorological drought indices at multiple scales (Figure 4). In the figure, blue indicates that a higher SPEI value means less drought, while red indicates that a lower SPEI value means more drought. Meteorological drought was a gradual process in terms of temporal evolution and frequent alternation between wet and dry at shorter time scales. The decreasing drought volatility and the significant increase in drought and wet cycles with increasing time scales imply a decrease in the number of meteorological drought occurrences and an increase in drought duration and drought intensity. Under different time scales, the SPEI of IMIRB showed a decreasing trend before 1972 and 2000–2017, i.e., the drought showed a strengthening trend; and the SPEI of 1973–1999 and 2018–present showed an increasing trend, i.e., the drought showed a weakening trend. It can also be seen in Figure 4 that relatively severe meteorological droughts occurred in IMIRB before and after 1966, before and after 2001, 2004–2011, and before and after 2016, while droughts and floods alternated with wetting in other periods.

3.2. Spatiotemporal Analysis of Monthly, Seasonal and Annual Meteorological Drought Trends

3.2.1. Time Characteristics of Meteorological Drought Change Trend

The time-varying characteristics of the different scales of SPEI of IMIRB are shown in Figure 5. On the monthly scale, the linear trend rate of SPEI was −0.00021/10a, approaching 0. In terms of annual scale variation, the SPEI had a linear tendency rate of −0.2214/10a toward aridity. The SPEI in the IMIRB showed a downward trend in spring, summer, and autumn, and the linear trend rates were −0.25/10a, −0.16/10a and −0.07/10a, respectively. The change trend in spring was the largest. In winter, the SPEI showed an upward trend, which showed a trend toward humidification from the multi-year trend.
In addition, from the perspective of monthly scale, there were six change points in SPEI, indicating frequent alternations of dry and wet on monthly scale. There was one abrupt change point on the spring scale, summer scale, and annual scale, respectively, which was in 1985, 1996, and 1996. The year after the abrupt change point was more obvious. No change points were found in autumn and winter, indicating that the trend of drying or wetting was relatively stable.

3.2.2. Spatial Characteristics of Meteorological Drought Change Trend

Based on the MMK trend test, the seasonal trend characteristics of SPEI at grid scale are shown in Figure 6. Areas where SPEI showed a significant downward trend were concentrated in the western part of the IMIRB, including areas such as UBB and western UMB.
Compared with other seasons, SPEI showed a downward trend in spring, in which the majority of regions showed a significant downward trend, accounting for 97.26%. The proportion of IMIRB SPEI that decreased significantly in summer was 68.88% compared with autumn and winter. In autumn, SPEI showed a significant downward trend in fewer regions, accounting for 2.35%. Compared with autumn, the SPEI in XH, WU, and EU regions showed an upward trend in the winter, showing the characteristics of humidification.

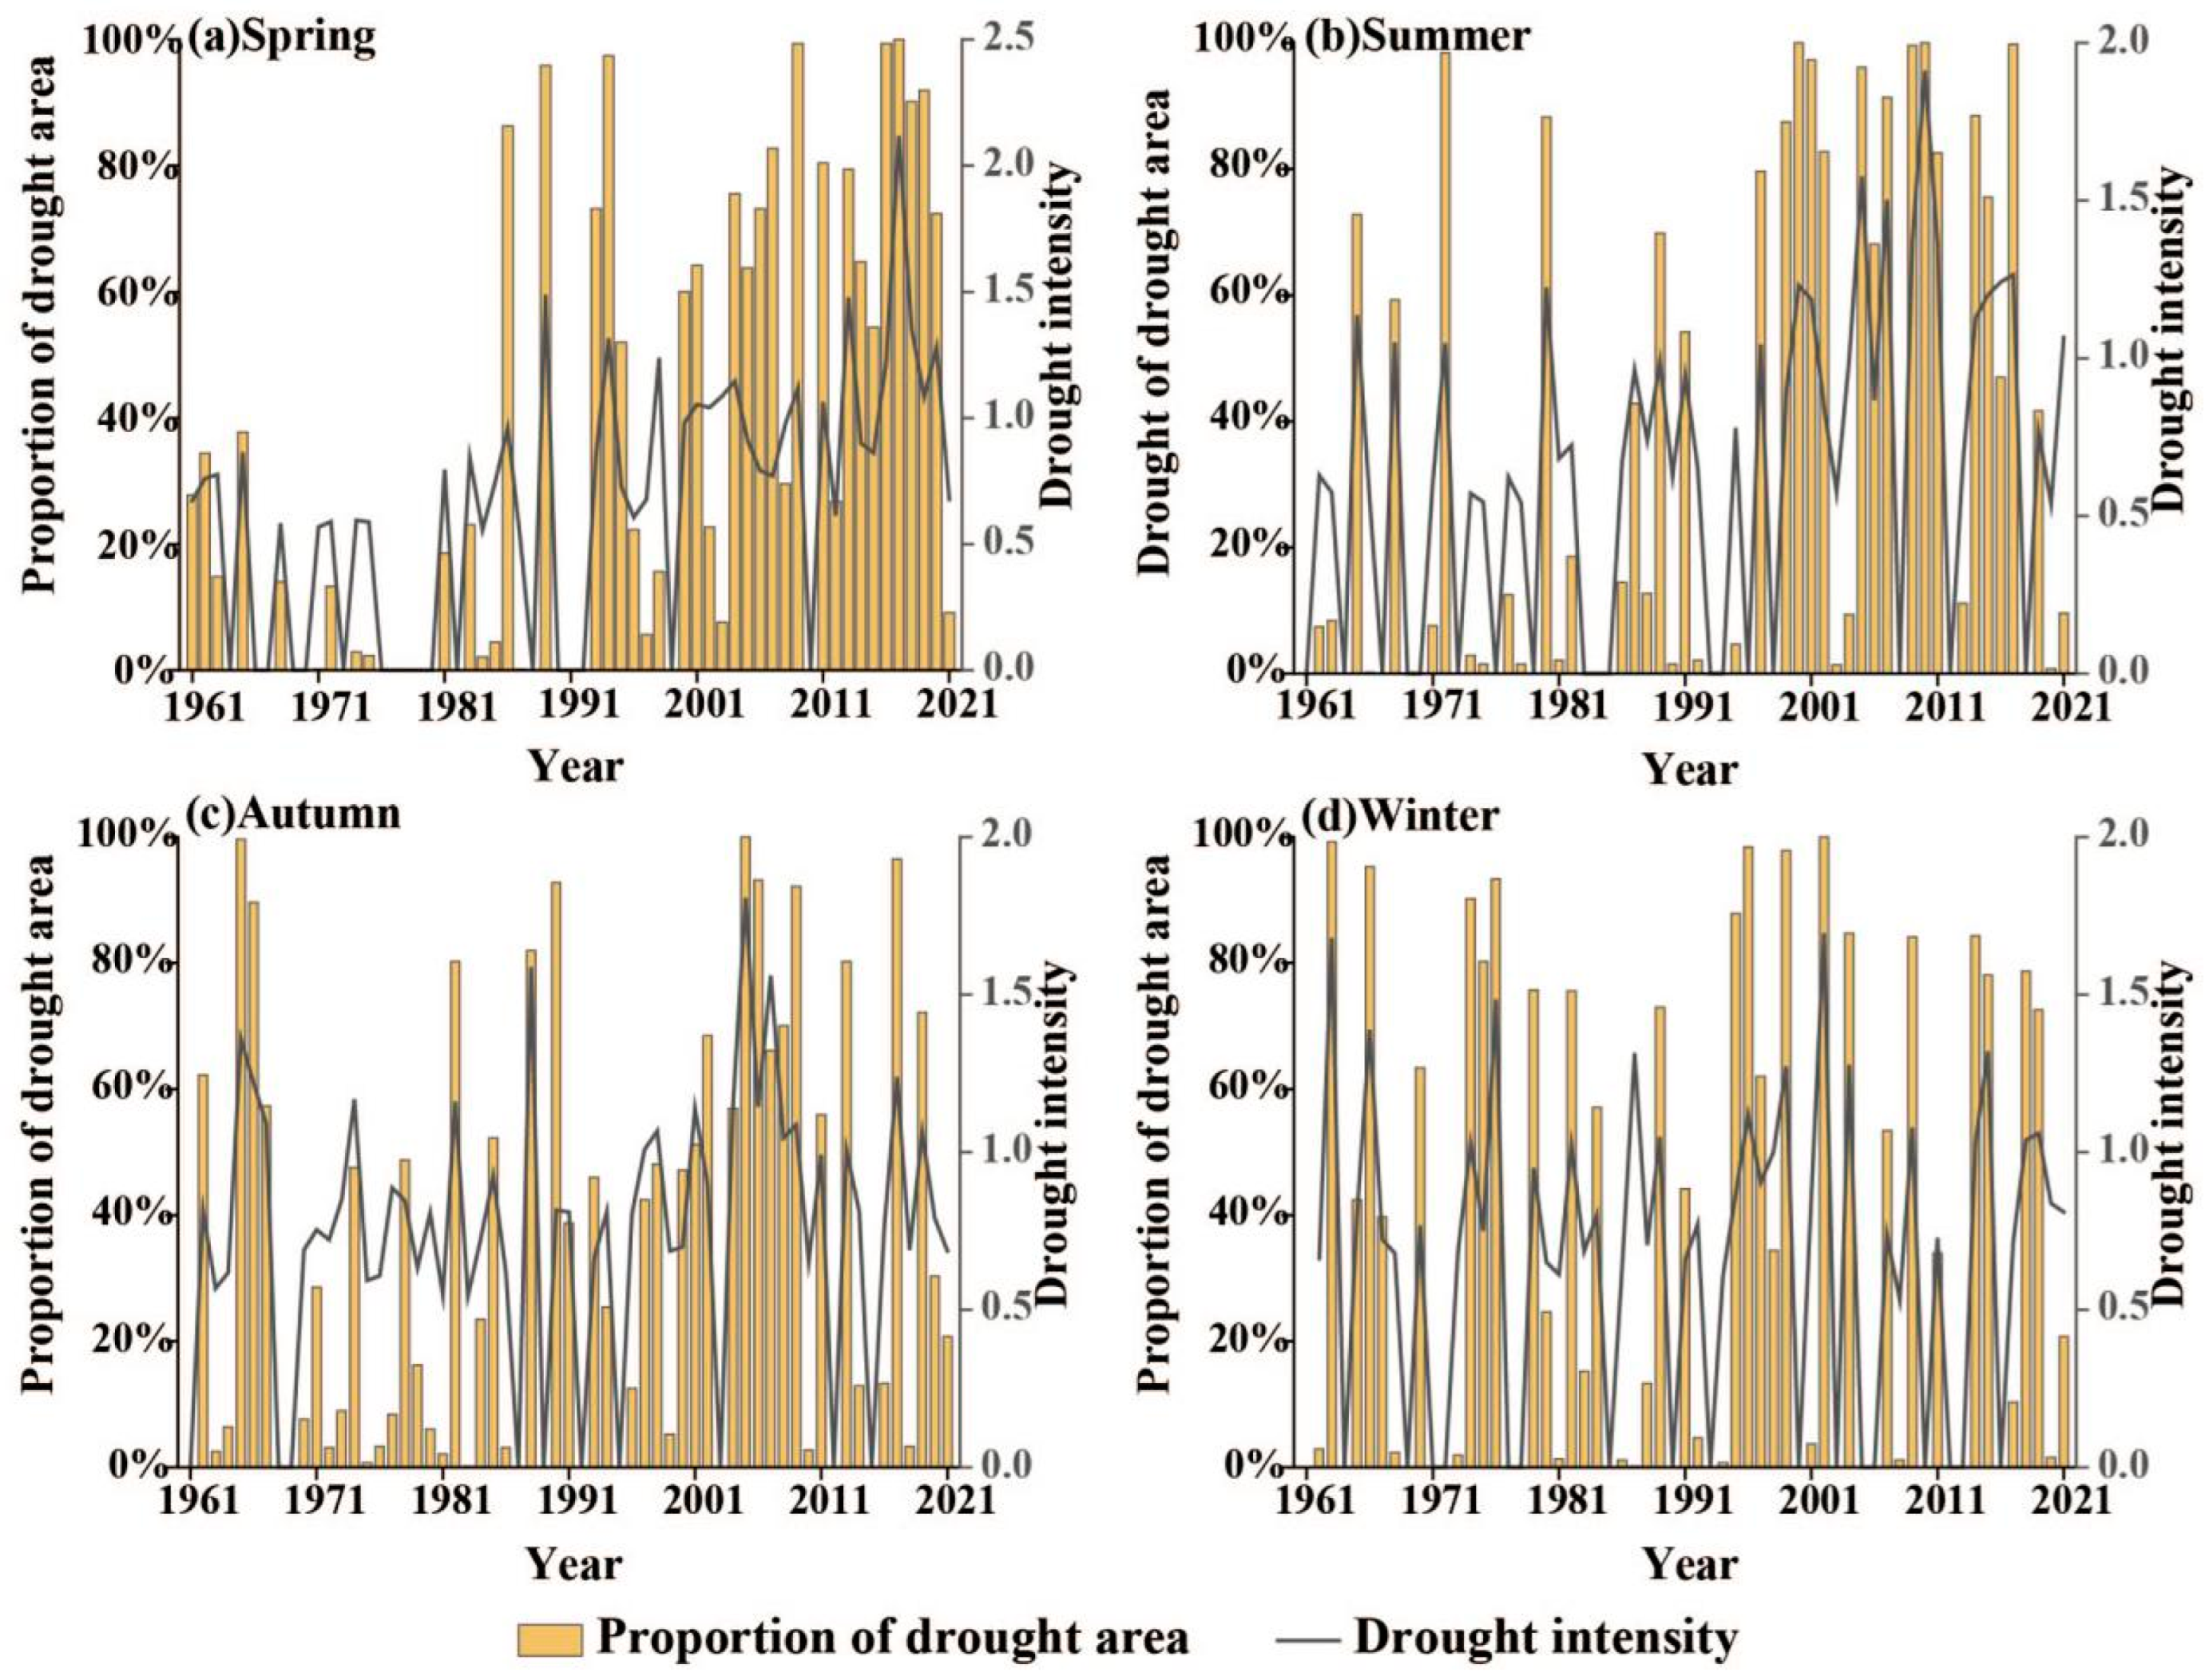
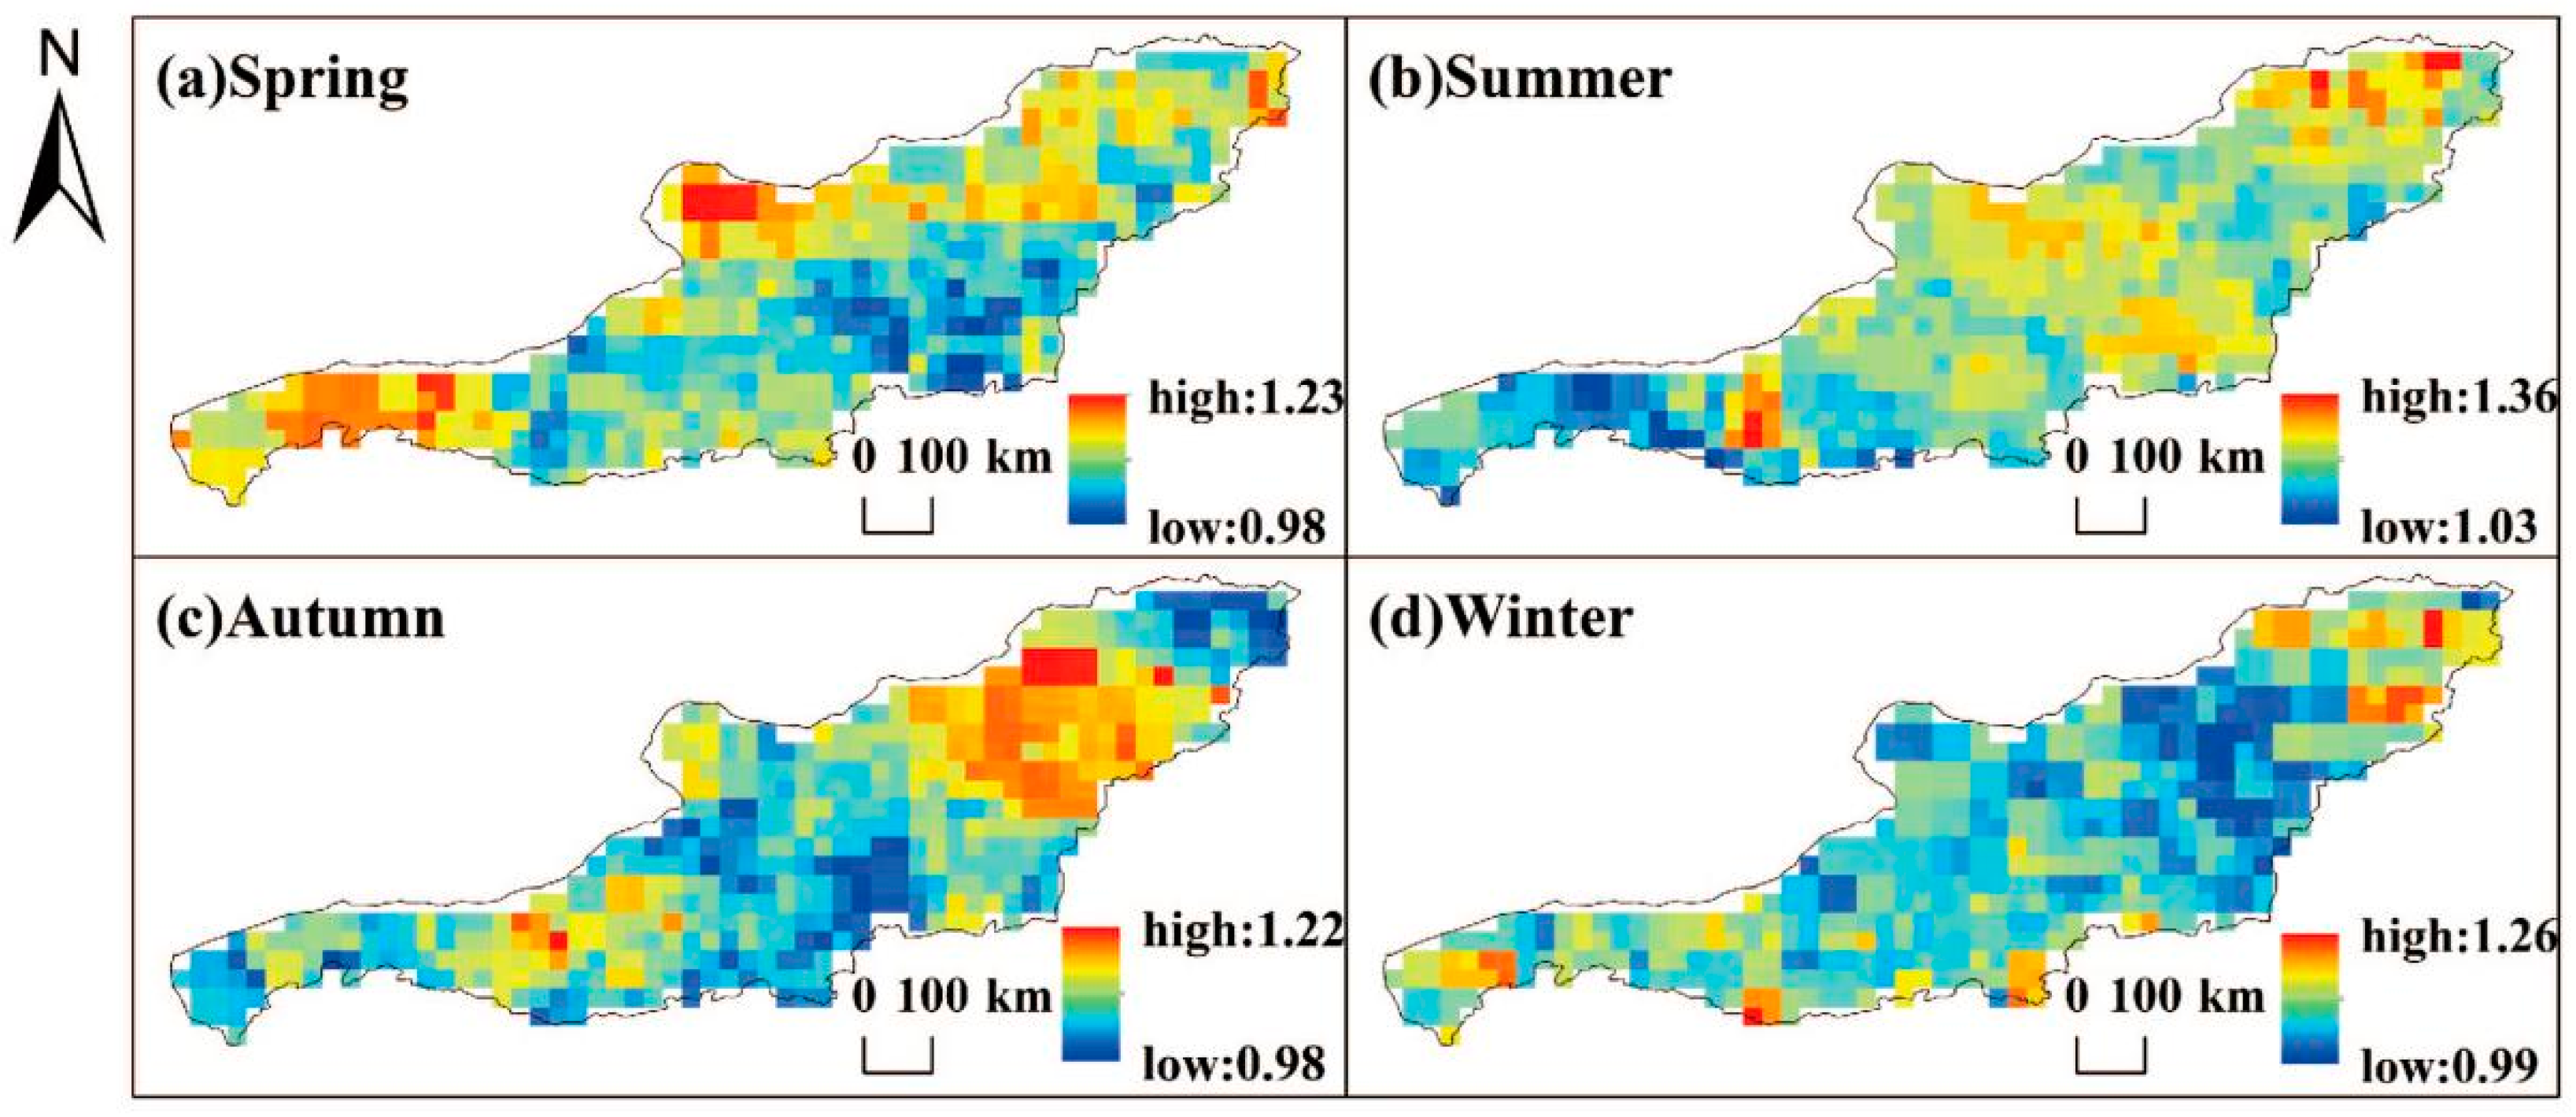
3.2.3. Characterization of Changes in Seasonal Drought Intensity and Area Proportion

As can be seen from Figure 7, the spring drought intensity of IMIRB increased slightly in the 1960s and reached its maximum value around 1965, when the proportion of arid area was about 40%. From 1968 to 1985, the drought intensity of some years was 0, and the drought intensity of other years fluctuated around 0.4, and the proportion of drought area in most periods was below 20%. During 1990–1992, the drought intensity was 0, while during 1993–1999, the drought intensity changed greatly and exceeded 0.5 in most periods. During this period, the drought area accounted for a large proportion, most of which was below 50%. From 2000 to 2020, the drought intensity and the proportion of the area were both large and persistent. During this period, the drought intensity fluctuated around 1.0, and the proportion of the area was mostly above 60%. In 2021, the drought intensity and the proportion of arid area decreased significantly. Compared with spring, the drought intensity was 0 in 1960, 0 in 1965–1998, and the proportion of drought area and drought intensity fluctuated greatly in 1990. After 2000, the proportion of drought area was roughly the same. Before 2000, the changes of drought intensity and area proportion in autumn and winter were almost the same, but after 2000, summer and autumn had strong correlation and similar changes. In winter, the drought intensity and proportion of arid area fluctuated greatly after 2000, and the trend of decreasing drought intensity and proportion of arid area was more obvious; that is, compared with other seasons, winter tended to be more humid.
Therefore, it can be seen from Section 3.2 that the SPEI in the study area showed a downward trend in spring, summer, and autumn, among which the trend of drought in spring was the most obvious, and the regions with a significant downward trend were the most obvious. SPEI showed a significant downward trend mainly in the western part of IMIRB.

3.3. Spatial Distribution Characteristics of Meteorological Drought Intensity and Frequency

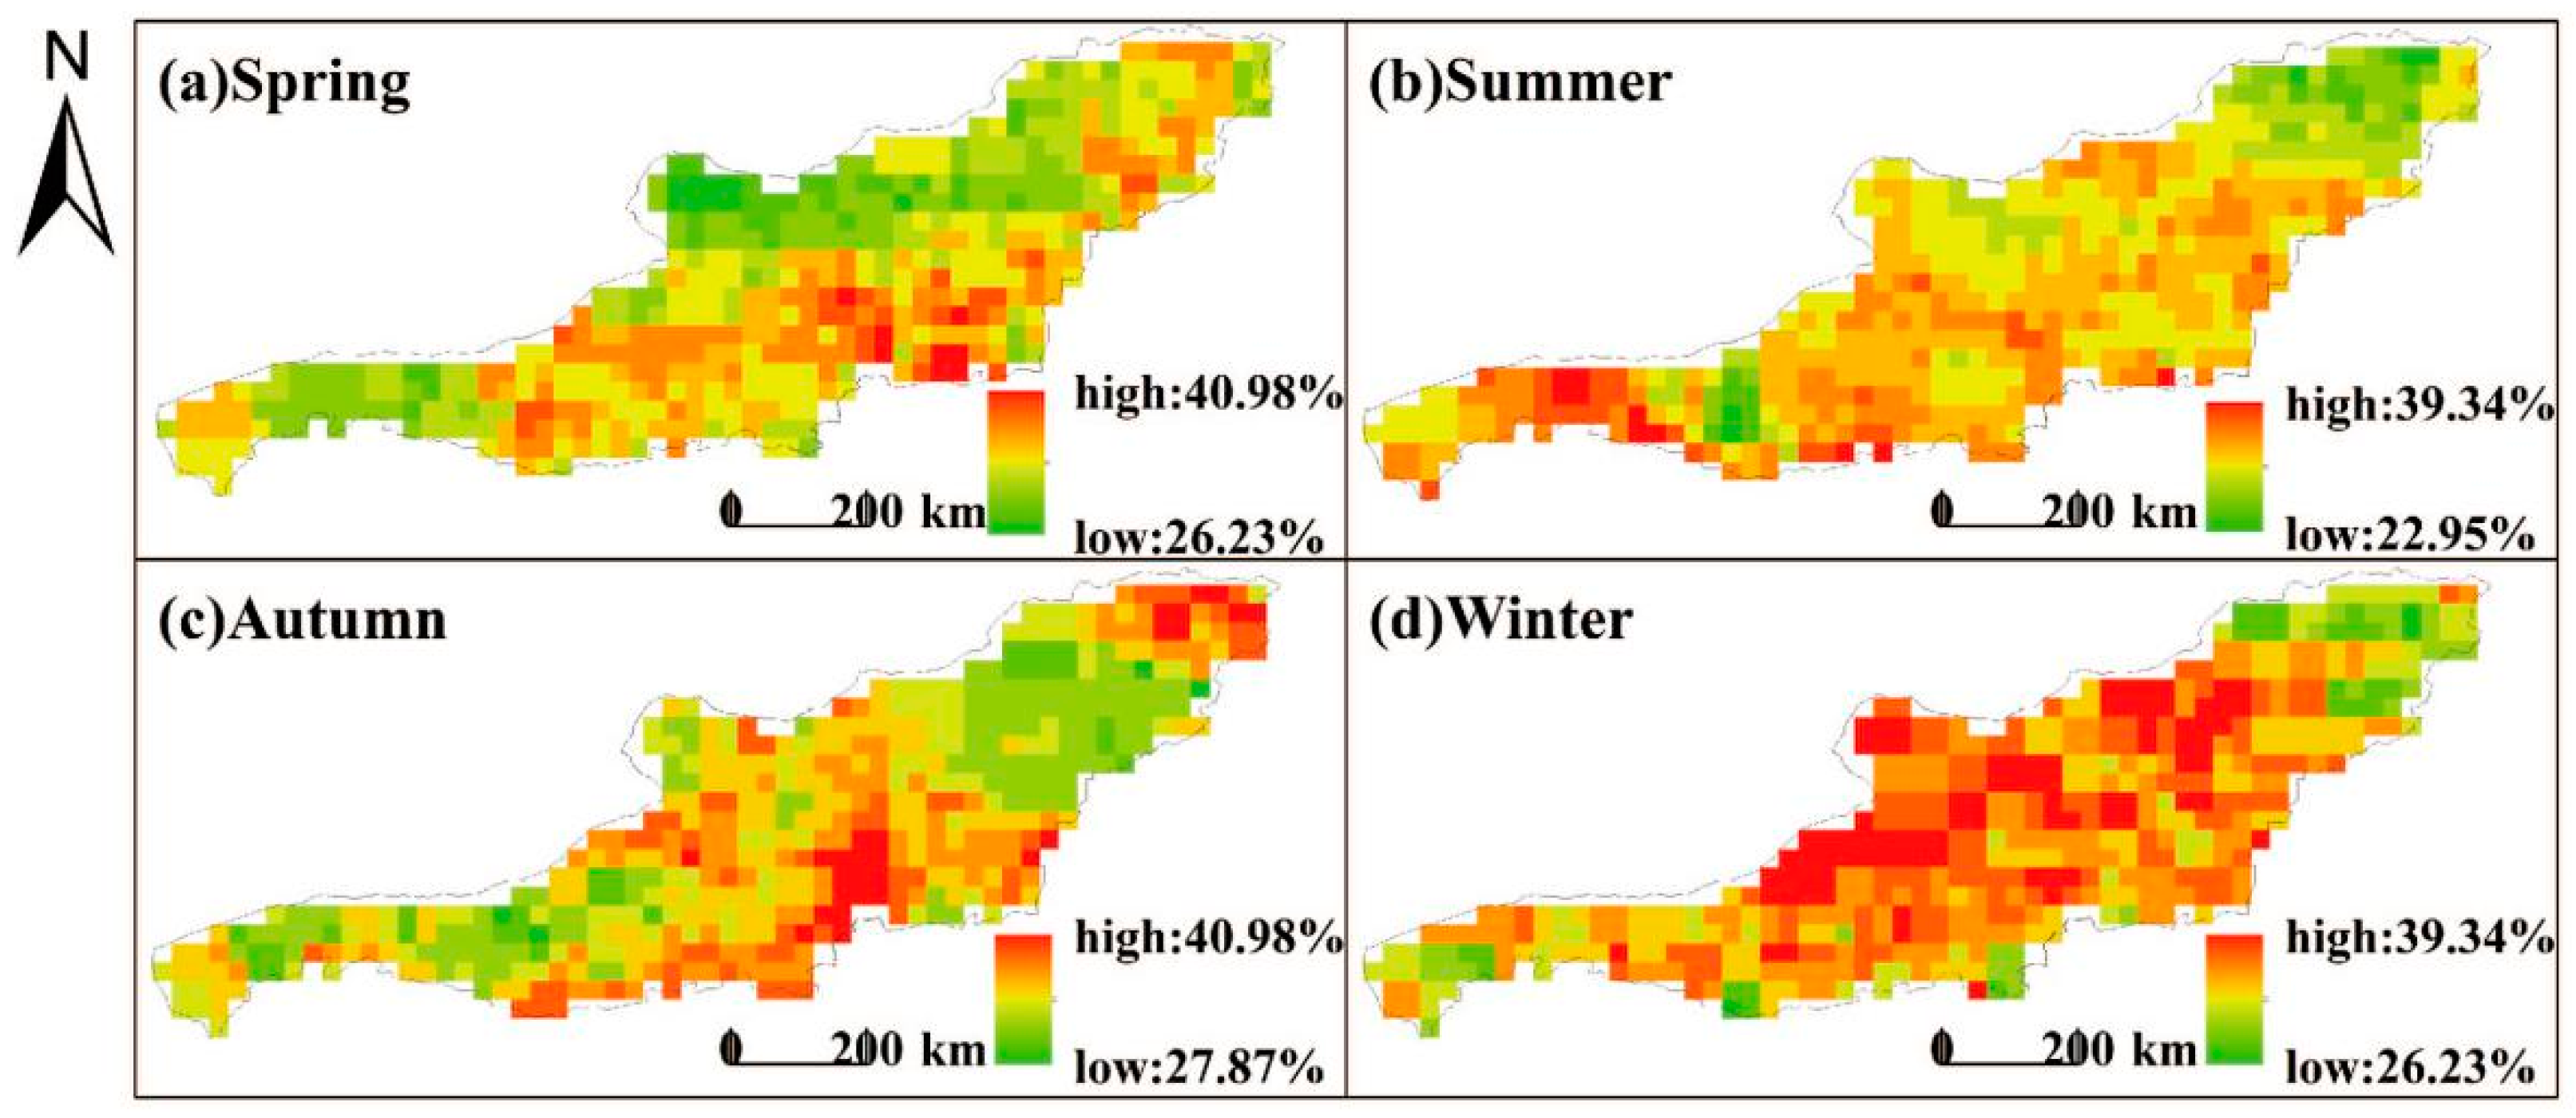
3.3.1. Spatial Variation Characteristics of Meteorological Drought Intensity

As can be seen from Figure 8, the drought intensity of IMIRB in all seasons was concentrated between 0.977 and 1.364 and, in this paper, the region of meteorological drought intensity less than 1.05 was defined as the low-value zone, and the region greater than 1.15 was the high-value region. The high-intensity and low-intensity zones of meteorological drought vary in different seasons, with the high-value zone of meteorological drought intensity having the largest area in summer and the low-value zone of meteorological drought intensity having the largest area in the fall.
In detail, the area of high intensity spring meteorological drought was relatively large at 16.6%, concentrated in the eastern UMB, northern SLB, and eastern EU, and the area of lower intensity spring drought was 17.42%, mainly in the southeastern part of the IMIRB. The high-value area of summer meteorological drought intensity is relatively concentrated, accounting for 68.29%, mainly concentrated in SLB, western ZB, and northeastern EU. The region with a low intensity of summer meteorological drought was concentrated in the western part of the IMIRB, with the smallest percentage of area. The area with a high intensity of autumn drought decreased, accounting for 15.66%, mainly concentrated in the east of XH, the west of EU, and the west of WU. The area with a low value of autumn drought intensity reached the largest proportion, accounting for 25.83%. The area of winter drought and high-intensity drought is the smallest among the four seasons, accounting for 10.76%, and the high-intensity drought area is concentrated in the northeast. The area with a low value of winter drought intensity is large, mainly distributed in the central and eastern regions, accounting for 22.31%.

3.3.2. Spatial Variation Characteristics of Meteorological Drought Frequency

As can be seen in Figure 9, the meteorological drought frequency of IMIRB largely remains between 28% and 36%. Therefore, the regions defined by a drought frequency of less than 28% are the low-value areas, and the regions greater than 36% are the high-value areas. The area of the high-frequency region of winter meteorological drought accounted for the largest proportion, and the area of the low-frequency region of spring meteorological drought accounted for the largest proportion.
Specifically, the high-frequency area of meteorological drought in spring accounted for 20.35%, mainly concentrated in XB and ZB. The area with a low-frequency zone of meteorological drought in spring was the largest among the four seasons with 23.09%, mainly concentrated in the northern part of SLB, the northern part of AB, and the eastern part of UBB. The area with a high frequency of meteorological drought in summer occupies the smallest proportion (6.65%), mainly concentrated in the west of UBB. The low-frequency area of summer and drought was the largest in the four seasons, which was 17.22%, mainly concentrated in the northeast. The high-frequency area of autumn drought was larger, accounting for 32.49%, mainly concentrated in the middle and northeast. The low-frequency region accounted for the smallest area (6.85%). The high-frequency area of meteorological drought in winter accounted for the largest proportion (38.16%), mainly concentrated in the middle. The winter drought low-frequency area accounted for 10.18%, mainly concentrated in the southwest of UBB and the northeast of EU.
According to Section 3.3, the area with a high value of summer meteorological drought intensity was the largest and distributed in the northeast of the study area. The area with a low value of autumn drought intensity reached the largest and was distributed in the western part of IMIRB. The proportion of low-frequency drought area in spring was the largest in the four seasons, which is 23.09%, mainly concentrated in the northern SLB, northern AB, and eastern UBB. The high-frequency area of winter meteorological drought accounted for the largest proportion, 38.16%, mainly concentrated in the middle of the study area.
It is worth noting that the spatial characteristics of high drought intensity regions were different in each season. Regions with high drought intensity had a lower drought frequency, while regions with low drought intensity had a higher drought frequency, indicating that high drought intensity regions were not prone to drought, but once drought occurred, it would cause more serious consequences.

3.4. Evolutionary Pattern of Meteorological Drought Based on Three-Dimensional Identification Method

3.4.1. Identification Results of Meteorological Drought Events

A total of 104 drought events were identified in the 1961–2021 study area, including 49 drought events lasting more than two months.
The top 10 most severe meteorological drought events and specific characterizing variables, ranked according to drought intensity, are listed in Table 3, where the drought event number represents the serial number of each drought event out of 104 drought events identified in chronological order. As can be seen from Table 3, the duration of these 10 drought events were all greater than or equal to 6 months, of which the 96th meteorological drought event, which occurred from April 2017 to December 2017, was the most severe, with a drought intensity of 3.299 × 10⁶ month·km2 and a drought area of 2.802 × 10⁵ km2. The direction of the migration paths ranged from central–southwest–northeast, and the migration process as a whole showed clockwise rotation characteristics. The 42nd (November 1988–September 1989) and the 67th (May 2001–March 2002) drought events had the longest duration of 11 months.

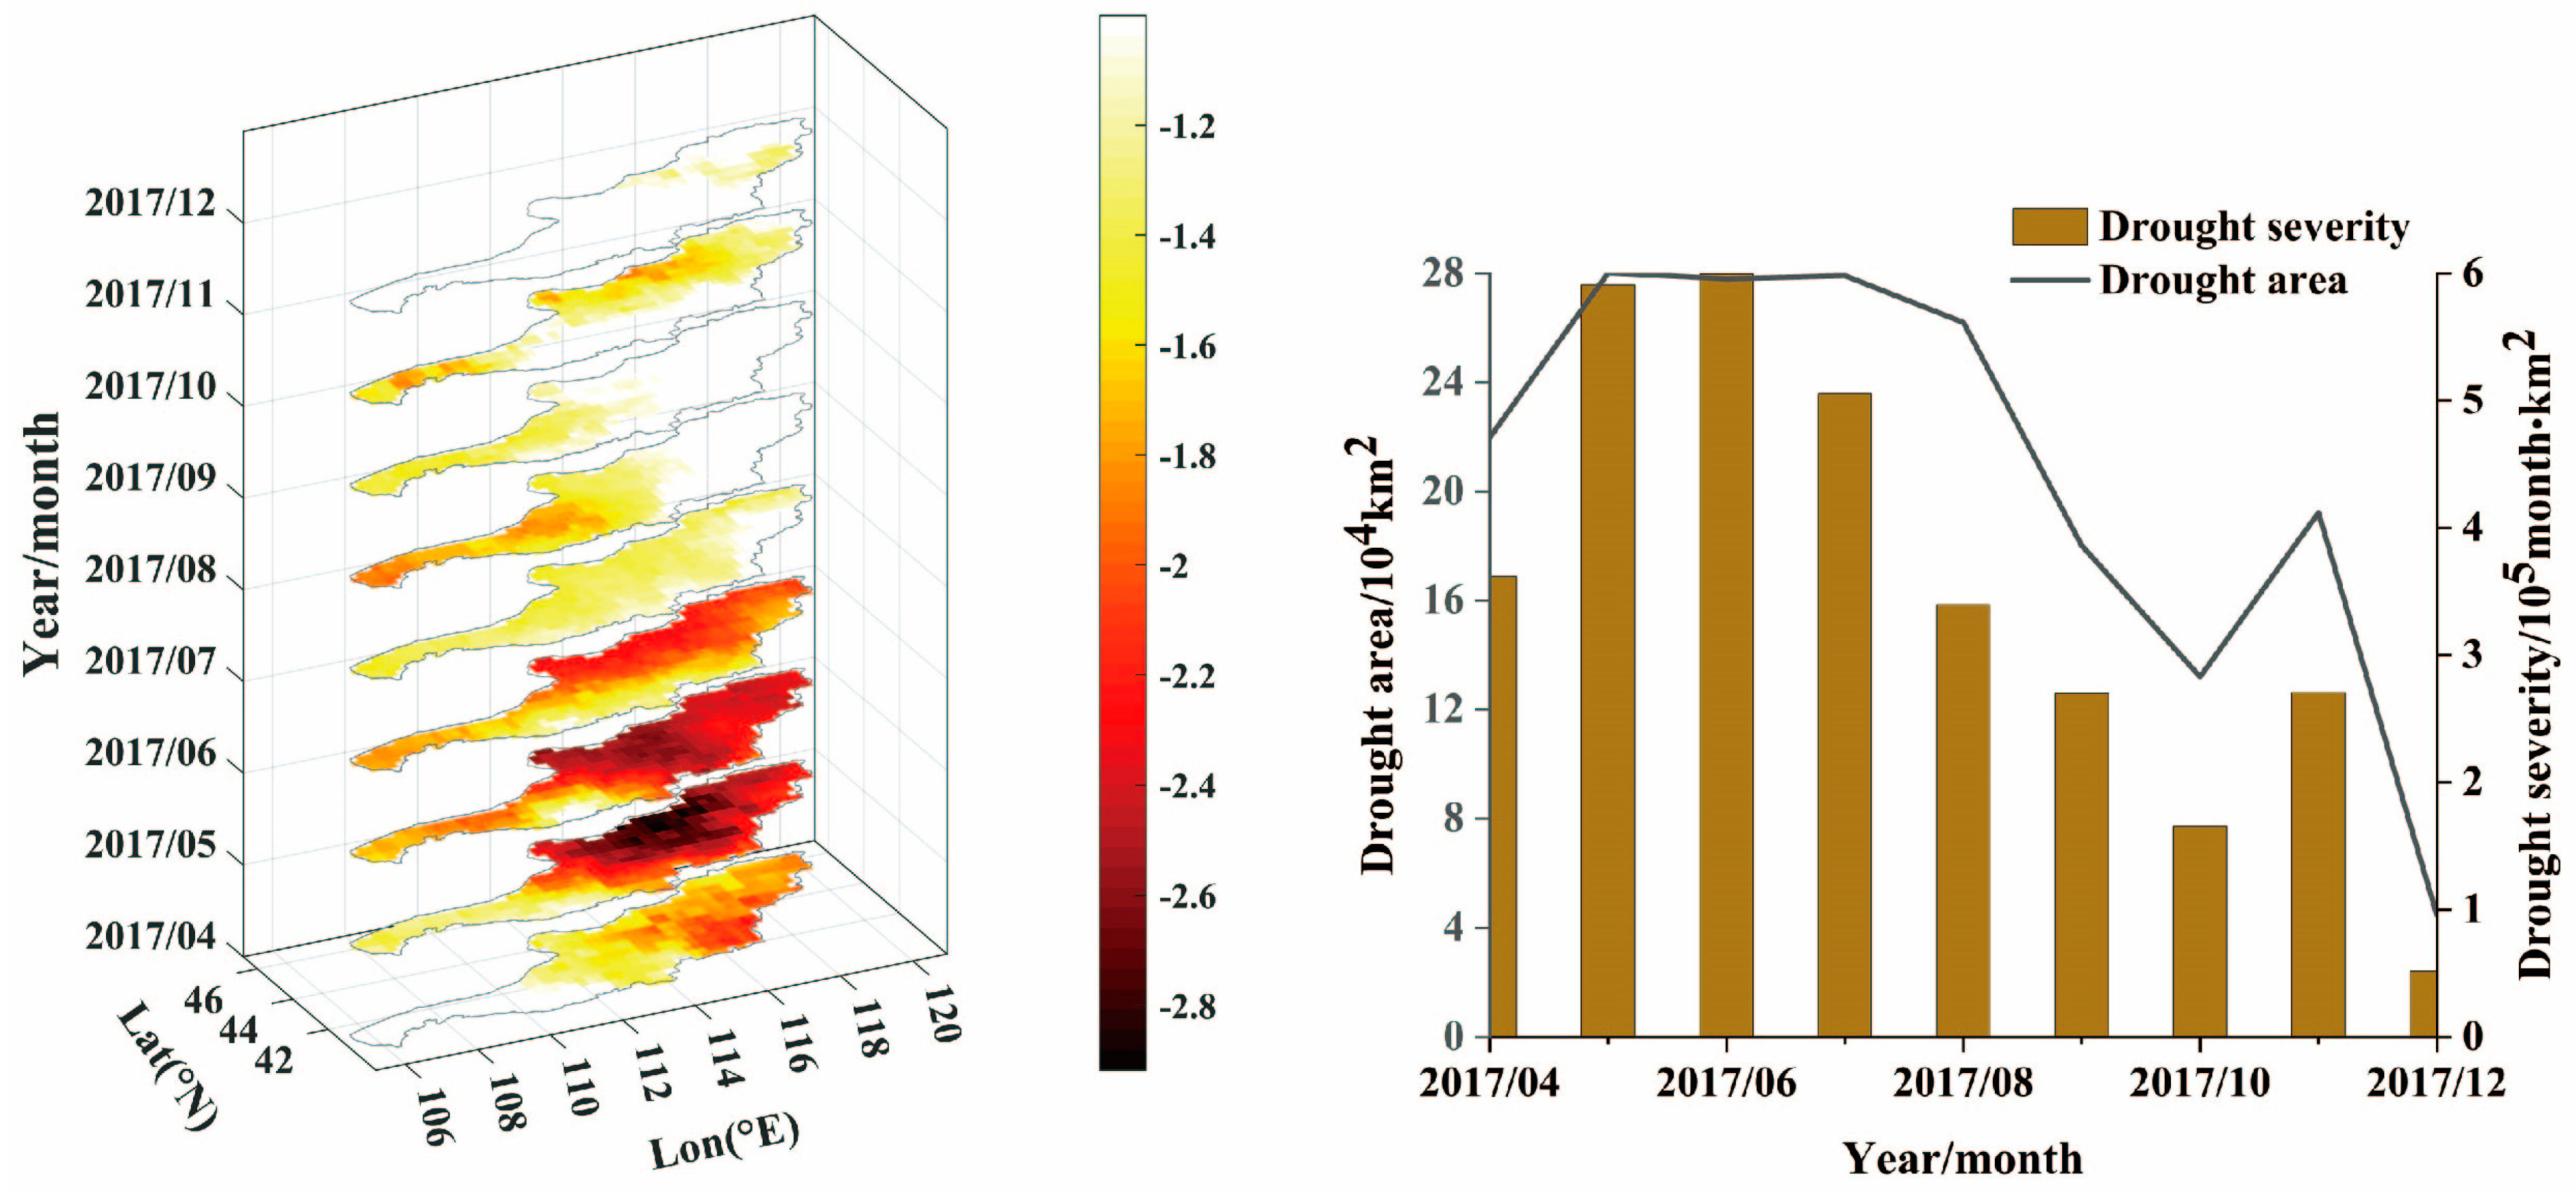
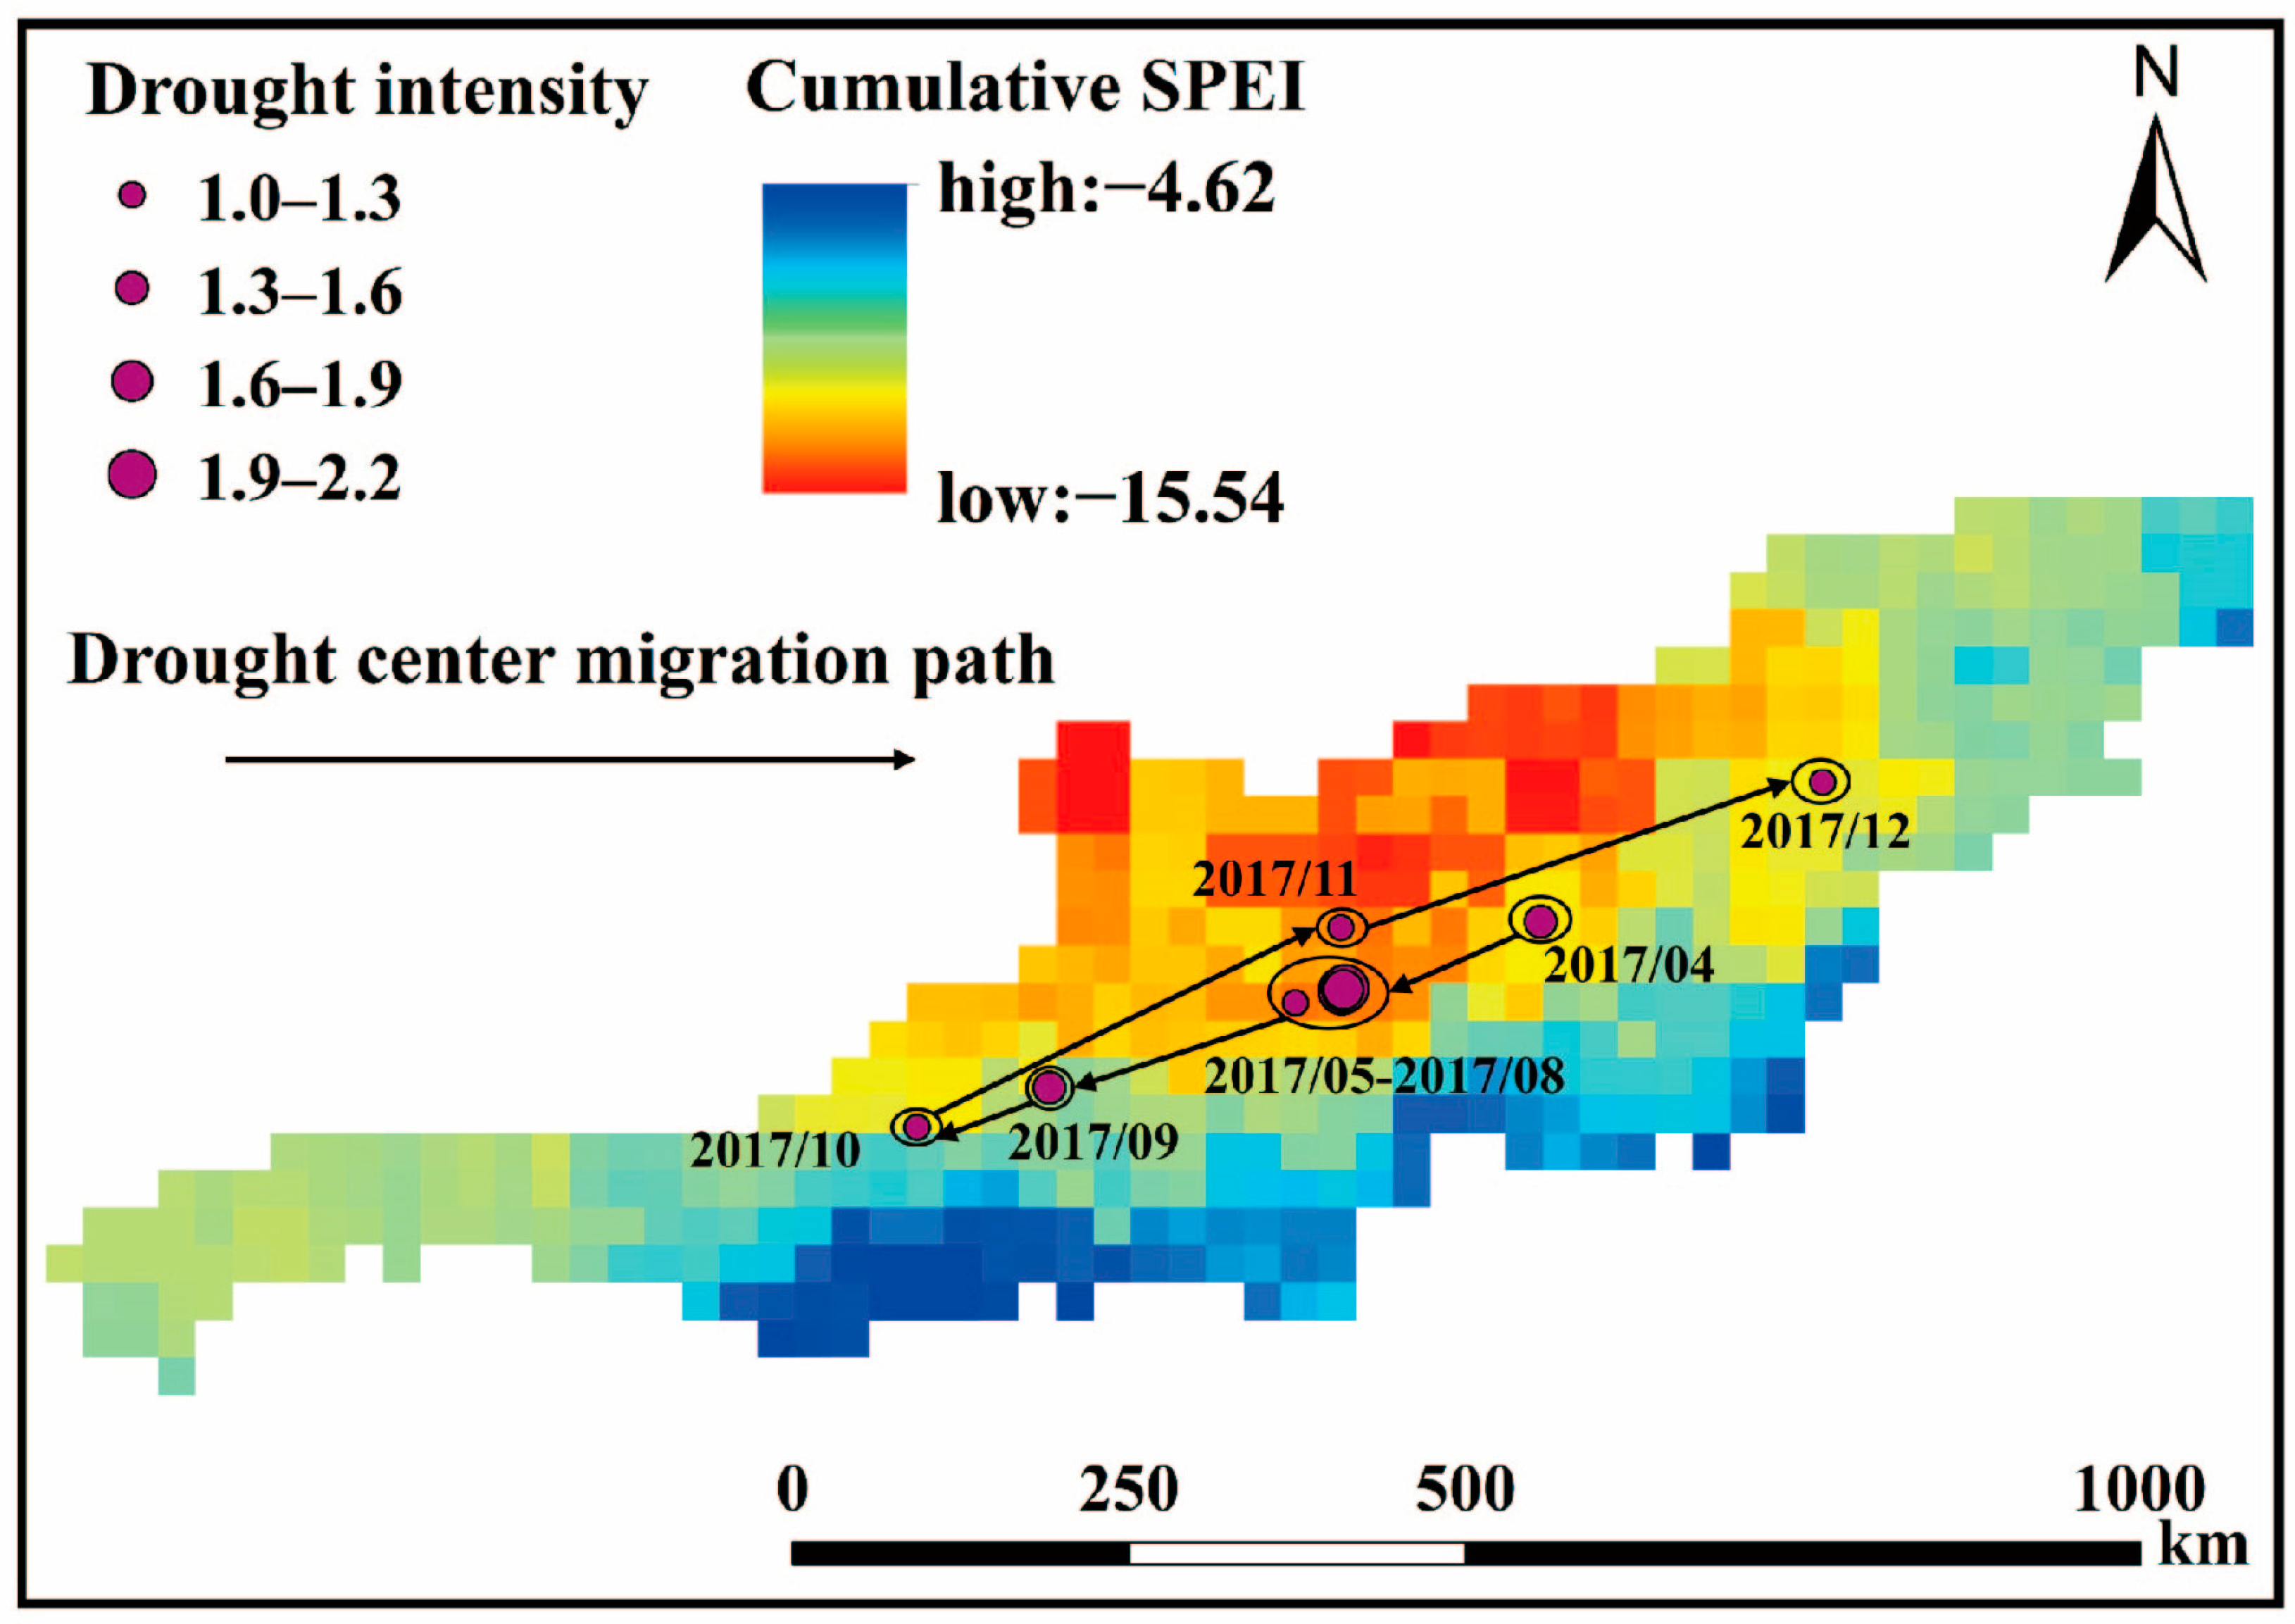
3.4.2. Spatiotemporal Dynamic Evolution of Typical Meteorological Drought Event

Figure 10 illustrates a map of the evolution of the 96th drought event. From the figure, it can be seen that the month-by-month severity and area of the No. 96 drought events followed the same trend, showing an increasing trend from April 2017 to June 2017, and reached the maximum value in June 2017, which were 5.99 × 10⁵ months·km2 and 2.78 × 10⁵ km2, respectively. From July 2017 to September 2017, it showed a downward trend. The drought area and drought severity were 1.92 × 10⁵ km2 and 2.70 × 10⁵ months·km2, respectively. The drought area and drought intensity showed a significant upward trend from October 2017 to November 2017, and reached the maximum value in November 2017. It then showed a decreasing trend in the following month and reached a minimal value in December 2017, with a drought severity and drought area of 5.115 × 10⁴ month·km2 and 4.45 × 10⁴ km2, respectively.
Figure 11 shows the spatial and temporal evolution of the 96th drought event. This meteorological drought event lasted for 9 months from April 2017 to December 2017. The drought severity was 3.299 × 10⁶ months·km2, ranking first among all meteorological drought events. The specific evolutionary features are as follows: the meteorological drought began in April 2017, with an area of about 2.19 × 10⁵ km2 covering the central and eastern parts of IMIRB, among which XB, ZB, ZLB and other places suffered the most severe drought, and the center of the drought was located in the middle of AB. In June 2017, drought was experienced throughout the region and was most severe in EL and SRB. In August, both the area and severity of drought decreased to 2.62 × 10⁵ km2 and 3.39 × 10⁵ month·km2, respectively, and the center of the drought migrated westward to the western part of SLB. In November, the drought severity increased, and the arid area was 1.92 × 10⁵ km2, mainly concentrated in the west and north of IMIRB. The drought has since eased. In December, the drought area was reduced to 4.45 × 10⁴ km2, the drought weakened, and the drought event was lifted. To summarize, this drought was mainly concentrated in the central region, which largely experienced five processes: occurrence—intensification—attenuation—re-intensification—extinction, and the migration path of the drought center was characterized by the transmission from central—southwest—northeast.

4. Discussion

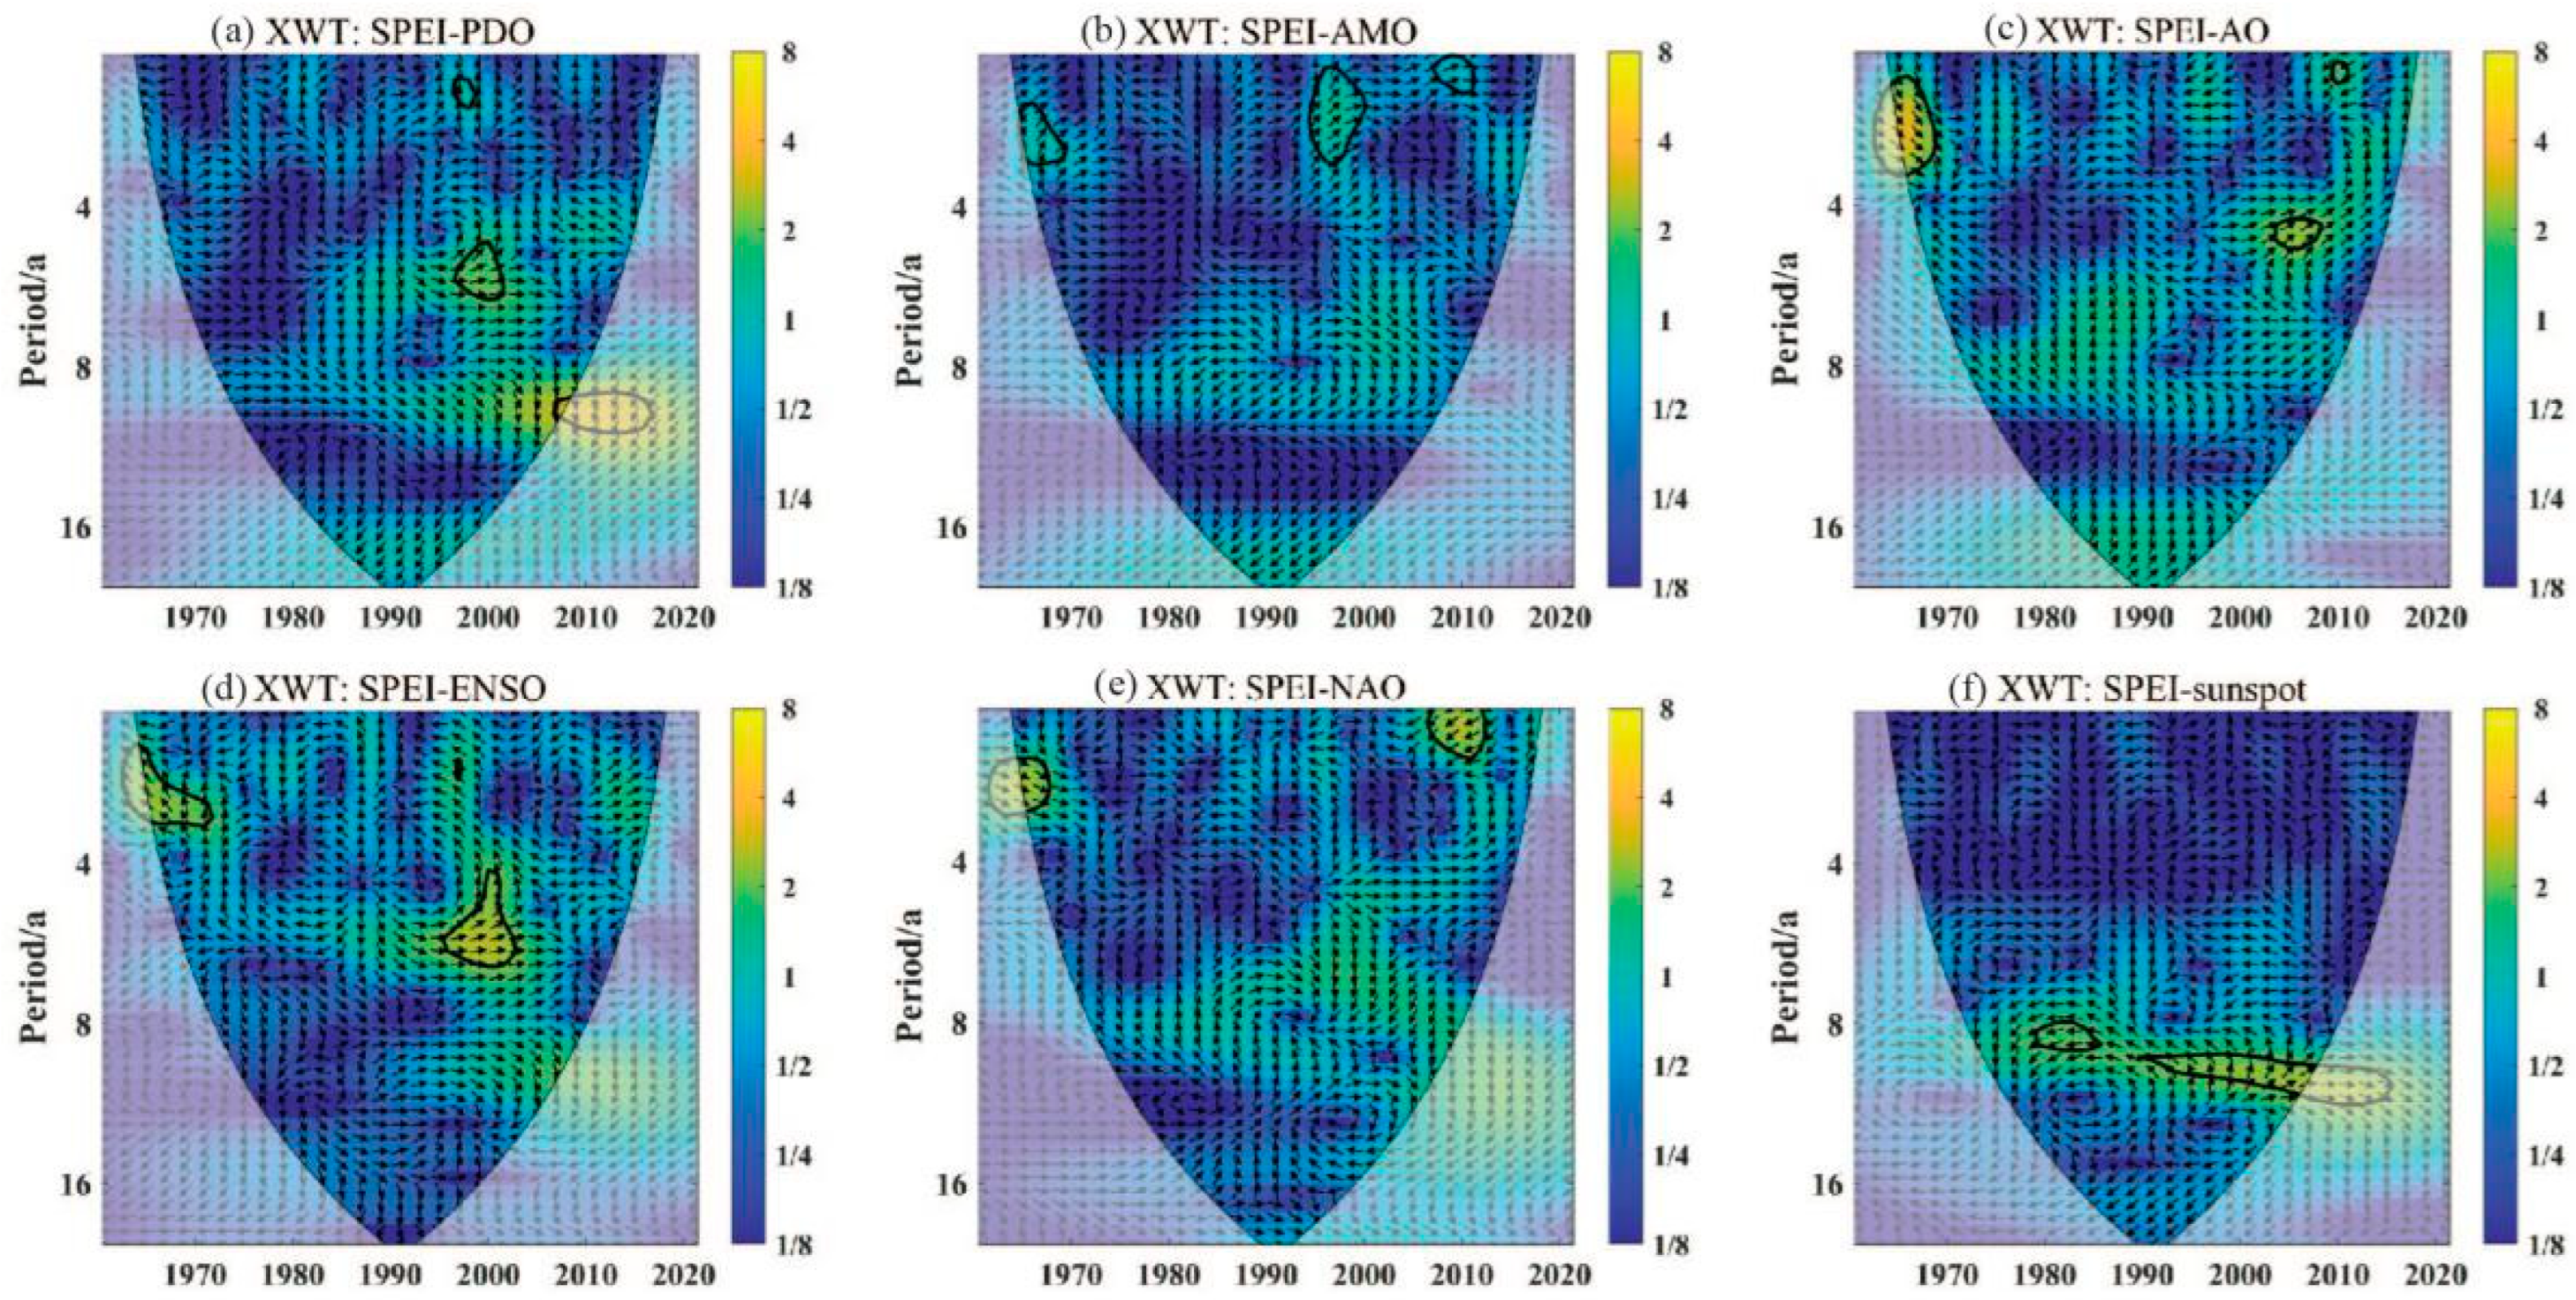
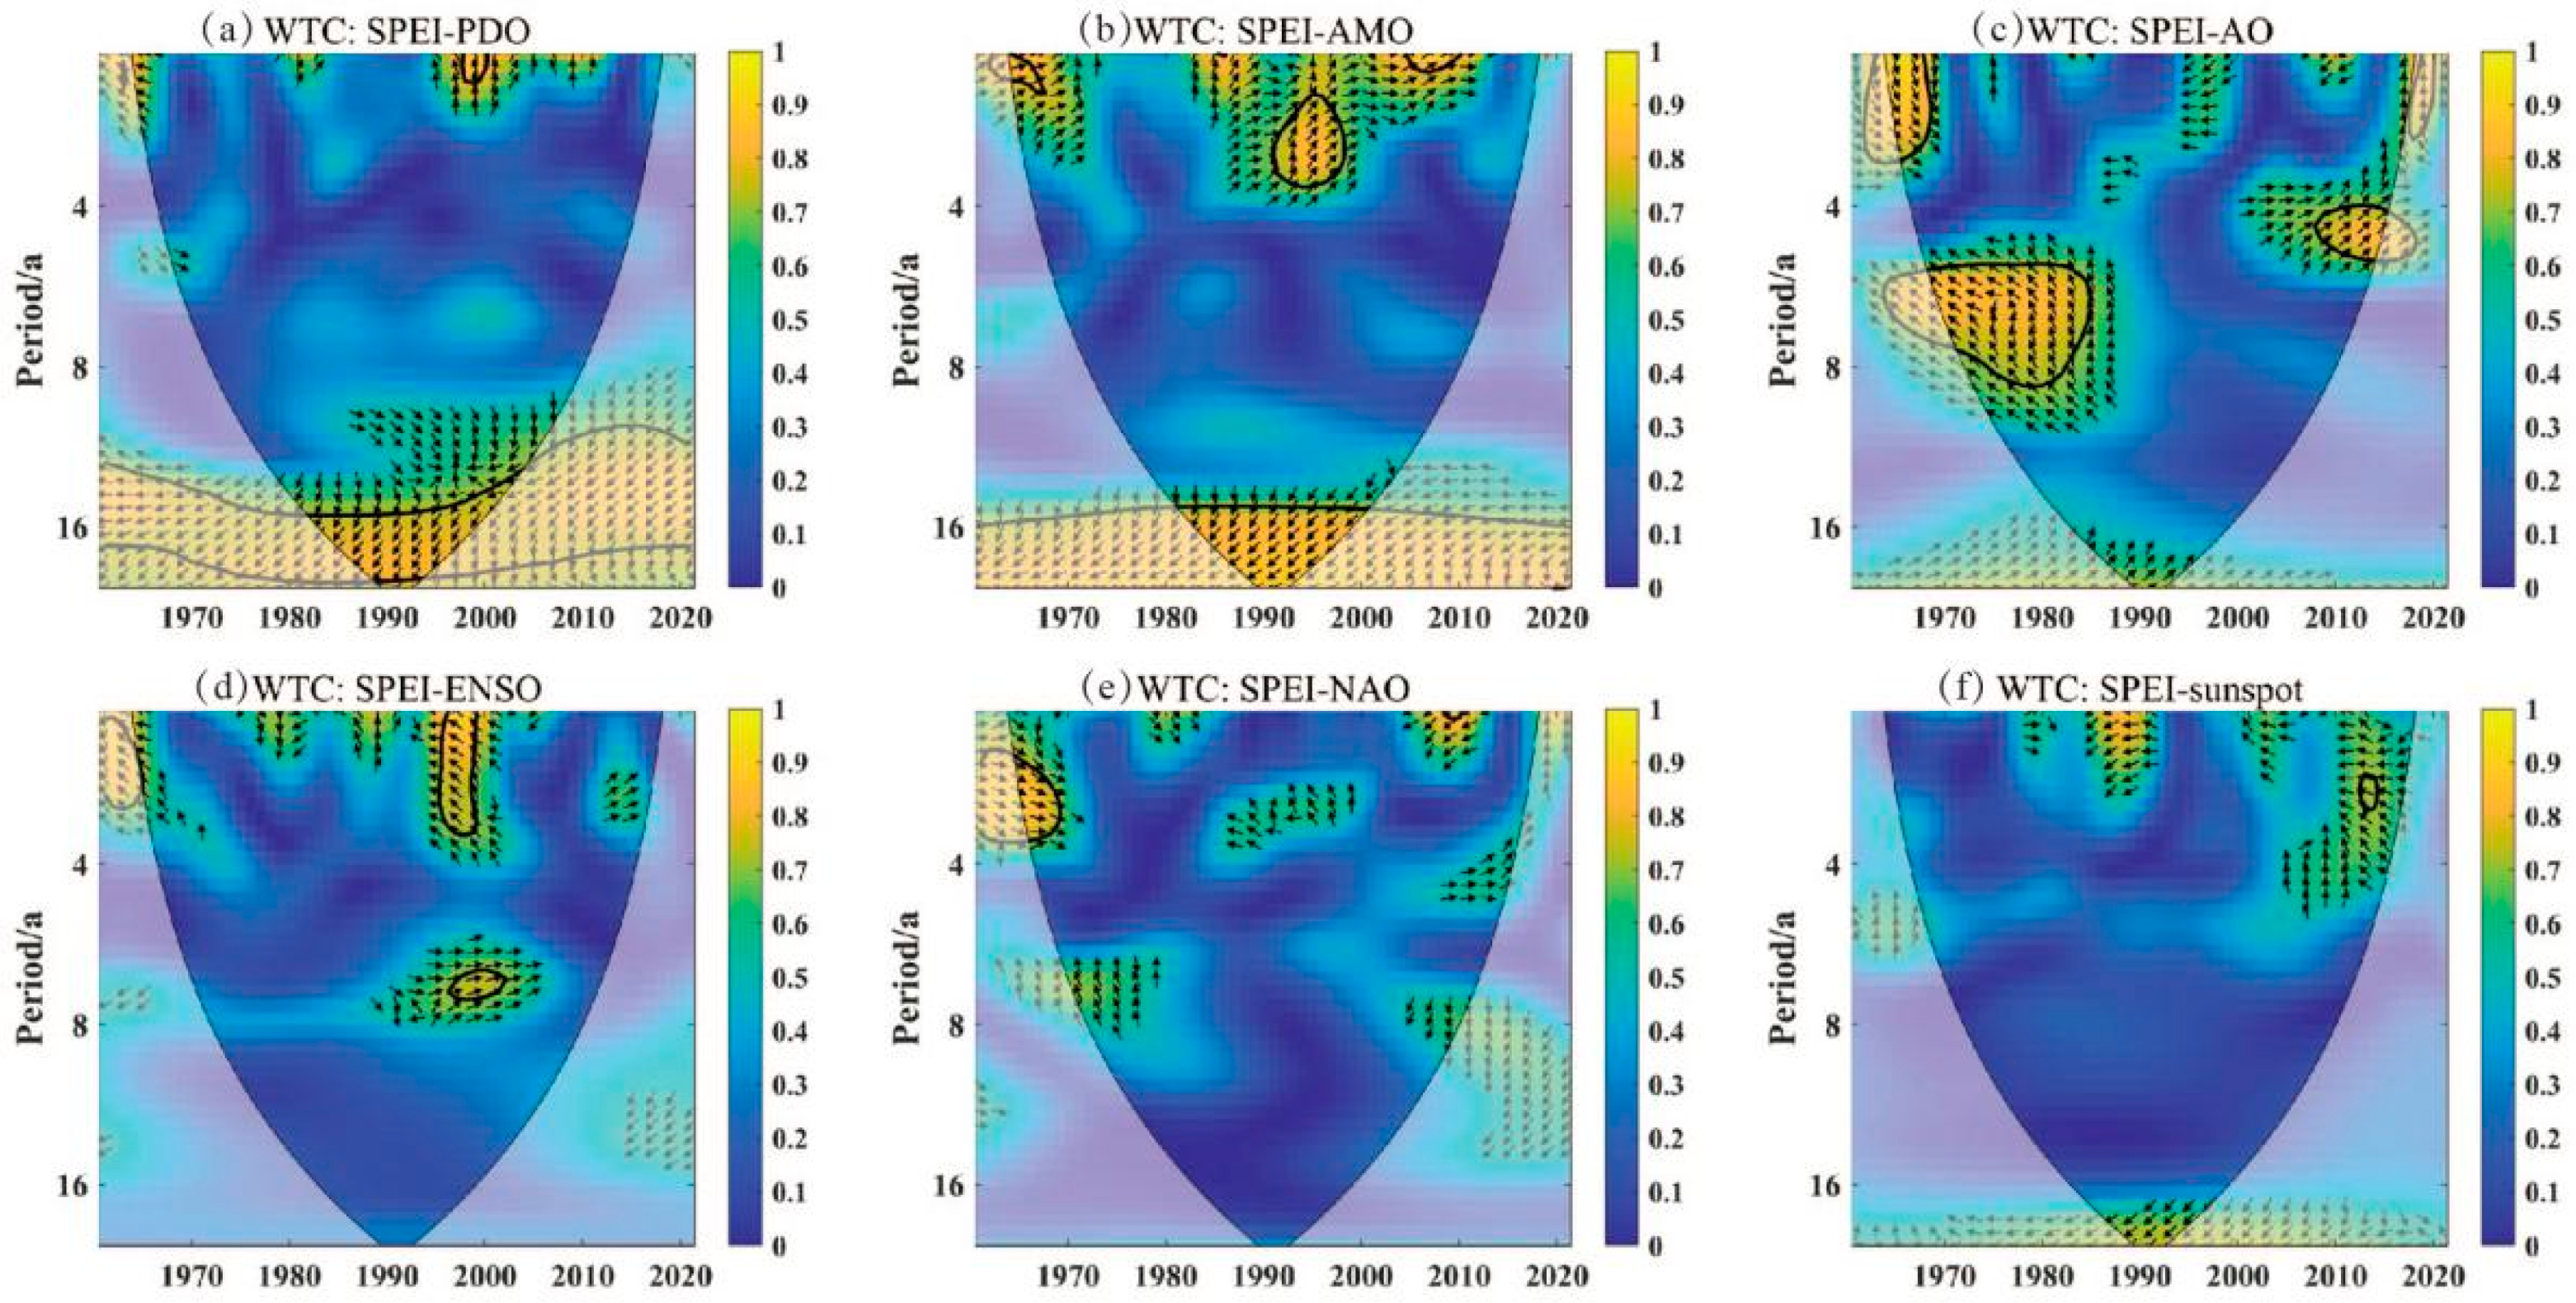
4.1. Driving Factor Study

A detailed definition of the cross wavelet transform is provided in the literature [46]. In this paper, the cross wavelet transform of PDO, AMO, AO, ENSO, NAO, sunspot, and SPEI is used to reveal the influence of atmospheric circulation factors and sunspot on meteorological drought.
Figure 12 shows the cross wavelet energy spectra of IMIRB’s SPEI with atmospheric circulation factors and sunspot, reflecting the correlation between the two in the high-energy region. It can be seen from Figure 12a that SPEI and PDO had a significant resonance period with a strong correlation, which was a 5–6 year period from 1995 to 2000, and they were positively correlated. Figure 12b showed that there were three significant resonance periods for SPEI and AMO, namely, 2–3 years from 1968 to 1973, 1–3 years from 1977 to 2002, and 1–2 years from 2008 to 2012, and the two were positively correlated. SPEI and AO had a predominantly positive correlation with a 4–5 year cycle of significant resonance from 2005–2010. From Figure 12d, it can be seen that there were two cycles of significant resonance between SPEI and ENSO, a 2–3 year cycle from 1966–1974 with a negative correlation, and a 4–6 year cycle from 1995–2003 with a positive correlation. From Figure 12e, it can be seen that there were two cycles of significant resonance between SPEI and NAO with a 2–3 year cycle of 1964–1966 with a positive correlation and a 1–2 year cycle of 2005–2010 with a negative correlation. The cross wavelet cohesion spectrum of SPEI and sunspot are shown in Figure 12f, and there were two significant periods, namely 8–9 years from 1980–1986 and 9–10 years from 1990–2008.
Figure 13 shows the cross wavelet coacervation spectrum of annual SPEI with atmospheric circulation factors and sunspot in the Inner Mongolia inland river basin, reflecting the correlation between the two in the low energy region. As shown in Figure 13, SPEI has significant resonance period with AMO, AO, and ENSO, which is highly correlated, while it has little correlation with PDO, NAO, and sunspot. As shown in Figure 13b, there was mainly one significant resonance cycle between SPEI and AMO, a 2–4 year cycle from 1990–2000, and there was a positive correlation between the two. From Figure 13c, it can be seen that there were three cycles of significant resonance between SPEI and AO, namely, the 1–3 year cycle of 1975–1970, which showed a positive correlation, the 4–6 year cycle of 2006–2012, and the 6–8 year cycle of 1968–1984, which showed a negative correlation. Figure 13d shows that there are two significant resonance cycles between SPEI and ENSO, which are 7–8 years from 1998 to 2002 with a positive correlation, and 1–4 years from 1998 to 2000 with a negative correlation.
According to cross wavelet energy spectrum and condensation spectrum, ENSO has the greatest influence on meteorological drought, and NAO has the least influence on meteorological drought. Previous studies have shown that ENSO can lead to an abnormal rise of ocean temperature, which leads to drought [47]. Zhao et al. showed that ENSO has a good ability to monitor drought and plays an important role in drought resistance and disaster reduction [48]. Katherine et al. showed that the ENSO climate phenomenon could affect the drought situation in Thailand to a certain extent [49]. Xing et al. studied ENSO cold and warm events and found that ENSO could easily lead to drought, and identified ENSO anomaly as an early warning signal of drought [50].
Therefore, combined with the research results of this paper, it is suggested to use ENSO as an input factor for optimizing and improving the drought prediction ability of IMIRB.

4.2. Advantage and Uncertainty

Previous studies mainly analyzed meteorological drought events from the low-dimensional subspace, which could not fully analyze the evolution laws of meteorological drought [51,52,53]. In this paper, the three-dimensional identification method is used to identify drought. The results show that different drought characteristic variables can be extracted, and features such as drought migration paths can also be visualized, which can reflect the drought evolution law more comprehensively. For example, the three-dimensional recognition method identified 49 drought events that lasted more than 2 months from 1961 to 2021, and most of them occurred after 2000, which was not only consistent with the above analysis of the time characteristics of meteorological drought change trend, but also consistent with the research results of Wan et al., indicating that the trend of meteorological drought in the study area was on the rise in recent years [54]. Secondly, the research results show that more than half of the drought events occurred in the 21st century, which is consistent with Liu et al. ‘s analysis of the trend characteristics of drought in Inner Mongolia from 1960 to 2013 based on SPEI, that is, the drought situation in the 21st century is becoming more and more serious [55]. According to the three-dimensional recognition results, the most severe drought event occurred in April 2017. An et al. also showed through their research that, since 2000, March to October have been identified as drought-prone months, and April has the highest frequency of drought, which is consistent with the results of this paper [56]. Notably, this paper not only identified the month in which the drought event occurred, but also found the month-to-month evolution law of the drought event combined with the drought event evolution process map, and found that the drought event presented five processes: occurrence—intensification—attenuation—re-intensification—extinction. Finally, combined with the dynamic evolution of typical drought events, it is found that the migration path of the drought center is characterized by central—southwest—northeast propagation, which further reveals the spatio-temporal evolution law of drought, quantifies the drought characteristics more accurately and in detail, and provides a new idea for future research, to evaluate the spatio-temporal dynamic evolution law of drought.
In this paper, there are still some problems to solve for the study of the evolutional characteristics of the meteorological drought process in the spatio-temporal dimension. First of all, SPEI was calculated based on the monthly precipitation and potential evapotranspiration grid data with a spatial resolution of 0.5° × 0.5°, which roughly identified the drought situation at each location in the study area, which may be biased away from the actual situation. Secondly, some studies have shown that taking a 1.6% area proportion of the study area as the minimum drought cluster area threshold can effectively extract 3D drought events and avoid the appearance of drought cluster fragmentation. However, different thresholds will lead to differences in the extraction of drought events, and the rationality of threshold selection remains to be further verified [44]. Finally, although this paper discusses the influence of atmospheric circulation factors, sunspot, and meteorological drought, relevant studies show that human activities can also cause climate change, which leads to the occurrence and change of drought [57]. Nevertheless, the results of this study still provide a theoretical basis for drought prevention and mitigation in the study area, and contribute to drought prevention and control, and provide a new idea and a new method for meteorological drought research in Inner Mongolia.

5. Conclusions

This paper analyzed the dynamic evolution characteristics of meteorological drought events by calculating SPEI, identified drought events by using a three-dimensional recognition method, then selected typical drought events to analyze the spatio-temporal evolution law, and finally analyzed the factors driving meteorological drought by using the cross wavelet method. In this paper, the main conclusions are as follows:
(1)
As the time scale of the SPEI increased, the number of meteorological drought occurrences decreased; however, drought duration and drought intensity increased.
(2)
The trend of aridification was most pronounced in the spring, with the greatest number of areas showing a significant downward trend, and the areas showing a significant downward trend in SPEI were concentrated in the western part of the IMIRB.
(3)
The area with a high value of meteorological drought intensity in summer is the largest, accounting for 68.29%, but the area of high-frequency drought intensity is the smallest. Winter with high-intensity drought had the smallest area but the largest percentage of high-frequency areas.
(4)
The meteorological drought event, which occurred from April 2017 to December 2017, was the most severe, with the drought area and drought intensity reaching their maximum in June 2017. The drought event experienced five main processes: occurrence—intensification—attenuation—re-intensification— extinction, and the migration path of the drought center was characterized by the transmission from central—southwest—northeast.
(5)
There were correlations between atmospheric circulation factors, sunspot, and meteorological drought in the Inner Mongolian inland river basin. ENSO had the greatest effect on drought.
The results of the study improve the ability of meteorological drought prediction and management in the study area, and can guide decision-making more accurately, so as to realize the transition from passive response to drought to active risk reduction.

Author Contributions

Conceptualization, W.Z. and H.G.; methodology, H.G. and K.F.; software, Y.W.; validation, Z.Z., K.F. and J.L.; formal analysis, H.Y.; data curation, B.F.; writing—original draft preparation, H.G.; writing—review and editing, W.Z. and K.F.; funding acquisition, W.Z., Y.W., Z.Z. and K.F. All authors have read and agreed to the published version of the manuscript.

Funding

This research was funded by Special Research Project of China Institute of Water Resources and Hydropower Research (grant number MK2022J07), The key technology project in Inner Mongolia Autonomous Region: “Research on Key Technologies for Major Drought Disaster Monitoring, Early Warning, and Risk Assessment in the Pastoral Areas of Inner Mongolia” (grant number 2021GG0020), National Natural Science Fund of China (grant number 42301024), Key Special Project of the “Science and Technology Revitalization of Mongolia” Action (grant number 2022EEDSKJXM004-4).

Institutional Review Board Statement

Not applicable.

Informed Consent Statement

Not applicable.

Data Availability Statement

All data in this study are available within the article. More detailed data is not publicly available for the privacy reasons.

Conflicts of Interest

The authors declare no conflicts of interest.

References

  1. Myhre, G.; Alterskjær, K.; Stjern, C.W.; Hodnebrog, Ø.; Marelle, L.; Samset, B.H.; Sillmann, J.; Schaller, N.; Fischer, E.; Schulz, M.; et al. Frequency of extreme precipitation increases extensively with event rareness under global warming. Sci. Rep. 2019, 9, 16063. [Google Scholar] [CrossRef]
  2. Chiang, F.; Mazdiyasni, O.; AghaKouchak, A. Evidence of anthropogenic impacts on global drought frequency, duration, and intensity. Nat. Commun. 2021, 12, 2754. [Google Scholar] [CrossRef]
  3. Ault, T.R. On the essentials of drought in a changing climate. Science 2020, 368, 256–260. [Google Scholar] [CrossRef]
  4. Marvel, K.; Cook, B.I.; Bonfils, C.J.; Durack, P.J.; Smerdon, J.E.; Williams, A.P. Twentieth-century hydroclimate changes consistent with human influence. Nature 2019, 569, 59–65. [Google Scholar] [CrossRef]
  5. Li, J.; Xi, M.; Pan, Z.; Liu, Z.; He, Z.; Qin, F. Response of NDVI and SIF to Meteorological Drought in the Yellow River Basin from 2001 to 2020. Water 2022, 14, 2978. [Google Scholar] [CrossRef]
  6. Liu, X.; Pan, Y.; Zhu, X.; Yang, T.; Bai, J.; Sun, Z.J. Drought evolution and its impact on the crop yield in the North China Plain. J. Hydrol. 2018, 564, 984–996. [Google Scholar] [CrossRef]
  7. Guo, Y.; Huang, S.; Huang, Q.; Leng, G.; Fang, W.; Wang, L.; Wang, H. Propagation thresholds of meteorological drought for triggering hydrological drought at various levels. Sci. Total Environ. 2020, 712, 136502. [Google Scholar] [CrossRef] [PubMed]
  8. Kazemzadeh, M.; Malekian, A. Spatial characteristics and temporal trends of meteorological and hydrological droughts in northwestern Iran. Nat. Hazards 2016, 80, 191–210. [Google Scholar] [CrossRef]
  9. Mishra, A.K.; Singh, V.P. A review of drought concepts. J. Hydrol. 2010, 391, 202–216. [Google Scholar] [CrossRef]
  10. Wu, Z.; Mao, Y.; Li, X.; Lu, G.; Lin, Q.; Xu, H. Exploring spatiotemporal relationships among meteorological, agricultural, and hydrological droughts in Southwest China. Stoch. Environ. Res. Risk Assess. 2016, 30, 1033–1044. [Google Scholar] [CrossRef]
  11. McKee, T.B.; Doesken, N.J.; Kleist, J. The relationship of drought frequency and duration to time scales. In Proceedings of the 8th Conference on Applied Climatology, Anaheim, CA, USA, 17–22 January 1993; pp. 179–183. [Google Scholar]
  12. Palmer, W.C. Meteorological Drought; US Department of Commerce Weather Bureau: Taunton, MA, USA, 1965; Volume 30.
  13. Vicente-Serrano, S.M.; Beguería, S.; López-Moreno, J.I. A multiscalar drought index sensitive to global warming: The standardized precipitation evapotranspiration index. J. Clim. 2010, 23, 1696–1718. [Google Scholar] [CrossRef]
  14. Wambua, R.M.; Mutua, B.M.; Raude, J.M. Analysis of spatial and temporal drought variability in a tropical river basin using Palmer Drought Severity Index (PDSI). Int. J. Water Resour. Environ. Eng. 2017, 9, 178–190. [Google Scholar]
  15. Pandžić, K.; Likso, T.; Pejić, I.; Šarčević, H.; Pecina, M.; Šestak, I.; Tomšić, D.; Strelec Mahović, N. Application of the self-calibrated palmer drought severity index and standardized precipitation index for estimation of drought impact on maize grain yield in Pannonian part of Croatia. Nat. Hazards 2022, 113, 1237–1262. [Google Scholar] [CrossRef]
  16. Lorenzo, M.; Pereira, H.; Alvarez, I.; Dias, J. Standardized Precipitation Index (SPI) evolution over the Iberian Peninsula during the 21st century. Atmos. Res. 2023, 297, 107132. [Google Scholar] [CrossRef]
  17. Zhang, S.; Li, J.; Zhang, T.; Feng, P.; Liu, W. Response of vegetation to SPI and driving factors in Chinese mainland. Agric. Water Manag. 2024, 291, 108625. [Google Scholar] [CrossRef]
  18. Mupepi, O.; Matsa, M.M. A combination of vegetation condition index, standardized precipitation index and human observation in monitoring spatio-temporal dynamics of drought. A case of Zvishavane District in Zimbabwe. Environ. Dev. 2023, 45, 100802. [Google Scholar] [CrossRef]
  19. Guo, H.; Bao, A.; Liu, T.; Ndayisaba, F.; Jiang, L.; Kurban, A.; De Maeyer, P. Spatial and temporal characteristics of droughts in Central Asia during 1966–2015. Sci. Total Environ. 2018, 624, 1523–1538. [Google Scholar] [CrossRef]
  20. Shen, X.; Wu, X.; Xie, X.; Ma, Z.; Yang, M. Spatiotemporal analysis of drought characteristics in Song-Liao river basin in China. Adv. Meteorol. 2017, 2017, 1–13. [Google Scholar] [CrossRef]
  21. Zuo, D.; Cai, S.; Xu, Z.; Li, F.; Sun, W.; Yang, X.; Kan, G.; Liu, P.J.T.; Climatology, A. Spatiotemporal patterns of drought at various time scales in Shandong Province of Eastern China. Adv. Meteorol. 2018, 131, 271–284. [Google Scholar] [CrossRef]
  22. Tan, Y.X.; Ng, J.L.; Huang, Y.F. Spatiotemporal variability assessment and accuracy evaluation of standardized precipitation index and standardized precipitation evapotranspiration index in Malaysia. Earth Sci. Inform. 2023, 16, 67–89. [Google Scholar] [CrossRef]
  23. Kamruzzaman, M.; Almazroui, M.; Salam, M.; Mondol, M.A.H.; Rahman, M.M.; Deb, L.; Kundu, P.K.; Zaman, M.A.U.; Islam, A.R.M.T. Spatiotemporal drought analysis in Bangladesh using the standardized precipitation index (SPI) and standardized precipitation evapotranspiration index (SPEI). Sci. Rep. 2022, 12, 20694. [Google Scholar] [CrossRef] [PubMed]
  24. Qaisrani, Z.N.; Nuthammachot, N.; Techato, K.; Geosciences, A. Drought monitoring based on Standardized Precipitation Index and Standardized Precipitation Evapotranspiration Index in the arid zone of Balochistan province, Pakistan. Arab. J. Geosci. 2021, 14, 1–13. [Google Scholar] [CrossRef]
  25. Lotfirad, M.; Esmaeili-Gisavandani, H.; Adib, A. Drought monitoring and prediction using SPI, SPEI, and random forest model in various climates of Iran. J. Water Clim. Chang. 2022, 13, 383–406. [Google Scholar] [CrossRef]
  26. Ma, J.; Zhang, C.; Li, S.; Yang, C.; Chen, C.; Yun, W. Changes in Vegetation Resistance and Resilience under Different Drought Disturbances Based on NDVI and SPEI Time Series Data in Jilin Province, China. Remote Sens. 2023, 15, 3280. [Google Scholar] [CrossRef]
  27. Du, W.; Hao, Z.; Bai, M.; Zhang, L.; Zhang, C.; Wang, Z.; Xing, P. Spatiotemporal Variation in the Meteorological Drought Comprehensive Index in the Beijing–Tianjin–Hebei Region during 1961–2023. Water 2023, 15, 4230. [Google Scholar] [CrossRef]
  28. Ling, M.; Guo, X.; Shi, X.; Han, H. Temporal and spatial evolution of drought in Haihe River Basin from 1960 to 2020. Ecol. Indic. 2022, 138, 108809. [Google Scholar] [CrossRef]
  29. Wen, X.; Tu, Y.-H.; Tan, Q.-F.; Li, W.-Y.; Fang, G.-H.; Ding, Z.-Y.; Wang, Z.-N. Construction of 3D drought structures of meteorological drought events and their spatio-temporal evolution characteristics. J. Hydrol. 2020, 590, 125539. [Google Scholar] [CrossRef]
  30. Zhang, W.; Feng, K.; Wang, F.; Wang, W.; Zhang, Z.; Wang, Y.; Huang, S. Dynamic Evolution and Copula-Based Multivariable Frequency Analysis of Meteorological Drought Considering the Spatiotemporal Variability in Northwestern China. Water 2023, 15, 3861. [Google Scholar] [CrossRef]
  31. Xu, K.; Yang, D.; Yang, H.; Li, Z.; Qin, Y.; Shen, Y. Spatio-temporal variation of drought in China during 1961–2012: A climatic perspective. J. Hydrol. 2015, 526, 253–264. [Google Scholar] [CrossRef]
  32. Guo, H.; Bao, A.; Ndayisaba, F.; Liu, T.; Jiapaer, G.; El-Tantawi, A.M.; De Maeyer, P. Space-time characterization of drought events and their impacts on vegetation in Central Asia. J. Hydrol. 2018, 564, 1165–1178. [Google Scholar] [CrossRef]
  33. Feng, K.; Yan, Z.; Li, Y.; Wang, F.; Zhang, Z.; Su, X.; Wu, H.; Zhang, G.; Wang, Y. Spatio-temporal dynamic evaluation of agricultural drought based on a three-dimensional identification method in Northwest China. Agric. Water Manag. 2023, 284, 108325. [Google Scholar] [CrossRef]
  34. Guo, H.; Li, M.; Nzabarinda, V.; Bao, A.; Meng, X.; Zhu, L.; De Maeyer, P. Assessment of three long-term satellite-based precipitation estimates against ground observations for drought characterization in northwestern China. Remote Sens. 2022, 14, 828. [Google Scholar] [CrossRef]
  35. Xu, H.; Wang, X.; Zhang, X. Decreased vegetation growth in response to summer drought in Central Asia from 2000 to 2012. Int. J. Appl. Earth Obs. Geoinf. 2016, 52, 390–402. [Google Scholar] [CrossRef]
  36. Wang, Y.; Liu, G.; Guo, E. Spatial distribution and temporal variation of drought in Inner Mongolia during 1901–2014 using Standardized Precipitation Evapotranspiration Index. Sci. Total Environ. 2019, 654, 850–862. [Google Scholar] [CrossRef] [PubMed]
  37. Huang, J.; Xue, Y.; Sun, S.; Zhang, J. Spatial and temporal variability of drought during 1960–2012 in Inner Mongolia, north China. Quat. Int. 2015, 355, 134–144. [Google Scholar] [CrossRef]
  38. Forootan, E.; Khaki, M.; Schumacher, M.; Wulfmeyer, V.; Mehrnegar, N.; van Dijk, A.I.; Brocca, L.; Farzaneh, S.; Akinluyi, F.; Ramillien, G. Understanding the global hydrological droughts of 2003–2016 and their relationships with teleconnections. Sci. Total Environ. 2019, 650, 2587–2604. [Google Scholar] [CrossRef] [PubMed]
  39. Bo, M.; Guo, Y.-Q.; Tao, H.-B.; Liu, G.-Z.; Li, S.-K.; Pu, W. SPEIPM-based research on drought impact on maize yield in North China Plain. J. Integr. Agric. 2015, 14, 660–669. [Google Scholar]
  40. Merabti, A.; Darouich, H.; Paredes, P.; Meddi, M.; Pereira, L.S. Assessing Spatial Variability and Trends of Droughts in Eastern Algeria Using SPI, RDI, PDSI, and MedPDSI—A Novel Drought Index Using the FAO56 Evapotranspiration Method. Water 2023, 15, 626. [Google Scholar] [CrossRef]
  41. Ullah, I.; Ma, X.; Yin, J.; Omer, A.; Habtemicheal, B.A.; Saleem, F.; Iyakaremye, V.; Syed, S.; Arshad, M.; Liu, M. Spatiotemporal characteristics of meteorological drought variability and trends (1981–2020) over South Asia and the associated large-scale circulation patterns. Clim. Dyn. 2023, 60, 2261–2284. [Google Scholar] [CrossRef]
  42. Peng, Y.; Peng, T.; Li, Y. Spatiotemporal Characteristics of Drought in Northwest China Based on SPEI Analysis. Atmosphere 2023, 14, 1188. [Google Scholar] [CrossRef]
  43. Sheffield, J.; Andreadis, K.; Wood, E.F.; Lettenmaier, D.P. Global and continental drought in the second half of the twentieth century: Severity–area–duration analysis and temporal variability of large-scale events. J. Clim. 2009, 22, 1962–1981. [Google Scholar] [CrossRef]
  44. Wang, A.; Lettenmaier, D.P.; Sheffield, J. Soil moisture drought in China, 1950–2006. J. Clim. 2011, 24, 3257–3271. [Google Scholar] [CrossRef]
  45. Xie, Y.; Liu, S.; Fang, H.; Ding, M.; Liu, D. A study on the precipitation concentration in a Chinese region and its relationship with teleconnections indices. J. Hydrol. 2022, 612, 128203. [Google Scholar] [CrossRef]
  46. Su, L.; Miao, C.; Duan, Q.; Lei, X.; Li, H. Multiple-wavelet coherence of world’s large rivers with meteorological factors and ocean signals. J. Geophys. Res. Atmos. 2019, 124, 4932–4954. [Google Scholar] [CrossRef]
  47. Sun, B.; Wang, H.; Li, H.; Zhou, B.; Duan, M.; Li, H. A Long-Lasting Precipitation Deficit in South China During Autumn-Winter 2020/2021: Combined Effect of ENSO and Arctic Sea Ice. J. Geophys. Res. Atmos. 2022, 127, e2021JD035584. [Google Scholar] [CrossRef]
  48. Zhao, Q.; Liu, K.; Li, Z.; Liu, Y.; Yao, Y. A novel ENSO monitoring index and its potential for drought application. J. Atmos. Sol. Terr. Phys. 2021, 225, 105762. [Google Scholar] [CrossRef]
  49. Power, K.; Barnett, J.; Dickinson, T.; Axelsson, J. The role of El Niño in driving drought conditions over the last 2000 years in Thailand. Quaternary 2020, 3, 18. [Google Scholar] [CrossRef]
  50. Xing, Z.; Yu, Z.; Wei, J.; Zhang, X.; Ma, M.; Yi, P.; Ju, Q.; Wang, J.; Laux, P.; Kunstmann, H. Lagged influence of ENSO regimes on droughts over the Poyang Lake basin, China. Atmos. Res. 2022, 275, 106218. [Google Scholar] [CrossRef]
  51. Yang, P.; Zhai, X.; Huang, H.; Zhang, Y.; Zhu, Y.; Shi, X.; Zhou, L.; Fu, C. Association and driving factors of meteorological drought and agricultural drought in Ningxia, Northwest China. Atmos. Res. 2023, 289, 106753. [Google Scholar] [CrossRef]
  52. Wuyun, D.; Sun, L.; Chen, Z.; Hou, A.; Crusiol, L.G.T.; Yu, L.; Chen, R.; Sun, Z. The spatiotemporal change of cropland and its impact on vegetation dynamics in the farming-pastoral ecotone of northern China. Sci. Total Environ. 2022, 805, 150286. [Google Scholar] [CrossRef]
  53. Wei, B.; Wei, J.; Jia, X.; Ye, Z.; Yu, S.; Yin, S. Spatiotemporal Patterns of Land Surface Phenology from 2001 to 2021 in the Agricultural Pastoral Ecotone of Northern China. Sustainability 2023, 15, 5830. [Google Scholar] [CrossRef]
  54. Wan, L.; Bento, V.A.; Qu, Y.; Qiu, J.; Song, H.; Zhang, R.; Wu, X.; Xu, F.; Lu, J.; Wang, Q. Drought characteristics and dominant factors across China: Insights from high-resolution daily SPEI dataset between 1979 and 2018. Sci. Total Environ. 2023, 901, 166362. [Google Scholar] [CrossRef] [PubMed]
  55. Liu, S.; Kang, W.; Wang, T. Drought variability in Inner Mongolia of northern China during 1960–2013 based on standardized precipitation evapotranspiration index. Environ. Earth Sci. 2016, 75, 145. [Google Scholar] [CrossRef]
  56. An, Q.; He, H.; Nie, Q.; Cui, Y.; Gao, J.; Wei, C.; Xie, X.; You, J. Spatial and temporal variations of drought in Inner Mongolia, China. Water 2020, 12, 1715. [Google Scholar] [CrossRef]
  57. Lu, C.; Sun, Y.; Christidis, N.; Stott, P.A. Contribution of global warming and atmospheric circulation to the hottest spring in eastern China in 2018. Adv. Atmos. Sci. 2020, 37, 1285–1294. [Google Scholar] [CrossRef]
Figure 1. Basic overview of the research area. EU, East Ujumuqin Banner; WU, Wast Ujumuqin Banner; KT, Hexigten Banner; XH, Xinghe County; AB, Abaga Banner; ZLB, Zhenglan Banner; ZB, Zhengxiangbai Banner; SLB, Sonid Left Banner; XH, Xilinhot City; SD, Shangdu County; XB, Xianghuang Banner; SRB, Sonid Right Banner; EL, Erenhot City; CRW, Qahar youyi houqi; SZW, Siziwang Banner; WC, Wuchuan County; SG, Shiguai District; DM, Darhan Muminggan United Banner; UMB, Urat Middle Banner; UBB, Urat Rear Banner.
Sustainability 16 02212 g001
Figure 2. Drought patch identification diagram.
Sustainability 16 02212 g002
Figure 3. Schematic diagram of drought patch time–history connection.
Sustainability 16 02212 g003
Figure 4. Multi-scale (1–24 months) SPEI time evolution characteristics of IMIRB during 1961–2021.
Sustainability 16 02212 g004
Figure 5. Temporal trends of SPEI at different scales in IMIRB from 1961 to 2021.
Sustainability 16 02212 g005
Figure 6. Spatial distribution characteristics of seasonal SPEI series change trend from 1961 to 2021.
Sustainability 16 02212 g006
Figure 7. Variation characteristics of seasonal drought intensity and area proportion of IMIRB during 1961–2021.
Sustainability 16 02212 g007
Figure 8. Spatial distribution of IMIRB seasonal meteorological drought intensity during 1961–2021.
Sustainability 16 02212 g008
Figure 9. Spatial distribution of seasonal meteorological drought frequency in IMIRB from 1961 to 2021.
Sustainability 16 02212 g009
Figure 10. Map of the evolution of the 96th drought event.
Sustainability 16 02212 g010
Figure 11. Dynamic evolution of the most severe meteorological drought events from 1961 to 2021.
Sustainability 16 02212 g011
Figure 12. Cross wavelet energy spectra of atmospheric circulation factor, sunspot, and SPEI.
Sustainability 16 02212 g012
Figure 13. Cross wavelet condensation spectra of atmospheric circulation factor, sunspot, and SPEI.
Sustainability 16 02212 g013
Table 1. Names and data sources of atmospheric circulation factors.
Atmospheric Circulation
Factors
Data Sources
PDOhttp://www.ncdc.noaa.gov/teleconnections/pdo/ (accessed on 29 November 2023)
AMOhttps://www.esrl.noaa.gov/psd/gcos_wgsp/Timeseries/ (accessed on 29 November 2023)
AOhttps://www.ncdc.noaa.gov/teleconnections/ao/ (accessed on 29 November 2023)
ENSOhttp://www.esrl.noaa.gov/psd/data/correlation/nina34.data (accessed on 29 November 2023)
NAOhttps://www.ncdc.noaa.gov/teleconnections/nao/ (accessed on 29 November 2023)
sunspothttp://www.sidc.be/sunspot-data (accessed on 29 November 2023)
Table 2. Drought classification of SPEI.
Drought LevelSPEIDrought Severity
I−0.5 < SPEINo drought
II−1 < SPEI ≤ −0.5Light drought
III−1.5 < SPEI ≤ −1Moderate drought
IV−2 < SPEI ≤ −1.5Severe drought
VISPEI ≤ −2Extreme drought
Table 3. The 10 most severe meteorological drought events from 1961 to 2021.
NumberStart Time (Year/Month)End Time (Year/Month)Drought Duration
(Month)
Drought CenterDrought Area
(104 km2)
Drought Severity
(105 Months·km2)
lonlat
962017/042017/129113.6743.252.8023.299
732005/052006/019113.3043.022.7743.001
421988/111989/0911114.6743.362.7282.731
672001/052002/0311106.9341.292.7292.370
772007/062007/116114.8943.612.7282.130
862011/032011/119113.2242.812.8022.081
892013/112014/057113.1242.992.6781.927
982018/122019/056114.8743.742.7341.714
51965/061965/127113.3242.922.5971.679
662000/042000/096113.7943.352.4421.602
Disclaimer/Publisher’s Note: The statements, opinions and data contained in all publications are solely those of the individual author(s) and contributor(s) and not of MDPI and/or the editor(s). MDPI and/or the editor(s) disclaim responsibility for any injury to people or property resulting from any ideas, methods, instructions or products referred to in the content.

