Abstract
Understanding the phosphorus (P) cycle is essential for preventing soil P loss, improving environmental quality, and promoting sustainable agriculture, particularly in urban areas. In this study, a representative city of the lower Yangtze River Basin, Nanchang, was chosen to systematically explore the distribution and transformation of soil P forms, which were extracted by an improved SEDEX method and measured by a standard phosphorus–molybdenum blue method under three land use patterns. The contents of soil P forms were the highest in the dryland and the lowest in the paddy field, with total P accumulation in the upper wasteland and paddy field soils but in the lower dryland soil. The pH value and grain size affected soil P form distributions to a variable extent from one land use pattern to another. The transformation of soil P forms was weak in the wasteland. It was first found that some detrital limestone P (De-P) was transformed into exchangeable P (Ex-P) in the paddy field with authigenic calcium-bound phosphorus (Au-P) and organic phosphorus (OP) transformation, and the transformation between Ex-P and iron-bound phosphorus (Fe-P), Au-P, and between Au-P and OP existed in the dryland. Land use pattern was the dominant driver for the P distribution and transformation of soil P. This study highlights the critical role of land use patterns in affecting the P cycle of soils in urban areas and the importance of sustainable urban land management.
1. Introduction
Phosphorus is one of the common elements in soil and an essential nutrient for the growth and development of plants [1,2]. The content and form of soil phosphorus usually change with soil development, and the amount of bioavailable phosphorus directly limits plant growth [3]. Therefore, soil phosphorus plays an important role in maintaining agricultural production and ecosystem development [4,5,6]. At the same time, the loss of soil phosphorus leads to an increase in phosphorus concentration in surrounding water bodies, which, in serious cases, will lead to water eutrophication [7,8]. Therefore, studies on phosphorus forms and transformation in soil not only help guide the rational fertilization of sustainable agriculture but also provide a scientific basis for the sustainable development of ecological environments [9].
Parent rocks are the material basis for soil formation, and their phosphorus content directly determines the level and distribution characteristics of soil phosphorus content [4,10]. Different climate zones often lead to differences in the distributions of soil phosphorus forms in different regions [11,12,13]. Soil property also has a significant impact on soil phosphorus forms [14,15,16]. For example, when the pH value increases, OH− and phosphate anion exchange with each other in the soil system, resulting in the release of phosphorus [17,18]. In addition, an increase in soil clay content usually leads to the adsorption and chemical fixation of phosphorus, thereby weakening the activation ability of phosphorus in the soil [19,20]. The alternation between dry and wet seasons is also an important factor affecting changes in soil phosphorus forms. For example, significant changes in soil phosphorus forms were found in the Three Gorges Fluctuation Zone after seasonal dry–wet cycles [21]. It was further pointed out by some authors that the frequent alternation of dry–wet conditions in the Three Gorges Reservoir Area exacerbated the loss of active phosphorus in the soil of the subsidence zone [22]. In recent years, due to the significant increase in human activities, land use patterns have also become extremely important factors affecting the distributions of soil phosphorus forms and their bioavailability [23,24,25,26,27]. Different land use patterns actually alter the physical, chemical, and biological processes of soils due to different management measures, such as cultivation, irrigation, and fertilization, resulting in changes in soil phosphorus characteristics [28,29]. Up to now, there have been a lot of studies on soil phosphorus forms in the world [10,13,19,22,24,26,28,29,30]. Previous studies have provided good perspectives for understanding the distribution characteristics of phosphorus forms and their geochemical cycles in soils.
In the context of rapid urbanization, land use patterns are diversified in urban areas, and the distribution of soil phosphorus forms and their geochemical behaviors could be different from those of other areas [25]. Conducting studies on soil phosphorus forms in urban areas is beneficial for optimizing land use management measures and adjusting the structure of urban ecological environment systems. However, relevant studies on urban soil P are scarce. Some critical questions need to be solved, for example, what the dynamics of soil P forms are, which influences affect soil P distributions, and how soil P forms are transformed under different land use patterns in urban areas.
Nanchang City is a large provincial capital of the lower Yangtze River Basin, lying to the southwest of the largest lake in Jiangxi Province, Poyang Lake. In this city, river networks have developed, and there is a warm climate with enough rainfall. Under unique lithological, hydrological, and meteorological conditions, soil formation could differ in this city from other areas, which could cause different soil P dynamics and behaviors. In recent years, with the acceleration of urbanization, the changes in land use patterns in Nanchang City probably made soil P dynamics and behaviors more complex. In this study, the three typical land use patterns of soils in Nanchang City (wasteland, paddy field, and dryland) were first considered the study objects to determine the concentration of various phosphorus forms in soils. The aim of this study was to reveal the distribution, influences, and transformation of soil P forms. The findings are expected to complete the theory of the phosphorus cycle in urban soils and may provide a scientific basis for optimizing land use strategies, protecting ecological environments, and developing sustainable agriculture in Nanchang City and similar areas.
2. Materials and Methods
2.1. Study Area
Nanchang City (E115°27′ to 116°35′, N28°10′ to 29°11′) is located between Ganjiang River and Fuhe River in the middle–lower reaches of the Yangtze River in South China, adjacent to the largest freshwater lake, Poyang Lake, in China (Figure 1). The city has a total area of about 7000 km2 with a total population of about 5.3 million. Low mountains and hills, eroded hills, and plain landforms are developed from northwest to southeast of the region. The low mountains and hills are mainly distributed in the Meiling area in the northwest, with an elevation of 300~500 m, lithologically composed of granite and gneiss. The weathered denudation mound is located in Lehua Town in the northwest, with an elevation of 30~70 m, and mainly consists of eluvial red loam and upper Cretaceous purplish red sandstone. The alluvial plain is distributed in a vast area east of the Ganjiang River, consisting of sand and gravel layers formed during the Holocene, Middle Pleistocene, and Upper Pleistocene alluvial deposits. Above the layers, silty loam is developed, with a thickness of 5~10 m. The land of Nanchang City is mainly used for cultivation and forests. With the intensification of urbanization, the construction of land has gradually expanded [31]. A subtropical humid monsoon climate prevails in Nanchang, which is humid and mild. The average annual rainfall is 1645 mm/a [32], with the rainy season from April to June accounting for 51.3% of the annual precipitation. The dry season is from November to January, with precipitation accounting for 9.6% of the whole year. The historical average annual temperature ranges from 17.1 °C to 17.8 °C, with a historical maximum temperature of 40.9 °C and a historical minimum temperature of −15.2 °C. The average annual evaporation is 934.4 mm/a, mainly occurring in summer and autumn. The wind tends to be northerly in winter but southerly in summer.
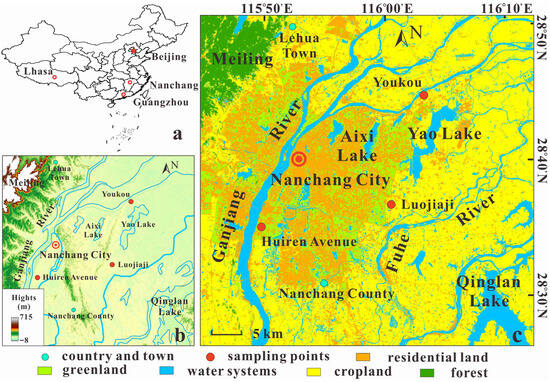
Figure 1.
Map of the study area and sampling locations. (a) China map; (b) elevation map; (c) land use map with sampling points.
2.2. Sampling
On 23 July 2016 (summer), representative soil profiles were respectively collected from the Luojiaji paddy field, the Youkou wasteland, and the Huiren Avenue dryland in Nanchang City (Figure 1). Sparse vegetables were privately planted by some residents in the Huiren Avenue dryland. The Youkou wasteland was in a natural state without or with small human activities. The hydrological condition of the Luojiaji paddy field was manually controlled according to the requirement of rice planting. Roots and leaves of plants and small stones were cleaned at each profile before sampling. Soil samples were manually taken at 20 cm intervals using a soil sampler. Approximately 250 g of each sample was put in a clean plastic bag and sealed. The sampling depth of each profile was 2.4 m above the phreatic water level.
2.3. Analytical Methods
2.3.1. The Determination of Soil pH and Grain Sizes
A soil solution with a water-to-soil ratio of 2.5:1 was prepared and analyzed for pH value using a PHS-25 pH analyzer (Rex Co., Shanghai, China) with an accuracy of 3%. The grain sizes of soils were measured on a Mastersizer 2000 laser particle size analyzer (Malvern Co., Malvern, UK) at Nanjing University. The grain size measurement range was 0.02~2000 μm with a measurement accuracy of better than 3%. Before the size measurement, each sample was treated with 0.1 mol/L hydrochloric acid solution made based on 37% AR hydrochloric acid (produced by Shanghai Wokai Biotechnology Co., Shanghai, China) to remove carbonates and with 10% H2O2 solution made based on 30% AR H2O2 (produced by Xiongda Chemical Co., Maoming, China) to remove organic matter [33].
2.3.2. The Determination of Phosphorus Forms
The improved SEDEX extraction method by Ruttenberg et al. (1992) was used to sequentially extract exchangeable phosphorus (Ex-P), iron-bound phosphorus (Fe-P), authigenic calcium-bound phosphorus (Au-P), detrital limestone phosphorus (De-P), and organic phosphorus (OP) from soil samples [34]. The contents of phosphorus forms were determined using the standard phosphorus–molybdenum blue method on a Shimadzu UV2600 spectrophotometer (Shimadzu Co., Kyoto, Japan), with an uncertainty of 5%. The total phosphorus content was regarded as the sum of inorganic and organic phosphorus contents, and the inorganic phosphorus content was considered the sum of the contents of various inorganic phosphorus forms. Detailed steps of the improved SEDEX extraction method can be found in Ni et al. (2015) [35].
2.4. Data Processing
ArcGIS 10.2 (ESRI Co., Redlands, CA, USA) was used for Figure 1, which shows the study area and sampling points (https://developers.arcgis.com/javascript/latest/ on 8 September 2023); Excel 2019 (MS Co., Redmond, WA, USA) was used for statistical analysis (https://www.microsoft.com/en-us/microsoft-365/excel accessed on 16 September 2023); SPSS 24.0 software (IBM Co., Armonk, NY, USA) was used for correlation analysis (https://www.ibm.com/support/pages/how-cite-ibm-spss-statistics-or-earlier-versions-spss accessed on 18 September 2023); and Origin 2019 software (OriginLab Co., Hampton, VA, USA) was used for data plots (https://www.originlab.com/index.aspx?go=PRODUCTS/Origin accessed on 25 September 2023).
3. Results
3.1. Grain Sizes and pH Values of Soils
The median grain size of the soil profile in the Youkou wasteland varied between 10.1 and 19.8 μm, with an average value of 14.3 μm (Table 1). The silt content in this profile was the highest, with an average value of 57.1%, followed by sand content (34.9%), and clay content was the lowest (Table 1). The median grain size of the soil profile in the Luojiaji paddy field varied between 9.58 and 16.9 μm, which was lower with slightly higher silt and clay contents and lower sand content than that in the Youkou wasteland (Table 1). The average median grain size of the dryland soil profile in Huiren Avenue was 11.8 μm, which was close to that of the soil profile in the Luojiaji paddy field (Table 1). The average content of silt in this profile reached 63.9%, which was the highest among the three profiles; the clay content varied between 6.72% and 13.6%, with an average of 9.7%, and the sand content varied between 4.14% and 52.8%, with an average of 25.8% (Table 1). Overall, the three soil profile samples had similar grain size compositions (i.e., the highest content for silt and the lowest for clay), with the vast majority located in sandy silt areas (Figure 2). The contents of clay and silt gradually decreased from top to bottom in the upper 0~120 cm of the soil profile in the Youkou wasteland and increased gradually in the lower 120~240 cm, while the sand content had the opposite trend (Figure 3). The contents of clay and silt in the soil profile of the Luojiaji paddy field gradually increased from top to bottom, while the sand content showed an opposite change (Figure 3). The contents of clay and silt increased with depth in the upper 0~120 cm of the dryland soil profile in Huiren Avenue but decreased below 120 cm, while the sand content varied inversely (Figure 3). In the three profiles, clay was positively correlated with silt but negatively with sand, reflecting the similar distribution states of grain size compositions in different profiles (Table 2).

Table 1.
Statistical summary of pH values and grain size compositions of soil profiles in Nanchang City.
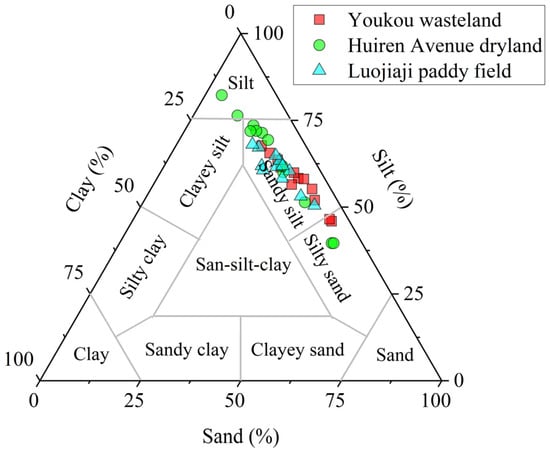
Figure 2.
Grain size compositions of soil profiles in Nanchang City. The grain size was less than 4 μm for clay, 4~63 μm for silt, and more than 63 μm for sand. The classification standard of grain size is based on [36].
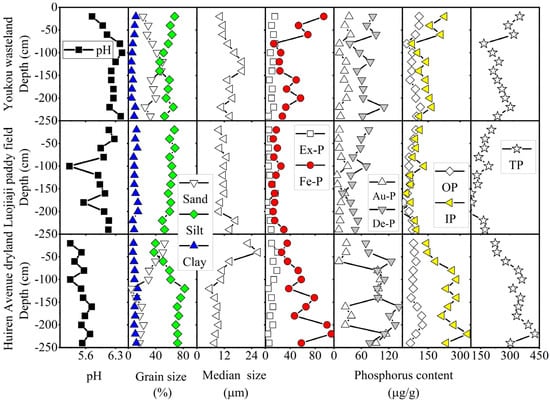
Figure 3.
The distributions of pH, grain size, and phosphorus forms in soil profiles under three land use patterns in Nanchang City.
Table 2.
Correlation analysis of phosphorus forms with pH and grain sizes in soil profiles of Nanchang City.
The pH value was 5.75~6.45 in the Youkou wasteland soil profile, 5.22~6.27 in the Luojiaji paddy field soil profile, and 5.24~5.74 in the Huiren Avenue dryland soil profile (Table 1). All three soil profiles were of acidity, and paddy and dry land soils were relatively more acidic. The low pH values in the three soil profiles might be related to acid rain in addition to the influence of soil ecosystems [37]. The pH distribution was significantly different in the three profiles (Figure 3): the pH value increased with depth to a depth of 120 cm but showed a small variation below 120 cm depth in the soil profile of the Youkou wasteland; the pH value first decreased and then increased with depth in the soil profile of the Luojiaji paddy field; the pH value gradually increased with depth in the soil profile of the Huiren Avenue dryland.
There was a significantly positive correlation between the pH value and sand content, while pH was negatively correlated with silt and clay in the Youkou wasteland soil profile; a significant relationship did not exist between pH and grain size of the Luojiaji paddy field soil profile, but pH was positively correlated with silt and clay in the Huiren Avenue dryland soil profile (Table 2). The relationships between pH and grain size implied the influences of different land use patterns in different places.
3.2. The Profile Distribution of Phosphorus Forms
In the Youkou wasteland soil profile, the total phosphorus (TP) content varied between 126 and 336 μg/g, with an average value of 231.22 μg/g; organic phosphorus (OP) accounted for 30.2% to 46.8% of TP, with an average value of 86.6 μg/g; and the content of inorganic phosphorus (IP) varied between 75.5 and 227 μg/g, with an average value of 144.62 μg/g (Figure 4 and Figure 5). Among different forms of inorganic phosphorus, detrital limestone phosphorus (De-P) and iron-bound phosphorus (Fe-P) contents were the highest, ranging from 34.6 to 110 μg/g and 13.5 to 93.9 μg/g, respectively (accounting for 25.3% to 37.2% and 10.5% to 28% of TP, respectively), followed by authigenic calcium-bound phosphorus (Au-P) content, which varied between 11.7 to 33.3 μg/g and accounted for 4.14% to 13.79% of TP; exchangeable phosphorus (Ex-P) content was the lowest (below 15.4 μg/g) and was mostly less than 6% of TP (Figure 4 and Figure 5). The profile distributions of different phosphorus forms are shown in Figure 3. The Ex-P content oscillated and decreased from top to bottom in the 0~160 cm depth of the soil profile, then gradually increased below 160 cm and suddenly decreased down from the 240 cm depth. The Fe-P content displayed an oscillatory decrease from top to bottom in the 0~80 cm depth of the soil profile and showed an oscillatory increase with depth between 80~200 cm before significantly decreasing below 200 cm, which, overall, had a similar changing trend to Ex-P. Unlike the two phosphorus forms mentioned above, the content of Au-P was relatively high within the surface 60 cm layer, the lowest at a depth of 80~100 cm, and oscillated, increasing downward to a depth of 100~180 cm before significantly decreasing below 180 cm. The De-P content showed a decreasing trend from the surface to 80 cm depth and showed an oscillatory increase with depth below 80 cm. OP, IP, and TP had changing trends in the profile, similar to De-P.
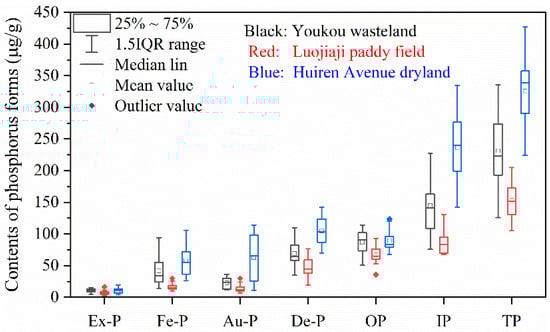
Figure 4.
Box diagram showing phosphorus forms in soil profiles under three land use patterns in Nanchang City.
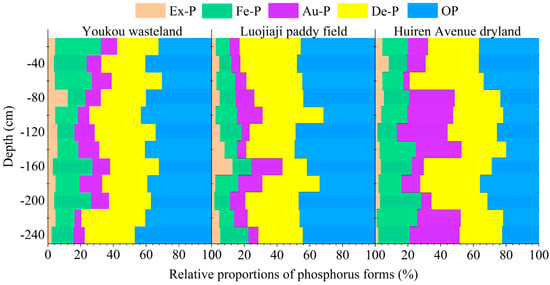
Figure 5.
Distributions of phosphorus forms in soil profiles under three land use patterns in Nanchang City.
TP in the Luojiaji paddy field soil profile varied between 105 and 205 μg/g, with an average value of 153.41 μg/g; the IP content varied between 67.2 and 131 μg/g, with an average value of 86.5 μg/g; and the OP content accounted for 31.5% to 49.2% of TP, with an average value of 66.91 μg/g (Figure 4 and Figure 5). Among the different forms of IP, the De-P content was the highest, ranging from 18.9 to 76.5 μg/g, with an average value of 48.34 μg/g, and mostly accounted for 27% and 38% of TP, followed by Fe-P and Au-P, with contents ranging from 10.2 to 29.7 μg/g and 6.58 to 29.8 μg/g, respectively, while the Ex-P content was the lowest at below 16.2 μg/g, basically below 8% of TP (Figure 4 and Figure 5). The profile distributions of different phosphorus forms are shown in Figure 3. The Ex-P content gradually increased from top to bottom in the range of 0~160 cm, reaching its maximum value at 160 cm depth and decreasing to its lowest value at 180~200 cm depth. The Fe-P content oscillated and increased with depth to 120 cm below the surface, while it varied constantly between 120 and 220 cm, only increasing at 240 cm. The Au-P content presented a typical bimodal pattern in the profile, which gradually increased with depth in the range of 0~100 cm, decreased with depth in the range of 160~240 cm, and significantly showed low values at a depth of 120~140 cm. De-P gradually decreased downward from the surface, with the lowest value at a depth of 160 cm, and then gradually rose. The variation in OP was like that of De-P, except its lowest value was at a depth of 180 cm in the profile. The profile distributions of IP and De-P were similar in the range of 0~120 cm, but they exhibited small variations at 120~200 cm depth and gradually increased below a depth of 200 cm. The profile distributions of TP and IP were generally similar except for the lowest TP at a depth of 180 cm.
The TP content in the Huiren Avenue dryland soil profile varied between 224 and 427 μg/g, with an average value of 325.67 μg/g; the IP content varied between 142 and 335 μg/g, with an average value of 236.34 μg/g; and the OP content accounted for 19.9% to 36.6% of TP, with an average value of 89.33 μg/g (Figure 4 and Figure 5). Among the different forms of IP, the De-P content was the highest, ranging from 69.7 to 142 μg/g and accounting for 25.8% to 45.2% of TP, with an average value of 104.6 μg/g, while Fe-P and Ca-P contents were higher, ranging from 26 to 105.9 μg/g and 10.9 to 114 μg/g, respectively; the Ex-P content was the lowest (below 19.6 μg/g) and did not exceed 9% of TP (Figure 4 and Figure 5). The profile distributions of different phosphorus forms are shown in Figure 3. Ex-P gradually oscillated, decreasing downward from the soil surface, with the lowest value at a depth of 220 cm. On the contrary, Fe-P gradually increased, oscillating to its highest value at a depth of 220 cm. Au-P exhibited a valley–peak–valley–peak variation from top to bottom in the profile, with the lowest values occurring at 0~60 cm and 160~200 cm and the highest values at other depths. De-P mainly showed a trend of first increasing and then decreasing from top to bottom in the profile; that is, it oscillated and increased with depth in the range of 0~200 cm and gradually decreased below 200 cm. OP showed a slightly decreasing trend from top to bottom in the range of 0~140 cm from the surface, then increased significantly, reaching its maximum value at a depth of 200 cm, and decreased below 200 cm. Unlike OP, IP oscillated and increased with depth from the surface, which was like the changing trend of TP.
Overall, the contents of total phosphorus and various phosphorus forms were the highest in the Huiren Avenue dryland soil, higher in the Youkou wasteland soil, and the lowest in the Luojiaji paddy field (Figure 4). In addition, the proportions of various phosphorus forms were ranked as OP > De-P > Fe-P > Au-P > Ex-P in the Youkou wasteland soil and the Luojiaji paddy field soil, while they were ranked as De-P > OP > Au-P > Fe-P > Ex-P in the Huiren Avenue dryland soil (Figure 5). The results described above were mainly due to (1) the Huiren Avenue dryland soil being mainly used for sporadic vegetable planting with manure use, which led to the accumulation of soil phosphorus; (2) despite the use of fertilizers in the Luojiaji paddy fields, the discharge and leakage of paddy water, as well as the absorption and utilization of plants, could lead to the loss of phosphorus in the soil; (3) the Youkou wasteland soil was in a natural state without human activities, so the loss of phosphorus was mainly caused by precipitation runoff. Both OP and De-P accounted for the largest proportion among the three land use patterns of soils, reflecting the relative stability of these two forms of phosphorus.
3.3. Correlations of Variables, including pH, Grain Size, and Phosphorus Forms
The pH value was negatively correlated with various phosphorus forms, silt, and clay, but it was positively correlated with sand and median grain size in the Youkou wasteland soil profile (Table 2). The pH value was positively correlated with OP, but it was negatively correlated with Au-P and had weak correlations with other variables in the soil profile of the Luojiaji paddy field (Table 2). In the Huiren Avenue dryland soil profile, the pH value had positive correlations with Fe-P, De-P, IP, TP, and silt, while it was negatively correlated with sand and mean grain size (Table 2).
Grain sizes were weakly correlated with Ex-P and Au-P, and sand was negatively correlated with other phosphorus forms, but there were inverse cases for clay and silt in the Youkou wasteland soil profile (Table 2). In the Luojiaji paddy field soil profile, sand was only positively correlated with Ex-P to a certain extent and was weakly correlated with other phosphorus forms; on the contrary, silt and clay only had negative correlations with Ex-P to some degree, and their correlations with other phosphorus forms were weak (Table 2). As shown in Table 2, sand was only positively correlated with Ex-P, but it showed significantly negative correlations with Au-P, IP, and TP and had negative correlations with Fe-P and De-P to a certain extent, with a weak correlation with OP in the Huiren Avenue dryland soil profile. In this profile, silt showed a significantly negative correlation with Ex-P but positive correlations with Fe-P, Au-P, IP, and TP, a positive correlation with De-P to some degree, and a weak correlation with OP (Table 2). Clay had a significantly negative correlation with Ex-P, a negative correlation with OP to some extent, positive correlations with Au-P, IP, and TP, and weak correlations with Fe-P and De-P (Table 2).
In the Youkou wasteland soil profile, Ex-P was only positively correlated with IP to a certain extent, while it had weak correlations with other phosphorus forms; Fe-P had positive correlations with almost all phosphorus forms; and Au-P only had significantly positive correlations with Fe-P, IP, and TP (Table 2). In this profile, De-P was significantly correlated with Fe-P, OP, IP, and TP without correlations with Ex-P, and OP showed positive correlations with Fe-P, De-P, IP, and TP without significant correlations with Ex-P and Au-P in the Youkou wasteland soil profile (Table 2). In the Luojiaji paddy field, Ex-P was only negatively correlated with De-P to some degree without significant correlations with other phosphorus forms, Fe-P showed positive correlations with De-P, IP, and TP but weak correlations with other phosphorus forms, and Au-P was only positively correlated with IP and negatively correlated with OP (Table 2). In this profile, De-P showed significantly positive correlations with OP, IP, and TP but a positive correlation with Fe-P and a negative correlation with Ex-P to some degree, and OP was positively correlated with IP, TP, and De-P but negatively correlated with Au-P to some degree (Table 2). Ex-P showed negative correlations with Fe-P, Au-P, IP, and TP but weak correlations with De-P and OP; Fe-P was only negatively correlated with Ex-P but had significantly positive correlations with other phosphorus forms except OP in the Huiren Avenue dryland (Table 2). In this profile, Au-P was positively correlated with Fe-P, IP, and TP but negatively correlated with OP, De-P was not significantly correlated with Ex-P and Au-P but showed significantly positive correlations with other phosphorus forms, and OP was only positively correlated with De-P and negatively correlated with Au-P (Table 2).
4. Discussion
4.1. The Effects of pH and Grain Sizes on Phosphorus Forms
pH value is an indicator reflecting the intensity of soil acidity and is associated with microbial action and root action under natural conditions. Various acids produced by microorganisms and plant roots may dissolve phosphorus under enzyme activity [38,39]. Enzymes, such as phosphatases, catalase, and dehydrogenase, play important roles in P cycles closely related to pH [40,41]. The higher the degree of soil development, the lower the pH value, thus the higher the enzymatic indicator, which is conducive to the dissolution of inorganic phosphorus (IP) and the mineralization of organic phosphorus (OP) in soils [16,40,41]. In theory, as the pH value decreases, other phosphorus forms, such as iron-bound phosphorus (Fe-P), authigenic calcium-bound phosphorus (Au-P), and detrital limestone phosphorus (De-P), are released to the soil solution and adsorbed by substances such as clay minerals and organic matters in the soil, thus resulting in an increase in exchangeable phosphorus (Ex-P) content [42,43]. At the same time, soil organic matter could be oxidized due to enzyme activity. However, the negative correlations between the pH value and various phosphorus forms in the Youkou wasteland soil profile did not seem to support the abovementioned hypothesis (Table 2). Due to the small human impact and a lack of vegetation coverage in the Youkou wasteland, surface runoff erosion can easily cause a loss of soil phosphorus [44], which may be the reason for the negative correlations between phosphorus forms and pH (Table 2). Compared with the Youkou wasteland, the soil profile of the Luojiaji paddy field showed a lower pH value, which could theoretically promote the dissolution of mineral phosphorus and the decomposition of OP in the soil [45]. As shown in Table 2, a positive correlation between the pH value and OP indicated that the OP concentration decreased as the pH decreased in this profile. In such an acidic environment, OP is usually broken down by microorganisms through enzyme activities [42]. So, the correlation between pH and OP confirmed the abovementioned inference. However, the negative correlation between the pH value and Au-P could be related to the loss of particulate phosphorus by water discharge from paddy fields (Table 2) [44]. The weak correlations between other phosphorus forms and pH values in the soil profile of the Luojiaji paddy field were probably associated with the influence of cultivation and fertilization (Table 2). The pH value of the Huiren Avenue dryland soil profile was the lowest among the three profiles (Table 1) and had positive correlations with Fe-P and De-P (Table 2), indicating that soil acidity, which could be produced by plant roots and microorganisms [38,39], had a dissolution effect on Fe-P and De-P [14]. Since the Huiren Avenue dryland was mainly of vegetable land, the weak correlations between pH and Ex-P, Au-P, and OP could be mainly affected by vegetable cultivation (Table 2).
Small particles usually retain considerably more P than large particles [14,42,46]. However, this was not completely the case for this study. As shown in Table 2, the weak correlations between grain sizes and Ex-P and Au-P with other phosphorus forms being negatively correlated with sand but positively correlated with clay and silt in the Youkou wasteland soil profile showed that Fe-P, De-P, and OP were not enriched in the sand fractions but mostly existed in the fine-grained fractions, consistent with previous studies [14,42,46]. Ex-P and Au-P seemed to show no specific preference for coarse and fine particles in the soil profile, which was probably related to leaching because of frequent and large rainfalls in summer in the study area [32]. Ex-P was typically associated with substances such as clay minerals, iron aluminum oxides (hydroxides), and organic matter [43,46]. However, this was not the case for the Luojiaji paddy field soil profile, as demonstrated by the correlations between grain sizes and phosphorus forms (Table 2). The sand fraction was mainly composed of quartz and feldspar, and most of the other phosphorus forms were not present in the sand fraction (Table 2). In fact, sand particles only had a dilution effect on phosphorus in the soil [47]. It was thus inferred that activities such as rice planting could be an important factor affecting the relationships between grain sizes and phosphorus forms in this profile. According to the correlation relationships of grain sizes and phosphorus forms (Table 2), sand showed a dilution effect on the contents of Au-P, Fe-P, and De-P, which were mainly enriched in the fine-grain-size fractions in the Huiren Avenue dryland soil profile [14]. It is worth noting that sand and silt had no dilution effects on soil OP. At the same time, Ex-P did not seem to be absorbed in the fine-grain-size fractions such as clay and silt, which was similar to the correlation information obtained from the Luojiaji paddy field (Table 2). Therefore, these results suggest the importance of anthropogenic effects, such as vegetation planting. The anomalous relationship between Ex-P and grain size in the profile also indirectly reflected this point (Table 2).
4.2. The Transformation of Phosphorus Forms under Different Land Use Patterns
The Youkou wasteland soil profile was not directly affected by human activities; thus, the transformation of phosphorus forms in this profile was only related to natural factors such as climate conditions and soil properties. Exchangeable phosphorus (Ex-P) mainly refers to phosphorus adsorbed from the solution by clay, oxides, and organic matter in the soil or sediment [48,49]. This phosphorus form, which usually has a low content, increases in content with a decrease in pH and is released again when the concentration of phosphorus in the soil solution or porewater of sediments decreases [50,51]. The weak correlations between Ex-P and other phosphorus forms in the Youkou wasteland soil profile indicated that there was weak or no transformation between Ex-P and phosphorus form, but Ex-P could be a mutual transformation of multiple phosphorus forms (Table 2). Detrital limestone phosphorus (De-P) is closely related to parent rocks such as igneous or metamorphic rocks, which is the most stable form of phosphorus, and is inactive in a weak alkaline environment and partially dissolved in acid conditions [52]. Organic phosphorus (OP) is also usually difficult to dissolve in the soil, but it can be mineralized and decomposed into inorganic phosphorus under enzyme action [53]. Samuel et al. (2017b) have shown that enzymatic activities decrease with increasing sampling depth and are higher in nontilled areas than conventionally tilled areas [41]. OP changes with depth could indicate the effect of enzymatic activity in the Youkou wasteland (Figure 5). However, the positive correlation between De-P and OP indicated their synchronous changes in the Youkou wasteland soil profile (Table 2). It was thus inferred that their synchronous changes could be mainly caused by the loss of other phosphorus, although De-P and OP could suffer from partial dissolution to some extent. Authigenic calcium-bound phosphorus (Au-P) comes mainly from authigenic apatite, including biogenic apatite, carbonate-bound phosphorus, Ca rhodochrosite, and fluorocarbon apatite [54]. This type of phosphorus can be formed with a slow formation rate from phosphate released by Ex-P, iron-bound phosphorus (Fe-P), and OP and is almost insoluble under alkaline conditions and can only be dissolved under acidic conditions [14,49,55]. The soil was slightly acidic in the Youkou wasteland, where the Au-P content was below 37 μg/g, and its proportion in total phosphorus was below 14% (Figure 4 and Figure 5), indicating the small dissolution of Au-P in the soil. The weak correlations between Au-P and De-P and OP reflected that there were no obvious transformation relationships between them (Table 2) and also implied the differences in their geochemical behaviors in the soil. Fe-P refers to phosphorus combined with iron oxide or iron (III) oxide-hydroxide (e.g., goethite), which can be converted into soluble phosphorus and released into aqueous solution when environmental conditions such as the oxidation–reduction potential and pH change [56]. For example, Fe3+ is reduced and phosphorus is released from iron oxides or hydroxides when Eh is low, while active iron is oxidized and phosphorus is adsorbed from soil solutions when Eh is high [17,57]. The positive correlations between Fe-P and Au-P and OP indicated that Fe-P was probably dissolved to release phosphate ions into soil solutions to some degree, as well as Au-P and OP (Table 2).
The soil in the Luojiaji paddy field was hydrologically controlled by farmers throughout the whole year and usually submerged during the cultivation season. After flooding, the soil changed from an aerobic environment to an anaerobic environment. At this time, the oxidation–reduction potential and dissolved oxygen decreased, and Fe-P was active and released phosphorus into the soil solution. At the same time, organic acids produced by plants and chemical fertilizer usage led to a decrease in soil pH and ultimately enhanced the activity of inorganic phosphorus [22,57]. They also brought about a strengthening of enzymic activities and the decomposition of organic matter [58]. Nevertheless, due to crop harvesting and water discharge resulting in low phosphorus content in the paddy field (Figure 3), enzymic activities and organic phosphorus decomposition could be weaker in the paddy field than in the Yukou wasteland. Therefore, the transformation between phosphorus forms under this land use pattern should be significantly different from that in the Yukou wasteland. The pH value in the soil of the Luojiaji paddy field varied between 5.22 and 6.27 (Table 1). Under this condition, a small amount of De-P might be dissolved with inorganic and organic acids and subsequently converted to Ex-P. In theory, in the process of crop growth, Ex-P is preferably released to soil solution, and other phosphorus forms could also be released with a decrease in dissolved P concentration, probably showing certain or strong correlations between Ex-P and other phosphorus forms. However, weak correlations of Ex-P and other phosphorus forms implied anthropogenic disturbance, such as the addition of fertilizers in the paddy field (Table 2). The positive correlation of Fe-P with De-P and weak correlations of Fe-P with other phosphorus forms could be due to the decrease in Fe-P in the soil because the oxidation–reduction potential changed (from Fe3+ to Fe2+) under flooding conditions (Table 2). The positive correlation between OP and De-P was consistent with the situation in the Youkou wasteland soil (Table 2), indicating synchronous changes between the two P forms in the soil. Previous studies have shown that fertilizer use favored an increase in enzymic activities and organic matter decomposition, although the authors considered that soil enzyme activities were higher under the no-tilled condition than under conventional tillage [40,41,58]. Consequently, OP suffered from certain decomposition in the paddy field. The weak correlations between OP and Ex-P and Fe-P reflected the weak transformation between them (Table 2). The negative correlation between Au-P and OP and the weak correlations between Au-P and other phosphorus forms mirrored the mutual transformation between these two phosphorus forms under flooding conditions.
Different from the two soil profiles mentioned above, the Huiren Avenue dryland was sparsely used for vegetable planting, in which organic fertilizers were added, and manual irrigation led to the downward movement of phosphorus in the dryland (Figure 3). Thus, the relationships between phosphorus forms under this land use pattern could be significantly different from those under other land use patterns. The negative correlations between Ex-P and Fe-P and Au-P reflected that Ex-P only had a certain transformation with Fe-P and Au-P in the dryland soil (Table 2). However, the formation of Fe-P and Au-P usually took a long time [49,59]. Ex-P, which had a low content in the soil, was probably difficult to transform into Fe-P and Au-P in a short period. On the contrary, the conversions from Fe-P and Au-P to Ex-P were possible under acidic conditions or anthropogenic disturbance. The positive correlation between De-P and OP was related to the relative stability of the two P forms in the soil (Table 2), which was consistent with the cases in the Youkou wasteland and the Luojiaji paddy field. Nevertheless, there was still a partial decomposition of OP because there were enzymic activities in the dryland. The negative correlation between Au-P and OP reflected the mutual transformation between them and further indicated partial OP decomposition (Table 2). Similar to the Luojiaji paddy soil, the weak correlations between OP and Ex-P, Fe-P reflected the weak transformation between them in the Huiren Avenue dryland soil (Table 2). The positive correlation between Fe-P and Au-P, De-P, and the weak correlation between Fe-P and OP indicated that the first three forms of phosphorus were dissolved to release phosphate ions into the soil solution to some degree and an insignificant transformation between Fe-P and OP (Table 2).
4.3. Implications for Local Soil P Management
The phosphorus (P) cycle was affected not only by natural factors in the Youkou wasteland but also by anthropogenic activities in the Luojiaji paddy field and the Huiren Avenue dryland (Figure 6). The higher average pH values and grain sizes in the Youkou wasteland compared with the other two sites demonstrated this point (Table 1). The transformation of P was probably promoted by the reaction of humic acid and minerals in the soil, and the loss of P out of the soil could be related to precipitation leaching under natural conditions, showing a potential risk to surface water nearby [60]. Vegetation restoration, such as grass planting, could be an ideal measure that is favorable to stabilize P in the Youkou wasteland soil without mowing or straw harvesting [61]. Paddy cultivation usually maintains flooded conditions during the rice growing season and is in a relatively dry environment during the rice ripening period through anthropogenic discharge. Flooded conditions may suppress microbial and enzymatic activities and decrease organic P mineralization [62]; however, the reduced conditions could promote Fe (III) reduction, releasing P into soil solution [63]. At the same time, the interaction of water and P-containing minerals releases some P into the soil solution [14]. P in soil solution was partly adsorbed by paddy plants in the growing season and partly discharged outside in the ripening period, thus causing P loss despite agricultural fertilizer input in the Luojiaji paddy field [64]. Long-term paddy cultivation could increase P leaching risk and, thus, has a potential threat to surface water nearby [65]. Lower contents of P forms in the Luojiaji paddy field than in the other two sites reflected this point (Figure 4 and Figure 6). Therefore, reasonable paddy management, such as the control of water level and discharge frequency, is necessary to decrease P leaching risk for healthy development of paddy plantation. In the Huiren Avenue dryland, the P cycle was significantly different from the other two sites (Figure 6). Due to the input of organic fertilizers for vegetable growth, P accumulated in the soil and slowly moved down by the effect of a little water irrigation before gradually accumulating in the soil layers, thus resulting in a higher P content (Figure 4). Nevertheless, this case usually leads to the downward transport of P, which is not beneficial to vegetable growth without the addition of excessive P and could show a potential threat to groundwater quality. So, it is necessary to control the amount of irrigation water and add irrigation frequency. Overall, for different land use patterns, the measures are different for maintaining P fixation in soils.
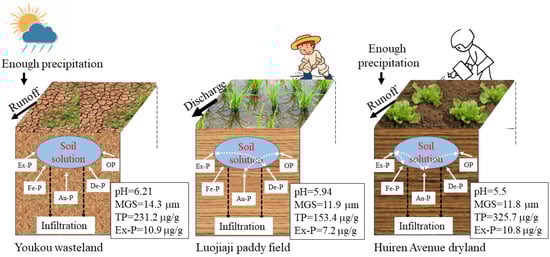
Figure 6.
The P transport and transformation modes of the three sites in Nanchang City.
Our findings are useful for guiding agricultural planting and local water resource management but still have some shortcomings. First, the data on physical (water level, discharge frequency, irrigation amount and frequency, fertilizer use), chemical (soil chemicals) and biological (microorganisms and enzymes) parameters were not enough. Second, the seasonality of phosphorus forms in soils under individual land use patterns was not considered. Therefore, the predominant factors of phosphorus forms in soils need to be determined, and the seasonality of soil phosphorus should also be clarified in future studies. In addition, the impacts of climate change and human activities on soil phosphorus under different land use patterns are required to be quantified. Only the abovementioned topics are disclosed in depth, and scientific measures could be determined for phosphorus fixation under different land use patterns.
5. Conclusions
In this study, phosphorus forms of soils under three land use patterns in Jiangxi Province, South China, were extracted by an improved SEDEX method and measured by a standard phosphorus–molybdenum blue method. The contents of total phosphorus and phosphorus forms were the highest in the Huiren Avenue dryland soil and the lowest in the Luojiaji paddy field soil. As the depth increased, the total phosphorus content showed a high–low–high trend in the Youkou wasteland, while it gradually decreased in the Luojiaji paddy field and increased in the Huiren Avenue dryland.
The relationships between the pH value and phosphorus forms were disturbed by surface erosion in the Youkou wasteland, by rice planting in the Luojiaji paddy field, and by vegetable cultivation in the Huiren Avenue dryland. Fe-P, De-P, and OP were mostly enriched in the fine-grained fractions of the Youkou wasteland, the relationships of grain sizes and phosphorus forms were affected by rice planting to some degree in the Luojiaji paddy field, and Fe-P and De-P were only enriched in silt and clay fractions in the Huiren Avenue dryland. Ex-P and other phosphorus were only transformed in the Youkou wasteland. There was a certain transformation between Au-P and OP in the Luojiaji paddy field, with a slight transformation of De-P into Ex-P. Ex-P only had a certain transformation with Fe-P and Au-P in the Huiren Avenue dryland with the transformation of Au-P to Ex-P and OP. This study found that rice planting and vegetable cultivation significantly disturbed the original behaviors of phosphorus forms in soils.
Although some parameters such as enzymic activities and fertilizer use were not considered, this study first conducted a study of soil phosphorus forms, highlighted the importance of land use patterns to soil phosphorus, and thus has great significance for sustainable agriculture development and environmental quality protection in the urban area. From the point of view of sustainability, proper measures (e.g., the control of fertilizer use, the adjustment of irrigation frequency) are required to fix soil phosphorus in Nanchang City.
Author Contributions
Conceptualization: W.R. and F.Z.; methodology: Y.W. and F.Z.; data curation: C.Z. and Y.W.; writing—original draft: W.Y. and T.L.; writing—review and editing: W.R. and W.Y.; supervision: W.R.; funding acquisition: W.R. All authors have read and agreed to the published version of the manuscript.
Funding
This research was funded by the National Natural Science Foundation of China (41273015) and the Geological Exploration Fund Project of Jiangsu Provincial Department of Natural Resources (202307018K1S).
Institutional Review Board Statement
Not applicable.
Informed Consent Statement
Not applicable.
Data Availability Statement
The data presented in this study are available upon request from the corresponding author.
Acknowledgments
We would like to thank Ke Jin and Tangqing Chen for field sampling. Thanks are also given to Shuai Wang and Wenbing Zhang for laboratory experiments. The editors and reviewers are greatly appreciated for their useful comments and support. Hui Huang helped revise the language of this paper.
Conflicts of Interest
The authors declare no conflict of interest.
References
- Weatheimer, F.H. Why nature chose phosphates. Science 1987, 235, 1173–1178. [Google Scholar] [CrossRef]
- Jiang, J.; Wang, Y.; Yang, Y.; Yu, M.; Wang, C.; Yan, J. Interactive effects of nitrogen and phosphorus additions on plant growth vary with ecosystem type. Plant Soil 2019, 440, 523–537. [Google Scholar] [CrossRef]
- Yang, X.; Post, W.M. Phosphorus transformations as a function of pedogenesis: A synthesis of soil phosphorus data using Hedley fractionation method. Biogeosciences 2011, 8, 2907–2916. [Google Scholar] [CrossRef]
- Walker, T.W.; Syers, J.K. The fate of phosphorus during pedogenesis. Geoderma 1976, 15, 1–19. [Google Scholar] [CrossRef]
- Vitousek, P.M.; Porder, S.; Houlton, B.Z.; Chadwick, O.A. Terrestrial phosphorus limitation: Mechanisms, implications, and nitrogen-phosphorus interactions. Ecol. Appl. 2010, 20, 5–15. [Google Scholar] [CrossRef] [PubMed]
- Turner, B.L.; Brenes-Arguedas, T.; Condit, R. Pervasive phosphorus limitation of tree species but not communities in tropical forests. Nature 2018, 555, 367–370. [Google Scholar] [CrossRef] [PubMed]
- Zhang, N.M.; Yu, Y.; Hong, B.; Chen, J.J.; Zhang, Y.J. Factors influencing runoff P losses from farmlands of the Dianchi Lake watershed in Yunnan, China. Pedosphere 2004, 14, 259–262. [Google Scholar]
- Koh, H.S. Using algal biomass-phosphorus (P) relationships and nutrient limitation theory to evaluate the adequacy of P water quality criteria for regulated monsoon rivers and reservoirs. Chem. Ecol. 2019, 35, 408–430. [Google Scholar] [CrossRef]
- Cui, Y.; Xiao, R.; Xie, Y.; Zhang, M. Phosphorus fraction and phosphate sorption-release characteristics of the wetland sediments in the Yellow River Delta. Phys. Chem. Earth 2018, 103, 19–27. [Google Scholar] [CrossRef]
- Augusto, L.; Achat, D.L.; Jonard, M.; Vidal, D.; Ringeval, B. Soil parent material–A major driver of plant nutrient limitations in terrestrial ecosystems. Glob. Chang. Biol. 2017, 23, 3808–3824. [Google Scholar] [CrossRef]
- Hou, E.; Chen, C.; Luo, Y.; Zhou, G.; Kuang, Y.; Zhang, Y.; Heenan, M.; Lu, X.; Wen, D. Effects of climate on soil phosphorus cycle and availability in natural terrestrial ecosystems. Glob. Chang. Biol. 2018, 24, 3344–3356. [Google Scholar] [CrossRef]
- Zhang, H.; Shi, L.; Lu, H.; Shao, Y.; Liu, S.; Fu, S. Drought promotes soil phosphorus transformation and reduces phosphorus bioavailability in a temperate forest. Sci. Total Environ. 2020, 732, 139295. [Google Scholar] [CrossRef]
- Wilson, S.G.; Dahlgren, R.A.; Margenot, A.J.; Rasmussen, C.; O’Geen, A.T. Expanding the Paradigm: The influence of climate and lithology on soil phosphorus. Geoderma 2022, 421, 115809. [Google Scholar] [CrossRef]
- Saentho, A.; Wisawapipat, W.; Lawongsa, P.; Aramrak, S.; Prakongkep, N.; Klysubun, W.; Christl, I. Speciation and pH- and particle size-dependent solubility of phosphorus in tropical sandy soils. Geoderma 2022, 408, 115590. [Google Scholar] [CrossRef]
- Yang, J.; Xin, X.L.; Zhang, X.F.; Zhong, X.Y.; Yang, W.L.; Ren, G.C.; Zhu, A.N. Effects of soil physical and chemical properties on phosphorus adsorption-desorption in fluvo-aquic soil under conservation tillage. Soil Tillage Res. 2023, 234, 105840. [Google Scholar] [CrossRef]
- An, R.; Wang, X.; Zhang, X.; Chen, C.; Liu, X.; Cai, S. Quantitative characterization of drying-induced cracks and permeability of granite residual soil using micron-sized X-ray computed tomography. Sci. Total Environ. 2023, 876, 163213. [Google Scholar] [CrossRef] [PubMed]
- Gustafsson, J.P.; Mwamila, L.B.; Kergoat, K. The pH dependence of phosphate sorption and desorption in Swedish agricultural soils. Geoderma 2012, 189–190, 304–311. [Google Scholar] [CrossRef]
- Simonsson, M.; Östlund, A.; Renfjäll, L.; Sigtryggsson, C.; Börjesson, G.; Kätterer, T. Pools and solubility of soil phosphorus as affected by liming in long-term agricultural field experiments. Geoderma 2018, 315, 208–219. [Google Scholar] [CrossRef]
- Gérard, F. Clay minerals, iron/aluminum oxides, and their contribution to phosphate sorption in soils—A myth revisited. Geoderma 2016, 262, 213–226. [Google Scholar] [CrossRef]
- Jian, Z.J.; Lei, L.; Ni, Y.Y.; Xu, J.; Xiao, W.F.; Zeng, L.X. Soil clay is a key factor affecting soil phosphorus availability in the distribution area of Masson pine plantations across subtropical China. Ecol. Indic. 2022, 144, 109482. [Google Scholar] [CrossRef]
- Cao, L.; Ji, F.Y. Phosphorus distribution characteristics in dry-wet alternation sediment of fluctuation zone in Three Gorges Reservoir area. Earth Environ. 2013, 41, 126–131. (In Chinese) [Google Scholar]
- Fang, B.; Wang, C.; Wang, C.; Zhou, X.M.; Fang, F.; Guo, J.S.; Li, Z. Characterizations of phosphorus fractions in the soil at different altitudes of water-level-fluctuation zone, Three Gorges Reservoir. J. Chongqing Univ. 2018, 41, 20–28. (In Chinese) [Google Scholar]
- Solomon, D.; Lehmann, J.; Mamo, T.; Fritzsche, F.; Zech, W. Phosphorus forms and dynamics as influenced by land use changes in sub-humid Ethiopian highland. Geoderma 2002, 105, 21–48. [Google Scholar] [CrossRef]
- Yang, W.J.; Cheng, H.G.; Hao, F.H.; Ouyang, W.; Liu, S.Q.; Lin, C.Y. The influence of land-use change on the forms of phosphorus in soil profiles from the Sanjiang Plain of China. Geoderma 2012, 189–190, 207–214. [Google Scholar] [CrossRef]
- Li, T.; Zheng, W.W.; Zhou, Z.J.; Zhang, S.R.; Xu, X.X.; Pu, Y.L.; Li, H. Soil phosphorus variation regulated by changes in land use spatial patterns during urbanization in western Chengdu, China. Glob. Ecol. Conserv. 2021, 27, e01576. [Google Scholar] [CrossRef]
- Fu, D.G.; Xu, Z.X.; Wu, X.N.; Zhao, L.Q.; Zhu, A.Q.; Duan, C.Q.; Chadwick, D.R.; Jones, D.L. Land use effects on soil phosphorus behavior characteristics in the eutrophic aquatic-terrestrial ecotone of Dianchi Lake, China. Soil Tillage Res. 2021, 205, 104793. [Google Scholar] [CrossRef]
- Azene, B.; Qiu, P.; Zhu, R.H.; Pan, K.W.; Sun, X.M.; Nigussie, Y.; Yigez, B.; Gruba, P.; Wu, X.G.; Zhang, L. Response of soil phosphorus fractions to land use change in the subalpine ecosystems of Southeast margin of Qinghai-Tibet Plateau, Southwest China. Ecol. Indic. 2022, 144, 109432. [Google Scholar] [CrossRef]
- Yan, X.; Wei, Z.Q.; Hong, Q.Q.; Lu, Z.H.; Wu, J.F. Phosphorus fractions and sorption characteristics in a subtropical paddy soil as influenced by fertilizer sources. Geoderma 2017, 295, 280–285. [Google Scholar] [CrossRef]
- Maranguit, D.; Guillaume, T.; Kuzyakov, Y. Land-use change affects phosphorus fraction in highly weathered tropical soils. Catena 2017, 149, 385–393. [Google Scholar] [CrossRef]
- Fu, D.G.; Wu, X.N.; Duan, C.Q.; Chadwick, D.R.; Jone, D.L. Response of soil phosphorus fractions and fluxes to different vegetation restoration types in a subtropical mountain ecosystem. Catena 2020, 193, 104663. [Google Scholar] [CrossRef]
- Zhao, L.H.; Wang, P.; Ouyang, X.Z.; Wu, Z.W. An analysis of the spatio-temporal variation in fractional vegetation cover and its relationship with non-climate factors in Nanchang City, China. Acta Ecol. Sin. 2016, 36, 3723–3733. (In Chinese) [Google Scholar]
- Xiong, S.; Lu, B.H.; Cheng, Z.H.; Wang, H.F.; Hu, Y. Study and forecasting change characteristics of main climatic factors in Nanchang City. Water Resour. Power 2017, 35, 15–19. (In Chinese) [Google Scholar]
- Rao, W.B.; Mao, C.P.; Wang, Y.G.; Su, J.B.; Balsam, W.; Ji, J.F. Geochemical constraints on the provenance of surface sediments of radial sand ridges off the Jiangsu coastal zone, East China. Mar. Geol. 2015, 359, 35–49. [Google Scholar] [CrossRef]
- Ruttenberg, K.C. Development of a sequential extraction method for different forms of phosphorus in marine sediments. Limnol. Oceanogr. 1992, 37, 1460–1482. [Google Scholar] [CrossRef]
- Ni, J.Y.; Lin, P.; Zhen, Y.; Yao, X.Y. Distribution, source and chemical speciation of phosphorus in surface sediments of the central Pacific Ocean. Deep Sea Res. Part I 2015, 105, 74–82. [Google Scholar] [CrossRef]
- Shepard, F.P. Nomenclature based on sand-silt-clay ratios. J. Sediment. Res. 1954, 24, 151–158. [Google Scholar]
- Zheng, F.W.; Rao, W.B.; Chu, X.D.; Bai, H.; Jiang, S.Y. Chemical and sulfur isotopic characteristics of precipitation in a representative urban site, South China: Implication for anthropogenic influences. Air Qual. Atmos. Health 2020, 13, 349–359. [Google Scholar] [CrossRef]
- Abd-Alla, M.H. Use of organic phosphorus by rhizobium leguminosarum biovar viceae phosphatases. Biol. Fertil. Soils 1994, 18, 216–218. [Google Scholar] [CrossRef]
- Dinkelaker, B.; Marschnir, H. In vivo demonstration of acid phosphatase activity in the rhizosphere of soil-grown plants. Plant Soil 1992, 144, 199–205. [Google Scholar] [CrossRef]
- Samuel, A.D.; Brejea, R.; Domuta, C.; Bungau, S.; Cenusa, N.; Tit, D.M. Enzymatic indicators of soil quality. J. Environ. Prot. Ecol. 2017, 18, 871–878. [Google Scholar]
- Samuel, A.D.; Tit, D.M.; Melinte, C.E.; Iovan, C.; Purza, L.; Gitea, M.; Bungau, S. Enzymological and physicochemical evaluation of the effects of soil management practices. Rev. Chim. 2017, 68, 2243–2247. [Google Scholar] [CrossRef]
- Eriksson, A.K.; Gustafsson, J.P.; Hesterberg, D. Phosphorus speciation of clay fractions from long-term fertility experiments in Sweden. Geoderma 2015, 241–242, 68–74. [Google Scholar] [CrossRef]
- Mitran, T.; Mani, P.K.; Bandyopadhyay, P.K.; Basak, N. Effects of organic amendments on soil physical attributes and aggregate-associated phosphorus under long-term rice-wheat cropping. Pedosphere 2018, 28, 823–832. [Google Scholar] [CrossRef]
- Song, D.; Bai, X.H. Distribution of phosphorus and nitrogen in the sediments of the North Bay in Dianchi Lake. Environ. Eng. Sci. 2016, 33, 563–570. [Google Scholar]
- Zhang, T.Q.; Mackenzie, A.F.; Liang, B.C.; Drury, C.F. Soil test phosphorus and phosphorus fractions with long-term phosphorus addition and depletion. Soil Sci. Soc. Am. J. 2004, 68, 519–528. [Google Scholar]
- Spohn, M. Phosphorus and carbon in soil particle size fractions: A synthesis. Biogeochemistry 2020, 147, 225–242. [Google Scholar] [CrossRef]
- Huang, J.; Hartemink, A.E. Soil and environmental issues in sandy soils. Earth Sci. Rev. 2020, 208, 103295. [Google Scholar] [CrossRef]
- Liu, J.; Hu, Y.; Yang, J.; Abdi, D.; Cade-Menun, B.J. Investigation of soil legacy phosphorus transformation in long-term agricultural fields using sequential fractionation, P K-edge XANES and solution P NMR spectroscopy. Environ. Sci. Technol. 2015, 49, 168–176. [Google Scholar] [CrossRef] [PubMed]
- Mao, C.P.; Li, T.N.; Rao, W.B.; Tang, Z.; Song, Y.X.; Wang, S. Chemical speciation of phosphorus in surface sediments from the Jiangsu Coast, East China: Influences, provenances and bioavailabilities. Mar. Pollut. Bull. 2021, 163, 111961. [Google Scholar] [CrossRef]
- Sun, S.J.; Huang, S.L.; Sun, X.M.; Wen, W. Phosphorus fractions and its release in the sediments of Haihe River, China. J. Environ. Sci. 2009, 21, 291–295. [Google Scholar] [CrossRef] [PubMed]
- Chen, J.J.; Lu, S.Y.; Zhao, Y.K.; Wang, W.; Huang, M.S. Effects of overlying water aeration on phosphorus fractions and alkaline phosphatase activity in surface sediment. J. Environ. Sci. 2011, 23, 206–211. [Google Scholar] [CrossRef] [PubMed]
- Acharya, S.S.; Panigrahi, M.K.; Kurian, J.; Gupta, A.K.; Tripathy, S. Speciation of phosphorus in the continental shelf sediments in the Eastern Arabian Sea. Cont. Shelf Res. 2016, 115, 65–75. [Google Scholar] [CrossRef]
- McGill, W.B.; Cole, C.V. Comparative aspects of cycling of organic C, N, S and P through soil organic matter. Geoderma 1981, 26, 267–286. [Google Scholar] [CrossRef]
- Kaiserli, A.; Voutsa, D.; Samara, C. Phosphorus fractionation in lake sediments–Lakes Volvi and Koronia, N. Greece. Chemosphere 2002, 46, 1147–1155. [Google Scholar] [CrossRef] [PubMed]
- Sun, G.F.; Jin, J.Y.; Shi, Y.L. Research advance on soil phosphorous forms and their availability to crops in soil. Soil Fertil. Sci. China 2011, 2, 1–9. (In Chinese) [Google Scholar]
- Kraal, P.; Burton, E.D.; Rose, A.L.; Kocar, B.D.; Lockhart, R.S.; Grice, K.; Bush, R.T.; Tan, E.; Webb, S.M. Sedimentary iron—Phosphorus cycling under contrasting redox conditions in a eutrophic estuary. Chem. Geol. 2015, 392, 19–31. [Google Scholar] [CrossRef]
- Liu, K.; Ni, Z.K.; Wang, S.R.; Ni, C.Y. Distribution characteristics of phosphorus in sediments at different altitudes of Poyang Lake. China Environ. Sci. 2015, 35, 856–861. (In Chinese) [Google Scholar]
- Bungau, S.; Behl, T.; Aleya, L.; Bourgeade, P.; Aloui-Sossé, B.; Purza, A.L.; Abid, A.; Samuel, A.D. Expatiating the impact of anthropogenic aspects and climatic factors on long-term soil monitoring and management. Environ. Sci. Pollut. Res. 2021, 28, 30528–30550. [Google Scholar] [CrossRef]
- Jilbert, T.; Slomp, C.P. Iron and manganese shuttles control the formation of authigenic phosphorus minerals in the euxinic basins of the Baltic Sea. Geochim. Cosmochim. Acta 2013, 107, 155–169. [Google Scholar] [CrossRef]
- Chen, M.H.; Lu, Y.; Wang, C.Z.; Walter, M.T. An investigation of the effects of humic acid on soil erosion and loss of phosphorus from soil to runoff: Experiment and modeling. Geoderma 2022, 427, 116121. [Google Scholar] [CrossRef]
- Zhu, N.; Yan, Y.C.; Bai, K.Y.; Zhang, J.M.; Wang, C.; Wang, X.; Xu, D.W.; Liu, J.H.; Xin, X.P.; Chen, J.Q. Conversion of croplands to shrublands does not improve soil organic carbon and nitrogen but reduces soil phosphorus in a temperate grassland of northern China. Geoderma 2023, 432, 116407. [Google Scholar] [CrossRef]
- Chen, X.B.; Hu, Y.J.; Xia, Y.H.; Zheng, S.M.; Su, Y.R. Contrasting pathways of carbon sequestration in paddy and upland soils. Glob. Change Biol. 2021, 27, 2478–2490. [Google Scholar] [CrossRef] [PubMed]
- Bhattacharyya, A.; Campbell, A.N.; Nico, P.S.; Pett-Ridge, J.; Silver, W.L. Phosphorus fractionation responds to dynamic redox conditions in a humid tropical forest soil. J. Geophys. Res. Biogeosci. 2018, 123, 3016–3027. [Google Scholar]
- Lou, H.Z.; Yang, S.T.; Zhao, C.S.; Zhou, Q.W.; Bai, J.; Hao, F.H.; Wu, L.N. Phosphorus risk in an intensive agricultural area in a mid-high latitude region of China. Catena 2022, 127, 46–55. [Google Scholar] [CrossRef]
- Qin, L.; Jiang, M.; Freeman, C.; Zou, Y.C.; Gao, C.Y.; Tian, W.; Wang, G.D. Agricultural land use regulates the fate of soil phosphorus fractions following the reclamation of wetlands. Sci. Total Environ. 2023, 863, 160891. [Google Scholar] [CrossRef]
Disclaimer/Publisher’s Note: The statements, opinions and data contained in all publications are solely those of the individual author(s) and contributor(s) and not of MDPI and/or the editor(s). MDPI and/or the editor(s) disclaim responsibility for any injury to people or property resulting from any ideas, methods, instructions or products referred to in the content. |
© 2024 by the authors. Licensee MDPI, Basel, Switzerland. This article is an open access article distributed under the terms and conditions of the Creative Commons Attribution (CC BY) license (https://creativecommons.org/licenses/by/4.0/).