Article

The Economic Security of Households Affected by the COVID-19 Pandemic in Rural Java and Madura

by
Ernoiz Antriyandarti
1,*,
Umi Barokah
1,
Wiwit Rahayu
1,
Herdis Herdiansyah
2,
Ihsannudin Ihsannudin
3 and
Fadhil Adi Nugraha
1
1
Study Program of Agribusiness, Faculty of Agriculture, Universitas Sebelas Maret, Surakarta 57126, Indonesia
2
School of Environmental Science, Universitas Indonesia, Central Jakarta 10430, Indonesia
3
Agricultural Extension Department, Faculty of Agriculture, Jember University, Jember 68121, Indonesia
*
Author to whom correspondence should be addressed.
Sustainability 2024, 16(5), 2091; https://doi.org/10.3390/su16052091
Submission received: 13 January 2024 / Revised: 22 February 2024 / Accepted: 28 February 2024 / Published: 2 March 2024

Abstract

:
Every facet of life, including health, social, and economic aspects, has undergone a tremendous transformation due to the COVID-19 pandemic. This condition is exacerbated by socioeconomic fragility and vulnerability amid economic uncertainty, with an enormous debt burden and inequality increasingly spreading to regions. Elements of society in Indonesia experience the problem of a lack of income and capital, in addition to vulnerability and helplessness. Social, economic, community–institutional, and resource vulnerabilities are inevitable; therefore, they must be identified, anticipated, and dealt with to avoid worsening. This research aims to identify the affected households and their economic resilience when facing the COVID-19 pandemic. A mixed approach with a sequential exploratory strategy was employed, whereby qualitative data were first collected and analyzed. Based on the findings of the first stage, quantitative data were obtained and examined in the second stage. This study was conducted in two rural locations with distinct characteristics: the Gunungkidul District on Java Island and the Bangkalan District on Madura Island. These findings demonstrate the economic resilience of households in Bangkalan and Gunungkidul. The factors that significantly influence economic resilience are household income, assets, and product availability in the market.

1. Introduction

Globally, COVID-19 (also known as coronavirus) has profoundly impacted many facets of life, including health, business, political, social, economic, environmental, and educational spheres. This scenario will ultimately affect the global economy [1,2]. For example, the decline in most economic activities and the loss of income from the manufacturing and service sectors in China and most developed countries will cause the global economy to contract. Consequently, it is detrimental to financial markets, trade across borders, investor optimism, consumption (via income and wealth impacts), and commodity prices. These global effects affect Indonesia, with communities still fighting to endure the financial ramifications of the pandemic. As time passes, the danger of COVID-19 in many facets of existence increases, owing to the reality of viral mutations and the uncertainty surrounding the availability of clinically tested antivirals or vaccinations that can treat this “new” disease [3]. Socioeconomic fragility and susceptibility in the face of economic uncertainty, coupled with a massive debt burden and progressive inequality extending to regions, are worsening in Indonesia.
There may be explicit and implicit harmful consequences of the COVID-19 pandemic. The impact and drop in consumption and service levels caused by public health emergencies are directly related to each other. According to Chen et al. [4], the declining consumption pattern demonstrates a markedly negative sensitivity to daily variations in the intensity of a public health emergency as the state of public health deteriorates. The pandemic’s indirect effect is related to the financial market and its impact on the real economy. Estimates of the possible global economic impact of the COVID-19 pandemic shock in 2021 were diverse. Policies for economic stabilization are necessary in response to the economic harm caused by the health crisis. These include financial infusions to maintain the balance sheets of corporations and banks on a somewhat secure foundation. Crucial actions to prevent the economy from contracting include cash transfers, loan extensions, and government spending, particularly on healthcare.
It is anticipated that savings will increase, household wealth will decrease, and consumption expenditure will decrease. The limitations that hinder production also cause supply disruptions and harm worker demand, job opportunities, and production chains, leading to prolonged layoffs and elevated joblessness rates [5]. Brodeur et al. [6] stated that confidence in the market and financial transactions would be reduced under uncertain circumstances. Spending on products and services has decreased significantly because of social restrictions, which has also hurt jobs and supply networks. Supportive monetary and fiscal measures mitigate the consequent drop in investor and consumer confidence but increase the negative multiplier effects on labor market production. Rural and urban areas, dependent on agricultural systems, are affected by this predicament [7].
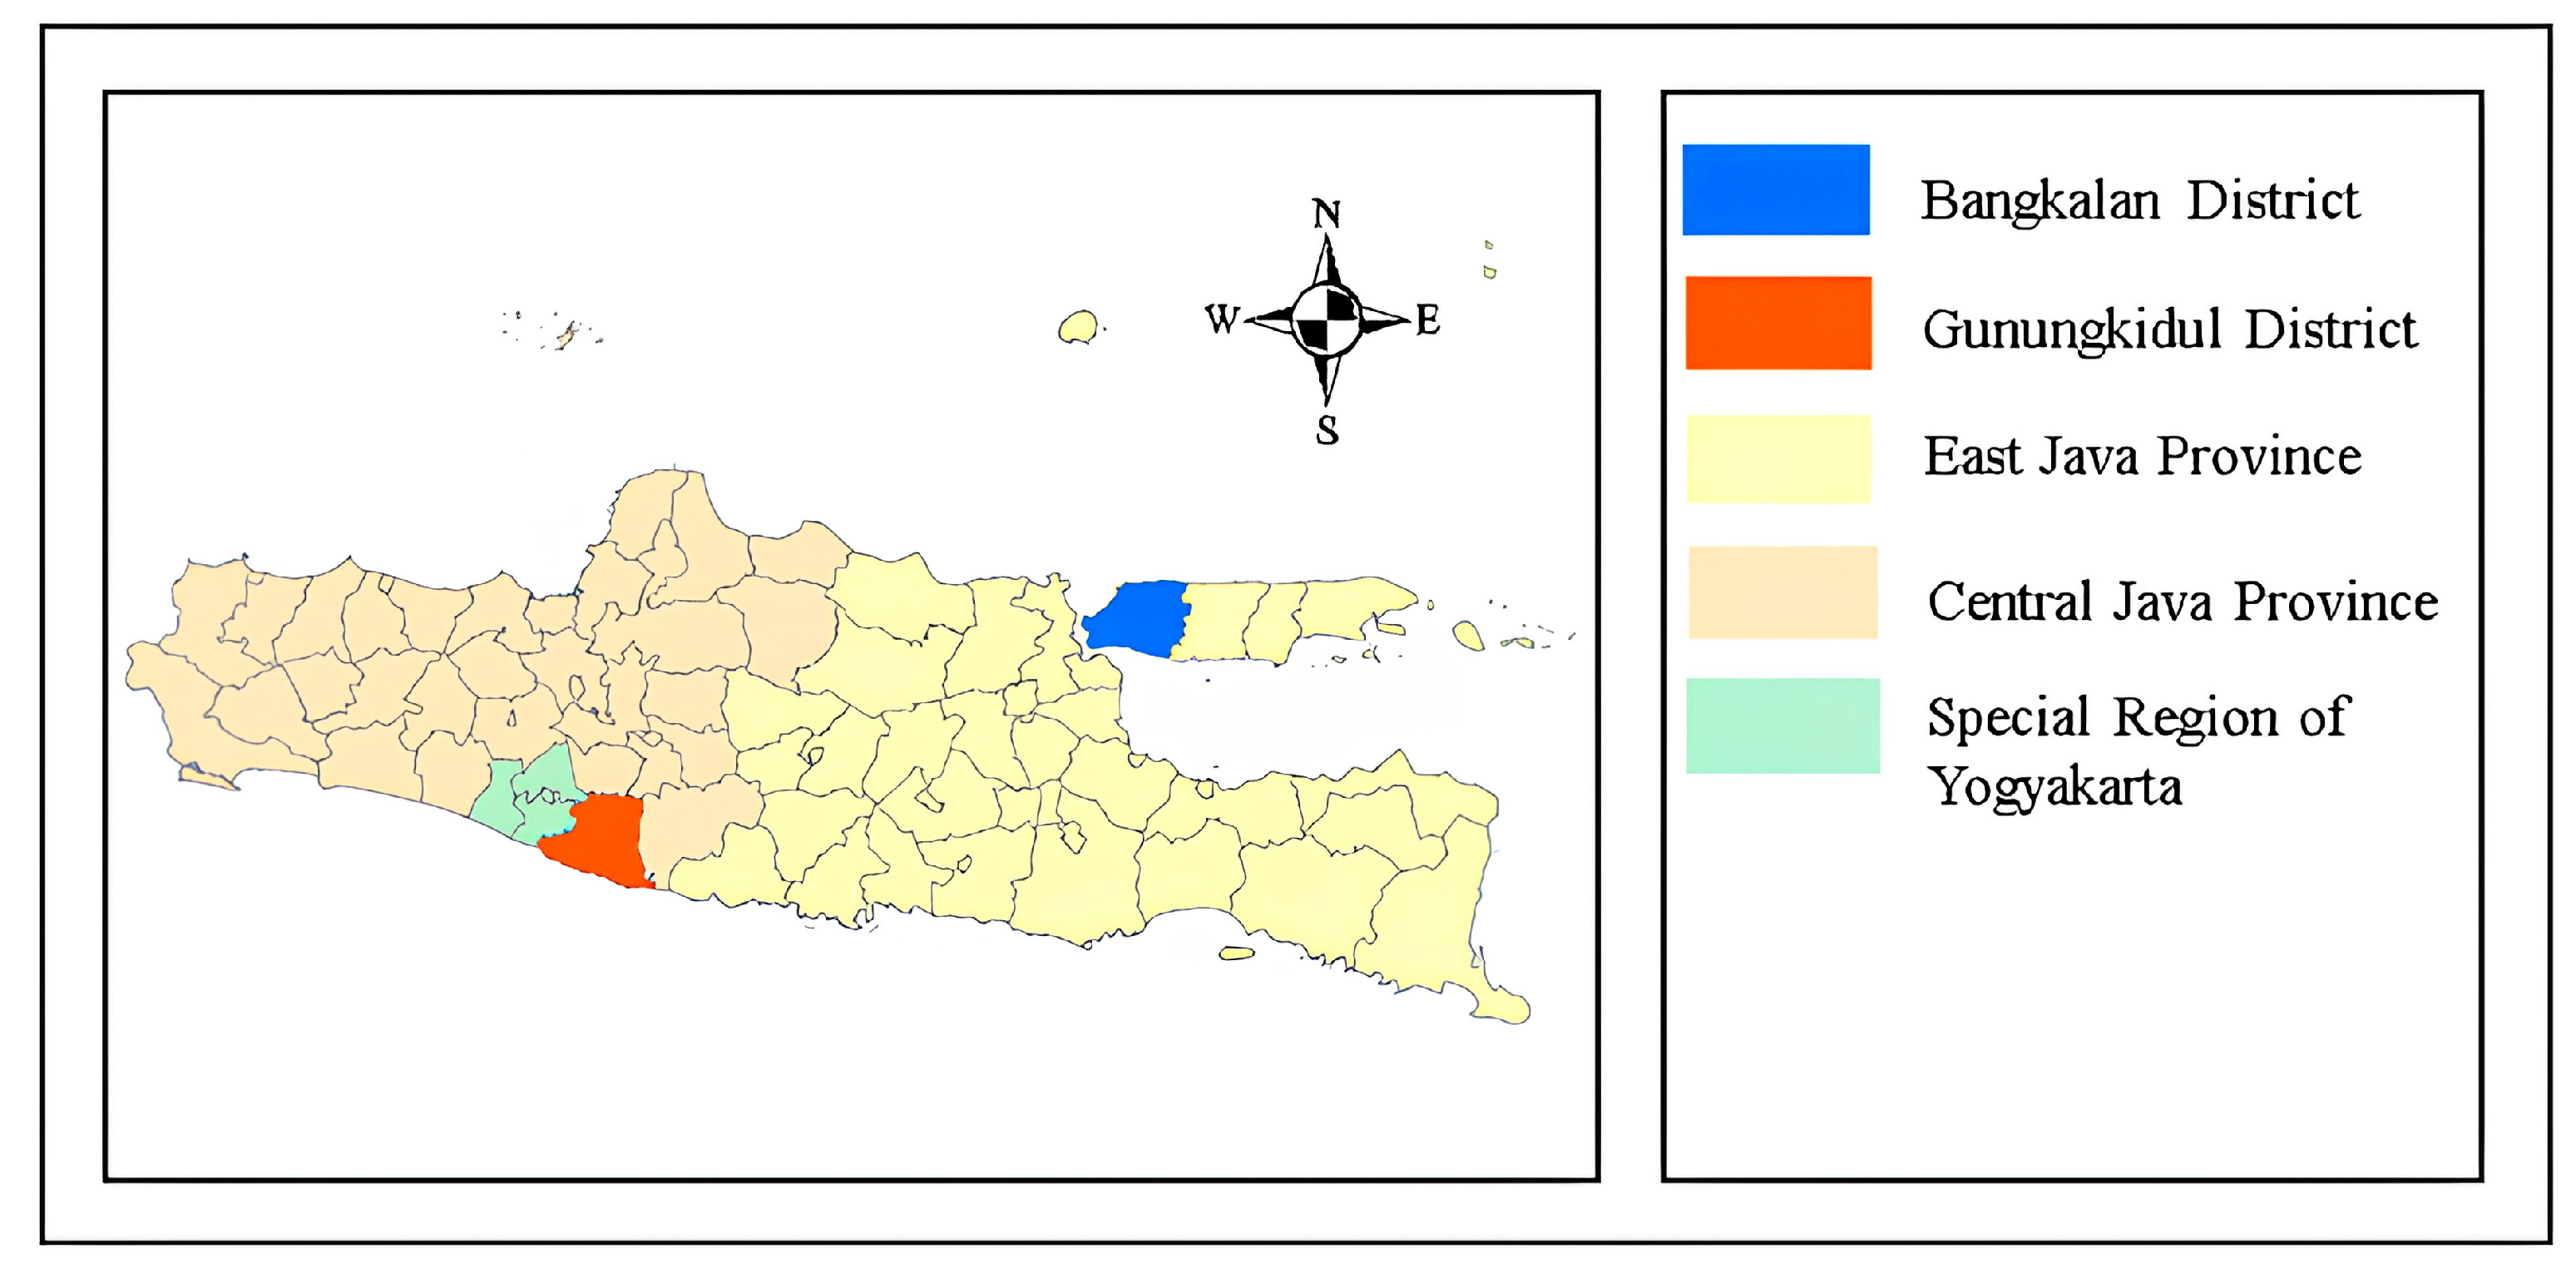
While facing this global pandemic, communities need strong economic resilience to overcome difficulties. The households studied were in rural Java (Gunungkidul District) and Madura (Bangkalan District), both of which have particularities in dealing with the pandemic. Gunungkidul is situated in a Special Region of Yogyakarta, Java. Most COVID-19 cases in Indonesia are found on this island because it is a highly industrialized and populous region [8]. With 135.33 thousand impoverished individuals in 2021, Gunungkidul has the second-highest percentage of poverty in the Special Region of Yogyakarta [9,10].
Madura Island is home to the Bangkalan people. The island is part of East Java, a province in Indonesia with the third-highest number of impoverished individuals [11]. Bangkalan has the second-highest poverty rate [12]. In 2021, 215.97 thousand Bangkalan people remained destitute [13].
With the help of market access in the research area, household members work hard to preserve and increase their assets and income, despite the challenging economic conditions and shock that affected those two regions. During the pandemic, some farmers obtained loans from different sources. The local government also helped the affected households by offering assistance. Given this fact, we aim to determine how these characteristics impact a household’s capacity to recover from economic slumps. Thus, the objective of this study is to assess how the pandemic affected the economic security of Bangkalan and Gunungkidul households and the factors that influence them. We hypothesized that the following six variables influence household economic resilience in Gunungkidul and Bangkalan: income, assets, distance between markets and farmers’ residences, product availability, assistance, and credit.
Studies have been conducted to investigate the effects of the COVID-19 pandemic on the communities in Gunungkidul [14,15,16] and Bangkalan [17,18,19]. However, no comprehensive studies on farming households’ economic security have been conducted simultaneously in Gunungkidul and Bangkalan. Thus, this research is essential to address the aftereffects of the pandemic, including potential unemployment and income decline. The findings of this study can help governments formulate policies. In addition, it can assist Indonesian farm households to become better equipped to handle future pandemics. Specifically, this study contributes to the understanding of issues surrounding post-pandemic economic resilience, particularly in Indonesia.

2. Literature Reviews

2.1. Economic Security

Before examining household economic security in Gunungkidul and Bangkalan, it is crucial to understand the essence of economic security. Economic security is the ability of people, communities, and families to satisfy their fundamental requirements in a respectable and long-lasting manner [20]. Income, employment, social protection, asset creation, and workplace security contribute to financial security and are necessary for individuals and communities to attain and sustain economic wellbeing [21,22,23,24].
Prior to the COVID-19 pandemic, global economic insecurity was widespread. Inequality and poverty have always been serious concerns, and the pandemic has worsened them. The pandemic has resulted in food and shelter insecurity in many households because of its significant economic impact, including job losses and income drops [23,25].
During the COVID-19 pandemic, Indonesia’s economic security was threatened by rising unemployment, and many people lost their steady income and job protection. The country’s poverty rate increased, thereby increasing the possibility of inequality [26]. In addition, the pandemic has diminished household income, reduced food poverty, and restricted access to healthcare and the Internet. Although most Indonesian households have experienced one or more of these economic and social hardships, these challenges are concentrated among the already poor or vulnerable households, rural households, and those with children [27]. Indonesia’s government policies aim to keep the country’s economic development rate steady despite the COVID-19 pandemic, and Bank Indonesia should closely monitor domestic and international economic events to control inflation and external factors. It was only the government’s carefully crafted policies that allowed the nation to resume its intended growth trajectory once the virus was contained [28].
Following COVID-19, farm households in Indonesia face several obstacles to their economic security. Almost every impoverished household in the rural regions rely on agriculture as their primary source of income. However, one cannot escape hardship by using only agricultural income. Many households in the rural and urban regions employ people from the service industry. Although there are many productive jobs in the service industry, many employees are forced to perform low-value tasks for a meager pay [29]. In addition, changes in input and product prices impact agriculture when input costs rise, and output costs fall. Farmers occasionally experience deficiencies due to this issue. Farmers adopt farming diversification as a means of coping with the economic downturn brought on by COVID-19 and to improve their standards of living [30].

2.2. Economic Resilience

G7 leaders have emphasized enhancing economic security and resilience to address disruptions and challenges [31]. Macro- and micro-economic resilience, when combined, can provide total economic resilience. Macroeconomic resilience minimizes the overall consumption losses for a given degree of financial loss. In contrast, microeconomic resilience is the capacity of a community and its wealth to reduce family well-being deficits for a specific amount of loss of collective consumption [32]. There are three common ways economic resilience can be observed when shocks or disruptions to a region’s economic basis occur: (a) recessions or other noteworthy occurrences in the domestic or global economy that affect consumer spending and the demand for locally manufactured items; (b) declines in specific industries that play a vital role in the region’s business; and (c) additional external shocks, such as an artificial or natural disaster, military installation shutting, the departure of a large employer, and the consequences of global warming [33]. This research in Gunungkidul and Bangkalan evaluated the effects of the COVID-19 pandemic, which is classified as a natural disaster [34].
According to pre-pandemic research conducted on the Gunungkidul coast, the key elements affecting a community’s resilience due to its proximity to the shore are alterations in the dynamics of the shore, particularly oceanography, climate, and maritime catastrophes [35]. Following the pandemic, a community service program in Kemadang Village, Gunungkidul showed that substantial social capital (community members’ trust in one another, information-sharing tactics, internal values, and inventiveness) drove resilience and local economic development. The pandemic has significantly impacted travel and thus caused many to consider other economic ventures. Mixing personal and group businesses is an outstanding strategy [36].
Prior to the pandemic, research conducted in Bangkalan and Tonjung Village revealed a low household income among rice farmers. Survival plans based on earnings, spending, and savings were implemented. Initially, farmers sought other ways to make ends meet, such as reducing the costs of farming operations and seeking loans from social networks. Strategies based on consumption include limiting consumption, supporting each other’s consumption needs through societal networks, growing vegetables in gardens near the house, utilizing a portion of the rice crop for personal use, and minimizing living expenses. Subsequently, they stored money in the bank, purchased jewelry, and raised livestock [37].
Nurlianti and Qhodriyah [38] researched micro, small, and medium enterprises (MSME) in Bangkalan after the pandemic. Their findings demonstrate a statistically significant advantage for the financial inclusion variable, suggesting that MSMEs can benefit from using banks and non-bank financial institutions to enhance their competitiveness and revive their economies, which have suffered because of the COVID-19 pandemic. In Langkap Village, Bangkalan, a household financial management training program was implemented face to face using modules. As a result of this training, the community is able to organize, carry out, oversee, assess, and manage the procurement and utilization of family financial resources to maximize meeting needs and guarantee family economic stability and expansion during the pandemic [39].
This study uses slightly different observation variables because of the differences in conditions at the research site and in the literature. We hypothesized that income, assets, market access, aid, and credit influence household economic resilience.
  • Household income: Any money or goods received in the form of cash or goods by any family member, including earnings or salaries, income from household businesses, other sources of income, and revenue from gifts from third parties (transfers) [40]. The effects of COVID-19 have been severe in Indonesia, resulting in income losses. Impoverished groups are more vulnerable to income-related disruptions due to their modest reserves. This cumulative stress is most evident in developing nations, such as Indonesia, where a single earner frequently supports an entire family. Consequently, all households suffered collateral damages [41].
  • Household assets: All properties a household owns, including physical assets such as jewelry, cars, houses, and financial investments [42]. These assets constitute a sizeable portion of a households total wealth and can generate income through sales or property income, such as dividends and interest [43].
  • Market access: Access to robust and functional markets enhances household resilience through the increased accumulation of assets and various sources of income [44]. This study in Gunungkidul and Bangkalan uses the distance from the house to the market and product availability to appraise market access. Shorter distances indicate the convenience of obtaining a range of nutritious foods from a significant source [45]. It also makes it easier for consumers to purchase additional daily necessities to enhance their economic adaptability. Market product availability is the second proxy for market access. Grubor and Milicevic [36] state that product availability is an essential component of delivery systems for retail enterprises because it correlates with product stock levels and consumer accessibility in retail establishments.
  • Aid: Public or private initiatives that support low-income people and households [46]. The type and quantity of welfare provided to these groups differ by nation, state, or area. UNICEF Indonesia [47] reported that, during the COVID-19 pandemic, 85% of Indonesian households received support; nonetheless, more aid must be provided to help the most vulnerable and impoverished, particularly children.
  • Credit: A legal arrangement where a borrower accepts an instant valuable item, usually money, and promises to pay for it later, generally with interest [48]. Easier access to credit allows more households to manage their spending over time and access home equity through cash-out refinancing transactions and lines of credit. However, families may be unable to satisfy their obligations if they are unaware of their responsibilities. Generally, late payments damage a household’s credit history, hindering its ability to obtain credit in the future, and may even result in the loss of collateral for debt [49]. The pandemic has hampered the human capacity to perform essential financial functions, such as paying credit [50].

2.3. Food Security

Food security, economic security, and resilience are closely associated; this forms the foundation of this study’s observations of household food security. Fundamentally, food security refers to consistently eating sufficient meals not only on a daily basis, but also for throughout the upcoming month and year [51]. The primary components of food security are availability, access, usage, and stability [52].
Regarding the first food security component, food availability involves having adequate meals in sensible amounts, whether from home production or imports (which involve food assistance) [53]. Food physical availability is influenced by its production level, stock level, and net trade [54]. Except under extreme circumstances, the availability of food and nutrients has a more significant effect on undernutrition than the GDP does [55].
Food access is defined as a person’s ability to obtain a sufficient amount of money to purchase food or the entitlement to purchase the right kind of food for a healthy diet [53]. Insufficient access to food and poverty are frequently brought on by high unemployment, a lack of good jobs, inadequate social safety nets, restricted spending capacity in both cities and the countryside, poor financial standing and disadvantaged individuals, insufficient resource performance, and a disparate distribution of valuable resources [56].
Food utilization, the third component, describes the consumption of an adequate and secure diet that satisfies each person’s physiological, sensory, and cultural needs [57]. The component of utilization was examined in terms of distribution based on necessity. Nutritional guidelines address the food needs of boys, girls, men, women, and expectant mothers across various age groups and stages of life. However, these needs are frequently constructed culturally and socially [58].
For the fourth component, it was important to observe the stability of the other three components over time. Even in cases where an individual eats ample nourishment, they remain viewed as food-insecure if they do not consistently have food access, which might cause their nutritional condition to deteriorate. Unstable political circumstances, bad weather, and economic problems (such as rising food costs and layoffs) may affect the degree of food security [54]. Stability acknowledges the possibility of temporary, recurring, or long-term food insecurity [57].
Food intake ratings, months of sufficient food supply, and household food expenses are the proxies used to quantify food security [59]. The share of food expenditure in Gunungkidul and Bangkalan was used in this study to calculate household food security. As quoted by Rahmansyah et al. [60], the division formula between household spending on food and total household spending can determine the portion of meal expenses. This indicator can be used to identify people at risk of price shocks and evaluate food security trends [61].
Research on food security is crucial because even though the number of individuals experiencing food insecurity has increased since 2014, the COVID-19 pandemic in 2020 caused food insecurity to skyrocket [62]. This state is related to economic security since, in the opinion of many, economic factors influence access to healthful foods controlled by food costs [63]. Increasing the household income and economic activity in rural regions can improve food security [64].
Previous research has shown that resilience improves households’ capacity to handle a variety of shocks without negatively affecting household food security. According to Alfani et al. [65], resilient households consistently consume more than non-resilient and chronically disadvantaged households. A statistically significant relationship exists between increased food consumption and a unit increase in resilience, even after controlling for household size, sex, and area [66]. When shocks occur, households with greater resilience capacity at the outset are unlikely to witness a decline in future individual calorie consumption [67]. This study supports the findings of Ciani and Romano [68], who discovered that during times of hardship, food security is more robust in households with greater levels of early resilience.
As food security in Indonesia is low, there is still potential for research on this subject to be included in an article. It is imperative to discuss Indonesia’s roots in resilience and how they connect to global food security pillars [69]. Future policies can be developed based on these findings. Understanding Indonesia’s lengthy agricultural history and unique local features is also necessary to create an appropriate legislation for food security during the COVID-19 pandemic, which is another strategy for improving national food security. Ultimately, as the goal of food security becomes increasingly difficult, all relevant parties or stakeholders must work together to support it [30].

3. Materials and Methods

3.1. Research Method

A mixed approach with a sequential exploratory strategy was employed, whereby qualitative data were first collected and analyzed. The second step involved obtaining and analyzing the quantitative data. This study employed descriptive and analytical analysis approaches to provide an overview of the phenomena, explain the link between variables, make predictions, analyze historical data, and determine the significance and ramifications of the problem being solved [70].

3.2. Sampling Method

Purposive sampling was used to identify the research location, which involved choosing a group of participants based on certain qualities or characteristics that were similar to the population’s previously known characteristics or attributes. Purposive sampling suggested that objectives could be attained using this approach [70]. Bangkalan and Gunungkidul districts were the study sites (Figure 1). Gunungkidul is a rural COVID-19-affected area with unfavorable geographic and natural characteristics that make it difficult to engage in profitable agricultural economic activities. The revenue of farming communities in the karst mountains is negligible. Bangkalan, a rural region, has a high incidence of COVID-19, despite inadequate adherence to health precautions. Despite these distinctions, many people in both areas live in poverty.
There were a total of 112 respondents, 60 from Gunungkidul and 52 from Bangkalan. As social interaction was restricted during the pandemic, the sampling techniques were based solely on chance. Specifically, farmers who met the researchers were considered appropriate as research samples [71]. Primary data from farmers representing their households were obtained in July 2021 through direct, in-depth interviews using questionnaires.

3.3. Data Analysis

For the data assessment, a multiple linear regression equation was used. A straight line is used in linear regression, which is a prediction technique, to depict the relationship between two or more variables. Multiple linear regression was used to ascertain whether two or more independent factors significantly influence the dependent variable [72]. The resulting linear model is as follows:
Y = b0 + b1X1 + b2X2 + b3X3 + b4X4 + b5X5 + b6X6 + e
Notes:
Y = economic resilience index
b0 = constant
X1 = household income
X2 = household assets
X3 = distance from house to market
X4 = product availability in the market
X5 = aid
X6 = credit
b1–b6 = regression coefficient
e = standard error
In this study, the economic resilience index (Y) was determined after dividing household monthly income by monthly expenses. Household income (X1) was calculated by adding monthly farming and non-farming income; the currency used was the Indonesian rupiah (IDR). Household assets (X2) could be determined after summing the selling value of household properties such as houses, land, and stalls; it also uses the IDR currency. The distance from the house to the market (X3) was measured in kilometers (km). Product availability in the market (X4) was assessed using a Likert scale: 5 = very equipped, 4 = equipped, 3 = quite equipped, 2 = less equipped, and 1 = very less equipped. Dummy variables were used to examine aid (X5) and credit (X6). For aid, the indicator was 1 = received aid, and 0 = did not receive aid. For credit, 1 = borrowed money and 0 = does not borrow money.
Statistical tests comprising simultaneous F, partial t, and the coefficient of determination were applied to the equation. SPSS Statistics 25.0 software was used for all examinations.

4. Results

4.1. Geographical Conditions in the Research Area

Gunungkidul District is the largest district in the Special Region of Yogyakarta Province, Java Island, accounting for 46.63% of the total province. The average elevation of Gunungkidul is 185 m above sea level (ASL). The areas around the seacoast are often lower in height. Conversely, high-altitude regions and cities are found in mountains and highlands. Gunungkidul can be categorized into three classes based on the slope of the land: steep, intermediate, and mild. A land slope of less than 15° is regarded as mild, whereas a land slope of more than 25° is considered steep. The land slope in the areas classified as intermediate ranges from 15° to 25°. A large proportion of the Gunungkidul area is classified as mild (52%), and the rest is classified as steep (15%) or intermediate (33%) [73].
The average air temperature is comparatively higher in areas near the coast. There are 2327 mm of recorded annual rainfall and 103.67 wet days. The ideal time for plant development is the rainy season. However, the karst highlands of Gunungkidul are arid and devoid of water. There is only one annual rice-planting season, which begins during the rainy season.
Bangkalan District, situated in the East Java Province on the western side of Madura Island, is another area of research. Based on information from Statistics Indonesia for the Bangkalan District [74], 18 subdistricts comprise 1260 km2 of Bangkalan. Bangkalan is categorized as a lowland area because of its variance in height, which ranges from 2 to 100 m ASL. The region around Bangkalan is 23 m tall on average. The Bangkalan region receives 0 and 475.8 mm of rainfall annually. Bangkalan’s air temperature observations indicate it is hot, because September temperatures can exceed 35.1 °C.

4.2. Agricultural Sector in the Research Area

The agricultural sector is the most significant economic contributor to Gunungkidul, with a total contribution of 24.66%. This sector has the largest workforce (52.8%) in Gunungkidul. The agricultural sector includes food crops, horticulture, and plantations. Most of the rice harvested in Gunungkidul is produced from field rice. The harvested area for this type of rice accounts for 40,008 ha, or 73.8% of the total harvested rice area.
The remainder is produced from lowland rice (14, 939 ha). Likewise, the conditions in the Girisubo Subdistrict are mostly paddy fields. No lowland rice is cultivated because most of the land in Gunungkidul and the Girisubo Subdistrict is dry land, so upland rice is suitable for cultivation in this area. The largest harvested area for food crops was peanuts at 54,098 ha. The second- and third-largest harvested areas were corn and cassava, with 52,946 ha and 43,855 ha, respectively. Rice, corn, and cassava are intercropped. It has been suggested that secondary crops that can withstand dry conditions better than upland rice are planted after upland rice, which requires more water, at the start of the rainy season.
The fruit group dominates the horticultural commodities in the Gunungkidul and Girisubo subdistricts. Harvest results from the vegetable group in Gunungkidul include shallots 7601 quintals, large chilies 2345 quintals, Chinese cabbage 3512 quintals, and eggplant 1222 quintals. Only chilies and shallots are seasonal horticultural commodities. This is because most of the land in Gunungkidul is dry and rocky; therefore, annual plants are suitable for cultivation.
Meanwhile, other seasonal horticultural commodities, such as cabbage, mustard greens, and lettuce, are not eligible for cultivation in Gunungkidul because of the soil and climate conditions. In the plantation subsector, only coconut, rubber, and cocoa were cultivated in Gunungkidul. The resulting production included 5098.81 tons of coconut, 1095.36 tons of sugar cane, 323.87 tons of tobacco, and 458.79 tons of cocoa.
Livestock developed in Gunungkidul includes cattle, goats, sheep, country chickens, laying chickens, broilers, and ducks. Large goat farms have the largest population compared to other farms, with 201,026 heads. The study includes 154,423 cattle and 11,528 sheep. The poultry with the largest population are broiler chickens (1,228,156 birds). The fisheries in Gunungkidul are divided into two types, marine and general types. Marine fisheries dominate fish production in Gunungkidul. Marine fishery production is 3452.05 tons in Gunungkidul. However, general fisheries only produce 94.75 tons.
Plantation production, horticulture, and fisheries are the main sectors of agriculture in the Bangkalan District. Coconuts have been used to develop superior plantation crops. With a harvest area of 7466.55 ha, the Bangkalan District produced 2057.76 tons of coconuts in 2020. With 896 hectares, the Tanah Merah Subdistrict has the largest area of coconut plantations, while the Kamal Subdistrict has the smallest area, with 75 hectares.
Mango is the leading agricultural product in Bangkalan, reaching 277.262 tons in 2020. The current year’s production was greater than the 221.339 tons produced the previous year. With 116.088 tons produced in 2020, the Klampis Subdistrict led Bangkalan District in mango production. Nevertheless, it has not been noted that the Belga and Burneh Subdistricts grow mangoes.
A total of twenty-six thousand tons of fish catch were produced in the seas of Bangkalan District in 2019. The Tanjung Bumi Subdistrict had the highest output, accounting for over 21% of the overall catch fishery output. The capture fisheries output fell by 1.28 percent in 2020 compared to the previous year. The Tanjung Bumi Subdistrict continued to be Bangkalan District’s primary source of assistance for harvesting fishery products until 2020.

4.3. Household Characteristics

This study included farmers from Gunungkidul and Bangkalan as respondents, representing their households (Table 1). The spouses and wives were of productive age, ranging from 25 to 60 [75]. On average, most husband and wife respondents finished 7th and 9th grades. Understanding and expertise are influenced by educational experiences [76]. Having a higher education made it easier for respondents to acquire farming knowledge and skills. The average number of household members in the two research areas was three: a husband, a wife, and a child.

4.4. Household Economic Condition

Land conditions in Gunungkidul cause farmers to cultivate rice only during planting season (PS) 1. Farmers produce other commodities as a source of income, such as peanuts, which contribute 50.44% of total farming income (Table 2). Farmers also cultivate corn and cassava to diversify their incomes.
Farming households in Bangkalan perform various tasks. The suitability of Bangkalan’s geographical conditions encourage families to prioritize rice as the primary commodity cultivated in PS 1 and PS 2. Based on interviews with respondents, efforts to improve soil structure were carried out by planting peanuts.
Although there are differences in the style of farming between Gunungkidul and Bangkalan, both communities raise livestock, including cows, goats, chickens, and ducks. Livestock farming is conducted to support the success of agriculture and increase household income. This finding aligns with that of a study by Mokoena et al. [77], who stated that livestock significantly contributes to rural upliftment and people’s wellbeing in low-income countries.
Given the adverse land conditions, Table 2 shows that households in Gunungkidul relied mainly on livestock as a source of income. Income from livestock (IDR 16,849,167.00) far exceeded that from crop farming (IDR 3,840,313.00). Meanwhile, households in Bangkalan used livestock farming as a side economic activity, as earnings from livestock amount to IDR 1,557,404.00. This value was much lower than the crop farming revenue in Bangkalan, which amounted to IDR 9,915,587.00.

4.5. Farming Income

Before analyzing farming income, it is necessary to analyze farming costs in the research area. Households in Gunungkidul tended to spend more money on their cattle, as can be seen from the percentage, reaching 72.98% (see Table 3). This indicates that households in Gunungkidul expected a significant income from cattle. Meanwhile, the largest component of household costs in Bangkalan, based on Table 3, was for PS 1 and PS 2 rice farming, reaching 70.36% of the total.
Farming income was determined by analyzing the income and costs of farming in Gunungkidul and Bangkalan. Farming income is the deduction of the total expenses incurred against the sum of income from all of the agricultural commodities cultivated and livestock raised. The farming income is presented in Table 4.
Table 4 shows that Gunungkidul farmers lost money when cultivating rice in PS 1. The costs incurred were more significant than the costs that must be incurred. Gunungkidul farmers’ efforts to address land conditions by raising livestock for income was the right step. Farming households with significant capital had the option to raise cattle, which can provide an income of 55.19%.
Households with a limited capital chose to raise goats, with an income contribution of 16.50%. The function of livestock, apart from being sold to increase income, was for farmers to use their dung as drum fertilizer for cost efficiency. Different conditions occurred in rice cultivation in Bangkalan because they contributed the most extensive annual household income.

4.6. Allocation of Harvest

Most of the rice harvested in Gunungkidul (63.73%) was consumed by the farmer families (Table 5). The main aim of farmers growing corn, peanuts, and cassava was to sell them to increase their income. Households raised livestock for sale.
Farmers in Bangkalan exhibited different behaviors when distributing their harvests. Farmers tended to sell their rice rather than consume it in PS 1 and PS 2. Farmers had estimated an enormous demand for grain to meet societal requirements, food supply, and seeds for the upcoming planting season. Farmers cultivating corn and peanuts aimed to raise their income by selling more products (73.33% for maize and 100% for peanuts). Households attempted to increase their consumption of animal protein by raising chickens and other livestock. Based on the field research results, more livestock products were consumed by farmers’ families.

4.7. Household Expenditure

A family’s monthly food and non-food expenses are known as household expenditures. Households in Bangkalan and Gunungkidul use various household goods to enhance their standard of living. From the perspective of rural households, their standard of life and income are reflected in the improvement and variety of consumer expenditures [78].
The percentage of food spent is a valuable indicator of food security because it is highly correlated with income, diversity, and consumption levels [79]. Food security decreases as food spending increases. When food costs account for a considerable percentage of a household income, even a small change in income or price can significantly affect how easily a household obtains food.
In Gunungkidul, the average household spending was IDR 1,822,978, with IDR 1,064,617.50 moving toward food, and IDR 758,360.68 going toward non-food expenses (Table 6). Spending on food was 58.40%, whereas spending on non-food items was 41.60%. Since the proportion of food spending is below 60%, families in Gunungkidul had favorable food security conditions. Households in Bangkalan, with a total expenditure of IDR 2,094,483.00, exhibited different characteristics. The amount spent on food was IDR 1,361,517.88, whereas that spent on nonfood items was 732,965.12. The percentage of money spent on food was 65%; when the amount is more significant than 60%, it is regarded as excessive [80]. As the percentage of household dietary spending increased, household welfare and food security declined [81].
According to Table 7, the highest food expenditure of respondents in Gunungkidul was for the cereals group, amounting to IDR 282,683.33/month, or 26.55% of total food expenditure. The cereals consumed included rice, corn, rice flour, and wheat flour. Rice was the most widely consumed grain because it is a household staple. There were differences in conditions in Bangkalan because the highest household food expenditure was on seafood, amounting to IDR 261,038.46/month, or 19.17% of the total food expenditure. Bangkalan people prefer fresh fish for daily protein consumption because they live in a coastal area; therefore, fish are easy to obtain. The second-largest food expenditure for households in Gunungkidul and Bangkalan was for tobacco cigarettes. Smoking is a habit of most male household members.
Household non-food expenditures in Gunungkidul and Bangkalan are shown in Table 8. The average household nonfood expenditure in Gunungkidul was IDR 758,360.68/month. The highest nonfood expenditure was on goods and services (36.09%), including soap, toothpaste, transportation, motorbike/car maintenance, and credit. Housing (25.41%) had the second-highest expenditure, including electricity costs, cooking fuel, and other items. The third-highest expenditure was on social needs (17.84%); for example, donating when a neighbor gets married, circumcised, dies, or attends a religious celebrations and customs in the surrounding environment.
The households in Bangkalan had lower non-food expenditures than those in Gunungkidul, amounting to an IDR of 732,965.12/month. Education costs, which included pocket money, books, stationery, educational development contributions, and other expenses, accounted for the majority of non-food expenditures (42.06%). The second- and third-highest non-food expenditures were for goods and services (25.23%) and housing (22.03%).

4.8. Household Income

The farmers’ household income was obtained by adding farming, non-farming, and remittances from children/relatives who had migrated outside of the area. Table 9 shows that non-farming fields generated the highest household income, reaching 53.61% in Gunungkidul and 75.41% in Bangkalan. Farming income in Gunungkidul contributed 30.22% of the household income. Farming income was increased by raising livestock, the growth of which was determined by unfavorable geographical conditions. Due to the limited regional potential, efforts to earn a living outside of the region contributed 16.17% of the household income. Meanwhile, farming income in Bangkalan contributes only 14.47%, a difference of 4.35% from remittances.
The primary uses of money earned were meals and non-meal costs. High food prices suggest that Bangkalan and Gunungkidul households remained low-income areas. Nonetheless, Bangkalan households made IDR 1,745,894.00 in excess income each month. This substantial sum could be put to good use to raise the household income.

4.9. Economic Resilience

Economic resilience is the capacity to recover from or adapt to the detrimental effects of external economic shocks [82]. The level of household economic resilience can be determined by calculating the income and expenses of all the respondent households. Calculations are made by comparing income and expenses. If the value is greater than one, the household is economically resilient; if it is less than one, it is not yet resilient.
Table 10 indicates that only 46.67% of households in Gunungkidul were resilient, while the average economic resilience was 1.21. Households in Bangkalan, with a percentage of 61.54% of resilient households and an economic resilience value of 1.77, were more resilient than those in Gunungkidul. This number means that Bangkalan households exhibited a greater resilience than Gunungkidul households. However, both research areas generally were in good condition, with an average resilience value of 1.47.

4.10. Household Assets

According to Bryant [83], assets are wealth or resources owned by a family. Families with more assets were more prosperous than those with few assets [84]. Each household in the two research areas had different assets, as shown in Table 11.
The largest asset owned by households in Gunungkidul was the house, with a percentage of 48%, followed by land (41.97%) and livestock (4.29%). Different conditions were observed in households in Bangkalan. The most significant asset was land (57.28%), followed by houses (35.47%) and vehicles (2.75%). Overall, the household assets in Bangkalan (IDR 351, 035, 791.67) were more significant than those in Gunungkidul (IDR 459,455,769.23).

4.11. Market Access

Respondents obtain income from farming and non-farming businesses because markets are the fundamental centers of economic activity. Respondents spend money on the market to meet their basic requirements and use it as a source of income. The respondents in Gunungkidul must travel 2.47 km (average distance) with limited modes of public transportation to reach the market. This is a severe obstacle faced by farmers in Gunungkidul. In contrast, the nearest market in Bangkalan is approximately 1 km from the respondents’ houses (the average distance is 1.21 km), and many modes of public transportation are available. This makes it easier for households to meet their daily needs, market agricultural products, and obtain the inputs required for farming. Product availability in the market is considered sufficient for fulfilling household needs (Table 12).

4.12. Receipt of Aid

Pan et al. [85] inferred that offering monetary assistance is a key strategy for assisting entrepreneurs to successfully overcome the consequences of the COVID-19 pandemic. Forms of non-financial and financial support were provided to the affected communities in the research area. Table 13 compares the respondents who received aid and those who did not.
Before the pandemic, the proportions of recipients and non-recipients of aid in Gunungkidul were almost equal. However, after the pandemic, there was an initial increase in the number of aid recipients from 29 households to 54 households. Different conditions occurred in Bangkalan. Before the pandemic, 37 households had received assistance, but the number decreased to 32 households after the pandemic.
In total, nine different types of assistance were provided to households. Non-Cash Food Aid (BPNT), Cash Social Aid (BST), fertilizer subsidies, the Family Hope Initiative (PKH), study quota subsidies, electricity subsidies, MSME aid, and other forms of aid were among the available aid options (Table 14). Electricity subsidies were the most frequently received type of assistance by households in Gunungkidul (66.7%). BST (27%) and PKH (15%) were the second- and third-highest levels of assistance received, respectively.
The data suggest that households in Bangkalan received the most BPNT at 44.2%. Furthermore, 36.5% of the households received electricity subsidies. Third, the study quota subsidy was received by 26.9% of the households in Bangkalan.
After determining the type of assistance received by the households in this study, the data are described in more detail in Table 15, based on the form of assistance, level of usefulness, and the most helpful type. Most household members in Gunungkidul felt concerned about their neighbors during the pandemic, while most household members in Bangkalan felt no concern from their neighbors. Sunarti [86] argued that similar economic conditions are the reason for restricted coping mechanisms and assistance from friends, neighbors, and extended families. Regarding the use of local potential, households in both research areas considered no potential. Most of the support came from banks in Gunungkidul and relatives in Bangkalan.
Table 16 details the period of receipt based on the type of assistance. Most BPNT reception periods were one month in Gunungkidul and three months in Bangkalan. Reception of fertilizer subsidies in Bangkalan was within twelve months. Then, for BST, the reception period in Gunungkidul was a maximum of six months, and for Bangkalan, it was three months. The period for receiving PKH in Gunungkidul and Bangkalan was mostly one month.
The study quota subsidy had a receipt period of one month for both Gunungkidul and Bangkalan. Most of the time, electricity subsidies were received in both research areas for one month. The period for receiving MSME assistance was 12 months in Gunungkidul, whereas other types of assistance were received within 12 months in both research areas.
After determining the period for receiving each aid, the next step was to identify the aid providers, as shown in Table 17. The government provided all of the BPNT aid to Gunungkidul, whereas most BPNT providers in Bangkalan were village heads. The government offered fertilizer subsidies to Bangkalan. The BST was then provided by the Gunungkidul Social Service, while the village and subdistrict heads provided the BST in Bangkalan.
PKH aid and study quota subsidies were provided by social services in both research areas. The PLN supplied electricity subsidies to Gunungkidul, whereas in Bangkalan, they were provided by the government and PLN. The government offered MSME assistance to Gunungkidul. Pre-employment and inhabitants in Gunungkidul provided other assistance, whereas in Bangkalan, it was provided by the government.
Table 18 shows that most of the assistance provided to households in Gunungkidul was classified as simple assistance procedures. Only study quota and electricity subsidies were considered complicated procedures. Almost the same conditions were observed in Bangkalan households, where most methods of receiving aid were simple. However, most recipients in Bangkalan considered BST complicated.

4.13. Credit Loan

Some household members in Gunungkidul and Bangkalan were debtors or parties who borrowed money for various purposes such as meeting household needs, using it for business capital, buying livestock, and renovating houses. Most parties providing loans or creditors in the two research areas were banks, cooperatives, neighbors, or relatives. As presented in Table 19, there was an increase in the number of debtors in Gunungkidul from 37 to 47 households during the pandemic. Different results were observed in Bangkalan, where the number of debtors was stable, with a total of only three households.

4.14. Impact of Pandemic and Mitigation Effort

Most households in Gunungkidul suffered a drop in income post-COVID-19 pandemic; the percentage was 75% (Table 20). A total of 11.7% of the respondents responded that they were unaffected, while the rest stated they had various consequences, such as loss of work, quiet trade, and reduced working hours. Similar conditions occurred in Bangkalan households. Most households experienced a decline in income. Some respondents stated that they were unaffected, their working hours were reduced, and trade was quiet. However, no household members in Bangkalan lost their jobs.
Numerous initiatives have been undertaken to mitigate the COVID-19 pandemic’s implications. Most household members in Gunungkidul reduced their expenses and sought other jobs. The actions made by household members in Bangkalan were not much different, namely, reducing costs and not making any effort (did nothing).

4.15. Regression Analysis Result

Table 21 displays multiple linear regression findings to identify the variables influencing family economic resilience amid the COVID-19 pandemic. Household income and product availability in the market positively affected household economic resilience. The other vital variables fostered a higher economic resilience; although, the household assets exhibited a negative tendency. The remaining variables (distance from house to market, aid, and credit) partially did not affect economic resilience. Meanwhile, based on the F test, all variables significantly influenced the economic resilience variable.
The R Square value was 0.742 or was classified as vital because it was greater than 0.67 [87]. The interpretation of the R Square value was that household income, household assets, distance from house to market, and the availability of products in the market, aid, and credit influenced 74.2% of the economic resilience in Gunungkidul and Bangkalan households during the pandemic. Factors outside of the studied variables influenced the remaining 25.8%.

5. Discussion

A precondition for food security is the accessibility of appropriate meals that are sound, broad, healthy, fair, and inexpensive, and that do not contradict the community. This state enables individuals to sustainably lead long, active, and fruitful lives in a sustainable manner [88]. One factor that can hinder the meeting of food needs, is the pandemic. The COVID-19 pandemic slowed food consumption, which grew by only 0.71% (year-over-year) throughout the second quarter of 2020 [89].
Most of the household members typically consumed three meals per day, with an average of 97 households (86.61%). A total of 14 households (12.50%) had members who frequently ate twice daily, and one household (0.89%) had members who ate only once daily. The results also revealed that all household members (100.00%) consumed rice as a staple food. This finding indicates that households are highly dependent on rice.
Households produced, purchased, and distributed rice based on the origin of staple foods. A total of 85 households (75.89%) received rice from their output, seven households (6.25%) from buying, 19 households (16.96%) from their production and buying, and one household (0, 89%) from giving. Some households obtained rice from their production because most farming households lived in rural areas and had primary or secondary jobs as farmers. Following Kansiime et al. [90], farmers were far less inclined to see a decline in food security during the pandemic than other respondent categories, which primarily relied on market sources for food.
Price is a factor that influences food consumption. If the product is currently widely accessible in the market, pricing will be essential, as raising the price may discourage people from buying it. Similarly, consumers in such a market will substantially increase the quantity they purchase if prices are dropped [91]. However, this study found that when the cost of rice increased, all household members in Gunungkidul and Bangkalan did not replace rice with other staple foods. This outcome is consistent with research conducted by Kuntjoro [92] and Devi et al. [93], indicating that rice is inelastic in Indonesia’s urban and rural areas. Most respondents did not switch to other foods because other staple foods were more expensive than rice, and rice could be produced by themselves. Another reason for the small number of respondents was that other staple foods were not tasty and impractical to prepare for consumption, such as tiwul or corn rice. This result aligns with that of Hafizah et al. [94], who concluded that rice is still considered a fundamental diet in Indonesian homes when compared to other commodity groups.
When the cost of rice increased, households might decide to consume a certain amount of lower-quality rice. Most respondents implemented this strategy when quantity was prioritized over quality. Some household members continued to consume rice in the same quantity and quality as when the price of rice was stable because they produced rice; price increase did not affect the amount they consumed.
Changes in food prices may account for a significant percentage of a household’s total food expenditure. This situation is problematic because as food is needed, family members will invest a lot of money in their meals. Consequently, they have less money available for other necessities, such as healthcare and education [95]. When the food spending share is below 60%, a household is considered food safe [96].
According to the findings, 40% of the households in Gunungkidul devoted a significant portion of their earnings to meal expenses, whereas up to 60% spent less. In contrast, the situation in Bangkalan was worse, with only 30.77% of households having a low proportion of food expenditure, and up to 69.23% having a high proportion. Field observations showed that respondents from Gunungkidul were more worried about monthly food costs and consumption. They also bought necessities because they had simple and modest lifestyles. Although households in Gunungkidul experienced greater food security than those in Bangkalan during the pandemic, both regions still need to make improvements to reduce the percentage of family food expenses.
One potential solution to mitigate the COVID-19 pandemic is to implement a Sustainable Livelihood Framework (SLF). The SLF takes a human-centered approach to environmental issues, concentrating on the assets and lifestyles of mostly underprivileged rural and marginalized urban citizens [97]. Qualitative evaluations frequently gather information from households, communities, and neighborhoods [98]. It can be used to respond to community conditions due to changes in situation (trends), seasonal conditions, and shocks.
In Gunungkidul, the shock of the COVID-19 pandemic was evident in 55.0 percent of the households with members who saw a decrease in income and in the 8.3 percent that lost their jobs. The decline in income due to COVID-19 was felt mostly by people who work as farmers/breeders. Conforming to the SLF, this case requires an alternative income activity that the community can afford.
Household members in Gunungkidul made alternative efforts to survive by reducing expenses (33.3%) and seeking other types of work (21.7%). Farmers/breeders (90.0%) made efforts to minimize expenditure. Farmers/breeders in Gunungkidul (84.6%) also attempted to find other jobs. This implies that the farming/breeding community in Gunungkidul was still considering maintaining its assets by working hard to reduce expenses and looking for other jobs. People with a low education in Gunungkidul chose to resign to minimize food and non-food expenditures. Uniquely, primary school graduates dominated farmer/breeder jobs and were still trying to find other jobs.
Respondents in Bangkalan also indicated shocks in the form of a decrease in income (55.8%), lack of merchandise, or a reduction in turnover (7.7%). Bangkalan people made alternative livelihoods by selling assets, opening new businesses, reducing expenses (21.2%), and looking for other types of work (17.3%). People who initially worked as farmers or breeders (72.7%) dominated the Bangkalan community by combining selling assets, opening new businesses, and reducing expenses. Efforts to find other work were made by those who originally had professions such as laborers or coolies (77.8%).
This evidence shows how vulnerable farmers/breeders in Bangkalan were when facing the COVID-19 pandemic, as demonstrated by their efforts to sell their assets to survive. However, these results also suggest the emergence of creativity among farmers/breeders by trying to open new businesses and maintain the spirit of survival, while still reducing expenses. Efforts to find other work were made by laborers and coolies, considering that they did not have the resources to open a new business. Those with middle and high school education carried out combined efforts to sell assets, opened new businesses, and reduce expenses. A higher educational background plays a creative role in overcoming emergency conditions. Meanwhile, those with primary school education sought other jobs that did not require high specifications to earn an income.
Indeed, the SLF concept has proven very successful in efforts to earn a living in conditions of shock, like the COVID-19 pandemic [99]. The SLF is strongly influenced by capital assets, comprising social, human, natural, physical, and financial capital; this capital condition will be better if supportive institutional access exists. If a community can no longer utilize capital, and institutions do not support it, it will migrate to another place [100]. However, this pandemic has become a limitation for people migrating. Therefore, whether or not people like it, they must try to make the most of their capital.
Household economic resilience in Gunungkidul and Bangkalan has been allegedly affected by several factors during the COVID-19 pandemic. The first factor examined was household income, which is described as the total income shared by every individual in the same family. In economics, a household is an entity in which there is some degree of shared consumption and monetary assets [101]. Families are predicted to be more resilient to economic shocks if they believe that their income covers all or most of their daily expenses [102].
This study found that the income of Gunungkidul and Bangkalan households significantly affected economic resilience, which aligns with the research conducted by Amalia and Samputra [103] and Ningsih et al. [104]. The key to farmers’ economic resilience is how much money they make as a family and how well they manage their finances to meet their primary requirements. Women who can support and effectively handle family finances played a crucial role in farming households’ economic resilience before and after the COVID-19 pandemic [105].
The second factor observed was household assets. Generally, assets are a company, organization, or individual’s possession with economic, commercial, or exchange worth [106]. Assets and income were used to measure household resilience [107]. The only distinction between assets and income, which were considered economic resources, was their forms. Traditionally, income has been considered a primary economic determinant of wellbeing. Consequently, home income is commonly used to replace consumption, and it is rarely acknowledged that household assets contribute independently to wellbeing [108].
Despite this negative relationship, this study found that Gunungkidul and Bangkalan’s household assets significantly impacted their ability to withstand the COVID-19 pandemic economically. Reducing assets will improve the financial resilience of households. This result differs from the research by Rochmadi [109], who found that the more assets a family has, the more surplus the family has, indicating that the family’s economic resilience is becoming stronger. Meidiana and Marhaeni [110] find that asset ownership does not affect household welfare.
The ownership of household assets in Gunungkidul and Bangkalan was accompanied by maintenance expenses; the more assets they had, the more fees incurred each month, which impacted a household’s economic resilience. Several types of assets, such as houses, furniture, and electronic appliances, also experienced monthly depreciation, causing losses if not appropriately used as business capital. The risk of losing or damaging assets due to unforeseen events, such as natural catastrophes, also arises from owning assets. Asset damage prevents people from producing assets that harm the populace’s wellbeing [32].
Distance from the house to the market was the third factor in this observation. The average distance between respondents’ homes and the market was 1.89 km. If traveling on foot, this distance takes up to 30 min, whereas when traveling by a motor vehicle, it only takes 5 min. Most respondents had private vehicles, so time was flexible for them to go to the market to carry out economic activities amid the COVID-19 pandemic, including purchasing daily necessities and agricultural inputs or selling agricultural products.
The evidence in Gunungkidul and Bangkalan indicates that the distance from the house to the market did not affect economic resilience based on regression analysis. Distance was not an obstacle for respondents to enter the market. Respondents could travel equal long distances because the majority of respondents had vehicles. Respondents who did not have vehicles could still go to the market; they usually used public transportation, hitchhiked neighbors’ vehicles, or walked. This instance is compatible with Ferawati et al. [111], who suggested that consumers’ decisions to buy rice are not influenced by the distance of their homes from the place of purchase. Meanwhile, a study in rural China by Emran and Hou [112] found that a household’s per capita expenditure increases by 43.05 yuan for every 10 km decrease in distance to the domestic market from its initial 150 km distance from the local and overseas markets.
It should be emphasized that, although the distance between a market and a region cannot be altered, the condition of the roads that lead to and from markets can [113]. Smallholders with restricted market access are more susceptible to shocks and miss out on the economic possibilities of easy trade [114]. Fortunately, the road conditions in Gunungkidul and Bangkalan are considered good. The road infrastructure must be improved to support household economic activities.
The fourth factor is product availability in the market. Product availability is the selection of goods that a store or supermarket has in stock and comprises all product categories, widths, and variations [115]. Product availability reliably and effectively provides consumers with what they anticipate in a readily accepted form [116]. Owing to consumer hoarding and panic buying during the COVID-19 pandemic, retailers’ inventory management has several operational issues, including ensuring product availability [117].
This study suggests that product availability in the market significantly and positively affected economic resilience in the two research locations. Most respondents in Gunungkidul and Bangkalan viewed product availability in the market as either quite complete or complete. Product availability, whether food or non-food, is essential for fulfilling their daily household needs during the COVID-19 pandemic. If these products are unavailable in the market, households will struggle to live and have no/small stock if quarantine occurs, which can destabilize the household’s economic resilience.
Aid was the fifth factor examined. Various types of monetary and non-monetary support have been provided to the regions affected by the COVID-19 pandemic, such as Bangkalan and Gunungkidul. According to this study, aid had no discernible impact on economic resilience. These results differ from those of existing studies, which indicate that assistance such as the BLT, PKH, and BPNT significantly affects households’ economic welfare in Indonesia [118,119,120].
The circumstances in Bangkalan and Gunungkidul demonstrate that not every household received aid during the COVID-19 pandemic. Even if they received help, it was complementary and not substantial. Households were not dependent on help because, before obtaining it, they had a variety of more reliable and dominant sources of income. This situation is consistent with Wagle’s [121] assertion that, although remittances significantly lower the incidence and severity of poverty in many households, their ability to improve economic security and reduce poverty is undermined when other household earnings prospects are considered.
As the sixth factor, credit represents an agreement to accept products, services, or money now and pay later. Convenience, emergency solution, better services for items purchased on credit, and advantage for sales are some of the benefits of credit [122]. However, credit did not significantly affect the economic resilience of the Gunungkidul and Bangkalan households during the COVID-19 pandemic.
Not all households borrowed money; some perceived loan interest to be high and they may experience default if they borrow money. Meanwhile, the amount of loan was not considered sufficient for households that borrowed money, so a household’s economic condition did not depend on credit. Households in Gunungkidul and Bangkalan have assets and income from farming and non-farming, which are in good condition; thus, they can maintain their economic resilience. The results of this study differ from those of previous research in which credit plays a significant role in economic welfare indicators [123,124].

6. Conclusions

This study determines that most households in Gunungkidul (53.33%) are not economically resilient, whereas most households in Bangkalan (61.54%) are economically resilient. Bangkalan households also have a higher monthly income of IDR 3,840,377 than Gunungkidul households (IDR 1,912,303). Bangkalan households have more assets (IDR 459,455,769.23) than Gunungkidul households (IDR 351,035,791.67). From the aspect of market access, the Gunungkidul household’s average distance to the market is 2.47 km, while the average distance from Bangkalan households to the market is 1.21 km. Most households in Gunungkidul consider product availability in the market to be moderately sufficient, while Bangkalan households perceive it as sufficient. There was a considerable increase in aid receivers in Gunungkidul households, from 29 (before the pandemic) to 54 (after the pandemic). The opposite happened to Bangkalan households, as the number of aid receivers decreased from 37 to 32. An increase in debtors can be observed in Gunungkidul households, from 37 (before the pandemic) to 47 (after the pandemic), while the number of debtors in Bangkalan stagnated and stayed in three households.
Following this hypothesis, household income, assets, distance from the house to the market, product availability, aid, and credit have been shown to influence economic resilience. Household income and product availability in the market significantly and positively affect economic resilience. Household assets significantly negatively affect economic resilience. The remaining variables (distance from the house to the market, aid, and credit) do not partially influence economic resilience. The roles of the community and stakeholders are needed to improve aspects that significantly affect Gunungkidul and Bangkalan households’ economic resilience so that they can fully recover following the COVID-19 pandemic.
This study has several limitations. First, researchers could not meet and interview many farmers during the survey because of social restrictions. With more samples, the obtained data shall reflect the field circumstances more appropriately. Second, because the respondents expressed unwillingness to further communicate, the research was conducted only once, in 2021. Conducting research at two distinct times will be ideal for comparative analyses and obtaining comprehensive results. Notwithstanding the shortcomings of this study, our findings can be applied to other impoverished areas of Indonesia besides Gunungkidul and Bangkalan, especially as rural areas are still dominated by the farming sector. Considering the findings of this study, the Indonesian government should consider the best strategy to increase rural households’ economic resilience in the face of an impending shock.
Future research should be conducted with larger sample sizes and more intricate factors. It is imperative to differentiate among tenant farmers, farm owners, and paid farm laborers so that researchers can compare each farmer’s level of economic resilience. Next, researchers must seek out participants amenable to participate in the study process at least twice to gather information about the circumstances before and after a shock event. However, extensive planning is required for future research, including additional literature reviews, longer research durations, and more intricate and detailed analytical procedures.

Author Contributions

Conceptualization, E.A.; methodology, E.A. and U.B.; formal analysis, E.A., W.R., I.I. and F.A.N.; investigation, F.A.N.; writing—original draft preparation, E.A., U.B., W.R., H.H., I.I. and F.A.N.; writing—review and editing, E.A., U.B., W.R., H.H., I.I. and F.A.N.; supervision, H.H.; validation, E.A. All authors have read and agreed to the published version of the manuscript.

Funding

This research was funded by Universitas Sebelas Maret (number 2400/UN27.22/PN.01.03/2021).

Institutional Review Board Statement

Not applicable.

Informed Consent Statement

Not applicable.

Data Availability Statement

Data are contained within the article.

Acknowledgments

The authors thank all the participants who supported this research.

Conflicts of Interest

The authors declare no conflicts of interest.

References

  1. Bhusal, M.K. The World after COVID-19: An Opportunity for a New Beginning. Int. J. Sci. Res. Publ. 2020, 10, 735–741. [Google Scholar] [CrossRef]
  2. Ozili, P.K.; Arun, T.G. Spillover of COVID-19: Impact on the Global Economy; SSRN: Rochester, NY, USA, 2021. [Google Scholar] [CrossRef]
  3. Abebe, E.C.; Dejenie, T.A.; Shiferaw, M.Y.; Malik, T. The Newly Emerged COVID-19 Disease: A Systemic Review. Virol. J. 2020, 17, 96. [Google Scholar] [CrossRef] [PubMed]
  4. Chen, H.; Qian, W.; Wen, Q. The Impact of the COVID-19 Pandemic on Consumption: Learning from High Frequency Transaction Data. SSRN Electron. J. 2020, 111, 307–311. [Google Scholar] [CrossRef]
  5. Carlsson-Szlezak, P.; Reeves, M.; Swartz, P. What Coronavirus Could Mean for the Global Economy. Available online: https://hbr.org/2020/03/what-coronavirus-could-mean-for-the-global-economy (accessed on 1 December 2023).
  6. Brodeur, A.; Gray, D.; Islam, A.; Bhuiyan, S. A Literature Review of the Economics of COVID-19. J. Econ. Surv. 2021, 35, 1007–1044. [Google Scholar] [CrossRef] [PubMed]
  7. Dev, S.M. Addressing COVID-19 Impacts on Agriculture, Food Security, and Livelihoods in India. In COVID-19 and Global Food Security; International Food Policy Research Institute: Washington, DC, USA, 2020; p. 140. [Google Scholar]
  8. Widiawaty, M.A.; Lam, K.C.; Dede, M.; Asnawi, N.H. Spatial Differentiation and Determinants of COVID-19 in Indonesia. BMC Public Health 2022, 22, 1030. [Google Scholar] [CrossRef] [PubMed]
  9. Statistics Indonesia for the Special Region of Yogyakarta. Persentase Penduduk Miskin Menurut Kabupaten/Kota (Persen), 2021–2023; Statistics Indonesia for the Special Region of Yogyakarta: Yogyakarta, Indonesia, 2023.
  10. Statistics Indonesia for the Special Region of Yogyakarta. Jumlah Penduduk Miskin Menurut Kabupaten/Kota (Ribuan), 2021–2023; Statistics Indonesia for the Special Region of Yogyakarta: Yogyakarta, Indonesia, 2023.
  11. Statistics Indonesia. Profil Kemiskinan Di Indonesia September 2021; Statistics Indonesia: Jakarta, Indonesia, 2022.
  12. Statistics Indonesia for East Java Province. Persentase Penduduk Miskin Menurut Kabupaten/Kota Di Jawa Timur (Persen), 2021–2023; Statistics Indonesia for East Java Province: East Java, Indonesia, 2023.
  13. Statistics Indonesia for East Java Province. Jumlah Penduduk Miskin Menurut Kabupaten/Kota Di Jawa Timur (Ribu Jiwa), 2021–2023; Statistics Indonesia for East Java Province: East Java, Indonesia, 2023.
  14. Hasanah, E.N.N.; Rahayu, L.; Wijaya, O. Impact of COVID-19 on Household Food Security of Red Rice Farmers Dry Land in Gunungkidul Regency. In Proceedings of the E3S Web of Conferences, Yogyakarta, Indonesia, 25–26 August 2021; Volume 316, pp. 1–17. [Google Scholar]
  15. Utomo, M.M.B.; Sudomo, A.; Pieter, L.A.G.; Maharani, D.; Swestiani, D.; Siagian, C.M.; Fambayun, R.A.; Perdana, A.; Roshetko, J.M. COVID-19 Pandemic: Impacts, Craftsmen’s Living Strategies, and Economic Recovery of Bamboo Handicraft Enterprise in Gunungkidul, Indonesia. For. Soc. 2022, 6, 620–638. [Google Scholar] [CrossRef]
  16. Hafizha, A.A.; Fadhilah, H.; Yanwari, I.; Prameswara, D.; Azziyad, N.F.; Widiastutie, S. Post-Pandemic Society: Case Study of Gunungkidul Regency in Digital Tourism Transformation. Randwick Int. Soc. Sci. J. 2023, 4, 594–606. [Google Scholar] [CrossRef]
  17. Sholiha, M.; Jannah, Q.; Vina Helyatus, S.; Irwina, Y.; Hadik Nufanto, M.S.; Kurniawan, A. Dampak COVID-19 terhadap Pedagang di Pasar Desa Tajungan Kecamatan Kamal. In Proceedings of the Seminar Nasional Sosial, Ekonomi, Pendidikan, Penelitian, Pengabdian, dan Kesehatan, Grobogan, Indonesia, 27 September 2021; Volume 1, pp. 36–43. [Google Scholar]
  18. Robbi, I. Dampak COVID-19 terhadap Pengeluaran Konsumsi Rumah Tangga di Jawa Timur (Studi Kasus 38 Kabupaten/Kota). Cendekia Niaga J. Trade Dev. Stud. 2022, 6, 101–109. [Google Scholar] [CrossRef]
  19. Karim, A.; Utomo, S.J. Dampak Pandemi COVID-19 terhadap Pelaku Usaha (Studi Kasus Sepanjang Jalan Raya Telang Kecamatan Kamal Kabupaten Bangkalan). Neo-Bis 2023, 12, 67–75. [Google Scholar]
  20. International Committee of the Red Cross What Is Economic Security? Available online: https://www.icrc.org/en/document/introduction-economic-security (accessed on 6 February 2024).
  21. Mollenkamp, D.T. Economic Security: Meaning, History in the US, FAQs. Available online: https://www.investopedia.com/economic-security-5213404 (accessed on 6 February 2024).
  22. Gandhi, Y. Economic Security: Meaning, Importance and Types. Available online: https://www.analyticssteps.com/blogs/economic-security-meaning-importance-and-types (accessed on 8 February 2024).
  23. Jiménez, M. What Triggers Economic Insecurity and Who Is Most at Risk? United Nations: New York, NY, USA, 2021. [Google Scholar]
  24. Nam, Y.; Huang, J.; Sherraden, M. Assets, Poverty, and Public Policy: Challenges in Definition and Measurement; Center for Social Development, Washington University in Saint Louis: St. Louis, MO, USA, 2008. [Google Scholar]
  25. Center on Budget and Policy Priorities. The COVID-19 Economy’s Effects on Food, Housing, and Employment Hardships; Center on Budget and Policy Priorities: Washington, DC, USA, 2021. [Google Scholar]
  26. International Labour Organization (ILO) Country Office for Indonesia and Timor-Leste. Socioeconomic Impact of the COVID-19 Pandemic in Indonesia; International Labour Organization (ILO) Country Office for Indonesia and Timor-Leste: Jakarta, Indonesia, 2022; ISBN 9789220394304. [Google Scholar]
  27. UNICEF; UNDP; PROSPERA; The SMERU Research Institute. Socio-Economic Impact of COVID-19 on Households in Indonesia: Three Rounds of Monitoring Surveys; UNICEF: New York, NY, USA, 2022. [Google Scholar]
  28. Alam, M.M.; Fawzi, A.M.; Islam, M.M.; Said, J. Impacts of COVID-19 Pandemic on National Security Issues: Indonesia as a Case Study. Secur. J. 2022, 35, 1067–1086. [Google Scholar] [CrossRef]
  29. Kahkonen, S.; Pape, U.; Ali, R. Pathways towards Economic Security in Indonesia. Available online: https://blogs.worldbank.org/eastasiapacific/pathways-towards-economic-security-indonesia (accessed on 7 February 2024).
  30. Rozaki, Z. Food Security Challenges and Opportunities in Indonesia Post COVID-19. In Advances in Food Security and Sustainability; Elsevier: Amsterdam, The Netherlands, 2021; pp. 119–168. [Google Scholar]
  31. The White House. G7 Leaders’ Statement on Economic Resilience and Economic Security; The White House: Hiroshima, Japan, 2023. [Google Scholar]
  32. Hallegatte, S. Economic Resilience: Definition and Measurement; The Office of the Chief Economist, Climate Change Group, The World Bank: Washington, DC, USA, 2014. [Google Scholar]
  33. U.S. Economic Development Administration. Comprehensive Economic Development Strategy (CEDS) Content Guidelines: Recommendations for Creating an Impactful CEDS; U.S. Economic Development Administration: Washington, DC, USA, 2023.
  34. Nussbaum, C.; Mason, C. COVID-19 Pandemic Is a Natural Disaster for Purpose of a Contractual Force Majeure Provision, Says Southern District of New York. Available online: https://www.nixonpeabody.com/insights/alerts/2020/12/21/covid19-pandemic-is-a-natural-disaster (accessed on 8 February 2024).
  35. Nurzaman, A.; Shaw, R.; Roychansyah, M.S. Measuring Community Resilience against Coastal Hazards: Case Study in Baron Beach, Gunungkidul Regency. Prog. Disaster Sci. 2020, 5, 100067. [Google Scholar] [CrossRef]
  36. Christanti, R.; Manik, H.F.G.G.; Ariestanti, C.A. Advocating Community Economic Resilience Framework in Kemadang Food Barn, Gunungkidul, Yogyakarta: Accentuating the Social Capital Perspective. J. Pengabdi. Kpd. Masy. (Indones. J. Community Engag.) 2023, 9, 117–125. [Google Scholar] [CrossRef]
  37. Suryandari, A.; Rahayuningsih, E.S. Strategi Bertahan Hidup Ekonomi Rumah Tangga Petani Padi (Studi Kasus di Desa Tonjung Kecamatan Burneh Kabupaten Bangkalan). Pamat. J. 2020, 13, 176–182. [Google Scholar] [CrossRef]
  38. Nurlianti, N.; Qhodriyah, L. The Effect of Financial Literacy and Financial Inclusion on the Performance of MSMEs in Bangkalan District. In Proceedings of the Proceeding International Conference on Economic Business Management, and Accounting (ICOEMA), Surabaya, Indonesia, 8 August 2022; pp. 864–881. [Google Scholar]
  39. Hanifah, L.; Kholifah, S.K. Pemberdayaan Perempuan dalam Menghadapi Dampak Pandemi COVID-19 melalui Pelatihan Pengelolaan Keuangan Keluarga di Desa Langkap Kecamatan Burneh Kabupaten Bangkalan. J. Abdidas 2020, 1, 777–783. [Google Scholar] [CrossRef]
  40. Statistics Indonesia. Hasil Pencacahan Survei Pendapatan Rumah Tangga Usaha Pertanian ST2013; Statistics Indonesia: Jakarta, Indonesia, 2014.
  41. Putra, R.A.A.; Ovsiannikov, K.; Kotani, K. COVID-19-Associated Income Loss and Job Loss: Evidence from Indonesia. J. Asian Econ. 2020, 87, 101631. [Google Scholar] [CrossRef]
  42. Kochhar, R.; Moslimani, M. Wealth Surged in the Pandemic, but Debt Endures for Poorer Black and Hispanic Families; Pew Research Center: Washington, DC, USA, 2023. [Google Scholar]
  43. OECD Household Financial Assets (Indicator). Available online: https://data.oecd.org/hha/household-financial-assets.htm (accessed on 6 February 2024).
  44. US Agency for International Development’s Center for Resilience Economic Resilience. Available online: https://www.resiliencelinks.org/building-resilience/economic-resilience (accessed on 8 February 2024).
  45. Rhone, A.; Ver Ploeg, M. U.S. Shoppers’ Access to Multiple Food Stores Varies by Region. Available online: https://www.ers.usda.gov/amber-waves/2019/june/us-shoppers-access-to-multiple-food-stores-varies-by-region/ (accessed on 8 February 2024).
  46. Kagan, J. Social Welfare System. Available online: https://www.investopedia.com/terms/s/social-welfare-system.asp (accessed on 10 February 2024).
  47. UNICEF Indonesia 85 per Cent of Families in Indonesia Received Support on COVID-19 But More Efforts Are Needed to Reach the Poorest-UN Report. Available online: https://www.unicef.org/indonesia/press-releases/85-cent-families-indonesia-received-support-covid-19-more-efforts-are-needed-reach (accessed on 10 February 2024).
  48. The Investopedia Team Credit: What It Is and How It Works. Available online: https://www.investopedia.com/terms/c/credit.asp (accessed on 12 February 2024).
  49. Dynan, K.E. Changing Household Financial Opportunities and Economic Security. J. Econ. Perspect. 2009, 23, 49–68. [Google Scholar] [CrossRef]
  50. Nopiyani, P.E.; Sanjaya, N.M.W.S.; Kartika, R.D. The Effect Credit Restructuring Relaxation on Financial Performance in LPD Buleleng Regency During the Pandemic of COVID-19. Int. J. Soc. Sci. Bus. 2021, 5, 475–480. [Google Scholar] [CrossRef]
  51. Gibson, M. Food Security—A Commentary: What Is It and Why Is It so Complicated? Foods 2012, 1, 18–27. [Google Scholar] [CrossRef]
  52. Food and Agriculture Organization of the United Nations. The Rome Declaration on World Food Security; Food and Agriculture Organization of the United Nations: Rome, Italy, 1996. [Google Scholar]
  53. FAO’s Agriculture and Development Economics Division. Food Security; FAO’s Agriculture and Development Economics Division: Rome, Italy, 2006. [Google Scholar]
  54. The World Bank What Is Food Security? Available online: https://www.worldbank.org/en/topic/agriculture/brief/food-security-update/what-is-food-security (accessed on 11 February 2024).
  55. Guiné, R.d.P.F.; Pato, M.L.d.J.; da Costa, C.A.; da Costa, D.d.V.T.A.; da Silva, P.B.C.; Martinho, V.J.P.D. Food Security and Sustainability: Discussing the Four Pillars to Encompass Other Dimensions. Foods 2021, 10, 2732. [Google Scholar] [CrossRef]
  56. Committee of World Food Security. Global Strategic Framework for Food Security & Nutrition (GSF); Committee on World Food Security: Rome, Italy, 2014. [Google Scholar]
  57. Ashby, S.; Kleve, S.; McKechnie, R.; Palermo, C. Measurement of the Dimensions of Food Insecurity in Developed Countries: A Systematic Literature Review. Public Health Nutr. 2016, 19, 2887–2896. [Google Scholar] [CrossRef]
  58. Fisher, M.R. Food Security. In Environmental Biology; Open Oregon Educational Resources: OR, USA, 2017; ISBN 978-1-63635-036-3. Available online: https://openoregon.pressbooks.pub/envirobiology/chapter/8-1-food-security/ (accessed on 6 February 2024).
  59. Carletto, C.; Zezza, A.; Banerjee, R. Towards Better Measurement of Household Food Security: Harmonizing Indicators and the Role of Household Surveys. Glob. Food Sec. 2013, 2, 30–40. [Google Scholar] [CrossRef]
  60. Rahmansyah, Z.; Senjawati, N.D.; Juarini, J. Analisis Ketahanan Pangan Rumah Tangga Miskin Berdasarkan Pangsa Pengeluaran Pangan Dan Konsumsi Energi Di Desa Girirejo Kecamatan Imogirika Kabupaten Bantul. J. Din. Sos. Ekon. 2020, 21, 68–78. [Google Scholar] [CrossRef]
  61. Tufts University Data4Diets: Building Blocks for Diet-Related Food Security Analysis, Version 2.0. Available online: https://inddex.nutrition.tufts.edu/data4diets/indicator/household-food-expenditure-share (accessed on 10 February 2024).
  62. FAO; IFAD; UNICEF; WFP; WHO. In Brief to the State of Food Security and Nutrition in the World 2021; FAO: Rome, Italy, 2021.
  63. Drewnowski, A. Food Insecurity Has Economic Root Causes. Available online: https://www.nature.com/articles/s43016-022-00577-w (accessed on 12 February 2024).
  64. Ruhyana, N.F.; Essa, W.Y.; Mardianis, M. Sociodemographic Factors Affecting Household Food Security in Sumedang Regency West Java Province. Agraris 2020, 6, 38–51. [Google Scholar] [CrossRef]
  65. Alfani, F.; Dabalen, A.; Fisker, P.; Molini, V. Can We Measure Resilience? A Proposed Method and Evidence from Countries in the Sahel; Poverty Global Practice Group, The World Bank: Washington, DC, USA, 2015. [Google Scholar]
  66. Alinovi, L.; D’Errico, M.; Mane, E.; Romano, D. Livelihoods Strategies and Household Resilience to Food Insecurity: An Empirical Analysis to Kenya; The European Report on Development: Dakar, Senegal, 2010. [Google Scholar]
  67. D’Errico, M.; Grazioli, F.; Pietrelli, R. Cross-Country Evidence of the Relationship Between Resilience and the Subjective Perception of Well-Being and Social Inclusion: Evidence from the Regions of Matam (Senegal) and the Triangle of Hope (Mauritania). J. Int. Dev. 2017, 30, 1339–1368. [Google Scholar] [CrossRef]
  68. Ciani, F.; Romano, D. Testing for Household Resilience to Food Insecurity: Evidence from Nicaragua; Department of Economics and Management Federico, University of Florence: Florence, Italy, 2013. [Google Scholar]
  69. ’Azhima, M.F.; Deniar, S.M.; Nugraha, T.C.; Salahudin, S. Six Pillars of Global Food Security in Indonesia: A Systemic Literature Review. Sosiohumaniora J. Ilmu-Ilmu Sos. Dan Hum. 2023, 25, 419–429. [Google Scholar] [CrossRef]
  70. Bryman, A. Social Research Methods, 2nd ed.; Oxford University Press Inc.: New York, NY, USA, 2004. [Google Scholar]
  71. Sugiyono, P. Metode Penelitian Kuantitatif; Alfabeta: Bandung, Indonesia, 2018. [Google Scholar]
  72. Prasmono, A.S.P.; Ahdika, A. Analisis Regresi Berganda pada Faktor-Faktor yang Mempengaruhi Kinerja Fisik Preservasi Jalan dan Jembatan di Provinsi Sumatera Selatan. Emerg. Stat. Data Sci. J. 2022, 1, 47–56. [Google Scholar] [CrossRef]
  73. Statistics Indonesia for Gunungkidul District. Kabupaten Gunungkidul Dalam Angka 2021; Statistics Indonesia for Gunungkidul District: Gunungkidul, Indonesia, 2021. [Google Scholar]
  74. Statistics Indonesia for Bangkalan District. Kabupaten Bangkalan Dalam Angka 2021; Statistics Indonesia for Bangkalan District: Bangkalan, Indonesia, 2021.
  75. Kurniati, D. Perilaku Petani terhadap Risiko Usahatani Kedelai di Kecamatan Jawai Selatan Kabupaten Sambas. J. Soc. Econ. Agric. 2015, 4, 32–36. [Google Scholar]
  76. Barokah, U.; Rahayu, W.; Antriyandarti, E. The Role of Urban Farming to Household Food Security in the Surakarta City, Indonesia. Agrisocionomics J. Sos. Ekon. Dan Kebijak. Pertan. 2023, 7, 526–538. [Google Scholar] [CrossRef]
  77. Mokoena, O.P.; Ntuli, T.S.; Ramarumo, T.; Seeletse, S.M. Sustainability of Rural Small-Scale Farmers Using a Thematic Content-Fed Analytic Hierarchy Process. Sustainability 2023, 15, 11983. [Google Scholar] [CrossRef]
  78. Guo, M.; Xie, M.; Xu, G. Sustainable Livelihood Evaluation and Influencing Factors of Rural Households: A Case Study of Beijing Ecological Conservation Areas. Sustainability 2023, 15, 10743. [Google Scholar] [CrossRef]
  79. Ilham, N.; Sinaga, B.M. Penggunaan Pangsa Pengeluaran Pangan Sebagai Indikator Komposit Ketahanan Pangan. SOCA (Socio-Econ. Agric. Agribus.) 2007, 7, 44060. [Google Scholar]
  80. Maxwell, D.; Levin, C.; Armar-Klemesu, M.; Ruel, M.; Morris, S.; Ahiadeke, C. Urban Livelihoods and Food and Nutrition Security in Greater Accra, Ghana; The International Food Policy Research Institute: Washington, DC, USA, 2000. [Google Scholar]
  81. Anzaini, B.K.; Gantini, T.; Srimenganti, N. Analisis Ketahanan Pangan berdasarkan Proporsi Pengeluaran dan Konsumsi Energi (Suatu Kasus pada Rumah Tangga Petani Buruh di Desa Gunungmanik Kecamatan Tanjungsari Kabupaten Sumedang). OrchidAgri 2022, 2, 76–85. [Google Scholar] [CrossRef]
  82. Briguglio, L.; Cordina, G.; Bugeja, S.; Farrugia, N. Conceptualizing and Measuring Economic Resilience. In Building the Economic Resilience of Small States; Formatek Ltd.: London, UK, 2006. [Google Scholar]
  83. Bryant, W.K. Understanding Information System, Foundations for Control; Pretince-Hall of India: New Delhi, India, 1990. [Google Scholar]
  84. Iskandar, H.; Sumarwan, U.; Khomsan, A. Faktor-Faktor Yang Mempengaruhi Kesejahteraan Keluarga. Info Kesehat. Masy. 2006, 10, 133–141. [Google Scholar]
  85. Pan, D.; Yang, J.; Zhou, G.; Kong, F. The Influence of COVID-19 on Agricultural Economy and Emergency Mitigation Measures in China: A Text Mining Analysis. PLoS ONE 2020, 15, e0241167. [Google Scholar] [CrossRef]
  86. Sunarti, E. Ketahanan Keluarga Indonesia: Dari Kebijakan dan Penelitian Menuju Tindakan; PT Penerbit IPB Press: Bogor, Indonesia, 2015. [Google Scholar]
  87. Chin, W.W. The Partial Least Squares Approach to Structural Formula Modeling. Adv. Hosp. Leis. 1998, 8, 5. [Google Scholar]
  88. Undang-Undang Republik Indonesia Nomor 18; Badan Pembinaan Hukum Nasional: Jakarta, Indoenesia, 2012.
  89. Saliem, H.P.; Agustian, A.; Perdana, R.P. Dinamika Harga, Permintaan, dan Upaya Pemenuhan Pangan Pokok pada Era Pandemi COVID-19. In Dampak Pandemi COVID 19 Perspektif Adaptasi dan Resiliensi Sosial Ekonomi Pertanian; IAARD PRESS: Jakarta, Indonesia, 2021; ISBN 978-602-344-297-3. [Google Scholar]
  90. Kansiime, M.K.; Tambo, J.A.; Mugambi, I.; Bundi, M.; Kara, A.; Owuor, C. COVID-19 Implications on Household Income and Food Security in Kenya and Uganda: Findings from a Rapid Assessment. World Dev. 2021, 137, 105199. [Google Scholar] [CrossRef]
  91. Zhao, H.; Yao, X.; Liu, Z.; Yang, Q. Impact of Pricing and Product Information on Consumer Buying Behavior with Customer Satisfaction in a Mediating Role. Front. Psychol. 2021, 12, 720151. [Google Scholar] [CrossRef]
  92. Kuntjoro, S.U. Income Elasticity from Indonesian Population Rice Demand. Agro Econ. J. 2016, 1, 75–102. [Google Scholar]
  93. Devi, L.Y.; Purnomosidi, R.Y.K.H. Estimation of Demand Elasticity for Food Commodities in Java Island. Jejak 2019, 12, 54–67. [Google Scholar] [CrossRef]
  94. Hafizah, D.; Hakim, D.B.; Harianto, H.; Nurmalina, R. The Role of Rice’s Price in the Household Consumption in Indonesia. Agriekonomika 2020, 9, 38–47. [Google Scholar] [CrossRef]
  95. Lele, U.; Masters, W.A.; Kinabo, J.; Meenakshi, J.V.; Ramaswami, B.; Tagwireyi, J.; Bell, W.F.L.; Goswami, S. Measuring Food and Nutrition Security: An Independent Technical Assessment and User’s Guide for Existing Indicators Rural Economic Transformation View Project SUNRAY Project View Project Uma Lele Independent Researcher. Available online: https://sites.tufts.edu/willmasters/files/2016/06/FSIN-TWG_UsersGuide_12June2016.pdf (accessed on 6 February 2024).
  96. Kalaba, Y.; Wildani Pingkan, S.H.; Erny, E.; Damayanti, L.; Akrab, A.; Yusuf, R.; Nurdin, M.F.; Walalangi, J.Y. Analysis of Household Food Security Based on the Share of Food Expenditure in Central Sulawesi Indonesia. IOP Conf. Ser. Earth Environ. Sci. 2022, 1107, 012090. [Google Scholar] [CrossRef]
  97. Harcourt, W. Sustainable Livelihoods. In The Wiley Blackwell Encyclopedia of Gender and Sexuality Studies; Naples, N.A., Hoogland, R.C., Wickramasinghe, M., Wong, W.C.A., Eds.; Wiley-Blackwell: Malden, MA, USA, 2016; ISBN 978-1-405-19694-9. [Google Scholar]
  98. Biggs, E.M.; Bruce, E.; Boruff, B.; Duncan, J.M.A.; Horsley, J.; Pauli, N.; McNeill, K.; Neef, A.; Van Ogtrop, F.; Curnow, J.; et al. Sustainable Development and the Water-Energy-Food Nexus: A Perspective on Livelihoods. Environ. Sci. Policy 2015, 54, 389–397. [Google Scholar] [CrossRef]
  99. Störmer, N.; Weaver, L.C.; Stuart-Hill, G.; Diggle, R.W.; Naidoo, R. Investigating the Effects of Community-Based Conservation on Attitudes towards Wildlife in Namibia. Biol. Conserv. 2019, 233, 193–200. [Google Scholar] [CrossRef]
  100. Widodo, S. Strategi Nafkah Berkelanjutan bagi Rumah Tangga Miskin di Daerah Pesisir. Makara Hum. Behav. Stud. Asia 2011, 15, 10–20. [Google Scholar] [CrossRef]
  101. Michalos, A.C. Encyclopedia of Quality of Life and Well-Being Research; Springer: Dordrecht, The Netherlands, 2014; ISBN 978-94-007-0753-5. [Google Scholar]
  102. Azizah, S.N.; Salam, A.N. Working Mother and Family Economy Resilience in the COVID-19 Era: Evidence from Indonesia. J. Ilmu Kel. Dan Konsum. 2021, 14, 203–215. [Google Scholar] [CrossRef]
  103. Amalia, L.; Samputra, P.L. Strategy of Economic Resilience of Poor Families Who Receive Social Assistance Funds in Tanah Tinggi Central Jakarta. J. Sosio Konsepsia 2020, 9, 113–131. [Google Scholar] [CrossRef]
  104. Ningsih, D.S.; Herawati, T.; Sunarti, E. Pengaruh Tekanan Ekonomi, Dukungan Sosial, dan Strategi Koping terhadap Ketahanan Keluarga Pekerja Informal di Pekanbaru pada saat Pandemi COVID-19. J. Ilmu Sos. Dan Hum. 2023, 12, 156–167. [Google Scholar] [CrossRef]
  105. Sabar, W.; Rahim, A.; Bato, A.R. The Role of Women’s Agricultural Workers and Household Economic Resilience. J. Ilmu Sos. Dan Hum. 2023, 12, 52–59. [Google Scholar] [CrossRef]
  106. Sutedi, A. Metode Penelitian Hukum; Sinar Grafika: Jakarta, Indonesia, 2009. [Google Scholar]
  107. Alliance for Child Protection in Humanitarian Action. Household Resiliency Index; Alliance for Child Protection in Humanitarian Action: New York, NY, USA, 2016. [Google Scholar]
  108. Guo, B. Household Assets and Food Security: Evidence from the Survey of Program Dynamics. J. Fam. Econ. Issues 2011, 32, 98–110. [Google Scholar] [CrossRef]
  109. Rochmadi, I. Analisis Ketahanan Ekonomi Keluarga Paska Pembangunan Pasar Ekologis Argowijil. Paradig. J. Ilmu Adm. 2022, 11, 1–12. [Google Scholar]
  110. Meidiana, N.P.C.; Marhaeni, A.A.I. Effect of Asset Ownership, Availability of Infrastructure, and Education on Income and Well-Being of Poor Households. Bul. Stud. Ekon. 2019, 24, 54–69. [Google Scholar] [CrossRef]
  111. Ferawati, F.; Saadah, S.; Amrullah, A.A. Consumer Decision Making on Rice Purchasing in Makassar City. J. Sos. Ekon. Pertan. 2019, 15, 1–16. [Google Scholar] [CrossRef]
  112. Emran, M.S.; Hou, Z. Access to Markets and Rural Poverty: Evidence from Household Consumption in China. Rev. Econ. Stat. 2013, 95, 682–697. [Google Scholar] [CrossRef]
  113. Stifel, D.; Minten, B.; Dorosh, P. Transactions Costs and Agricultural Productivity: Implications of Isolation for Rural Poverty in Madagascar. MSSD Discuss. Pap. 2003, 56, 1–72. [Google Scholar] [CrossRef]
  114. Rapsomanikis, G. The Economic Lives of Smallholder Farmers; Food and Agriculture Organization of the United Nations: Rome, Italy, 2015. [Google Scholar]
  115. Bulele, E.Y. Influences Analysis of Stores Image, Services Quality and of Product Availability to Purchase Decision in Gramedia Bookstore, Manado. J. Berk. Ilm. Efisiensi 2016, 16, 258–269. [Google Scholar]
  116. Emiri, D. Analisis Pengaruh Citra Merek, Ketersediaan Produk, Harga, dan Coverage terhadap Brand Switching (Studi Kasus pada Pengguna SimCard Simpati di Kota Semarang). J. Sains Pemasar. Indones. 2011, 10, 145–169. [Google Scholar]
  117. Ovezmyradov, B. Product Availability and Stockpiling in Times of Pandemic: Causes of Supply Chain Disruptions and Preventive Measures in Retailing. Ann. Oper. Res. 2022. ahead of print. [Google Scholar] [CrossRef]
  118. Jatmiko, A.R.; Mulyanto, A.; Rohman, M.F.; Susanti, H.; Nurhayati, W. Kontribusi Bantuan Tunai Langsung Dana Desa (BLT-DD) bagi Masyarakat Miskin Terkena Dampak COVID-19 di Desa Karang Pao di Kecamatan Arosbaya Kabupaten Bangkalan. J. EBA 2022, 9, 17–33. [Google Scholar]
  119. Riyanto, K.A.; Ananda, C.F. Analisis Dampak Kebijakan Program Keluarga Harapan Terhadap Konsumsi. J. Dev. Econ. Soc. Stud. 2022, 1, 650–667. [Google Scholar]
  120. Muharir, M. Pengaruh Bantuan Program Keluarga Harapan (PKH) dan Bantuan Pangan Non-Tunai (BPNT) terhadap Tingkat Kesejahteraan Mayarakat (Studi pada Kelompok Penerima Manfaat (KPM) di Desa Tirta Makmur Kecamatan Air Kumbang). Ekon. Sharia 2022, 8, 145–174. [Google Scholar]
  121. Wagle, U. The Role of Remittances in Determining Economic Security and Poverty in Myanmar. Eur. J. Dev. Res. 2016, 28, 536–554. [Google Scholar] [CrossRef]
  122. Preston, S.D.; Prochaska-Cue, K. Credit Advantages, Disadvantages and Common Types. Lincoln Ext. Inst. Agric. Nat. Resour. 2007, 1, G1802. [Google Scholar]
  123. Hossain, M.A.; Malek, M.A.; Yu, Z. Impact of Rural Credit on Household Welfare: Evidence from a Long-Term Panel in Bangladesh. Asian Dev. Rev. 2023, 40, 363–397. [Google Scholar] [CrossRef]
  124. Sipahutar, M.A.; Oktaviani, R.; Siregar, H.; Juanda, B. Effects of Credit on Economic Growth, Unemployment and Poverty. J. Ekon. Pembang. Kaji. Masal. Ekon. Dan Pembang. 2016, 17, 37–49. [Google Scholar] [CrossRef]
Figure 1. Research Location Map.
Sustainability 16 02091 g001
Table 1. Household characteristics.
No.CharacteristicsAverage
Gunungkidul Dist.Bangkalan Dist.
1.Age (years)
  • Husband
4952
b.
Wife
4450
2.Length of education (years)
  • Husband
88
b.
Wife
97
3.Number of family members33
Source: Primary Data Analyzed, 2021.
Table 2. Farming revenues.
DescriptionDetailGunungkidul Dist.Bangkalan Dist.
Revenues (IDR)%Revenues (IDR)%
CropRice PS 11,002,69226.115,847,84658.98
Rice PS 200.003,819,61538.52
Corn 433,00011.28155,8171.57
Peanuts1,937,10050.4492,3080.93
Cassava467,52212.1700.00
Amount3,840,31318.569,915,58786.43
LivestockCattle13,925,00082.651,430,76991.87
Goat2,702,66716.0400.00
Chicken204,8341.2263,4624.07
Others16,6670.1063,1734.06
Amount16,849,16781.441,557,40413.57
Total20,689,480 11,472,990
Note: USD 1 = IDR 14,308 (exchange rate during the study period). Source: Primary Data Analyzed, 2021.
Table 3. Farming costs.
CostsGunungkidul Dist.Bangkalan Dist.
Amount (IDR)%Amount (IDR)%
Rice PS 11,164,4178.602,210,28841.91
Rice PS 200.001,500,28828.45
Corn 131,8000.97104,8081.99
Peanuts636,3004.7067,3081.28
Cassava80,3330.5900.00
Cattle9,876,66772.981,346,15425.53
Goat1,558,33311.5200.00
Chicken75,1670.5617,6920.34
Others10,0000.0726,9230.51
Total13,533,017100.005,273,462100.00
Note: USD 1 = IDR 14,308 (exchange rate during the study period). Source: Primary Data Analyzed, 2021.
Table 4. Farming income.
IncomeGunungkidul Dist.Bangkalan Dist.
Amount (IDR)%Amount (IDR)%
Rice PS 1−161,725−2.333,632,17354.46
Rice PS 200.002,319,32734.78
Corn 301,2004.3451,0100.76
Peanuts1,300,80018.7625,0000.37
Cassava387,1885.5800.00
Cattle3,827,50055.19532,6927.99
Goat1,144,33316.5026,9230.40
Chicken129,6671.8745,7690.69
Others66670.1036,2500.54
Yearly income6,935,630100.006,669,144100.00
Monthly income577,969 555,762
Note: USD 1 = IDR 14,308 (exchange rate during the study period). Source: Primary Data Analyzed, 2021.
Table 5. Composition of harvest allocations.
CommodityGunungkidul Dist.Bangkalan Dist.
TotalTo ConsumeTo SellTotalTo ConsumeTo Sell
Rice PS 1Amount (kg)299.38190.78108.60845.38257.69585.77
%100.0063.7336.27100.0030.4869.29
Rice PS 2Amount (kg)0.000.000.00603.85114.23489.62
%0.000.000.00100.0018.9281.08
Maize Amount (kg)143.571.47142.107.790.195.71
%100.001.0298.98100.002.4773.33
PeanutsAmount (kg)197.512.98194.530.620.000.62
%100.001.5198.49100.000.00100.00
CassavaAmount (kg)275.653.50272.150.000.000.00
%100.001.2798.730.000.000.00
CattleAmount (unit)0.730.000.730.130.000.13
%100.000.00100.00100.000.00100.00
GoatAmount (unit)1.530.001.530.000.000.00
%100.000.00100.000.000.000.00
ChickenAmount (unit)3.580.003.581.570.780.78
%100.000.00100.00100.0050.0050.00
OthersAmount0.170.000.172.371.730.63
%100.000.00100.00100.0073.1726.83
Source: Primary Data Analyzed, 2021.
Table 6. Total household expenditure.
No.Expenditure TypeGunungkidul Dist.Bangkalan Dist.
Average (IDR)%Average (IDR)%
1.Food1,064,617.5058.401,361,517.8865.00
2.Non-food758,360.6841.60732,965.1235.00
Total1,822,978.18100.002,094,483.00100.00
Note: USD 1 = IDR 14,308 (exchange rate during the study period). Source: Primary Data Analyzed, 2021.
Table 7. Household food expenditure.
No.Food TypeGunungkidul Dist.Bangkalan Dist.
Average (IDR)%Average (IDR)%
1.Cereals282,683.3326.55207,692.3115.25
2.Tubers8021.670.759394.230.69
3.Seafood54,283.335.10261,038.4619.17
4.Meat 60,745.835.71125,615.389.23
5.Milk and egg58,933.335.5477,923.085.72
6.Veggies59,358.335.5854,803.854.03
7.Nuts88,433.338.31125,195.199.20
8.Fruits19,900.001.8732,103.852.36
9.Oil and fat81,733.337.6851,500.003.78
10.Beverages56,758.335.3353,778.853.95
11.Spices76,300.007.1786,530.386.36
12.Additional consumption 51,733.334.8652,288.463.84
13.Processed food and drink26,083.332.4515,634.621.15
14.Tobacco139,650.0013.12208,019.2315.28
Total1,064,617.50100.001,361,517.88100.00
Note: USD 1 = IDR 14,308 (exchange rate during the study period). Source: Primary Data Analyzed, 2021.
Table 8. Household non-food expenditure.
No.Expenditure TypeGunungkidul Dist.Bangkalan Dist.
Average (IDR)%Average (IDR)%
1.Housing area192,683.3325.41161,490.3822.03
2.Goods and services273,680.5536.09184,937.5025.23
3.Cost of education103,222.1013.61308,312.8242.06
4.Health costs21,894.432.8911,458.331.56
5.Clothing18,623.632.4648,493.646.62
6.Durable goods472.230.0612,679.491.73
7.Taxes and insurance12,481.701.651346.150.18
8.Social needs135,302.7017.844246.790.58
Total758,360.68100.00732,965.12100.00
Note: USD 1 = IDR 14,308 (exchange rate during the study period). Source: Primary Data Analyzed, 2021.
Table 9. Household income and revenues.
DescriptionDetailGunungkidul Dist.Bangkalan Dist.
Amount (IDR)%Amount (IDR)%
Income
(monthly)
Farming577,96930.22555,76214.47
Non-farming1,025,16753.612,896,15475.41
Remittance309,16716.17388,46210.12
Amount1,912,303100.003,840,377100.00
Revenues (monthly)Food1,064,61858.401,361,51865.00
Non-food758,36141.60732,96535.00
Amount1,822,97895.332,094,48354.54
Income—Revenues (Savings)89,3244.671,745,89445.46
Note: USD 1 = IDR 14,308 (exchange rate during the study period). Source: Primary Data Analyzed, 2021.
Table 10. Household economic resilience.
CriteriaGunungkidul Dist.Bangkalan Dist.
Amount (Unit)%Amount (Unit)%
Resilient2846.673261.54
Non-resilient3253.332038.46
Total60100.0052100.00
Source: Primary Data Analyzed, 2021.
Table 11. Household assets.
No.Asset TypeGunungkidul Dist.Bangkalan Dist.
Average (IDR)%Average (IDR)%
1.House168,500,000.0048.00162,980,769.2335.47
2.Land147,333,333.3341.97263,153,846.1557.28
3.Stall1,476,666.670.421,346,153.850.29
4.Vehicle8,802,500.002.5112,613,461.542.75
5.Livestock15,068,333.334.296,376,923.081.39
6.Farming tools and machinery2,252,500.000.64634,615.380.14
7.Jewelry714,541.670.203,064,423.080.67
8.Savings3,656,666.671.04807,692.310.18
9.Electronic appliances3,160,416.670.906,122,115.381.33
10.Furniture70,833.330.021,798,076.920.39
11.Others0.000.00557,692.310.12
Total351,035,791.67100.00459,455,769.23100.00
Note: USD 1 = IDR 14,308 (exchange rate during the study period). Source: Primary Data Analyzed, 2021.
Table 12. Household accessibility to economic facilities.
DescriptionDetailGunungkidul Dist.Bangkalan Dist.
Amount%Amount%
Distance>1 km 3050.0713.5
1 km2948.32344.2
<1 km 11.72242.3
Road condition Not good00.059.6
Quite good3253.31019.2
Good2236.73261.5
Very good610.059.6
Modes of transportationUnavailable3355.01121.2
Available2745.04178.8
Product availability in the marketLess equipped23.300.0
Quite equipped3355.01426.9
Equipped2338.33465.4
Very equipped23.347.7
Source: Primary Data Analyzed, 2021.
Table 13. Comparison of aid recipients before and after the pandemic.
AidGunungkidul Dist.Bangkalan Dist.
BeforeAfterBeforeAfter
Received29543732
Did not receive3161520
Amount60605252
Source: Primary Data Analyzed, 2021.
Table 14. Identify obtaining aid.
Aid TypeGunungkidul Dist.Bangkalan Dist.
Obtain AidDid Not Obtain AidObtain AidDid Not Obtain Aid
Amount%Amount%Amount%Amount%
BPNT58.35591.72344.22955.8
Fertilizer subsidy00.060100.01325.03975.0
BST2745.03355.0917.34382.7
PKH1525.04575.011.95198.1
Study quota subsidy915.05185.01426.93873.1
Electricity subsidy4066.72033.31936.53363.5
MSME assistance23.35896.700.052100.0
Others23.35896.723.85096.2
Source: Primary Data Analyzed, 2021.
Table 15. Description of aid received by the households.
DescriptionDetailGunungkidul Dist.Bangkalan Dist.
Amount%Amount%
Form of aidMoney3253.33771.2
Direct cash assistance (BLT)00.011.9
Rice1321.747.7
Village head00.01019.2
PKH1525.000.0
Level of usefulnessQuite useful00.026.7
Useful35.0620.0
Very useful5795.02273.3
The most useful typeMoney5490.03363.5
BLT, BST00.01019.2
Non-cash11.700.0
Groceries46.700.0
Electricity11.700.0
Fertilizer subsidy00.0815.4
Aid of farming tools and machinery00.011.9
Concern for neighborsDid not exist11.752100.0
Exists5998.300.0
Utilization of local potentialDid not exist60100.052100.0
Exists00.000.0
Source of aidRelatives612.8266.7
Neighbor817.0133.3
Bank2246.800.0
Dealer12.100.0
Youth organizations, neighborhood, or village institutions48.500.0
Cooperation612.800.0
Source: Primary Data Analyzed, 2021.
Table 16. Acceptance period based on type of aid.
Aid TypePeriodGunungkidul Dist.Bangkalan Dist.
Amount%Amount%
BPNTOne month5100.0417.4
Three months00.01982.6
Fertilizer subsidyTwelve months00.013100.0
BSTOne month1140.7333.3
Three months311.1666.7
Six months1348.100.0
PKHOne month1386.71100.0
Three months213.300.0
Study quota subsidyOne month9100.038100.0
Electricity subsidyOne month40100.01473.7
Three months00.015.3
Six months00.0421.1
MSME assistanceTwelve months2100.000.0
OthersTwelve months2100.02100.0
Source: Primary Data Analyzed, 2021.
Table 17. Aid provider category.
Aid TypeAid ProviderGunungkidul Dist.Bangkalan Dist.
Amount%Amount%
BPNTGovernment5100.000.0
Regent00.0939.1
Subdistrict00.014.3
Village head00.01356.5
Fertilizer subsidyGovernment00.01292.3
Farmers group00.017.7
BSTSocial services27100.000.0
Subdistrict00.0333.3
Village head00.0666.7
PKHSocial services15100.01100.0
Study quota subsidySocial services90.014100.0
Electricity subsidyGovernment00.01578.9
State Electricity Company (PLN)40100.0421.1
MSME assistanceGovernment2100.000.0
Regent00.000.0
OthersGovernment00.02100.0
Pre-employment150.000.0
Inhabitant150.000.0
Source: Primary Data Analyzed, 2021.
Table 18. Procedures for providing aid based on the type of aid.
Aid TypeGunungkidul Dist.Bangkalan Dist.
SimpleComplicatedSimpleComplicated
Amount%Amount%Amount%Amount%
BPNT 5100.000.023100.000.0
Fertilizer subsidy ----215.01184.6
BST 27100.000.09100.000.0
PKH 15100.000.01100.000.0
Study quota subsidy00.09100.014100.000.0
Electricity subsidy 00.040100.01894.715.3
MSME assistance 2100.000.0----
Others2100.000.02100.000.0
Source: Primary Data Analyzed, 2021.
Table 19. Comparison of debtors before and after the pandemic.
Credit LoanGunungkidul Dist.Bangkalan Dist.
BeforeAfterBeforeAfter
Received374733
Did not receive23134949
Amount60605252
Source: Primary Data Analyzed, 2021.
Table 20. Impact of pandemic and mitigation effort.
DescriptionDetailGunungkidul Dist.Bangkalan Dist.
Amount%Amount%
Pandemic effect
  • Not affected
711.71121.2
2.
Losing job
58.300.0
3.
Reduction of working hours
11.723.8
4.
Quiet trade
23.323.8
5.
Decrease in income
4575.03771.2
Total60100.052100.0
Mitigation effort
  • Do nothing
58.31223.1
2.
Reduce expenses
2440.02140.4
3.
Selling assets
813.3611.5
4.
Look for another job
1321.7917.3
5.
Open a new business
58.335.8
6.
Online business
58.311.9
Total60100.052100.0
Source: Primary Data Analyzed, 2021.
Table 21. Estimation result for factors of household economic resilience.
VariableCoefficientsStandard Error
Constant−0.804 ns0.691
Household income5.301 ***0.000
Household assets−8.019 ***0.000
Distance from house to market0.014 ns0.063
Product availability in the market0.274 *0.164
Aid0.106 ns0.250
Credit0.026 ns0.227
F value50.316 ***
R Square0.742
Note: *** and * indicate significance at the 1% and 10% levels, respectively. Meanwhile, ns means not significant. Source: Primary Data Analyzed, 2021.
Disclaimer/Publisher’s Note: The statements, opinions and data contained in all publications are solely those of the individual author(s) and contributor(s) and not of MDPI and/or the editor(s). MDPI and/or the editor(s) disclaim responsibility for any injury to people or property resulting from any ideas, methods, instructions or products referred to in the content.

