Article

Research on Pricing Strategy and Profit-Distribution Mechanism of Green and Low-Carbon Agricultural Products’ Traceability Supply Chain

1
Business School, Nanjing Xiaozhuang University, Nanjing 211171, China
2
Dean’s Office, Nanjing Xiaozhuang University, Nanjing 211171, China
*
Author to whom correspondence should be addressed.
Sustainability 2024, 16(5), 2087; https://doi.org/10.3390/su16052087
Submission received: 5 January 2024 / Revised: 15 February 2024 / Accepted: 23 February 2024 / Published: 2 March 2024
(This article belongs to the Special Issue Green Logistics and Sustainable Supply Chain Strategies)

Abstract

:
In agricultural production, chemical fertilizers and pesticides are being used in large quantities; the residues of these substances have some negative impact on the quality of agricultural products and soil, and they produce a large amount of carbon emissions. Green agricultural products are popular for their low carbon, quality, and safety, and they flow from the production side to consumers through a traceable supply chain. Therefore, ensuring the reliable and stable operation of the traceable supply chain for green, low-carbon agricultural products is an important issue. In view of the difficulty of obtaining information in previous coordination mechanisms in multi-person cooperative games, this article proposes an optimal pricing decision and constructs a profit-distribution model based on an improved Raiffa value to make the profit-distribution mechanism more conducive to the stability and sustainable development of the supply chain, and empirical analysis was carried out. The empirical analysis shows the following: (1) The centralized decision-making selling price of green and low-carbon agricultural products based on the quantitative cost–benefit analysis and demand function can realize the optimal profit of the supply chain. (2) Using the improved Raiffa value, considering the investment cost and risk to allocate the optimal profit of centralized decision-making, optimizes the profit distribution of supply chain members and overcomes the problem of the difficulty in acquiring information in multi-player cooperative games. (3) For investment costs and risks, the corresponding profit-distribution adjustment value weight vector can be obtained using the AHP; for risks that are difficult to quantify, the fuzzy comprehensive evaluation method and the risk-factor-based method can be used to determine the risk coefficient of each member of the supply chain. The optimized profit-distribution mechanism of supply chain members is more reasonable than decentralized decision-making, which has a significant reference for promoting the sustainable development of a traceable supply chain of green and low-carbon agricultural products.

1. Introduction

As a necessity in people’s lives, the quality and safety of agricultural products are related to the health of the masses. However, abuse of pesticides and hormones in agricultural production has occurred for a long time, which has brought threats to people’s health and the green and low-carbon sustainable development of the environment. In recent years, the Chinese government has paid increased attention to these factors. At present, sources of agricultural carbon emissions are diverse; one of them is the input of production materials such as fertilizers and pesticides in agricultural production activities and carbon emissions directly or indirectly generated by the energy consumption of agricultural production. Environmental regulations play an important role in promoting reductions in carbon emissions by giving full play to the supervision of society over polluting enterprises and the government and enhancing the government’s enforcement of regulations on polluting enterprises through the disclosure of environmental information [1,2]. In 2021, the Ministry of Agriculture and Rural Development said that agricultural and rural departments at all levels resolutely implement the “four most stringent” important instructions and the spirit of the important instructions on the problem of pesticide and veterinary drug residues exceeding the standard. In 2022, the State Administration of Market Supervision and Regulation, the National Health Council, and other regulatory authorities issued a series of policies to regulate the food industry, improving the system of the standards for quality and safety requirements for agricultural products and strengthening the supervision and management of agricultural product food safety.
The “14th Five-Year” National Agricultural Green Development Plan clearly states that, during the “14th Five-Year” period, China will build a green, low-carbon agricultural industry chain, promote the green, low-carbon, and circular development of agriculture, and expand the space for the green development of agriculture in the whole chain. China has launched a series of low-carbon policies to promote the promotion of green technology to steer the world’s largest manufacturing sector towards sustainable and more environmentally friendly development [3]. In addition to encouraging technological progress, guiding citizens’ green behavior is also an important way to reduce carbon emissions [4]. Recently, the Ministry of Agriculture and Rural Affairs and the National Development and Reform Commission issued an “agricultural rural emission reduction and carbon sequestration implementation plan” based on the effective supply of food and important agricultural products, the implementation of fertilizer reduction and efficiency, low-carbon emission reduction in livestock and poultry, the comprehensive utilization of straw, and ten other major actions, in order to reduce the intensity of greenhouse gas emissions in agriculture and to promote energy saving and efficient consumption in agricultural production. With people’s increasing attention to environmental issues, advocating low-carbon behavior in governments, enterprises, and residents plays an important role in reducing carbon emissions and improving environmental ecology [5,6]. Green low-carbon behavior is necessary in agricultural production, in processing, such as the refrigeration of cold storage, the waste of food processing, and even in trade, such as trade waste and transportation via electric vehicles. To effectively implement national policies and meet the needs of consumers for the quality and safety of agricultural products, agricultural products, including fresh fruit and vegetables and other food industry enterprises, are establishing a traceable supply chain system for green, low-carbon agricultural products, completing the information management of green low-carbon agricultural products from production and sales to distribution terminals, and do a good job in all aspects of traceability to ensure the quality and safety of agricultural products, in line with the national regulatory policy of strengthening the quality and safety of agricultural products, which is an important direction for the development of green low-carbon agricultural products’ enterprises.
As for the traceability supply chain system, it must be able to result in the whole supply chain system gaining a greater profit while being developed in a green and low-carbon way, and it must also guarantee that the profit of the members participating in the supply chain will not be lower than their profit when they do not participate in the traceability system, which is very important for the sustainable development of green and low-carbon behavior. Cai et al. [7] found that increased freshness efforts by freshness suppliers can increase the profitability of fresh produce, explored the optimal ordering and pricing of freshness suppliers under decentralized versus centralized decision-making, and gave a coordination strategy under centralized decision-making. This provides good inspiration for research on the centralized decision-making pricing of the supply chain of green, low-carbon agricultural products based on CVP analysis and demand function and the realization of the optimal profit of the supply chain. Scholars have carried out much research on the distribution of cooperation profits. In 1953, Shapley put forward the distribution formula of cooperation income of both sides, which provides a meaningful reference value for the distribution of cooperation interests of supply chain enterprises. Liang Peng [8] and Dai Peihui [9] analyzed the benefit distribution mechanism of the agricultural product supply chain alliance using Shapley in the alliance game. Yang Jie [10] considered the structure of the cooperative alliance and the specific location of the members and modified the Shapley value through the weight index. Song Hua [11] analyzed the limitations of the Shapley value method in solving for the benefits of each kind of cooperation. In view of the difficulty of information acquisition in the past coordination mechanism in the multi-person cooperative game, Song [12] thought that the Raiffa solution is a cooperative-game income-distribution method considering the upper and lower limits of income distribution. To maximize the income of the traceable supply chain of green, low-carbon agricultural products and bring the income distribution more in line with the psychological expectations of vulnerable participants for the results of the income distribution, this paper constructs the optimal pricing decision model based on a CVP analysis and demand function and gives a profit-distribution mechanism based on the improved Raiffa value. The study shows that the optimal pricing model can realize the optimal profit of the supply chain; the optimal profit of centralized decision-making is found using the improved Raiffa value considering the investment cost and risk to allocate the optimal profit, which overcomes the problem of the difficulty of obtaining information in the multi-player cooperative game, and the adjusted value of the profit-allocation weight vectors of the investment cost and risk derived from the AHP and the risk coefficients of each member of the supply chain is determined via the fuzzy comprehensive evaluation method to optimize the profit allocation of the members of the supply chain, which is also the innovation of the paper. It can also be used for reference by other countries and is of great significance in promoting the sustainable development of traceable supply chains for green, low-carbon agricultural products.

2. Literature Review

To carry out the research on the pricing strategy and profit-distribution mechanism of the traceable supply chain of green and low-carbon agricultural products, scholars’ previous studies on green agriculture and green agricultural products, traceability of green agricultural product supply chains, cost management of agricultural product supply chains, pricing of agricultural product supply chains, and coordination mechanism of interests of agricultural product supply chains have been combed over layer by layer in order to lay the foundation for the research of this paper and to find the innovation points.

2.1. Research on Green Agriculture and Green Produce

Some scholars improve the existing green growth framework according to the characteristics of empirical research objects, evaluate the green economy in many regions of the world, and put forward corresponding policy suggestions [13,14]. Xue Hexiang [15], based on the theory of planned behavior and the Logit model, empirically analyzed the impact mechanism and degree of environmental awareness, environmental knowledge, and other factors on the green low-carbon production behavior of farmers. Liu Chang [16] and Gao Lingxiao [17], respectively, researched the development of agricultural products logistics under the background of “double carbon” and the development strategy of agricultural products’ green logistics under the low-carbon economy according to the future demand and current development status. Gao Yang [18] and other experts analyzed the key points of building a green, low-carbon agricultural–industrial chain and proposed the realization path of building a green, low-carbon agricultural–industrial chain from the aspect of promoting the closed-loop development of the “five-chain” integration, promoting a good connection between the inside and outside of the industrial chain, and improving the whole society’s green low-carbon cognition. Li Bin [19] put forward a path and countermeasures for the realization of a green, low-carbon transformation of agriculture in Henan Province under the background of “double carbon”. These research results mentioned in the promotion of agricultural green low-carbon scientific and technological innovation enhance the scientific and technological service capacity to help the green development of agriculture, but the researchers did not conduct in-depth studies of the specific implementation of supply chains and information technology in supply chains. The implementation of technological services in the traceability system of green and low-carbon agricultural products is undoubtedly a concrete manifestation of promoting agricultural green development, but it increases the cost investment of supply chain members; the increase in costs means that each member faces pressure to maintain or increase profits, so increasing supply chain profits and ensuring that each member receives profits no less than before implementing traceability is a problem that needs to be addressed.

2.2. Research on Traceability of Green Agricultural Supply Chain

Tao et al. [20] discussed decision-making in supply chains without and with RFID, as well as the inventory control strategy. Yang et al. [21] studied supply chain decision-making with RFID technology and analyzed the impact of game orders and the cost of investment in new technologies on the enterprises at each node of the supply chain. Dai et al. [22] considered two competitive manufacturers and differentiated consumers, established a supply chain game model of no traceability, single traceability, and double traceability, and analyzed the decision-making problems of the supply chain through comparison. He Xudong [23] studied the framework of the cold chain traceability system of agricultural products, analyzed the constraints and operation mode of a quality traceability system, and proposed to build a quality traceability system for the extension base of agricultural products. Tracing technology was used for fresh e-commerce to reduce the loss of fresh products. Ding Long et al. [24] believe that, through the label tracking of products, we cannot only obtain the exact information of products but also avoid the loss of supply chain nodes due to inaccurate inventory location. Yu Kangkang [25], through the analysis of second-hand data from 116 Chinese agricultural and food listed companies, discussed the establishment of traceable information systems by integrating the resources of a supply chain upstream and downstream and verified the positive role of vertical integration in improving the efficiency of quality management and promoting food safety in the complex and changeable industry environment. These studies, from the use of traceability to the benefits of the application of traceability technology to the supply chain, have clarified the necessity of enterprises adopting the traceability system, and traceability supply chain quality and safety management is also a very important aspect that needs attention. Gao Yidan et al. [26], based on the reality of the Hebei vegetable product supply chain, analyzed the typical vegetable supply chain mode and the risks and problems of vegetable production and processing, storage and transportation, retail terminals, and other links, and put forward relevant countermeasures and suggestions. Chen et al. [27] proposed a blockchain-based agricultural product safety traceability system for the business process of the existing agricultural product traceability system. Huang Feng et al. [28] studied the advantages, challenges, and development methods of the food traceability system based on the blockchain. Thattapon Surasak et al. [29] designed and developed the Thailand agricultural product traceability system using blockchain and the Internet of Things. Li Haizhou et al. [30] introduced blockchain technology to the key links and typical problems of vegetable supply chain quality and safety management and built a vegetable supply chain quality and safety monitoring system. The application of blockchain technology has provided a reliable guarantee for the quality and safety monitoring of the traceable supply chain, but it is still necessary to explore the internal mechanism of the smooth operation of the traceable system in the supply chain. Luo Luan et al. [31], based on the interests of participants, studied and obtained several key driving factors that drive supply chain subjects to participate in the retrospective promotion of agricultural product supply chains. Yao Fengmin et al. [32] studied the two-level traceable agricultural product supply chain composed of e-commerce platforms and suppliers and analyzed the impact of government subsidies, altruism preferences of e-commerce platforms, and consumers’ traceability preferences on traceable agricultural product supply chain members and the overall performance of the system. Zhu [33] found that the dynamic pricing strategy supported by the traceability system can improve retailers’ performance. Xiao Kaihong et al. [34] explored the participation conditions of farmers before and after the introduction of the revenue-sharing contract and the optimal pricing decision of traceable agricultural products. Zheng Qi et al. [35] considered the different delivery methods of goods delivered to the warehouse and self-picked-up goods under the front warehouse mode and built a fresh agricultural product supply chain decision-making model when suppliers and fresh e-commerce, respectively, invested in traceability technology. The role of traceability technology in reducing the loss of green agricultural products and improving quality management efficiency has been widely recognized. The study of supply chain quality and safety management and its internal operating mechanism has laid the foundation for building an efficient and orderly green low-carbon agricultural product safety system, but attention should be paid to the cost increase caused by traceability systems.

2.3. Research on Cost Management in Agricultural Supply Chains

Lenka and Bajus [36] compared and evaluated the development of the total production cost and profit of crops in four central European countries, pointing out the possibilities of modern cost management and its benefits to the traditional agricultural sector. Ji Wen et al. [37] analyzed the cost composition of the agricultural product supply chain from the perspective of a supply chain and indicated development directions. Wang Guoli [38] and others considered that the third-party logistics service provider (TPLSP) has the cost advantage of fresh preservation and studied the impact of the cost advantage on fresh preservation and outsourcing decisions. It is of great significance to study the relationship between its allocation and supply chain decision-making. Wang Miaomiao et al. [39], based on a two-level supply chain composed of fresh agricultural product suppliers and e-commerce platforms, established a Stackelberg game model under the mode of e-commerce platform financing and bank financing and discussed the impact of the cost-sharing contract and the cost-sharing proportion on the supply chain system and suppliers. Indeed, cost leadership determines the competitive advantage of the supply chain, and the composition and sharing of costs affect the profits of the supply chain and its members. How to be compensated for the pricing is an issue that needs to be further studied.

2.4. Pricing Research on Agricultural Supply Chain

Wu [40] and other scholars studied the financing mode selection of agricultural product producers under the cost-sharing contract. The research shows that trade credit financing is conducive to improving the profit of supply chain members. Mao Lisha [41] systematically studied the multiple factors affecting the pricing of agricultural products, implemented innovative design systems of agricultural product production and marketing modes in different situations, and put forward feasible strategies for the transformation and development of agricultural product supply chains. Xu Guangshu et al. [42], in order to solve the contradiction between consumers’ eager pursuit of quality and freshness of fresh agricultural products and the lack of fresh-keeping investment due to the high cost of cold chain logistics, with price and freshness as the main influencing factors of market demand, studied the pricing and fresh-keeping strategy of fresh agricultural product supply chains with quality grading. Ye Jun [43] and others studied the cold chain logistics services and pricing decisions of fresh agricultural product supply chains under different trade modes in view of the selection of cross-border trade modes and preservation of fresh agricultural products, providing a theoretical basis for the selection of cross-border trade modes and cold chain logistics service level decisions. Zheng et al. [44] coordinated fresh agricultural product supply chains composed of a single supplier and multiple retailers through the quantity discount contract and analyzed the optimal pricing decision of suppliers and the optimal purchasing decision of retailers under the situation of independent procurement and joint procurement of retailers, as well as the impact of product loss rate on the supply chain profit. Wei Guangxing et al. [45] built a joint emission reduction game model for retailer-led low-carbon supply chains and studied the impact of cost-sharing contracts with the retailer sharing the emission reduction cost of the agricultural product producer on the emission reduction, pricing, and profit of the supply chain system. Scholars have studied the pricing and cost-sharing of some agricultural supply chains in response to the cost increase caused by supply chain services but have not addressed the traceability of green and low-carbon agricultural products and the coordination mechanism for the distribution of benefits.

2.5. Research on Interest Coordination Mechanism of Agricultural Supply Chain

Qiu Hui et al. [46] studied a risk-neutral supply chain of agricultural products composed of supermarkets and farmers and considered the coordination of interests of the supply chain of agricultural products with the output rate affecting prices. Gu et al. [47] studied the profit-distribution model with resource and risk weights under centralized decision-making and used fairness entropy to explore the optimal solution of the profit-distribution coefficient, proposing to build a precise distribution mechanism based on the contract or the definition of property rights. Guo Fangfang et al. [48], based on the Stackelberg game theory, considering the sales efforts and starting from the principle of maximizing interests, designed coordination and pricing strategies for agricultural product e-commerce supply chains such as transferring income, sharing fresh-keeping costs, sharing sales effort costs, and adjusting the wholesale price of agricultural products, and put forward corresponding countermeasures and suggestions. There are also some scholars who are keen on using Shapley value to allocate supply chain profit under centralized decision-making. Zhao Jiajia et al. [49] took the cabbage industry in Tonghai County, Yunnan Province, as an example. From the perspective of the distribution of interests in the industrial chain, they used the Shapley value method combined with the AHP to analyze the risk bearing, innovation ability, and contribution of business entities in various links to the industry and calculated a more reasonable method of interest distribution, which is of great significance in further promoting the healthy development of the agricultural industry. Zhang Xicai et al. [50] built a new profit-distribution mechanism for agricultural product cooperatives, wholesalers, and retailers by improving the Shapley value model. Xie Ruhe et al. [51], through the establishment of the Stackelberg game model and the use of the Shapley value method to study and empirically analyze the vegetable supply chain, obtained an inevitable cooperation relationship based on a reasonable distribution of supply chain profit and promoted a win–win scenario for all parties involved in the supply chain. Scholars have conducted in-depth research on the mechanism of interest coordination in agricultural product supply chains but have not given much consideration to issues such as the difficulty of obtaining information in multi-party cooperative games and the psychological expectations of vulnerable participants for the distribution of benefits.

2.6. Literature Review

The above research on green agriculture and green agricultural products, traceability of green agricultural product supply chain, cost management of agricultural product supply chain, pricing of agricultural product supply chain, and coordination mechanism of agricultural product supply chain interests greatly enriches the theory and methods of green agricultural product safety and agricultural product supply chain management, laying a good foundation for research on pricing decision-making and the profit-distribution mechanism of green and low-carbon agricultural product traceable supply chains in this article. This article studies the traceable supply chains of green and low-carbon agricultural products composed of three members: farmers, enterprises, and supermarkets. A product optimal pricing decision model based on Cost–Volume–Profit (CVP) analysis and demand function is constructed, and a profit-distribution mechanism based on the improved Raiffa value is proposed. In his work of 1850, Dionysius Landner began to have a preliminary idea of the problem of CVP. In 1922, Williams first proposed the words “break-even” and “balance point” to describe the key points [52]. Yunker [53] proposed that CVP analysis can solve how product income and cost affect sales and can provide clear and understandable results to managers through simple calculations. DISKIN [54] and Kikuta [55] found that the Raiffa value method is a cooperative-game income-distribution method that considers the upper and lower limits of income distribution to protect the weak to a certain extent. At the same time, the initial conditions are easy to meet. The calculation is small, making up for the problem that with the Shapley value method, it is difficult to obtain information in the actual application process, taking into account the psychological expectations of vulnerable participants for the results of the income distribution. For the optimal profit obtained from the optimal pricing, considering the different contributions and risk levels of each member, the improved Raiffa value is considered to solve the problem of profit distribution in multi-party cooperative games. This makes up for the difficulty of information acquisition in the practical application of the Shapley value method and takes into account the psychological expectations of vulnerable participants for profit-distribution results. It has certain practical significance in enriching the coordination mechanism of the supply chain and is conducive to the long-term, sustainable, and stable development of the supply chain. Finally, the effectiveness of the model was verified through practical examples.

3. Pricing and Profit-Distribution Model for Traceable Green Agricultural Products Based on CVP Analysis and Improved Raiffa Value

The general overview of the traceable green agricultural product pricing and profit-distribution model based on CVP analysis and the improved Raiffa value, as well as the relationships between its various parts, is shown in Figure 1.
The pricing decision for centralized decision-making of traceable green agricultural product supply chains is made based on CVP analysis and demand function. Then, in order to study the reasonable distribution of optimal profit among supply chain members, the weight between investment cost and risk is considered on the basis of a Raiffa value model and the adjusted value of profit distribution of each member of the supply chain considering the factors of investment cost and risk, which then forms the profit-distribution model of traceable green agricultural products based on the improved Raiffa value.

3.1. Product Optimal Pricing Decision Based on CVP Analysis and Demand Function

CVP analysis, also known as “profit and loss analysis”, was first created by the United States Walter Law Paint Strauch in the 1930s; it is a comprehensive analysis of a mathematical analysis method based on the interdependence between the volume of business (referring to production, sales, etc.), cost, and profit. As the competition between enterprises in the past has evolved more into the competition between supply chains, the traceability of green agricultural products among supply chain members plays an important role in improving product quality and increasing consumers’ willingness to buy, and this role is highlighted by the collaborative quantitative cost–benefit analysis of the supply chain member enterprises and the highlighting of supply chain competitive advantages. Admittedly, the realization of profit cannot be separated from the sales volume and unit price, and these two exist in a relationship of mutual constraints; to find a suitable unit price, the unit price under the sales volume can be achieved to maximize the profit, which cannot be separated from the supply chain members of the information sharing; this paper will present a CVP analysis combined with the demand function, and the determination of the appropriate sales price on the basis of the supply chain members of the information sharing, so as to maximize the profit of the supply chain.
The expression of the quantity cost–benefit method is as follows:
E = p Q ( a + b Q ) = ( p b ) Q a
In Formula (1), p is the sales unit price, Q is the sales volume, a is the fixed cost, b is the variable cost, and E is the profit.
To determine the unit price and obtain the maximum profit, the demand function is introduced.
Q = τ β p
In Formula (2), τ is the total market demand capacity and β is the price sensitivity coefficient.
Substituting Formula (2) into Formula (1):
E = β p 2 + ( τ + β b ) p ( a + τ b )
In Formula (3), the coefficient of the quadratic term is less than 0, and the image is a parabola with a maximum value. Then, Formula (3) takes the derivative of p , E = 2 β p + ( τ + β b ) , so that E = 0 is obtained:
p * = ( τ + β b ) / 2 β
Formula (4) is greater than zero; then, p * is the sales price corresponding to the maximum profit, as shown in Figure 2.
Formula (4) can be substituted into Formula (2) to obtain the sales volume corresponding to the optimal profit:
Q * = ( τ β b ) / 2
Formula (4) is substituted with Formula (3) to obtain the optimal profit:
E * = ( τ + β b ) 2 4 β a + τ b

3.2. Profit-Distribution Model Based on the Improved Raiffa Value

The Raiffa value was proposed by Howard Raiffa, a professor at Harvard University, in 1957; it is a mathematical method for solving the problem of benefit distribution of multi-player cooperation. It solves the limitation of the Shapley value method for profit distribution in actual economic activities and only needs to know the situation of (n + 1) coalitions based on the upper and lower limits of the profit distribution; it can solve the problem of benefit distribution in multi-player cooperation. The problem of profit distribution in a game makes up for the difficulty of obtaining information in practical applications of the Shapley value method, and the calculation is simple, so this paper selects the Raiffa value for the profit distribution of the coalition.

3.2.1. Modeling of the Raiffa Value Algorithm

The Raiffa value model description and basic assumptions
Assume that the set of members participating in the coalition is composed of N = 1 , 2 , , n ; for any subset S of N , there exists a real-valued function v S as the total profit of S , which satisfies v ϕ = 0 , i.e., the profit is 0 when no member participates in the coalition; v i = 1 n s i i = 1 n v s i , s i N , indicates that the profit generated by the coalition centrally is not less than the profit of decentralized operations.
Denote by x i the profit that member i shares from the coalition’s profit v N . The coalition’s profit-distribution scheme is x = x 1 , x 2 , , x n and all the profits gained by the coalition are distributed, i.e., i = 1 n x i = v N ; the profit gained from participating in the coalition is not less than the profit gained from operating alone, i.e., x i v i ; the profit generated by members’ participation in the cooperation is additive or even super-additive, i.e., v N v N \ i + v i , where v N \ i is the coalition’s profit when the i member does not participate in the cooperation.
Algorithmic steps for Raiffa value modeling
① The profit of the whole cooperation process is known as v N = E , e i = v N \ i , and notation e = e 1 , e 2 , , e n . There are n coalitions containing n 1 members in the set N of all members participating in the coalition, obtaining the profit of the n 1 member coalition:
i = 1 n x i x 1 = e 1 i = 1 n x i x n = e n
From Equation (7), we obtain the lower limit x ¯ = x 1 ¯ , x 2 ¯ , , x n ¯ of profit distribution for each party, i.e.,:
x i ¯ = 1 n 1 i = 1 n e i e i ( i = 1 , 2 , , n )
② When member j joins the other n 1 member coalitions, the marginal profit x j ¯ = E e j due to j joining is used as the upper limit of the allocation, and this marginal profit is first divided equally between j and the n 1 member coalitions that do not contain j , and then the marginal profit allocated to the n 1 coalitions is divided equally among the n 1 coalitions a second time, i.e.,:
x j = x ¯ j 2 x i = x ¯ i + x ¯ j 2 ( n 1 ) , i = 1 , 2 , , n ; i j
③ The values of j in Equation (9) are taken in 1 to n, respectively, and then the summation and calculation of the average are performed to obtain the final distribution function of Raiffa values:
x i = n 1 n x ¯ i + 1 n x ¯ i 2 + 1 2 ( n 1 ) i i j x ¯ j , i = 1 , 2 , , n
Substituting Equation (8) and x j ¯ = E e j into Equation (10) yields:
x i = E n + 2 n 3 2 ( n 1 ) 1 n i = 1 n e i e i , i = 1 , 2 , , n
Substituting Equation (6) into Equation (11) yields:
x i = ( τ + β b ) 2 4 n β a + τ b n + 2 n 3 2 ( n 1 ) 1 n i = 1 n e i e i , i = 1 , 2 , , n

3.2.2. Improved Raiffa Value Considering Investment and Risk Factors

(1) In the distribution of profit, it is also necessary to take into account the investment factors of different members, members of the investment, including technology, manpower, money, and other hardware investment and software investment; to facilitate the calculation, all the investment will be expressed in monetary amounts. If the input of member i is C i , then the total investment of n members is C = i = 1 n C i , the member i ’s burden of the total investment is C i C ; the average value of each member’s investment in the model accounted for 1 n of the total investment of n members; then, there is the investment proportion difference δ i = C i C 1 n . Therefore, considering the investment factor of the profit-distribution adjustment amount of ϕ i is:
ϕ i = δ i E * = δ i ( τ + β b ) 2 4 β a + τ b , i = 1 , 2 , , n
(2) In the alliance, the environment, market, dissolution, and other risks borne by each participating member are different, and in the distribution of cooperative profit, the proportion of profit distribution should be increased appropriately for the members who bear large risks. Assuming that the average risk value borne by each member is 1 n , in fact, the risks borne by different members are different, and it is difficult to obtain the objective values of various risks in reality; this paper adopts the fuzzy comprehensive evaluation method to calculate the risk coefficient r i of member i in the alliance, and then the risk difference is λ i = r i 1 n , ( i = 1 , 2 , , n ). Therefore, the adjustment amount of the profit distribution, taking into account the risk factor γ i is:
γ i = λ i E = λ i ( τ + β b ) 2 4 β a + τ b , i = 1 , 2 , , n
(3) We apply the AHP analysis method to determine the weights between the factors affecting the profit distribution and assume that the weight vector of the adjustment amount of profit distribution considering the investment factor and the adjustment amount of profit distribution and considering the risk factor is ξ = ξ 1 , ξ 2 , which satisfies ξ 1 + ξ 2 = 1 . Then, according to Equations (12)–(14), the final amount of the profit distribution of each member is:
x i = x i + ξ 1 ϕ i + ξ 2 γ i = 1 n 1 ξ 1 ξ 2 + ξ 1 C i i = 1 n C i + ξ 2 γ i ( τ + β b ) 2 4 β a + τ b + 2 n 3 2 ( n 1 ) 1 n i = 1 n e i e i , i = 1 , 2 , , n

4. Case Analysis

4.1. The Optimal Pricing Decision of Enterprise A for Traceability “Strawberry Tomato”

J City Enterprise A (hereinafter referred to as the enterprise) is a green agricultural product enterprise that realizes quality traceability and takes the traceable green “strawberry tomatoes” sold by Supermarket K, which cooperates with the enterprise, as an example. The selling price of “strawberry tomatoes” with traceability is 9.2 RMB per catty, i.e., the unit price is p 1 = 9.2 RMB/catty. Through consultation and investigation, it was found that the fixed costs α = 250000 a = 250000 RMB per year for the corresponding amount of “strawberry tomatoes” sold (including the input of the plastic greenhouse, the input of the traceability equipment, transportation, and warehousing, etc.). The variable cost of growing, storing, and selling the “strawberry tomato” b = 2.35 RMB per catty (including seeds, fertilizers, labor, distribution, processing, etc.). Substitute the above data into Formula (1) to obtain E = 9.2 2.35 × Q 250000 , when E is 0, resulting in an annual capital preservation point sales Q 0 = 36496 catty.
(1) Suppose the target annual profit T E of the alliance is RMB 1,620,000, and put this into Formula (1) to obtain 1620000 = 9.2 2.35 × Q 250000 ; then, Q 1 = 272993 ; that is, when the annual sales volume reaches 272,993 catty, the target profit of 1,620,000 can be achieved.
(2) When the fixed cost a and variable cost b remain unchanged, the target profit is T E = 1620000 RMB, and the unit price p of “strawberry tomato” decreases; the sales volume Q will rise. Assuming that the unit price p is reduced by 0.8 RMB/catty, according to Formula (1), 1620000 = 9.2 0.8 2.35 × Q 250000 ; the sales volume Q 2 = 309091 catty; that is, when the unit price p 2 = 8.4 RMB/catty, Q 2 Q 1 = 309091 272993 = 36098 ; the sales volume increased by 36,098 catty.
(3) Substituting the above two sets of data of p 1 = 9.2 , Q 1 = 272993 and p 2 = 8.4 , Q 2 = 309091 into Equation (2) yields:
272993 = τ 9.2 β 309091 = τ 8.4 β
Solve Equation (16) to obtain τ = 688122 , β = 45123 . Bring the values of τ , β and b into Equations (4)–(6) to obtain the optimal selling price, sales volume, and maximum profit of the traceable “strawberry tomatoes” are p = 8.8 RMB/catty, Q = 291042 catty, S = 1627220 RMB.

4.2. Traceable “Strawberry Tomato” Profit Distribution Based on Improved Raiffa Values

4.2.1. Profit of Each Member under Decentralized Decision-Making

Through in-depth interviews and field visits with relevant personnel of the enterprise, the price of traceable “strawberry tomatoes” sold by the enterprise in supermarkets is 9.2 RMB/catty, while the price of “strawberry tomatoes” sold without the implementation of traceability is 7 RMB/catty, with sales of 200,000 catty, resulting in a premium of 2.2 RMB/catty. According to the survey, the implementation of traceability does not have a significant impact on sales, so it is assumed that the sales volume remains unchanged.
The cost of “strawberry tomato” without traceability is 1 RMB/catty. After the implementation of traceability, the cost of “strawberry tomato” is 1.8 RMB/catty due to the additional cost of purchasing fertilizer and pesticides.
Before the implementation of traceability, farmers were selling “strawberry tomatoes” to wholesalers at the wholesale price of 2.2 RMB/catty; after the implementation of traceability via the acquisition of enterprises, the purchase price was 3.3 RMB/catty; i.e., the enterprise paid more than 1.1 RMB/catty of the cost. Considering the logistics, circulation, and processing, as well as working capital occupancy costs after acquisition by the enterprise, the cost of obtaining traceable “strawberry tomatoes” is about 4.3 RMB/catty, and in addition, there are increased costs of software-development fees, hardware-supporting facilities and equipment, system-maintenance fees, printing fees, marketing fees, and human resources related to traceability, making the average cost of traceable “strawberry tomatoes” increase by 0.8 RMB/catty.
The supermarket collects 15% of the revenue from the sale of “strawberry tomatoes” as a source of profit, and this profit also serves as the opportunity cost of the supermarket.
Since each member has the demand to realize a corresponding profit, the profit from selling “strawberry tomatoes” under decentralized decision-making after the implementation of traceability is calculated for each member:
Farmer: (3.3 − 1.8) × 200000 = 300000 (yuan)
Enterprise: (9.2 − 4.3 − 0.8) × 200000 − 9.2 × 200000 × 0.15 = 544000 (yuan)
Supermarket: 9.2 × 200000 × 0.15 = 276000 (yuan)
The sum of the three profits is 300000 + 544000 + 276000 = 1120000 RMB, divided by the total profit of each of the three individually; we obtain that the proportion of the profit of farmers, enterprises, and supermarkets to the overall profit is 26.79%, 48.57%, 24.64%, respectively. Other related data are shown in Table 1:
As can be seen from Table 1, after the implementation of traceability, the unit premium obtained by the farmer, enterprise, and supermarket is greater than their additional increase in costs, of which enterprise is the highest, followed by farmer and supermarket, and the reasonableness of the distribution of this premium and whether it is conducive to the long-term and stable development of the implementation of the traceability system need to be further studied.

4.2.2. Profit of Each Member Based on Raiffa Value under Centralized Decision-Making

(1)
Profit of cooperation between different members
By investigating the sales data related to the implementation of traceable green low-carbon “strawberry tomatoes” and conducting simulated cooperation experiments, according to Equation (7), concerning the profit of the two participating members in the implementation of the “strawberry tomato” traceability system, if the farmer and enterprise cooperate, they can earn v farmer enterprise = 1013000 RMB; if the farmer and supermarket cooperate, they can earn v farmer supermarket = 692 000 RMB; if the enterprise and supermarket cooperate, they can earn v enterprise supermarket = 984 000 RMB; if the farmer, enterprise, and supermarket cooperate, they can profit v farmer enterprise supermarket = 1627220 RMB.
(2)
The upper and lower limits of profit distribution for each member
According to Equation (8) of the lower limit of profit distribution, farmer = [1/(3 − 1)] × (1013000 + 692000 + 984000) − 984000 = 360500; similarly, the enterprise’s value is 652500, and the supermarket’s is 331500.
From x j ¯ = E e j , concerning the upper limit of profit distribution, farmer = 1627220 − 984000 = 643220; similarly, the values are 935220 for enterprise and 614220 for supermarket.
(3)
Profit of each member based on the Raiffa value
The profit of each member can be obtained from Equation (12):
Farmer = 2/3 × 360500 + 1/3 [643220/2 + 1/4 (935220 + 614220)] = 476657, and similarly, 695657 for enterprise and 454907 for supermarket.
The calculation of profit distribution for each member is shown in Table 2.

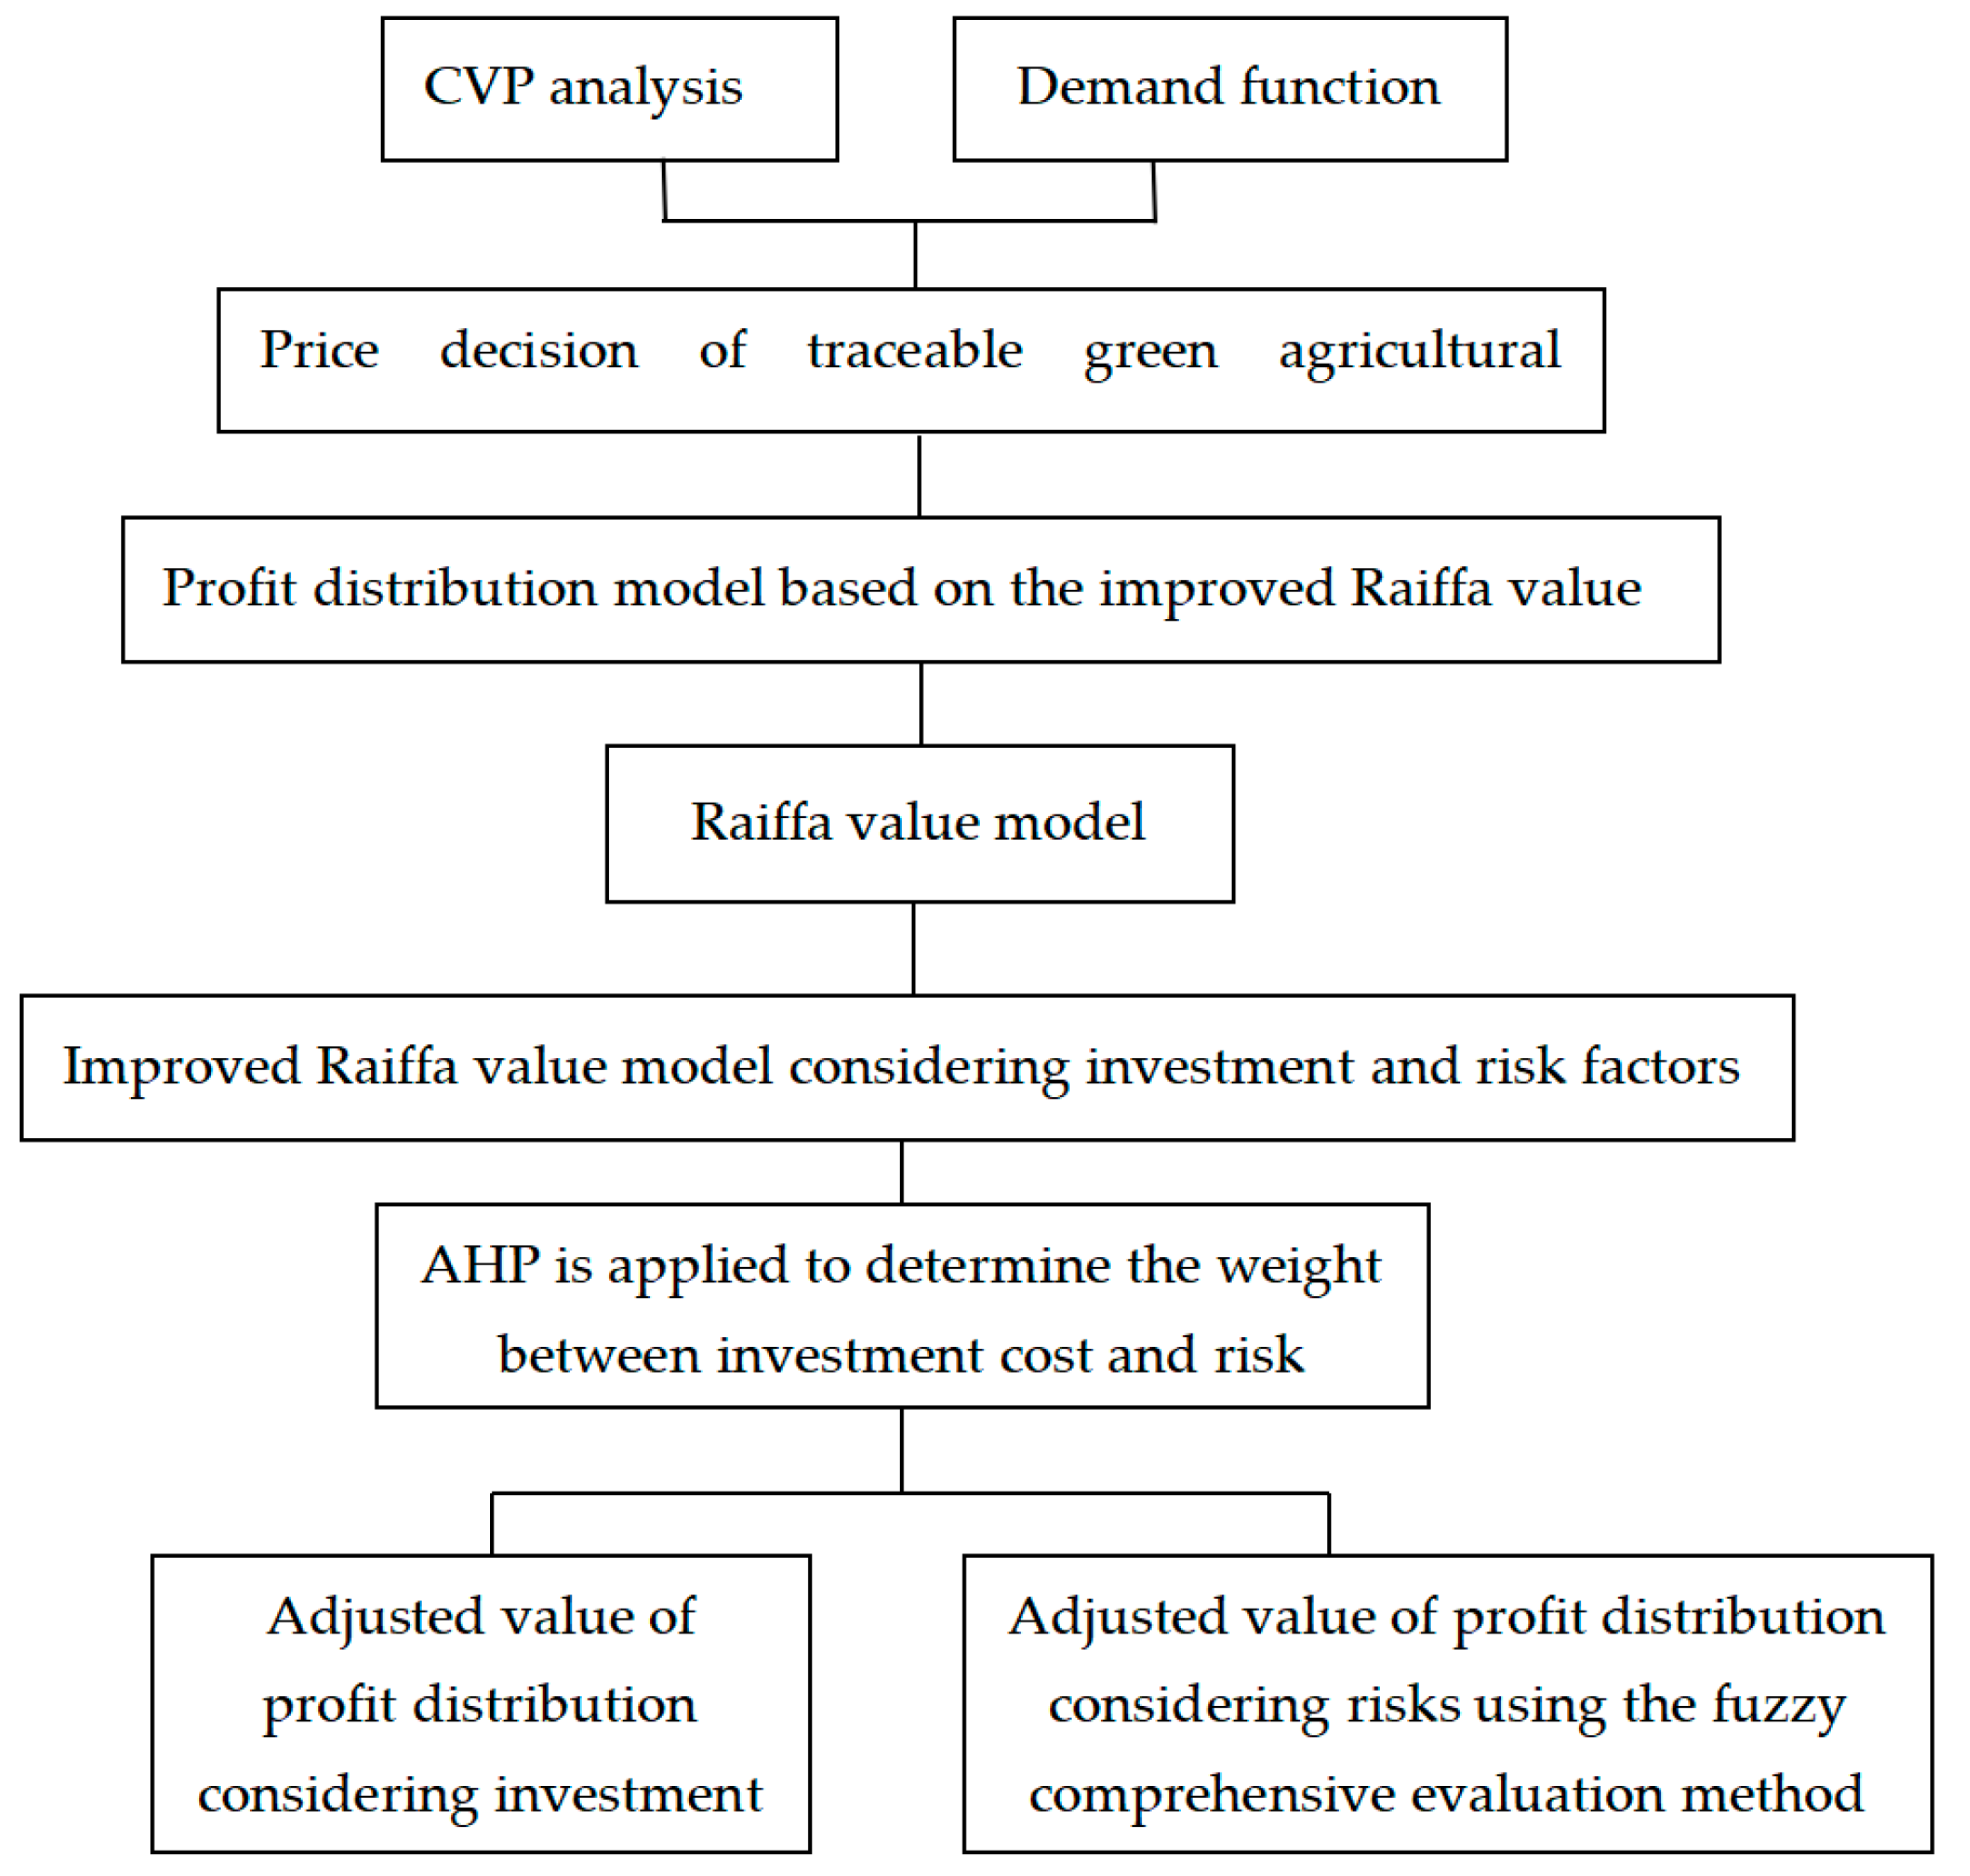
4.2.3. Adjustment of Profit Distribution of Traceable “Strawberry Tomatoes” Based on Improved Raiffa Values

According to the fixed cost and variable cost apportioned annually by the sales of the corresponding amount of “strawberry tomatoes” as mentioned above, and the small impact on sales due to the increase in selling price after the implementation of traceability, assuming that the sales volume is 200,000 catty, the total cost is C = 250000 + 2.35 × 200000 = 720000 RMB.
(1)
Adjusted value of profit distribution considering investment costs
From the farmer’s perspective, the cost of implementing traceability of “strawberry tomatoes” is 1.8 RMB/catty, and the sales volume at the time of decentralized decision-making is 200,000 catties; then, the investment cost is 360,000 RMB. From the perspective of enterprises, after the implementation of traceability, the purchase price of enterprises is 3.3 RMB/catty; enterprises acquire traceable “strawberry tomatoes” after considering logistics and other costs; the acquisition cost is about 4.3 RMB/catty; in addition to the increased costs associated with the traceability system, the average cost of traceable “strawberry tomatoes” increased by 0.8 RMB/catty, so the cost paid by enterprises is 1.8 RMB/catty, according to the sales volume of decentralized decision-making; then, the enterprise investment cost is RMB 360,000. From the supermarket’s point of view, the profit under decentralized decision-making of RMB 276,000 is the opportunity cost of its centralized decision-making, which can be regarded as the investment cost of the supermarket’s participation in centralized decision-making. Then, the total investment cost is 360,000 + 360,000 + 276,000 = 996,000 RMB; according to Formula (13), we obtain δ 1 = 0.0281 , δ 2 = 0.0281 , δ 3 = 0.0562 ; then, ϕ 1 = ϕ 2 = 45725 , ϕ 3 = 91450 .
(2)
Adjusted value of profit distribution considering risks
There are many risks to be borne by each member of the green agricultural product supply chain, and three types of risks are mainly analyzed here: environmental risk, market risk, and dissolution risk. Since it is difficult to obtain objective values of various types of risks in practice, this paper uses the fuzzy comprehensive evaluation method in determining the coefficients of various types of risks to adjust the profit of the agricultural products’ traceability system; the specific steps are as follows.
Using the fuzzy comprehensive evaluation method, we obtain the factor set U = {environmental risk, market risk, dissolution risk}. In accordance with the different degrees of influence of the three risk factors on farmer, enterprise, and supermarket, according to expert opinion and referring to the literature, the corresponding weight vectors A N = (0.5 0.2 0.3), A Q = (0.1 0.4 0.5), and A S = (0.1 0.8 0.1) are assigned to each risk factor, respectively. According to the impact of each risk factor on the implementation of traceability in the actual situation, the evaluation set of the degree of impact of each weight vector is assigned as V = {small impact, medium impact, large impact), and the quantitative evaluation set V = (0.3 0.5 0.7).
Experts related to agricultural products are invited to form a risk-assessment group, and the experts are asked to evaluate the three risk factors according to the evaluation set. Then, the evaluation results of all the experts are counted, and the evaluation results of the three factors are converted into values in the interval [0, 1] so that the fuzzy vectors B N , B Q , B S of the three risks to farmers, enterprises, and supermarkets are obtained. The evaluation results of the experts are synthesized into a matrix. The fuzzy relationship matrix from U to V is obtained as follows.
R = R N R Q R S = r 11   r 12   r 13 r 21   r 22   r 23 r 31   r 32   r 33
A fuzzy composite judgment is then performed based on the method of multiplicative-bounded operator:
B N = A N R N = 0.5   0 . 2   0 . 3 0.1   0.2   0.7 0.5   0.3   0.2 0.6   0.2   0.2 = 0 . 33   0 . 22   0 . 45
It happens that the sum of the components in B N is 1, and no normalization is carried out. The influence weights of the three risk factors on the farmer are 0.33, 0.22, and 0.45, respectively.
B Q = A Q R Q = 0.1   0 . 4   0 . 5 0.1   0.4   0.5 0.3   0.2   0.6 0.1   0.1   0.8 = 0 . 14   0 . 17   0 . 69
The impact weights of the three risk factors on the enterprise were 0.14, 0.17, and 0.69, respectively.
B S = A S R S = 0.1   0 . 8   0 . 1 0.2   0.1   0.4 0.3   0.8   0.2 0.5   0.1   0.4 = 0 . 72   0 . 18   0 . 1
The impact weights of the three risk factors on the supermarket were 0.72, 0.18, and 0.1, respectively.
Finally, we find the composite score D = B V
Farmers’ composite score
D N = B N V = 0 . 33   0 . 22   0 . 45 0 . 3 0 . 5 0 . 7 = 0.33 × 0.3 + 0.22 × 0.5 + 0.45 × 0.7 = 0.524
Enterprise composite score
D Q = B Q V = 0 . 14   0 . 17   0 . 69 0 . 3 0 . 5 0 . 7 = 0.14 × 0.3 + 0.17 × 0.5 + 0.69 × 0.7 = 0.61
Supermarket composite score
D S = B S V = 0 . 72   0 . 18   0 . 1 0 . 3 0 . 5 0 . 7 = 0.72 × 0.3 + 0.18 × 0.5 + 0.1 × 0.7 = 0.376
The final scores of farmer, enterprise, and supermarket were 0.524, 0.61, and 0.376, respectively. After normalization, they were 35%, 40%, and 25%, so the total risk coefficient of farmers was 0.35, the total risk coefficient of enterprises was 0.4, and the total risk coefficient of supermarkets was 0.25. Then, according to λ i = r i 1 n , we obtain λ 1 = r 1 1 n = 0 . 35 1 3 = 1 60 , and similarly, λ 2 = 1 15 , λ 3 = 1 12 ; then, γ 1 = λ 1 S = 1 60 × 1627220 = 27120 , γ 2 = 108481 , γ 3 = 135602 .
(3)
Adjusted profit distribution
The AHP is applied to determine the weight between investment cost and risk. The comparison and quantification of factors are shown in Table 3.
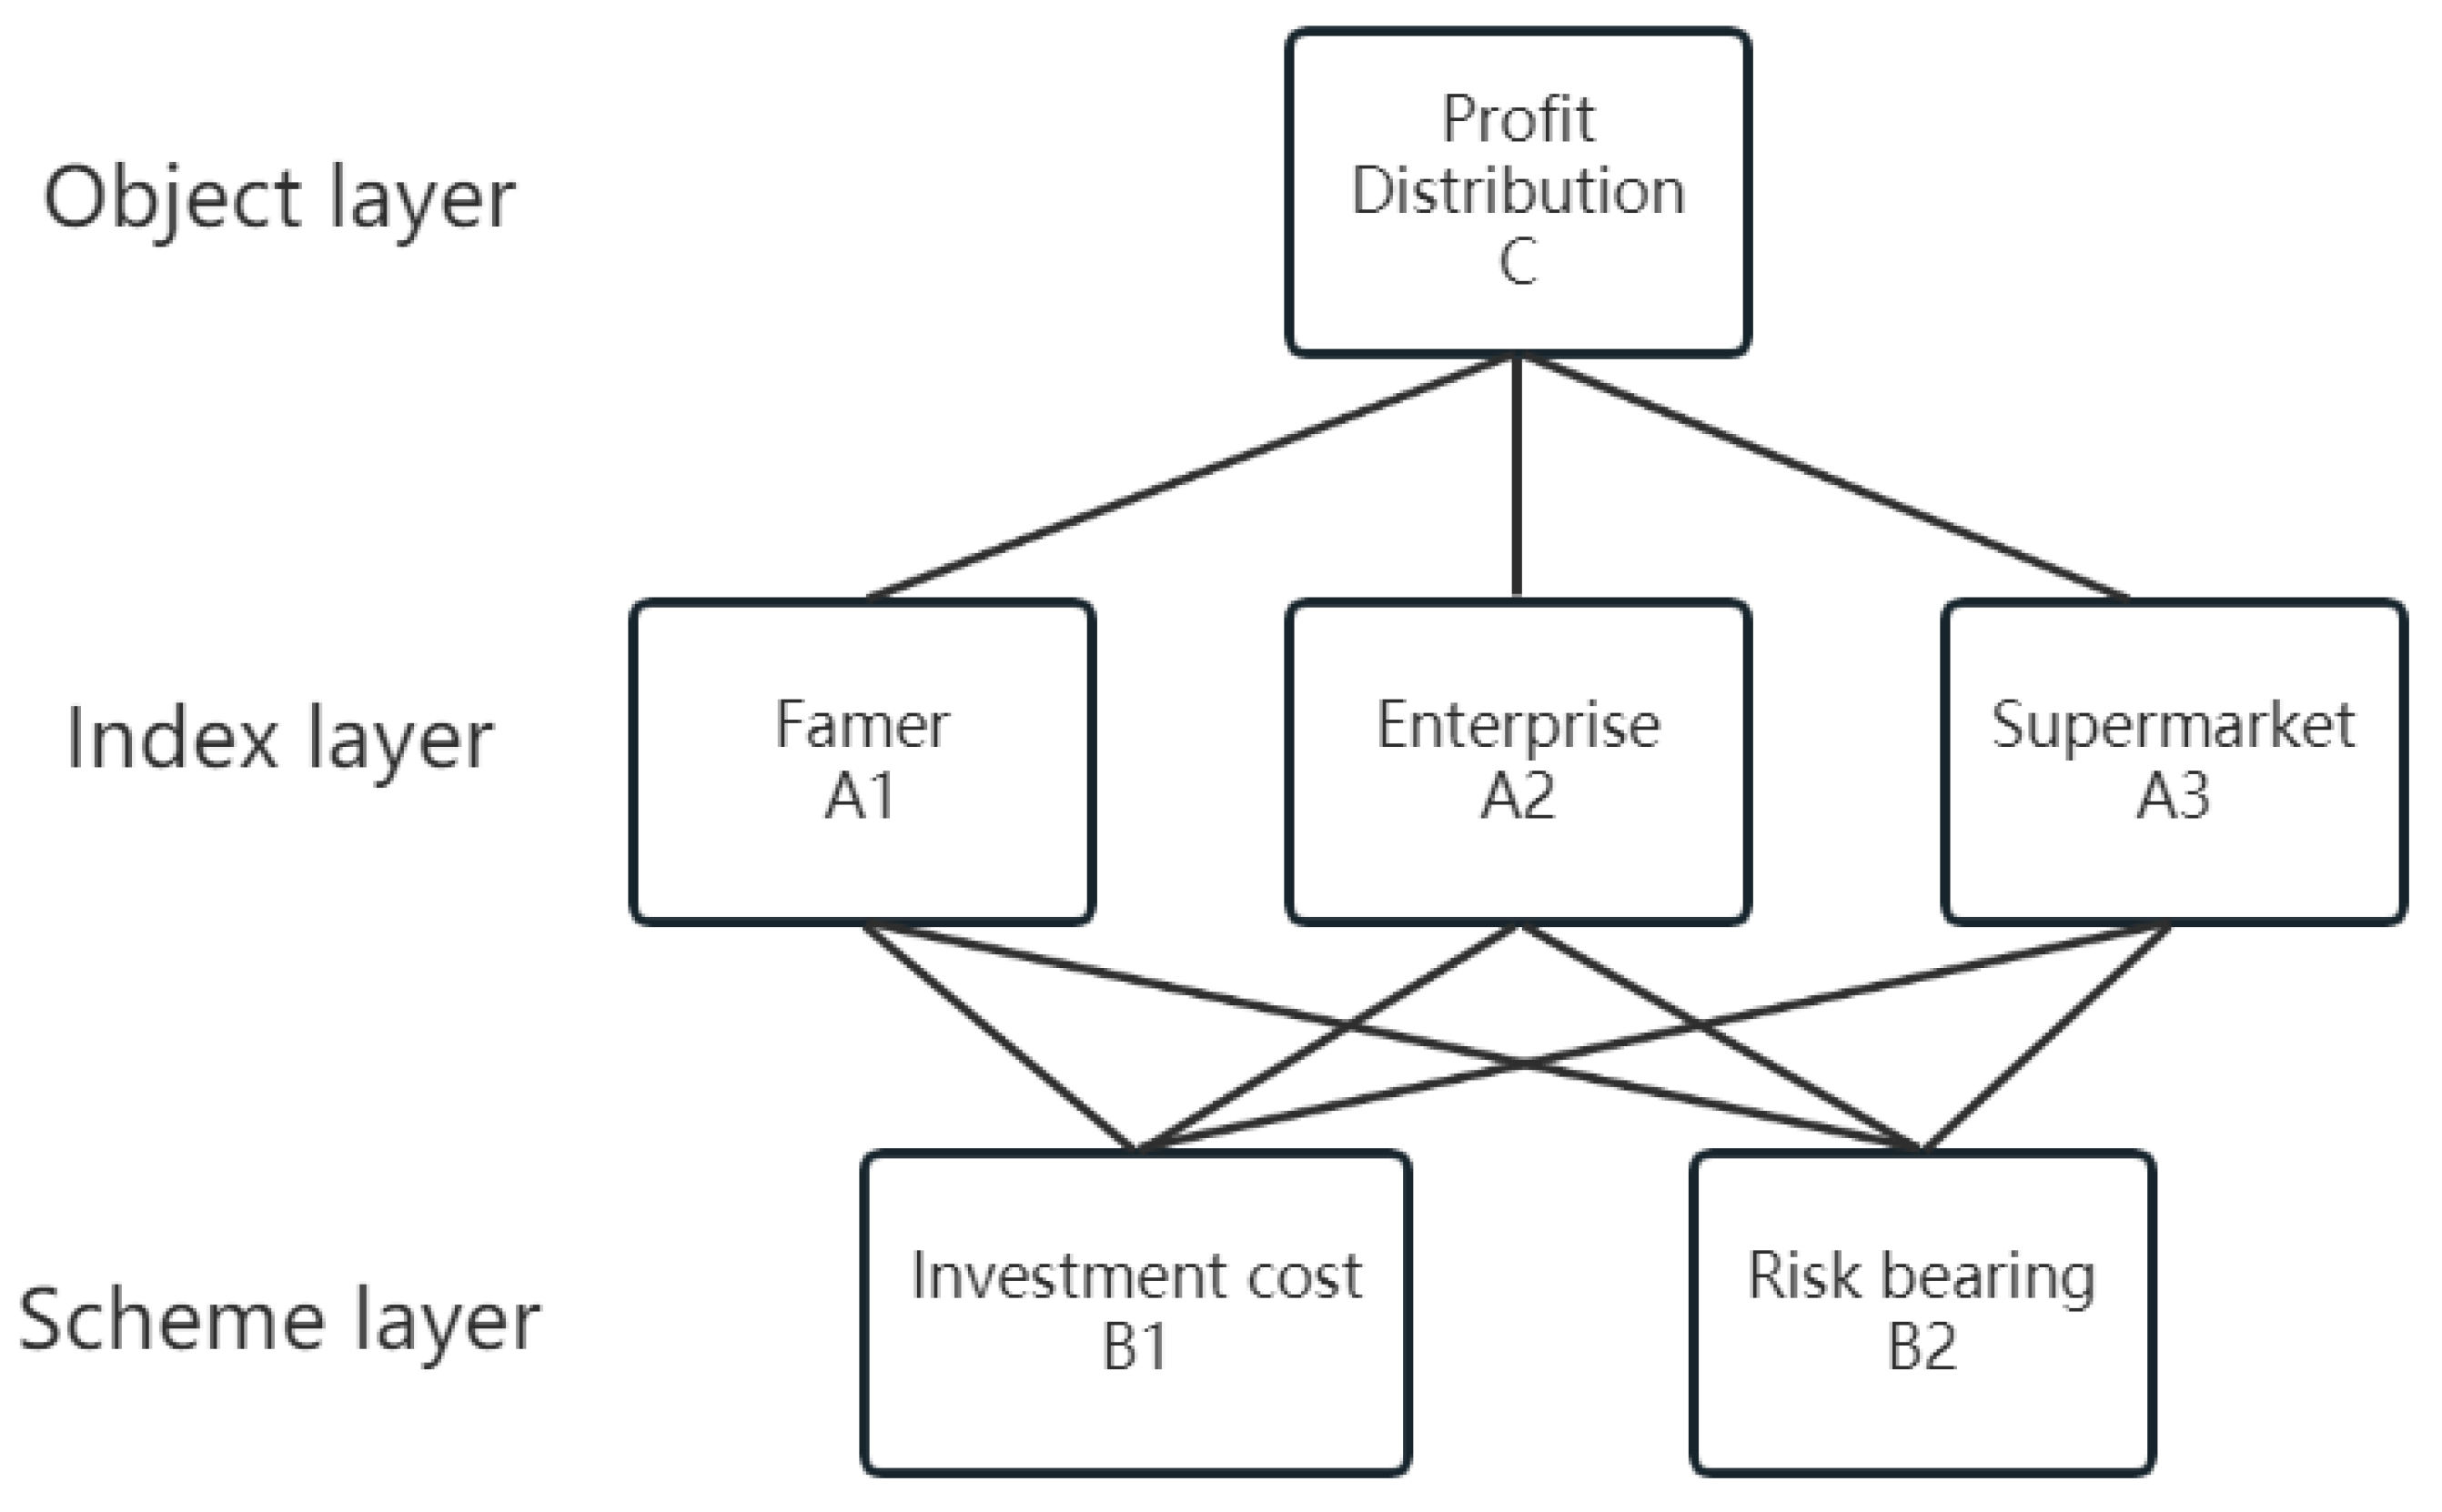
① Taking two factors of investment cost and risk bearing into account, a hierarchical structure model (as shown in Figure 3) is constructed. The object layer is benefit distribution, the index layer is farmer A1, enterprise A2, and supermarket A3, and the scheme layer is investment cost B1 and risk bearing B2.
The weight of various factors affecting the distribution of interests is determined by the AHP, and the judgment matrix was constructed and normalized for the model after adding the comprehensive factors.
② Judgment matrix processing at the index layer for the object layer.
Based on the quantitative values of the inter-factor comparisons in Table 3, the scores were assessed by the experts, and two-by-two comparisons were made, as shown in Table 4.
The data from Table 4 were normalized via columns, as shown in Table 5.
The weights of the farmer, enterprise, and supermarket were 0.31, 0.49, and 0.20.
The consistency test is performed on the pairwise comparison matrix. Consistency indicator C I = λ n n 1 to find the weight matrix of λ = 3.02 , n = 3; then, the consistency indicator C I = 0.01 ; consistency ratio C R = C I R I ; according to Satty’s stochastic consistency to take the value of R I = 0.58 when n = 3, calculate the consistency ratio of C R = 0.0172 < 0.1 ; then, the consistency of the indicator layer to the target layer of the consistency test passed.
③ The judgment matrix processing of the scheme layer to the index layer is shown in Table 6, Table 7 and Table 8.
The data from Table 6, Table 7 and Table 8 were normalized via columns, as shown in Table 9, Table 10 and Table 11.
The weight of the investment cost and risk bearing of farmers, enterprises, and supermarkets were (0.4 0.6), (0.67 0.33), and (0.59994 0.40006), respectively.
A consistency test of the pairwise comparison matrix was carried out. According to Table 6, Table 7 and Table 8, the maximum characteristic roots λ 1 , λ 2 , and λ 3 were calculated to be 2, and the calculated consistency indicators C I 1 , C I 2 , and C I 3 were all 0; the random consistency index R I = 0 , and the consistency test passed.
④ The final judgment matrix of the scheme layer to the object layer is shown in Table 12.
The consistency test of hierarchical total ranking is addressed in the following. The consistency ratio of the total hierarchical ordering C R = ω 1 C I 1 + ω 2 C I 2 + ω 3 C I 3 ω 1 R I 1 + ω 2 R I 2 + ω 3 R I 3 ; from the aforementioned calculation of the consistency indicators C I 1 , C I 2 , C I 3 and the weights of the indicator layer relative to the target layer ω 1 , ω 2 , ω 3 , the calculation of the total hierarchical ordering C R = 0 ; the consistency test passes.
The weight vector of the adjusted value of the return distribution considering the investment cost and the adjusted value of the return distribution considering the risk is obtained via the AHP as ξ = 0.57 , 0.43 . Then, in accordance with Formula (15), the final profit allocation of farmers, enterprises, and supermarket members is:
x 1 = x 1 + ξ 1 ϕ 1 + ξ 2 γ 1 = 476657 + 0.57 × 45725 + 0.43 × 27120 = 514381.85
x 2 = x 2 + ξ 1 ϕ 2 + ξ 2 γ 2 = 695657 + 0.57 × 45725 + 0.43 × 108481 = 768367.08
x 3 = x 3 + ξ 1 ϕ 3 + ξ 2 γ 3 = 454907 0.57 × 91450 0.43 × 135602 = 344471.64
The added value of profit before centralized decision-making is:
S 1 = 514381.85 300000 = 214381.85
S 2 = 768367.08 544000 = 224357.08
S 3 = 344471.64 276000 = 68471.64

4.2.4. Analysis of Results

(1) The profit distribution of members based on the Raiffa value and improved Raiffa value under decentralized decision-making and centralized decision-making is shown in Table 13.
From Table 13, it can be seen that the total interests of members under centralized decision-making were RMB 1,627,220, an increase of RMB 507,220 over the total profit of members under decentralized decision-making of RMB 1,120,000, an increase of about 45.29%. Compared with the profit of members under decentralized decision-making and centralized decision-making based on the improved Raiffa value, the farmers’ profit increased by 71.46%, to RMB 214,381.85, the enterprise profit increased by 41.24%, to RMB 224,357.08, and the supermarket profit increased by 24.90%, to RMB 68,471.64. The profit of each member of the centralized decision-making is also higher than that of the decentralized decision-making, which proves the rationality and feasibility of the centralized decision-making.
(2) The percentage of profit distribution of members based on the Raiffa value and improved Raiffa value under decentralized decision-making and centralized decision-making is shown in Figure 4.
From Figure 4, it can be seen that, in decentralized decision-making, the enterprise obtained a maximum profit of about 48.57%, the profit of farmers was 26.79%, and the supermarket profit was 24.64%. After the improvement, the proportion of farmers increased by 4.83%, accounting for 31.62%. The proportion of enterprise profit slightly decreased by 1.35%, accounting for 47.22%. The proportion of supermarket profit decreased by 3.47%, accounting for 21.17%. The profit of supermarkets was reduced, the proportion of farmers’ profit distribution increased, and the profit of core enterprises stabilized. This profit distribution, considering investment costs and risks, is more reasonable and more conducive to improving the stability of the supply chain.
Compared with the Shapley value method to find the common benefit distribution of n enterprises, which needs to obtain (2n − 1) kinds of alliance logistics enterprises to benefit the situation, the Raiffa value method needs to know the benefit of (n + 1) kinds of alliances, which greatly reduces the difficulty of revenue information collection when n > 2, and overcomes the limitations of the Shapley value method; in addition, the Raiffa value method not only achieves fairness and rationality, but also takes into account the upper and lower limits of interest distribution. It considers the interest distribution from the perspective of the marginal contribution of participants to the cooperative alliance. To a certain extent, it can protect the weak. It has practical feasibility and is suitable for solving the profit-distribution problem in a cooperative game of multiple people.

5. Conclusions and Prospect

In the traceable green low-carbon agricultural product supply chain, the pricing decision is made using CVP analysis combined with the demand function, and the optimal pricing and its corresponding maximum profit are obtained through the model solution. For the supply chain, the total profit of the supply chain and the profit distributed to each member affect the supply chain development; as can be seen from the data in Table 13, the total profit of the supply chain under centralized decision-making is significantly higher than the sum of the profit of each member under decentralized decision-making; this shows that centralized decision-making in the traceable supply chain of green low-carbon agricultural products is more competitive than decentralized decision-making; therefore, the profit-distribution mechanism should be chosen to promote centralized decision-making in the supply chain and to facilitate an increase in profits for each member; the rationale for using the improved Raiffa value for profit distribution has already been elaborated on in the previous section. From the calculation of the Raiffa value to the improvement of the Raiffa value considering investment cost and risk factors, the fuzzy comprehensive evaluation method was used to obtain the risk coefficients borne by each member of the traceable green agricultural product supply chain, and the AHP method was applied to determine the respective weight coefficients of investment cost and risk, and to quantify the investment costs and risk factors of each member in profit distribution. The profits of each member increased more than before the centralized decision-making, and the distribution of increased profits of each member was adjusted scientifically and reasonably; the situation improved where the profits of green agricultural product producers are often suppressed by enterprises and sellers. In the profit-distribution management of green and low-carbon agricultural product supply chains, protection and support for the interests of vulnerable members were strengthened. Examples have shown that the improved distribution mechanism is more realistic and reasonable, which is conducive to the long-term stable development of the supply chain.
This work studied the pricing decision-making and profit-distribution mechanism to obtain the optimal profit under the centralized decision-making of green low-carbon agricultural product supply chains; it only involved the supply chain members as the market subject, without considering the government’s supportive policies or incentive mechanisms due to green and low-carbon practices. When using the improved Raiffa value for profit-allocation adjustment in an attempt to promote the production of green low-carbon agricultural products under centralized decision-making as well as fairness for each member of the supply chain, this study only considered the two factors of investment cost and risk, which is a limitation of this work; in fact, there are probably many more influencing factors, which are to be researched in the future.

Author Contributions

Methodology, G.X.; formal analysis, G.X.; resources, J.L.; data curation, J.J.; writing—original draft preparation, J.J.; writing—review and editing, S.J.; project administration, J.L.; visualization, G.X.; supervision, J.L.; project administration, J.J.; funding acquisition, S.J. All authors have read and agreed to the published version of the manuscript.

Funding

This research was not funded by any funding bodies.

Institutional Review Board Statement

Not applicable.

Informed Consent Statement

Not applicable.

Data Availability Statement

The data used to support the findings of this study are available from the corresponding author upon request.

Conflicts of Interest

The authors declare no conflicts of interest.

References

  1. Zhang, H.; Feng, F. Does Informal Environmental Regulation Reduce Carbon Emissions?—Evidence from a Quasi-natural Experiment of Environmental Information Disclosure. Res. Econ. Manag. 2020, 41, 62–80. [Google Scholar]
  2. Yao, S. Fuzzy-based multi-criteria decision analysis of environmental regulation and green economic efficiency in a post-COVID-19 scenario: The case of China. Environ. Sci. Pollut. Res. 2021, 28, 30675–30701. [Google Scholar] [CrossRef] [PubMed]
  3. Zhang, L.P.; Xue, L.; Zhou, Y. How do low-carbon policies promote green diffusion among alliance-based firms in China? An evolutionary-game model of complex networks. J. Clean. Prod. 2019, 210, 518–529. [Google Scholar] [CrossRef]
  4. Li, W.Y.; Tian, L.X.; Batool, H. Impact of negative information diffusion on green behavior adoption. Resour. Conserv. Recycl. 2018, 136, 337–345. [Google Scholar] [CrossRef]
  5. Chen, W.D.; Li, J.Q. Who are the low-carbon activists? Analysis of the influence mechanism and group characteristics of low-carbon behavior in Tianjin, China. Sci. Total Environ. 2019, 683, 729–736. [Google Scholar] [CrossRef] [PubMed]
  6. Yao, S.; Su, X. Research on the nonlinear impact of environmental regulation on the efficiency of China’s regional green economy: Insights from the PSTR model. Discret. Dyn. Nat. Soc. 2021, 2021, 5914334. [Google Scholar] [CrossRef]
  7. Cai, X.; Chen, J.; Xiao, Y.; Xu, X.; Yu, G. Fresh Product Supply Chain Management with Logistics Outsourcing. Omega 2013, 41, 752. [Google Scholar] [CrossRef]
  8. Liang, P.; Li, J. Research on Agricultural Products Supply Chain Alliance Profit Distribution Mechanism based on The Shapley Value. Commer. Res. 2013, 8, 191–194. [Google Scholar]
  9. Dai, P.H.; Xiang, Z.Y. Application research on profit distribution of vegetable supply chain—Based on the improved shapley value method. Guangdong Agric. Sci. 2014, 14, 208–213+228. [Google Scholar]
  10. Yang, J. Profit Distribution of Farmer–Supermarket Direct Purchase Model with Unequal Power. Issues Agric. Econ. 2019, 7, 93–102. [Google Scholar]
  11. Song, H.; Yu, K.K. Research on Configuration and Innovation of Service Supply Chain: A Case Study. J. Bus. Econ. 2008, 7, 3–8. [Google Scholar] [CrossRef]
  12. Song, Z.Z.; Tang, W.S.; Zhao, R.Q. A Simple Game Theoretical Analysis for Incentivizing Multi-modal Transpor tation in Freight Supply Chains.  Eur. J. Oper. Res. 2020, 283, 152–165. [Google Scholar] [CrossRef]
  13. Pan, W.; Pan, W.L.; Hu, C.; Tu, H.T.; Zhao, C.; Yu, D.; Xiong, J.; Zheng, G. Assessing the green economy in China: An improved framework. J. Clean. Prod. 2019, 209, 680–691. [Google Scholar] [CrossRef]
  14. Lilia, M.; Petr, S.; Sergey, E.; Maria, B. Improvement of Russian energy efficiency strategy within the framework of “green economy” concept based on the analysis of experience of foreign countries. Energy Policy 2019, 125, 478–486. [Google Scholar] [CrossRef]
  15. Xue, H.X. Research on the influencing factors and mechanism of green low-carbon production of farmers in China under the “double carbon” goal. Stat. Theory Pract. 2023, 4, 3–9. [Google Scholar]
  16. Liu, C. Research on the Development of Agricultural Product Logistics under the Background of “Double Carbon”. Logist. Eng. RIng Manag. 2023, 4, 89–92. [Google Scholar]
  17. Gao, L.X. The development strategy of green logistics of agricultural products under low carbon economy. China Logist. Purch. 2022, 12, 65–66. [Google Scholar]
  18. Gao, Y.; Yao, X.; Bai, Y.X.; Wu, Z.L. Active “Chain Chief” Empowers Green and Low-carbon Agriculture Industry Chain: Internal Mechanism and Realization Path. Economist 2022, 12, 116–124. [Google Scholar]
  19. Li, B. The realization path and Countermeasures of Henan agricultural green low-carbon transformation under the background of “double carbon”. Shanxi Agric. Econ. 2022, 19, 128–130. [Google Scholar]
  20. Tao, F.; Fan, T.J.; Lai, K.; Li, L. Impact of RFID technology on inventory control policy. J. Oper. Res. Soc. 2017, 68, 207–220. [Google Scholar] [CrossRef]
  21. Yang, H.X.; Chen, W.B. Game modes and investment cost locations in radio-frequency identification (RFID) adoption. Eur. J. Oper. Res. 2020, 286, 883–896. [Google Scholar] [CrossRef]
  22. Dai, B.; Nu, Y.; Xie, X.; Li, J.B. Interactions of traceability and reliability optimization in a competitive supply chain with product recall. Eur. J. Oper. Res. 2021, 290, 116–131. [Google Scholar] [CrossRef]
  23. He, X.D. Discussion on the Construction of Vegetable Quality and Safety Traceability System. Logist. Eng. RIng Manag. 2019, 41, 48–50. [Google Scholar]
  24. Ding, L.; Hu, B.; Chang, S.; Shi, C. A Game Analysis on RFID Technology and Parallel Importation Based on Gray Market Traceability. Chin. J. Manag. Sci. 2021, 29, 78–88. [Google Scholar]
  25. Yu, K.K. Information Integration and Quality Management of the Food Supply Chain: The Mediation of Vertical Integration and the Moderation of Environmental Uncertainty. Nankai Bus. Rev. 2020, 1, 87–97. [Google Scholar]
  26. Gao, Y.D.; Zong, Y.X.; Nie, C.H.; Wang, Q.; Qiu, Y.J. Typical model, risk identification and optimization suggestion of Hebei vegetable supply chain. China Cucurbits Veg. 2023, 36, 107–111. [Google Scholar]
  27. Chen, Y.J.; Zhou, A.L.; Xie, N.F.; Liang, X.H.; Wang, H.J.; Li, X.Y.; Shi, Y.X. An Agricultural Product Quality Safety Traceability System Based on Blockchain and the Internet of Things. J. Agric. Big Data 2020, 2, 61–67. [Google Scholar]
  28. Surasak, T.; Wattanavichean, N.; Preuksakarn, C.; Huang, C. Thai Agriculture Products Traceability System using Blockchain and Internet of Things. Int. J. Adv. Comput. Sci. Appl. 2019, 10, 578–583. [Google Scholar] [CrossRef]
  29. Feng, H.H.; Wang, X.; Duan, Y.Q.; Zhang, J.; Zhang, X.S. Applying blockchain technology to improve agri-food traceability: A review of development methods, benefits and challenges. J. Clean. Prod. 2020, 260, 121031. [Google Scholar] [CrossRef]
  30. Li, H.Z.; Huang, Z.C.; Tang, Y.J. Quality and Safety Management of Vegetable Supply Chain from the Perspective of Blockchain Empowerment. North. Hortic. 2021, 11, 160–165. [Google Scholar]
  31. Luo, L.; Wang, Y.L. Driving factors of agricultural products supply chain retroactive promotion based on the interests of participants. Jiangsu Agric. Sci. 2020, 6, 295–299. [Google Scholar]
  32. Yao, F.M.; Ju, J.Y.; Li, Y.; Duan, C.Q. Pricing Strategy of Traceable Agricultural Supply Chain Considering Altruistic Preferences under Government Sudsidies. Chinses J. Manag. 2023, 20, 759–768. [Google Scholar]
  33. Zhu, L.J. Economic analysis of a traceability system for a two-level perishable food supply chain. Sustainability 2017, 9, 682. [Google Scholar] [CrossRef]
  34. Xiao, K.H.; Yun, C. Research on the Optimal Pricing Strategy of Traceable Agricultural Products—Based on the analysis of revenue sharing theory. Price:Theory Pract. 2018, 9, 123–126. [Google Scholar]
  35. Zheng, Q.; Fan, T.J.; Hu, B.; Song, Y. Impact of traceability technology investment on supply chains for fresh product under pre-position warehouse mode. J. Ind. Eng. Eng. Manag. 2023, 4, 165–178. [Google Scholar]
  36. Hudakova, L.; Bajus, R. Analysis of the costs and revenues of agricultural products in the selected countries of Central Europe. Technol. Audit Prod. Reserves 2017, 4, 37–43. [Google Scholar] [CrossRef]
  37. Ji, W.; Liu, C.J. Analysis of Vegetable Logistics Cost: A Supply Chain Perspective. Logist. Technol. 2014, 33, 97–98. [Google Scholar]
  38. Wang, G.L.; Ma, C.X.; Zhou, X.J. Decisions of freshness-keeping and outsourcing strategies considering the cost advantage in a fresh product supply chain. J. Syst. Eng. 2023, 1, 101–120. [Google Scholar]
  39. Wang, M.M.; Jiang, W.W.; Zhu, X.X. Research on the Optimization of Supply Chain Financing Strategies for Fresh Agricultural Products under the Cost-sharing Contract. J. Yunnan Agric. Univ. (Soc. Sci.) 2023, 17, 116–126. [Google Scholar]
  40. Wu, C.; Xu, C.; Zhao, Q.; Lin, S. Research on financing strategy of low-carbon supply chain based on cost-sharing contract. Environ. Sci. Pollut. Res. Int. 2022, 29, 48358–48375. [Google Scholar] [CrossRef] [PubMed]
  41. Mao, L.S. Research on pricing strategy and production and marketing model of vegetable wholesale market from the perspective of supply chain. Master’s Thesis, Central South University of Forestry & Technology, Changsha, China, 2022. [Google Scholar]
  42. Xu, G.Z.; Jiang, Y.L. Pricing and Fresh-keeping Strategy for Fresh Agricultural Produce Supply Chain based on Quality Grades. Math. Pract. Theory 2021, 51, 321–328. [Google Scholar]
  43. Ye, J.; Gu, B.J.; Fu, Y.F. Pricing and Cold-chain Logistics Service Decisions of Fresh Agriculture Products Supply Chain under Different Trade Modes. Chin. J. Manag. Sci. 2023, 31, 95–107. [Google Scholar]
  44. Zheng, Q.; Zhou, L.; Fan, T.J.; Ieromonachou, P. Joint procurement and pricing of fresh produce for multiple retailers with a quantity discount contract. Transp. Res. Part E Logist. Transp. Rev. 2019, 130, 16–36. [Google Scholar] [CrossRef]
  45. Wei, G.X.; Gao, T.T. Decision Making of Joint Carbon Emission Reduction with Cost Sharing Contract in Retailer-Led Low Carbon Supply Chain. Ecol. Econ. 2022, 38, 32–39. [Google Scholar]
  46. Qiu, H.; Li, L.; Yang, H.Z. Benefit Coordination Numerical Analysis of Agricultural Products Supply Chain Considering the Effect of Output Rate on Sales Price. J. Syst. Sci. 2022, 30, 98–101. [Google Scholar]
  47. Gu, F.Z.; Yu, X. Profit distribution mechanism of agricultural supply chain based on fair entropy. PLoS ONE 2022, 17, 0271693. [Google Scholar] [CrossRef]
  48. Guo, F.F.; Ma, P.C.; Yang, L. Research on coordination and pricing strategy of agricultural product e-commerce supply chain considering sales effort. Prices Mon. 2023, 2, 16–22. [Google Scholar]
  49. Zhao, J.J.; Qi, J.L.; Zhu, R.Y.; Pu, Y.X.; Lu, X.L. Research on the Development of Ecological Agriculture from the Perspective of Benefit Distribution among Agricultural Industries: Taking Chinese Cabbage in Tonghai County as an Example. Ecol. Econ. 2021, 37, 112–118. [Google Scholar]
  50. Zhang, X.C.; Yang, D.H.; Wang, L.H. Research on Construction of Benefit Allocation Mechanism of Vegetable Supply Chain Among Beijing City, Tianjin City and Hebei Province. Agric. Econ. Manag. 2018, 2, 18–26. [Google Scholar]
  51. Xie, R.H.; Liao, J.; Lai, Y.R. An Empirical Studyon Profit Distribution of Vegetable Supply Chain: Based on Stackelberg Game. J. Guangzhou Univ. (Soc. Sci. Ed.) 2017, 6, 61–67. [Google Scholar]
  52. Liang, P. The application of CVP analysis method in the annual profit target management of enterprises. Manag. J. 2010, 18, 166. [Google Scholar]
  53. James, A. Yunker; Dale Schofield. Pricing training and development programs using stochastic CVP analysis. Manag. Decis. Econ. 2005, 3, 191–207. [Google Scholar]
  54. Diskin, A.; Koppel, M.; Samet, D. Generalized Raiffa Solutions. Games Econ. Behav. 2011, 73, 452–458. [Google Scholar] [CrossRef]
  55. Kikuta, K. A Lower Bound of an Imputation of a Game. J. Oper. Res. Soc. Jpn. 2017, 21, 457–468. [Google Scholar]
Figure 1. General overview of the model and the relationship between its components.
Sustainability 16 02087 g001
Figure 2. Image of sales price to profit expression.
Sustainability 16 02087 g002
Figure 3. Hierarchy model.
Sustainability 16 02087 g003
Figure 4. Proportion of profit distribution of members.
Sustainability 16 02087 g004
Table 1. Profit distribution of traceable “strawberry tomatoes” (RMB/catty).
Participating MembersFarmerEnterpriseSupermarketUnit Premiums
Additional increase in costs0.50.80
Unit premium according to the proportion of profit distribution0.591.070.542.2
Table 2. Calculation of profit distribution of members (unit: RMB).
FarmerEnterpriseSupermarket
V (N)1,627,2201,627,2201,627,220
V(N/i)984,000692,0001,013,000
x ¯ i (the lower limits of profit distribution)360,500652,500331,500
x ¯ i (the upper limits of profit distribution)643,220935,220614,220
x i 476,657695,657454,907
Table 3. Factor i vs. factor j.
Factor i vs. Factor jEqual ImportanceSlightly ImportantMore ImportantStrong ImportanceExtremely Important
Quantitative value13579
Middle adjacent Judgment value2468
Table 4. Comparison of the importance of members as factors in the distribution of benefits.
ZA1A2A3
A112/33/2
A23/215/2
A32/32/51
Sum19/631/155
Table 5. Weights of members.
ZA1A2A3WAW
A10.320.320.30.310.94
A20.470.480.50.491.46
A30.210.200.20.200.61
Table 6. Comparison of the weight of investment cost and risk bearing of the farmer.
A1 FarmerB1 Investment CostsB2 Risk Bearing
B1 Investment costs12/3
B2 Risk bearing3/21
Sum5/25/3
Table 7. Comparison of the weight of investment cost and risk bearing of the enterprise.
A2 EnterpriseB1 Investment CostsB2 Risk Bearing
B1 Investment costs12
B2 Risk bearing1/21
Sum3/23
Table 8. Comparison of the weight of investment cost and risk bearing of the supermarket.
A3 SupermarketB1 Investment CostsB2 Risk Bearing
B1 Investment costs13/2
B2 Risk bearing2/31
Sum5/35/2
Table 9. Weight of investment cost and risk bearing of the farmer.
A1 FarmerB1 Investment CostsB2 Risk BearingWAW
B1 Investment costs0.40.40010.40.8
B2 Risk bearing0.60.599880.61.2
Table 10. Weight of investment cost and risk bearing of the enterprise.
A2 EnterpriseB1 Investment CostsB2 Risk BearingWAW
B1 Investment costs0.670.670.671.33
B2 Risk bearing0.330.330.330.67
Table 11. Weight of investment cost and risk bearing of the supermarket.
A3 SupermarketB1 Investment CostsB2 Risk BearingWAW
B1 Investment costs0.599880.60.599941.2
B2 Risk bearing0.400120.40.400060.8
Table 12. Weight of investment cost and risk bearing of members.
ZB1 Investment CostsB2 Risk Bearing
A1 Farmer0.310.40.6
A2 Enterprise0.490.670.33
A3 Supermarket0.200.599940.40006
Weight score 0.570.43
Table 13. Comparison of profit distribution among members.
Decentralized Decision-Making ProfitRaiffa Value ProfitImproved Raiffa Value ProfitValue Added of Profit before Centralized Decision-Making
Farmer300,000476,657514,381.85214,381.85
Enterprise544,000595,657768,357.08224,357.08
Supermarket275,000454,907344,471.6468,471.64
Total1,120,0001,627,2201,627,220507,220
Disclaimer/Publisher’s Note: The statements, opinions and data contained in all publications are solely those of the individual author(s) and contributor(s) and not of MDPI and/or the editor(s). MDPI and/or the editor(s) disclaim responsibility for any injury to people or property resulting from any ideas, methods, instructions or products referred to in the content.

