Article

A Formulation Model for Computations to Estimate the Lifecycle Cost of NiZn Batteries

by
Ashwani Kumar Malviya
1,*,
Mehdi Zarehparast Malekzadeh
1,
Francisco Enrique Santarremigia
1,*,
Gemma Dolores Molero
1,
Ignacio Villalba-Sanchis
2 and
Victor Yepes
2
1
Research & Innovation Projects, AITEC, Parque Tecnológico, C/Charles Robert Dawrin, 20, 46980 Paterna, Valencia, Spain
2
Institute of Concrete Science and Technology (ICITECH), Universitat Politècnica de València, 46022 Valencia, Spain
*
Authors to whom correspondence should be addressed.
Sustainability 2024, 16(5), 1965; https://doi.org/10.3390/su16051965
Submission received: 31 January 2024 / Revised: 23 February 2024 / Accepted: 24 February 2024 / Published: 27 February 2024

Abstract

:
The increasing demand for electricity and the electrification of various sectors require more efficient and sustainable energy storage solutions. This paper focuses on the novel rechargeable nickel–zinc battery (RNZB) technology, which has the potential to replace the conventional nickel–cadmium battery (NiCd), in terms of safety, performance, environmental impact, and cost. The paper aims to provide a comprehensive and systematic analysis of RNZBs by modeling their lifecycle cost (LCC) from cradle to grave. This paper also applies this LCC model to estimate costs along the RNZB’s lifecycle in both cases: per kilogram of battery mass and per kilowatt hour of energy released. This model is shown to be reliable by comparing its results with costs provided by recognized software used for LCC analysis. A comparison of LCCs for three widely used battery technologies: lead–acid, Li-ion LFP, and NMC batteries, which can be market competitors of NiZn, is also provided. The study concludes that the NiZn battery was found to be the cheapest throughout its entire lifecycle, with NiZn Formulation 1 being the cheapest option. The cost per unit of energy released was also found to be the lowest for NiZn batteries. The current research pain points are the availability of data for nickel–zinc batteries, which are in the research and development phase, while other battery types are already widely used in energy storage. This paper recommends taking into account the location factor of infrastructures, cost of machinery, storage, number of suppliers of raw materials, amount of materials transported in each shipment, and the value of materials recovered after the battery recycling process to further reduce costs throughout the battery’s lifecycle. This LCC model can be also used for other energy storage technologies and serve as objective functions for optimization in further developments.

1. Introduction

Throughout history, electricity has transformed from a luxury to a daily need, and it is now crucial for ensuring the standard of living for billions of people worldwide. To balance the demand for electricity from various energy sources, an increase in electricity output is thus required. The high-level deployment of energy storage, including the storage of electrical energy and hydrogen, is required owing to the rising electrification of end-user sectors and businesses [1]. The electrification of transportation has also grown significantly during the last ten years, and this trend is anticipated to remain for the foreseeable future [2]. Battery technologies offer the potential to assist the power quality and security in energy networks with a significant proportion of intermittent renewable power sources [3]. Electrochemical battery technologies may serve both power and energy applications because of their quick reaction times and scalability, which cover a variety of storage solutions in the electrical system. As the amount of variable renewables rises, energy storage based on fast-advancing batteries and other technologies will provide more systemic flexibility [4]. However, there are several technical and scientific obstacles to large-scale energy storage applications, including those related to safety, dependability, cost, and industrial acceptance [5,6,7,8]. Therefore, it is crucial to do research and development in the years leading up to 2030 to guarantee that future solutions are developed, tested, and prepared for scalability when required.
Zinc anodes have recently been utilized in rechargeable battery systems owing to a resurgence in interest in zinc batteries, with three primary systems at the frontlines: zinc–air (Zn–air), zinc manganese dioxide (ZnMnO2), and nickel–zinc (NiZn) [9]. The safety and inherent features of the NiZn electrochemical system have long been acknowledged, yet the system’s limited cycling life has hampered its significant advancement and commercialization. After 20 years of research and development in cell component formulations, compositions, and designs, recent technological developments have succeeded in overcoming this obstacle (European patent of Sunergy: EP 3 780 244 B1, https://data.epo.org/publication-server/document?iDocId=6950339&iFormat=0 (accessed on 30 January 2024)) [4]. Rechargeable nickel–zinc battery (RNZB) technology can be seen as a substitute for the well-known and proven nickel–cadmium (NiCd) battery, with additional benefits including the absence of harmful materials, increased performance, improved environmental sustainability, and lower cost.
In this paper, we have established mathematical models through an extensive literature review for the estimation of the lifecycle cost and novel NiZn battery from the cradle-to-grave approach. This study can also be applied to estimate the cradle-to-grave LCCA for any new energy storage technology. The models established in this paper will serve as objective functions for the heuristic optimization of the cost and environmental impact of NiZn batteries.
This study compares the cost of NiZn batteries with those of four mature battery technologies for stationary applications, which can be a competitor to fulfill the huge demand for batteries in the near future. The charging stations of EVs (electric vehicles) and the storage of renewable energy to supply power to residential buildings could be examples of these demands.

2. Methodology: Cost Function

This study’s methodology has been developed following the guidelines of the ISO standards for life cycle costing. IEC 60300-3-3:2017, an international standard, sets out the criteria for life-cycle-costing assessment in the standard’s documents [10].
The complete lifecycle of NiZn batteries has been split into six steps to obtain a clear understanding of the material (M) and energy (E) inputs and waste (W) generated to conceptualize the cost and environmental impact (Figure 1).
The life-cycle-costing method enables us to assess a product’s cost across its entire lifecycle. The LCCA has been used for technoeconomic sustainability analyses in the construction industry since its inception [11]. The cost function has been modeled following the IEC 60300-3-3:2017 guideline [12], breaking down the cost structure for each stage of the lifecycle of the product while defining the cost elements for which data can be collected. During the process of data collection, it has been realized that the cost data of each raw material can be obtained from different suppliers and locations. Therefore, the costs of step 1 (raw material acquisition) and step 2 (material processing) (Equations (3)–(8)) have been combined as the cost of raw materials because the acquired materials can directly be used in the battery manufacturing process. The cost in step 3 (manufacturing and assembly) has been modeled in Equations (9)–(12).
When the state of health (SoH) of the battery decreases to 70%, it is considered that the battery has ended its life [13], but the battery can still be used for another case, depending on the requirements of the use case, which is known as the reuse of batteries. The cost in step 4 (use and service) has been modeled in Equations (14)–(17). The process for restoring a product to its original specifications using a combination of new, repaired, and used parts is called remanufacturing [14]. Some independent companies remanufacture batteries based on nickel metallic cells without welded cell battery packs [15]. A simulation model by Mathew et al., 2017 [16], shows that only a few cells are degraded when the battery reaches its end of life; a cell-shorting method can be used to identify them [15]. The replacement of just 5–30% of cells in the battery pack can restore the state of health of the battery to more than 95% [16]. Therefore, after decommissioning the battery from service, it can be reused, recycled, dismantled, and recovered from secondary-use raw materials as well as disposed to a landfill. The cost incurred during these processes is called the end-of-life cost. In our model, we have also combined the costs of step 5 (retirement and recovery) and step 6 (disposal treatment), modeled in Equations (18)–(27), as end-of-life costs.

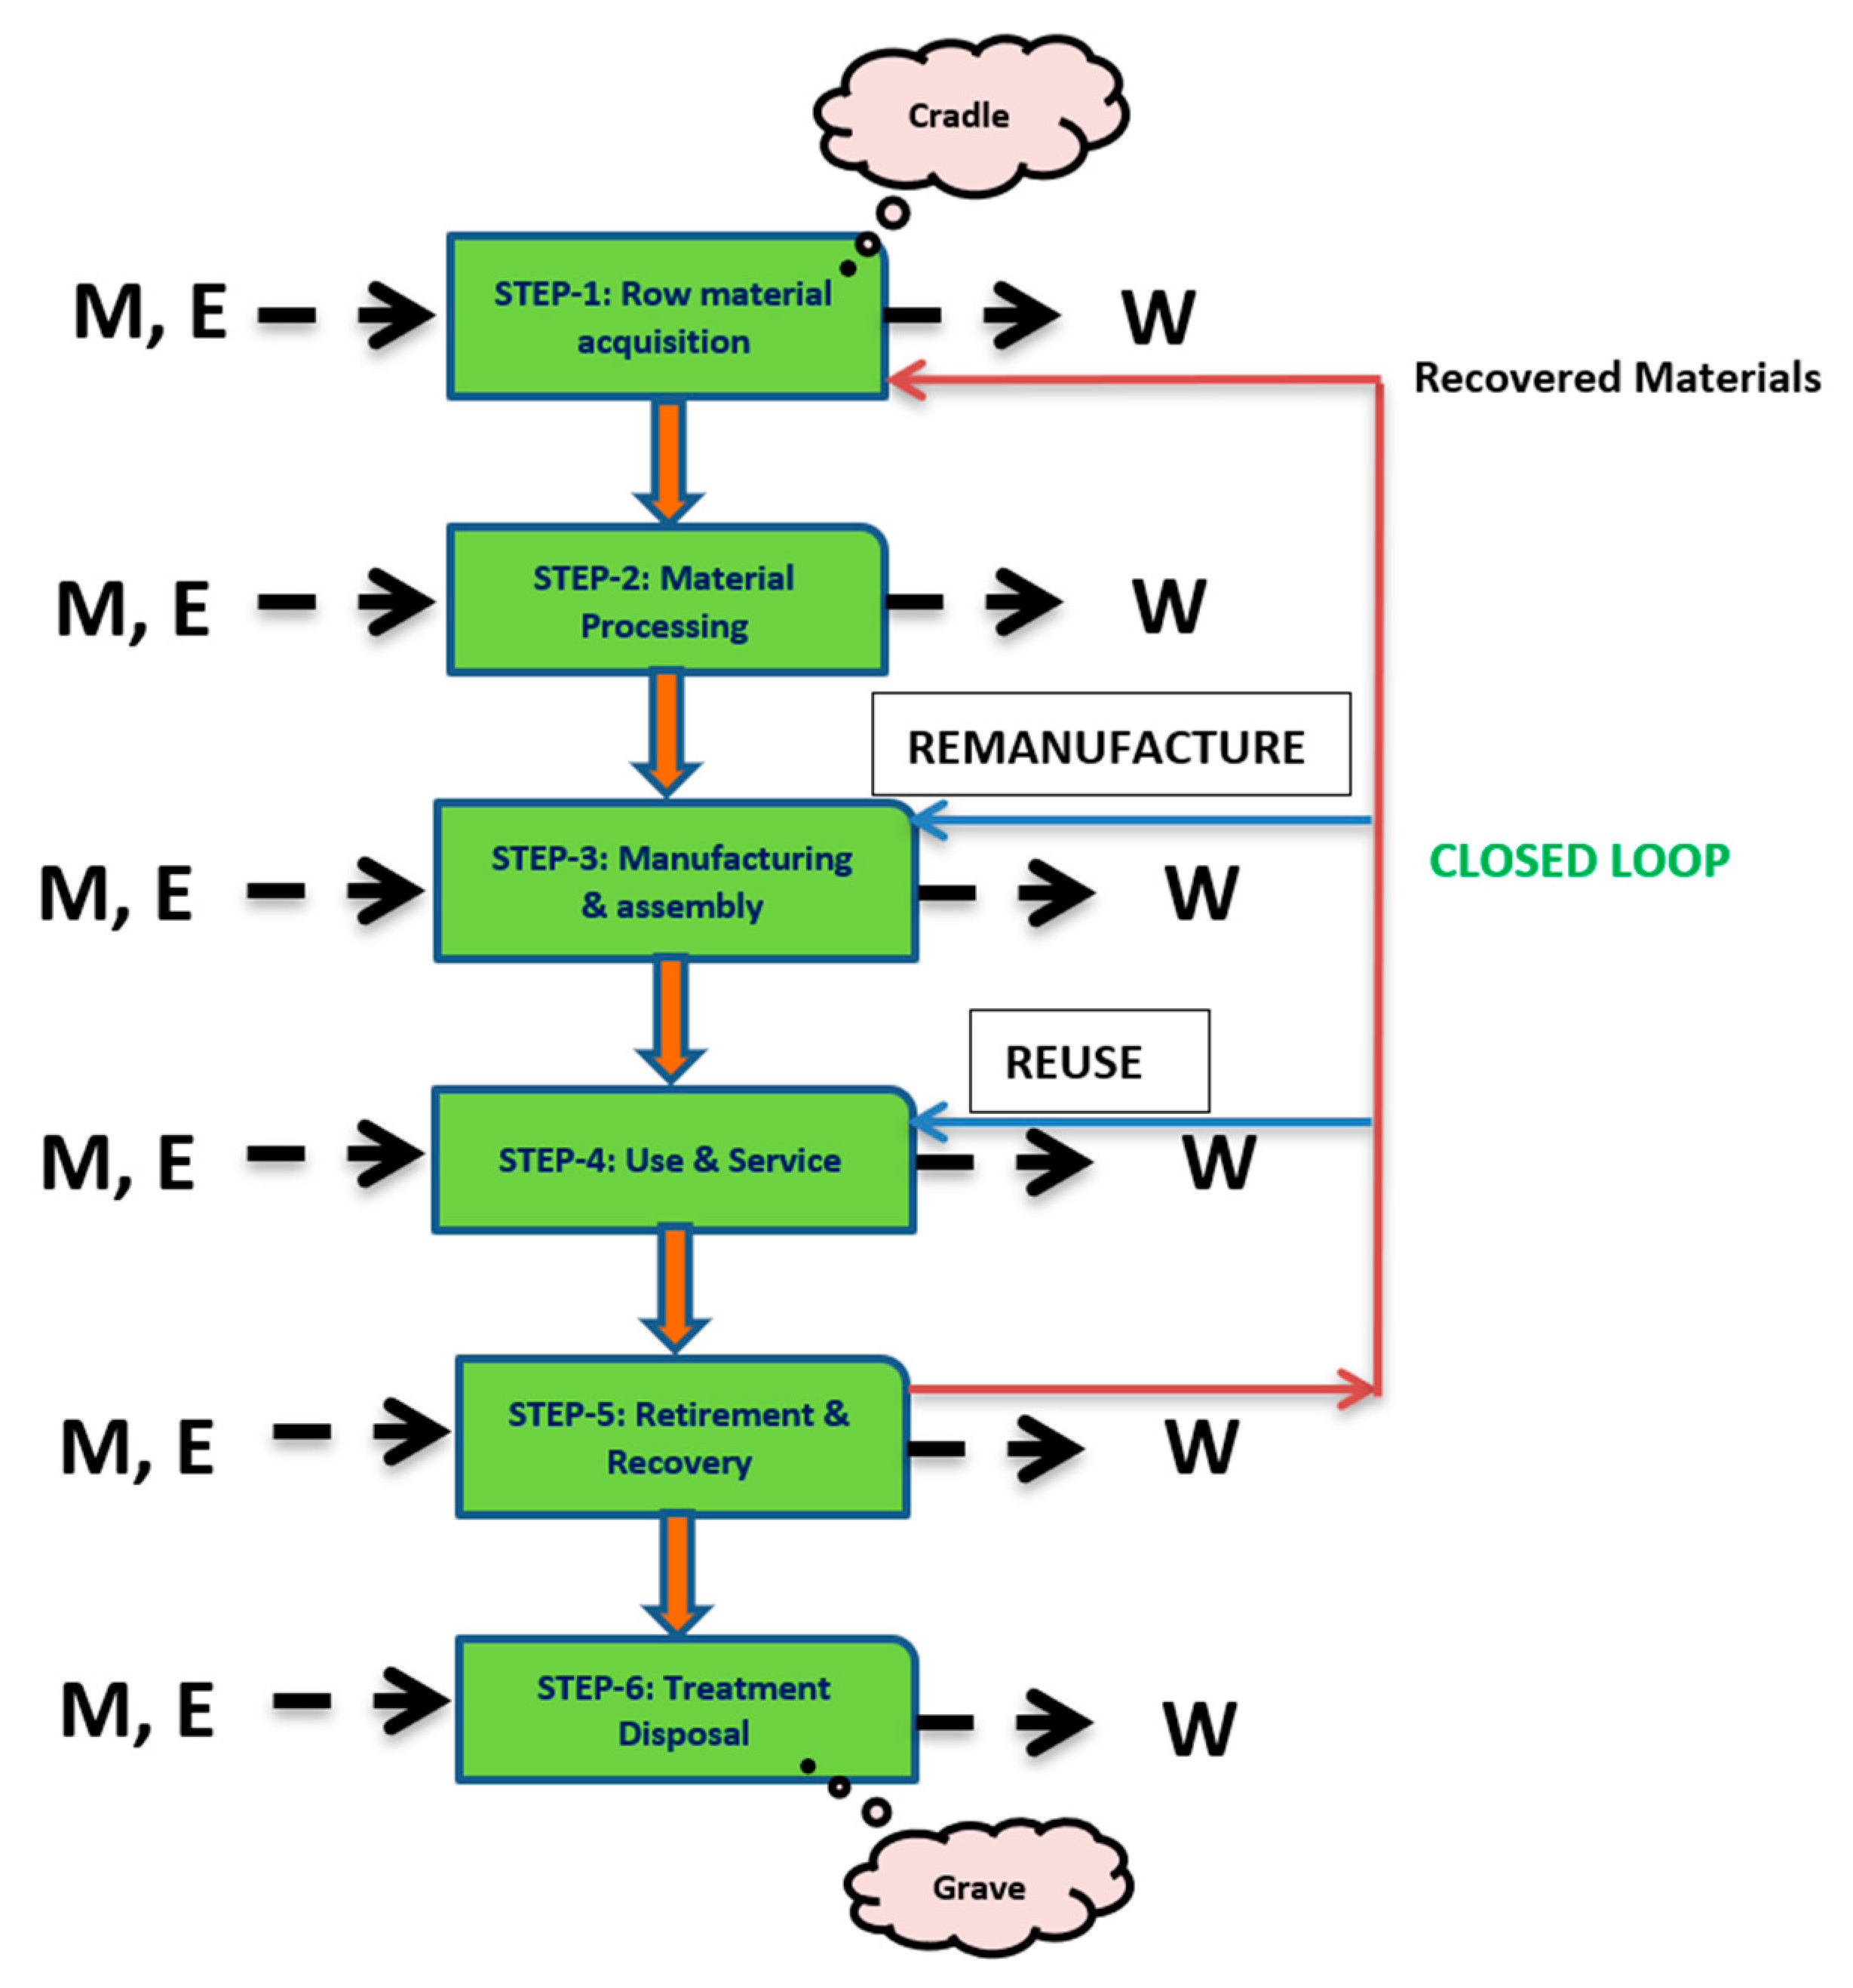
3. Lifecycle Cost Modeling

The lifecycle cost of the energy storage system is calculated in terms of the levelized cost of energy (LCOE) [3,17,18], which is the ratio of the total cost of the energy storage system to the amount of stored energy. Taking the consideration of customer’s perspective, five stages of the product’s life have been included in the model, making it a cradle-to-grave study, and given by Equation (1) [19].
The methodological flowchart depicted in Figure 1 and the associated life-cycle-cost modeling detailed in this section are independent of technological advancements in the field of batteries and NiZn batteries. To correctly measure the lifecycle cost of the system by considering the future developments and inflation that occur during the life of the product, the concept of the net present value (NPV) [19,20,21] must be introduced in Equation (1) [19].
With the implementation of the NPV in the equation of the LCC, it will translate to Equation (1). The investment cost ( C I ) and the end-of-life cost ( C E o L ) are one-time costs; hence, they will be constant at any given time.
L C O E = t = 0 L   C I 1 S G 100 1000 + C O & M 1 + r 100 t + C E o L 1 + r 100 t t = 0 L E 1 + r 100 t  
  • C I = acquisition or capitol or investment cost (€/kWh);
  • S G = subsidy by the government (%);
  • C O & M = operation and maintenance costs (€/kWh);
  • C E o L = cost at the end of life (€/kWh);
  • E = energy stored in or discharged from the battery (kWh);
  • Wp = wattage peak;
  • L = duration of the lifetime of the battery in years;
  • r = discount rate (%);
  • t = time in years.
The LCOE quantifies the lifecycle cost of the energy generation technology more accurately [22]. The estimation of the lifecycle cost of electricity storage systems, including battery storage systems, is best represented by the levelized-cost-of-storage (LCOS) term. This method is based on the LCOE method but with minor adjustments that distinguish between electricity generation systems and electricity storage systems.

3.1. Capital Cost ( C I )

The total capital cost of an energy storage system consisting of batteries should be estimated by combining three cost components, i.e., the cost of power electronics, cost of batteries, and cost of the balance of power [23]. Kendall et al., 2020 [24], suggest estimating the capital cost of the electrochemical energy system in €/kWh, and for batteries, the capital cost is applicable to the procurement of direct-current (DC) energy storage units and does not include power conversion units and balance-of-power costs. We modelled the estimation of the capital cost for NiZn batteries by considering the cost of raw materials and the cost for manufacturing the battery (see Equation (2)).
C a p i t o l   C o s t   C I = C o s t   o f   r a w   m a t e r i a l s   C 1 + C o s t   f o r   m a n u f a t u r i n g   C m .

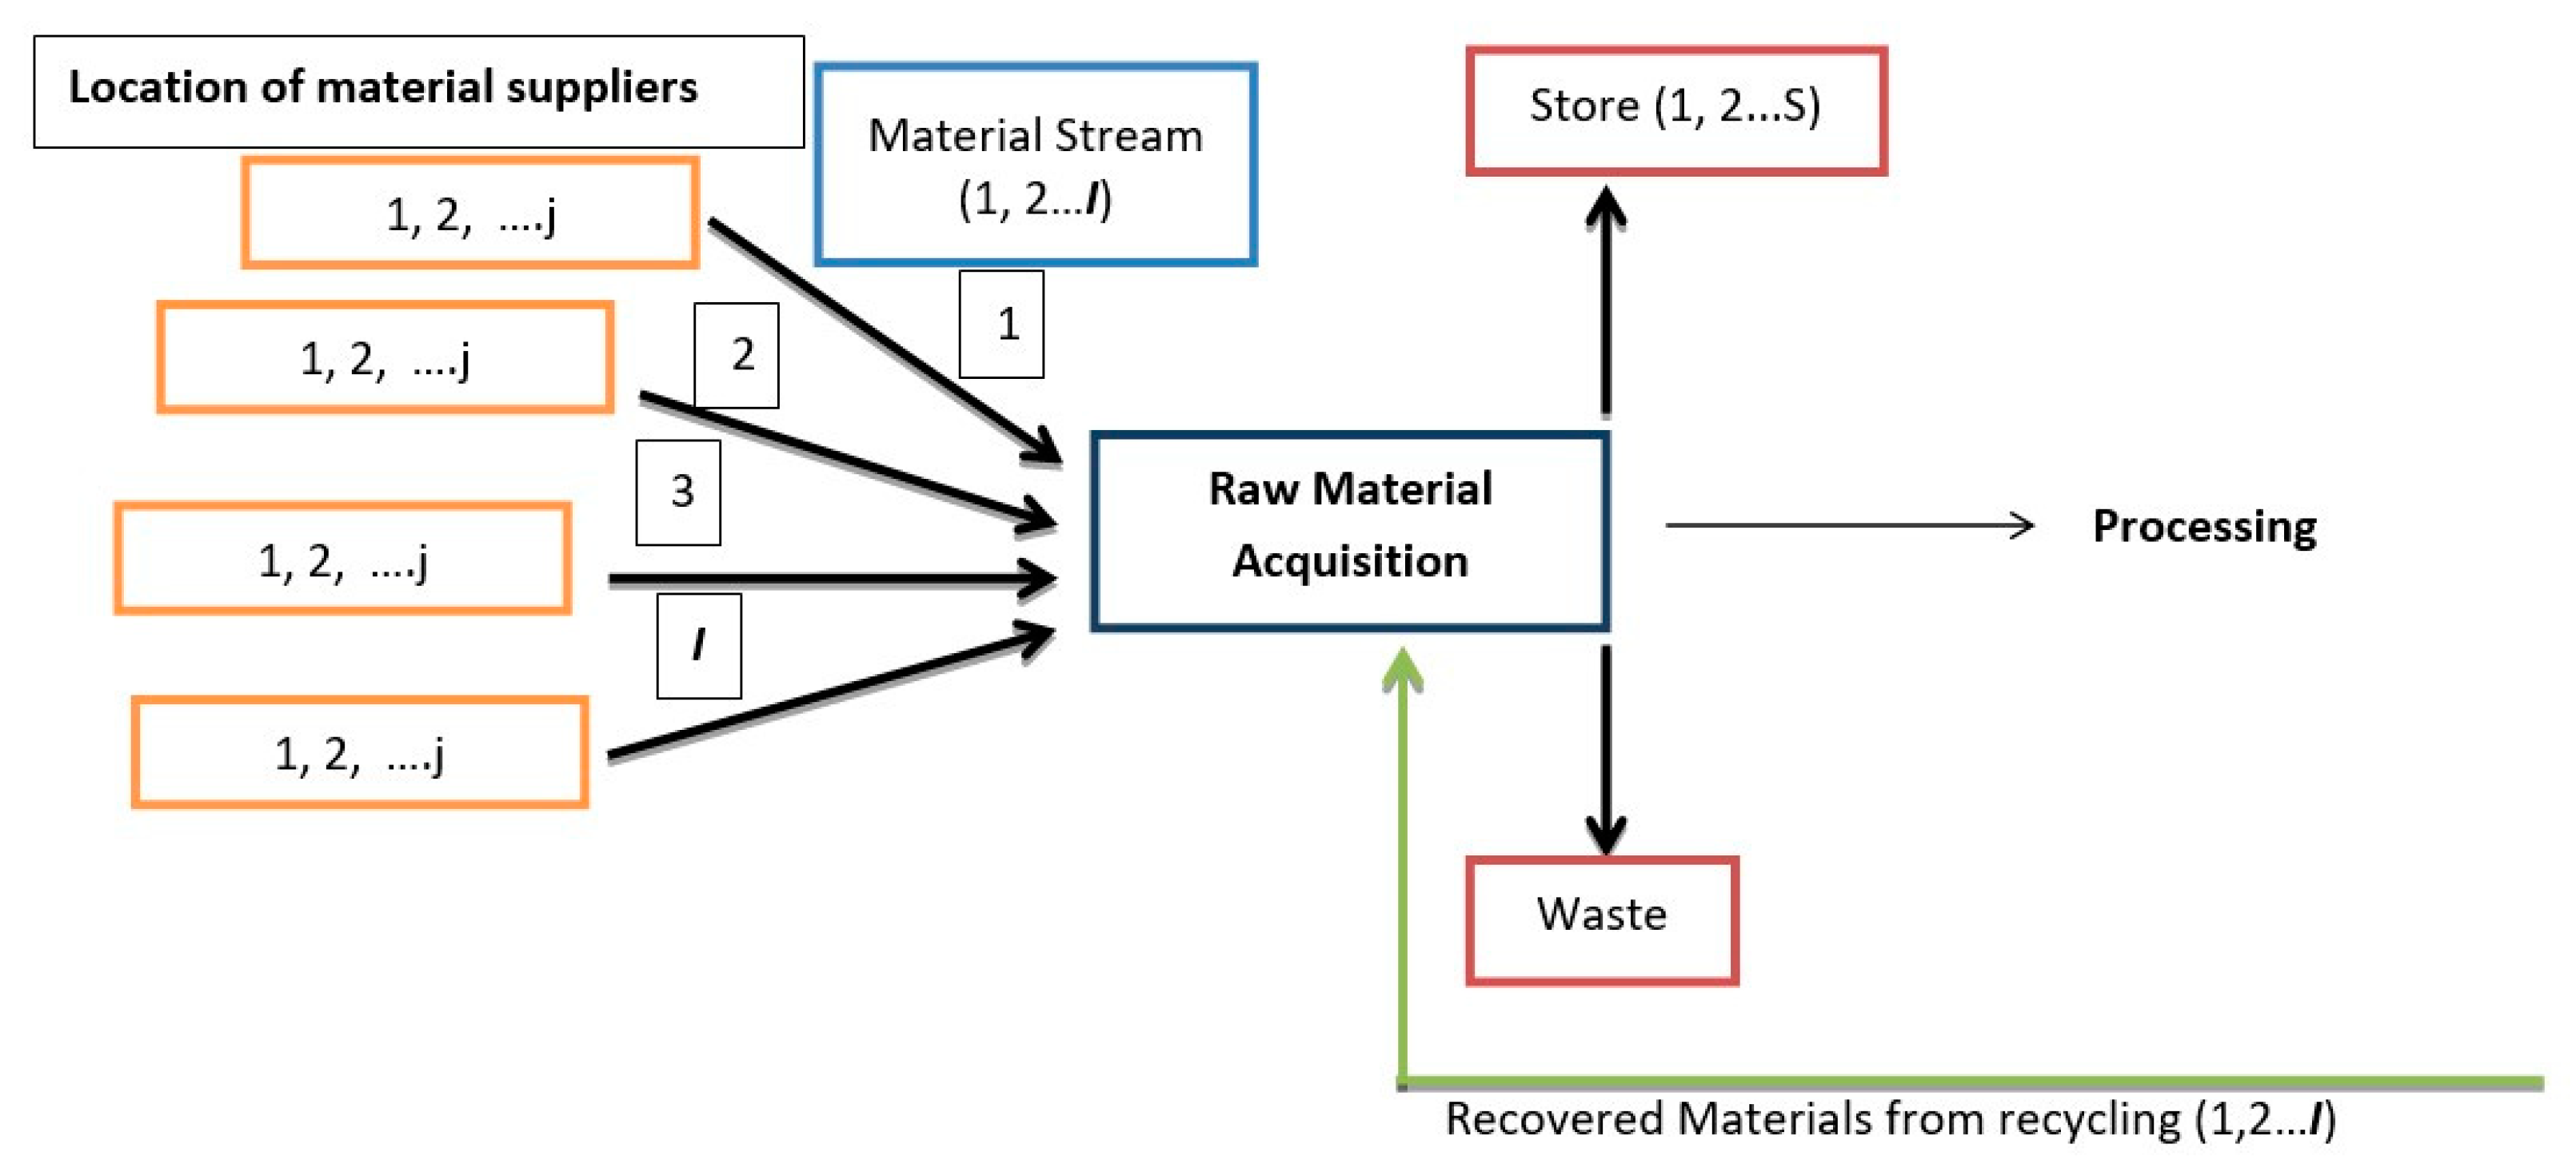
3.1.1. Cost of Raw-Material Acquisition C 1

Figure 2 shows the flow of the material needed for the NiZn battery. Herein, it shows that material i can be supplied by j suppliers at different locations.
The definitions of the variables used in the modeling of the cost function are shown below [25]:
  • 1   i   I = number   of   materials   coming   in ;
  • 1   j   J = number   of   suppliers   at   different   locations ;
  • C v , i , j = cost   of   virgin   material   i     per   ton   from   supplier   j ;
  • C r , i , j = cost   of   recovered   material   i     per   ton   from   location   j ;
  • C t , i , j = cost   of   transportation   of   material   i     per   ton   per   km   from   supplier   j ;
  • m i , j = amount   mass   of   material   i   supplied   from   supplier   j   tons ;
  • d i , j = transportation   distance   of   material   i   supplied   from   supplier   j   by   all   modes   of   transportation   km ;
  • m i , s = amount   mass   of   material   i   allocated   to   storage   site   s   tons ;
  • D i , j = maximum   demand   of   material   i   from   supplier   j   tons ;
  • M i = total   supply   of   material   i   tons ;
  • R i = amount   mass   of   material   i   recovered   from   recycling   tons ;
  • C I , i = inventory   capacity   of   material   i   tons .
The total cost of the material to be acquired (€) = the cost of the virgin material + the cost of the recovered material.
Hence,
The   total   cost   of   all   the   virgin   materials   acquired = i = 1 I j = 1 J m i j × C v , i
Therefore, the cost to purchase all the materials acquired at the first place (€), including the cost of recovered materials acquired from the spent batteries, is as follows:
C T m = i = 1 I j = 1 J m i j × C v , i + R i × C r , i
The amount of the supply of material i (tons) = the amount of virgin material i supplied from all the suppliers (j) + the amount of recovered material i that was acquired.
Therefore, the net amount of the material acquired, M = i = 1 I M i .
Replacing the expressions for M i gives
M = i = 1 I j = 1 J m i , j + R i
Let us define some more variables related to the storage of the materials as follows:
  • C s , i = storage   cost   of   material   i   at   storage   facility   s     per   ton ;
  • m s , i = amount   of   material   i   allocated   to   storage   facility   s   tons ,
where s = 1 , 2 , S .
The storage cost of material i at storage facility s   = m s , i × C s , i .
The cost of the storage of material i at all the storage facilities = s = 1 S m s , i × C s , i .
Therefore, the cost of the inventory storage is
C T s = i = 1 I s = 1 S m s , i × C s , i
where [25] m s , i 0.05 × j = 1 J m i , j .
The modeling of the transportation cost has been conducted by taking into consideration the cost (in €) of all the modes of transportation from the origin to the destination.
The transportation cost of material i from supplier j = m i , j × d i , j × C t .
Therefore, the total cost of the transportation for the acquisition of material i from supplier j is
C T t = i = 1 I j = 1 J m i , j × d i , j × C t
The net cost of the acquisition of all the materials can be estimated by adding all the components, i.e.,
C 1 = t o t a l   c o s t   o f   m a t e r i a l s   p u r c h a s e d   C T m + t o t a l   c o s t   o f   t r a n s p o r t a t i o n   o f   p u r c h a s e d   m a t e r i a l s   C T s + t o t a l   c o s t   o f   s t o r a g e   o f   i n v e n t o r y C T t :
C 1 = i = 1 I j = 1 J m i , j C v , i + R i C r , i + j = 1 J m i , j d i , j C t , i , j + s = 1 S m s , i C s , i

3.1.2. Cost of Manufacturing ( C m   )

Ahmed et al., 2019 [26], suggested that battery manufacturing costs can be modeled by considering the cost of cell manufacturing. The manufacturing cost’s modeling is based on plant design and economics for chemical engineers developed by Prof. James J. Carberry et al. in 1991 [27] (Table 1).
As per Table 1, the first component of the manufacturing cost, i.e., the total variable cost, can be developed as follows:
C v c = material cost ( C 1 ) + direct labor cost ( C D L ) + variable overhead cost ( C v o ) + utility cost ( C u t m ).
The utility cost should also be a part of the variable cost and always falls in the range of 10–20% of the total production cost [28]. This cost of utilities is the sum of the electricity ( / kWh ), gas ( / 1000   m 3 or   L ), and water ( / L ) costs. It should be modeled separately with the information of the machinery and energy requirements in each process as well as energy mixes in different countries. The variable overhead cost is the sum of 40% of the direct labor cost and 20% of the depreciation ( C D e p ) (Table 1); the total variable cost can be modeled as in Equation (9).
C v c = C 1 + 1.4 C D L + 0.2 C D e p + C u t m
The fixed expenses in the manufacturing of batteries will be modeled based on information collected in Table 1
F E = depreciation ( C D e p ) + general service and administration costs ( C G S A ) + R&D cost ( C R & D )
Ahmed et al., 2019 [26], suggested that general service and administration costs for a battery-manufacturing plant are 25% of the total sum of the direct labor cost, variable overhead, and depreciation and that the cost of research and development is 40% of the depreciation. Hence, the fixed expenses can be written as follows:
F E = 1.7 C D e p + 0.35 C D L
In economics, the warranty cost of a product is defined as the ratio of the net sold quantity to the net rejected quantity of the product at a given time and multiplying this ratio by the unit cost of the product, assuming a maximum of 5% of the product in the market may be rejected. Ahmad et al., 2019 [26], summarized the warranty cost of their EverBatt as 5% of the sum of the total variable costs, fixed expenses, and profit values.
Hence, the main variable inputs in the model for the manufacturing costs of a battery production plant with an annual capacity to produce N cells are the cost of raw materials, cost of utilities, the direct labor cost, and depreciation costs that have been modeled as in Equation (11).
Manufacturing cost (Cm) = 1.05 (C1 + Cutm + 1.75 ∗ CDL + 1.9 ∗ CDep + Profit)
Hence, the cost (in €) for manufacturing per cell is
C 3 = C m N
The total labor cost is a variable that depends on the location and capacity of the plant and is the multiplication of the average labor rate in the country by the total labor hours required to run a plant producing N cells per year. According to Ahmed et al., 2019 [26], the cost of depreciation can be considered as the sum of around 17% of the costs of all the equipment and 5% of the cost of the building. The costs of the equipment and building may vary based on the location of the plant, which makes the depreciation cost a location-dependent variable in our model.

3.2. Cost of Use and Service ( C O & M )

A good number of studies have been conducted about the estimation of energy storage costs and sustainable infrastracture design [29]. Rahman et al., 2021 [30], developed a technoeconomic model for electrochemical energy storage. The use and service cost of energy storage systems has always been referred to as the operation and maintenance cost in terms of the levelized cost [3,19,31], which is the cost that the operator or owner is willing to pay per year for the service of the energy storage system, in €/KW year, or it can be converted to euros per kilowatt hour using the number of hours operated per day [31]. As mentioned in the previous section, the levelized annual costs (LACs) include the total cost of the energy storage system, but in this section, our interest is only the operation and maintenance part, which is the energy cost of the storage. Poonpun et al., 2008 [23], presented a technique to estimate the energy cost of the storage, which refers to each unit of energy (KWh) that is stored and later released to the grid. The operation and maintenance cost can be written as the sum of the operation cost ( C O P ) and the fixed ( C M f ) and variable ( C M v ) components of the maintenance cost (Equation (13)) [32].
C o & M = C O P + C M f + C M v
The novel NiZn battery under development has been planned for stationary applications in which the operation cost that the owner will be willing to pay is the cost of the electricity withdrawn from the grid to charge the battery. This cost can also be referred to as the charging cost of the battery [33]. The amount of energy withdrawn from the grid to charge the battery per cycle will be the ratio of the energy released by the battery during discharging at the operational DoD and the roundtrip efficiency.
E n e r g y   w i t h d r a w n   f r o m   g r i d   f o r   p e r   c y c l e   c h a r g i n g   E c h a r g i n g = r a t e d   p o w e r   c a p a c i t y   o f   b a t t e r y   P D o D H o η r o u n d t r i p
where H o is the number of hours it takes to charge the battery to the 100% state of charge (SoC). If C e is the cost per unit of energy, the cost for charging the battery, or the operation cost, in €/cycle, is as follows:
C O P = P D o D H o η r o u n d   t r i p C e
The fixed component of the maintenance cost ( C M f ) includes periodic maintenance and yearly refurbishment costs, whereas the variable component of the maintenance cost ( C M v ) includes the unscheduled maintenance, repair, and replacement of failed battery cells [32]. If C M c e l l is the variable maintenance cost per cell of the battery pack and p f a i l is the probability of the failure of a cell in the battery pack, the maintenance cost per kilowatt hour per cycle is as follows:
C M f + C M v = C M f + p f a i l n C M c e l l
Hence, the final model for the operation and maintenance cost, in €/cycle, is as follows:
C o & M = P D o D H o η r o u n d t r i p C e + C M f + p f a i l n C M c e l l P

3.3. End-of-Life Cost ( C E o L )

After serving for L years, the decommissioned battery pack should be removed from the system. At the end of the life of the battery, the active materials can be recycled, recovered, and fed for reuse as secondary raw materials in step 1. Some parts of the battery that are not suitable for recycling or reuse must be disposed of in a landfill. The end-of-life (EoL) cost of batteries consists of four components: the cost of the transportation of the spent battery packs that were collected, the dismantling cost of the battery packs at the recycling facility, the cost for recycling, and the cost of the disposal of the remains [34]. Depending on the recycling process and the materials used for the pack, the materials recovered from the cells are sold again. Therefore, in addition to expenses, revenues must also be taken into account when calculating the cost for recycling batteries [26,34,35].
C E o L = t r a n s p o r t a t i o n   c o s t   C T R + d i s m a n t l i n g   C o s t   C D i s R + r e c y c l i n g   c o s t   C R e c + d i s p o s a l   c o s t   C D i s r e v e n u e
EverBatt [26] has proposed the transportation cost model as follows:
t r a n s p o r t a t i o n   c o s t = m l d i s t a n c e m , l × u n i t   c o s t l
In this equation (Equation (19)), distancem,l indicates the distance transported by mode m for segment l (in km), and unit costl is the unit cost of the transportation by mode m (in €/kg/km). If Equation (11) is divided by the energy density of the battery ( E b a t t ), which is the ratio of the rated capacity of the battery to the mass of the battery package, we can obtain the consistent unit of the transportation cost (in €/kWh) (Equation (20)) as follows:
C T R = m l d i s t a n c e m , l × u n i t   c o s t l E b a t t
Before any of its components can be reused, remanufactured, or recycled, a product must be disassembled partially or in its entirety. In the process for recovering a product, dismantling is an inevitable step that cannot be bypassed [36]. The dismantling cost ( C D i s R ) depends on the labor cost at the disassembly plant’s location, disassembly time, and instruction time per step in the dismantling process [36,37]. If we assume that the disassembly process will be performed at location J and that S steps will be involved, the dismantling cost (in €/pack) is as follows:
C D i s R , J = C l a b o r ,   J   n = 1 S t d , n + t i , n
where C l a b o r ,   J is the hourly labor cost at location J , t d , n is the disassembly time, and t i , n is the instruction time for the nth step in the process. We can divide Equation (21) by the rated power capacity of the battery, P , and the model in Equation (22) will represent the dismantling cost of the battery in €/kWh.
C D i s R , J = C l a b o r ,   J   n = 1 S t d , n + t i , n P
The EverBatt model [26] for battery recycling suggests that the cost for battery recycling can be modeled in a similar way to the manufacturing cost model based on Table 1. The recycling cost can also vary based on the location of the recycling plant because the cost of raw materials used in the recycling process; cost of utilities (water, electricity, gas, etc.); and direct labor costs are not consistent with the location [37]. The recycling-cost model can be derived from Table 1 for a recycling plant at location J as in Equation (23).
C R e c , J = 1.05   C R M , J + C R , u t m , J + 1.75 C D L , J + 1.9 C D e p N E b a t t
where C R M , J is the cost of materials used in the recycling process, C R , u t m , J is the utility cost at recycling plant location J , C D L , J is the direct labor cost, C D e p is the depreciation cost, and N is the annual recycling capacity of the plant.
There is the possibility that after dismantling and recycling the battery, some parts or materials are not fit for reuse and, hence, go to disposal in a landfill. The cost of the disposal of a battery depends on the size of the battery and the disposal fee in the area of the disposal site. The disposal treatment fee is also different for hazardous and non-hazardous materials [32]. If we say that m d i is the mass of battery material i (in kg) extracted from a battery pack that needs to be disposed of and C d i , j is the disposal fee (in €/kg) of material i in area j , the disposal cost (in €/kWh) is as follows:
C D i s = j i m d i C d i , j P
The last component of the EoL cost model is the revenue generated through the reselling of recovered materials from the recycling of the battery, which can be modeled as in Equation (25) as follows:
r e v e n u e = i R i × C r , i , j
where R i can be defined as the amount (in tons) of material i that is recovered from spent batteries, and C r , i , j is the price (in €/ton) of material i that is recovered from the recycling facility and equipment at location j [22]. The EoL cost can be calculated (in €/kWh) for the battery, but the unit of the revenue in Equation (25) is euros (€). If we consider the fact that m i , b a t t is the mass of material i recovered from a battery pack, the revenue per kilowatt hour from reselling recycled materials of the battery pack is as follows:
r e v e n u e k W h = i m i , b a t t × C r , i , j E b a t t
Finally, we can assemble Equations (22)–(26) into Equation (27) to obtain the end-of-life cost of the NiZn battery (Equation (27)).
C E o L = m l D i s t a n c e m , l   × u n i t   c o s t l E b a t t   +   C l a b o r ,   J     n = 1 S t d , n   +   t i , n P + 1.05   C R M , J   +   C R , u t m , J   +   1.75     C D L , J   +   1.9     C D e p N     E b a t t + j i m d i     C d i , j P i m i , b a t t   ×   C r , i , j E b a t t

4. Results and Discussion

This life-cycle-cost model has been applied to three types of batteries with the basic structures and materials presented in the next paragraphs:
Nickelzinc battery: Composed of a zinc anode containing a zinc paste made from metallic zinc, zinc oxide, additives, and adhesives and a current collector made of copper foam or an expanded material, the NiZn battery uses an aqueous electrolyte, thanks to which it has none of the safety issues associated with Li-ion batteries, which use an organic electrolyte and are subject to fires and explosions. This emerging technology has been shown (Squiller and Brody, 2011) to have significant advantages over other battery chemistries regarding energy and power densities, cost, safety, toxicity, and recyclability [38].
Leadacid batteries: Lead–acid batteries are composed of lead alloys in combination with other additives, such as antimony, calcium, tin, and selenium. The cathode is made of lead peroxide on a lead lattice, and the anode is made of a lead sponge on a lead lattice, while the electrolyte is a solution of sulfuric acid (H2O + H2SO4). The schematic representation of a lead–acid battery can be seen in Figure 3. In the charged state, the positive active material is porous PbO2, while the negative active material is highly porous Pb. In the discharged state, both electrodes are made of PbSO4 [39]. The electrolyte in these types of batteries is an aqueous H2SO4 solution [40].
Lithium-ion batteries: Li-ion batteries are composed of three main components: the negative electrode (anode), a non-aqueous liquid electrolyte, and the positive electrode (cathode). The negative electrode is based on carbon and can be made of graphite or hard carbon, while the positive electrode contains lithium and a host material. Common positive electrode materials are lithium-containing transition-metal oxides, where the metal is Co, Ni, Fe, or Mn. The electrolyte in lithium-ion batteries is a lithium salt dissolved in an organic solvent (see Figure 4). There are many different types of lithium-ion batteries [41]. However, for this study, two types of lithium-ion batteries, “NMC” (using nickel–manganese–cobalt as the cathode material) and “LFP” (using lithium iron phosphate as the cathode material), have been used [40].
The results regarding the total cost calculations for the different types of batteries in this study can be classified into three sections as follows:

4.1. Costs Based on Formula Calculations

The results of the costs of the six batteries in this study are shown in Table 2. These final total costs are divided into the values of the different phases of the life of the devices. These first calculations shown are based on the operations carried out according to the modeled Formulas (8), (11), (17) and (27).
Table 2 details the final battery cost calculations for various battery formulations. The costs include production, use scenario (generic use), and end-of-life (EoL) costs and are measured in euros per kilogram (€/kg) of battery mass. These cost factors are essential for assessing battery technologies’ economic feasibility and sustainability. Let us examine each row in Table 2 to understand the costs. NiZn Formulation 1: The per-kilogram cost of this battery formulation is €5.61. The production cost, which includes the cost of the raw materials and manufacturing processes, amounts to €4.63. The generic use cost is €0.1 for operational expenses during the battery’s lifecycle. The battery’s recycling or disposal EoL cost is €0.88.
NiZn Formulation 2: This battery formulation costs €6.42 per kilogram, which is €5.41 more than Formulation 1. The use scenario cost stays at €0.1, while the EoL cost rises to €0.91.
Lead–acid battery: The total cost for this battery type is €6.73 per kilogram. It has a lower production cost of €2.37 compared with those of the NiZn formulations. However, the EoL cost is significantly higher at €4.26, reflecting the challenges and expenses associated with the proper disposal or recycling of lead–acid batteries. The use scenario cost remains the same at €0.1.
Lithium-ion battery LFP: This battery formulation has a higher total cost of €30.9 per kilogram, mainly owing to its higher production cost of €19.25. The use scenario cost is relatively lower at €0.01, indicating potential operational efficiencies. The EoL cost is €11.64, reflecting the considerations for recycling or managing the end-of-life of lithium-ion batteries.
Lithium-ion battery NMC 532: With a total cost of €86.8 per kilogram, this battery formulation stands out as one of the most expensive options in the table (Table 2). It has a significantly higher production cost of €74, suggesting the complexity and costliness of the materials and manufacturing processes involved. The use scenario cost is relatively higher at €1.16, possibly reflecting specific requirements or operational considerations. The EoL cost remains significant at €11.64.
Lithium-ion battery NMC 622: Topping the table (Table 2) in terms of the total cost, this battery formulation amounts to €120.55 per kilogram. It exhibits the highest production cost of €108.81, emphasizing the intricate and costly nature of the materials and production techniques used. The use scenario cost remains at €0.1, while the EoL cost is €11.64, which is consistent with those of other lithium-ion battery formulations. It is important to note that these costs reflect the specific context and assumptions of the analysis, including raw-material prices, production technologies, and recycling methods. Additionally, variations in the battery size, energy density, and other performance factors can influence the overall economics of each battery technology. The detailed cost breakdown presented in the table (Table 2) allows for a comprehensive comparison of different battery formulations in terms of their production, use, and end-of-life costs. Evaluating these costs provides insights into the economic feasibility, environmental impact, and potential areas for improvement in the lifecycle management of various battery technologies.
Lead–acid batteries cost €6.73 per kilogram. Their production cost is €2.37 less than those of the NiZn formulations. However, the EoL cost is €4.26, reflecting the difficulties and costs of lead–acid battery disposal and recycling. The €0.1 use scenario cost remains.
Lithium-ion battery LFP: Owing to its €19.25 production cost, this battery formulation costs €30.9 per kilogram. The use scenario cost is €0.01, suggesting operational efficiency. Recycling or managing this lithium-ion battery’s end-of-life costs €11.64. At €86.8 per kilogram, the lithium-ion battery NMC 532 is one of the most expensive options in the table (Table 2). Its €74 production cost indicates the complexity and cost of the materials and manufacturing processes. The use scenario cost is €1.16, which may reflect operational requirements. The €11.64 EoL cost remains high.
Lithium-ion battery NMC 622: At €120.55 per kilogram, this battery formulation tops Table 2. It has the highest production cost of €108.81, highlighting the complexity and cost of the materials and methods. The use scenario cost is €0.1, and the EoL cost is €11.64, like those of other lithium-ion batteries. These costs depend on analysis assumptions, such as raw-material prices, production technologies, and recycling methods. The battery size, energy density, and other performance factors can also affect battery technology economics. The table (Table 2) compares the production, use, and end-of-life costs of different battery formulations. These costs reveal the economic feasibility, environmental impact, and lifecycle management improvements of different battery technologies.
The above battery-cost calculation table shows several key insights into and differences between battery formulations. Production costs vary greatly among battery formulations: NiZn Formulation 1 has the lowest production cost at €4.63/kg, followed by Formulation 2 at €5.41/kg. The lithium-ion battery formulations (LFP, NMC 532, and NMC 622) have higher production costs, with NMC 622 costing €108.81/kg.
Use scenario costs: From €0.01/kg for LFP to €1.16/kg for NMC 532, use scenario costs represent operational expenses during the battery’s lifecycle. The NiZn formulations have the lowest use scenario costs, indicating their potential efficiency and cost effectiveness. EoL costs include recycling or disposing of batteries after their useful life. Li-ion batteries have the highest EoL cost at €11.64/kg, making EoL management difficult and expensive. Others, like NiZn and lead–acid batteries, have lower EoL costs, from €0.88/kg to €4.26/kg. The rankings change when the total costs (production cost + use scenario cost + EoL cost) are considered. The lowest total cost is €5.61/kg for NiZn Formulation 1, followed by Formulation 2 at €6.42/kg and the lead–acid battery at €6.73/kg. Compared with lithium-ion batteries, NMC 532, LFP, and NMC 622 cost €86.8, €30.9, and €120.55/kg, respectively. Lithium-ion batteries cost more owing to their more complicated production and EoL management. Overall, the comparison shows battery formulation tradeoffs: NiZn batteries have lower production and total costs, making them cost effective. Lower production costs but higher EoL costs characterize lead–acid batteries. Lithium-ion batteries have higher production and total costs but may offer higher energy densities and performance with careful EoL management. These cost comparisons are based on specific cost calculations and may vary depending on raw-material prices, energy density requirements, and recycling technologies. The battery lifespan, safety, and environmental factors should also be considered when assessing battery technologies for specific applications.

4.2. Costs Based on Energy Units Released

The final results for these calculations along with the full lifecycle costs for each battery are shown in the following table (Table 3):
Table 3 compares the costs for releasing 1 kWh of energy for different battery formulations. Table 3 shows the following information: Formulation 1 and Formulation 2: These batteries have the lowest costs per energy unit released at €0.0376/kWh and €0.0430/kWh, respectively. Although their battery cost per kilogram is higher, their lower mass requirements to release 1 kWh of energy make them cheaper.
Lead–acid battery: The lead–acid battery has a low cost per kilogram, but its mass requirement of 0.0948 kg/kWh makes it cost €0.6380/kWh per energy unit released. Lead–acid batteries are heavier than other formulations’ batteries, which explains this.
Lithium-ion battery LFP: €0.15852/kWh for LFP batteries. Despite its higher cost per kilogram of battery compared with those of the NiZn formulations, its lower mass requirement of 0.00513 kg/kWh lowers its cost per energy unit released. The highest costs per energy unit released are €0.44528/kWh for lithium-ion battery NMC 532 and €0.61842/kWh for NMC 622. Their higher costs are due to the higher battery cost per kilogram and the low mass needed to release 1 kWh of energy. Owing to their low mass requirements, the NiZn formulations are the most cost effective per energy unit released. Owing to their weight, lead–acid batteries cost more per energy unit released. Lithium-ion batteries have higher energy densities but higher costs per energy unit owing to their higher cost per kilogram. The cost should be considered when choosing a battery technology for specific applications, along with the performance and economic feasibility.

4.3. Costs Based on openLCA Calculations

The results of the final calculations are shown in Table 4, which includes the openLCA calculation values and the values of the machinery, employee salaries, and others, for the six batteries in this study.
Table 4 shows the cost breakdown for all the batteries included in this study across the life stages of the raw-material acquisition, manufacturing, installation, operation and maintenance, and disposal/recycling, which determine the costs.
For NiZn Formulation 1, the cost of raw materials or subproducts is €4.62 per kilogram. This cost is constant throughout its life.
The manufacturing stage costs 0.01 kWh per kilogram for energy. This stage also involves machinery costs, which are not specified.
Installation labor costs €2500 per month per person. The cost of the machinery is not specified.
Energy costs 0.01 kWh per kilogram, labor costs €2500 per month per person, and safety/quality tests are incurred during installation, operation, and maintenance. The machinery, packaging, and transportation costs are unknown.
Finally, disposal/recycling costs €4.62 per kilogram for energy, labor, and storage. The machinery, packaging, and transportation costs in this phase are not given. In the next step, the cost breakdown for NiZn Formulation 2 at various life stages is presented, including the costs for production, installation, operation, maintenance, and disposal or recycling. Throughout the procedure, the cost per kilogram of raw materials is fixed at €5.41. The manufacturing energy costs 0.01 kWh per kilogram, and the equipment costs €49,300.
Although the facility maintenance is mentioned in the installation phase, no specific cost information is given. The installation, operation, and maintenance phases also include labor costs (€2500 per person per month), safety and quality inspections, and energy costs.
Labor, energy, and storage costs associated with disposal/recycling result in costs of $5.41 per kilogram, but there is no information on the equipment, packaging, and transportation costs or income from recycling. Following, the cost breakdown of a lead–acid battery at various points in its lifecycle is shown in Table 4.
Throughout the entirety of the battery’s life, the price for acquiring raw materials or subproducts is €2.36 per kilogram.
The cost of production includes labor costs of €2500 per month per person and energy costs of €0.01 per kilowatt hour per kilogram. Additionally, the cost of the machinery is €89500.
The letter “x” designates that no specific costs are mentioned during the installation phase.
The energy costs remain constant in the installation, operation, and maintenance phases at €0.01 per kilowatt hour per kilogram. Additionally, labor costs stay the same at €2500 per person per month.
The table does not include any cost information for the disposal or recycling stage, and it is also unclear how much money will be made from recycling through the sale of recycled components.
During the manufacturing stage, safety and quality tests as well as packaging costs are other cost factors that have been mentioned. Storage costs come to €2.36 per kilogram, while transportation costs are listed as €0.00003 per kilogram per kilometer.
The costs for developing software and hardware are also mentioned, but no specifics are given.
The cost of the components for a lead–acid battery is summarized in this table (Table 4), with a focus on the costs for raw materials, energy, labor, machinery, storage, transportation, safety/quality tests, packaging, and potential software/hardware development. In addition, the cost breakdown of lithium-ion batteries (LFP) for each stage of their life is shown in the table above (Table 4). The costs for manufacturing and acquiring raw materials are €19.25/kg and €32.54/kg, respectively. The installation and disposal costs are unknown. Energy costs are €1.17/kWh/kg for production and €0.01/kWh/kg for operation. The monthly labor costs per person are €2500. The manufacturing equipment costs €108,954. There was no information mentioned about the facility’s maintenance. Manufacturing includes tests for safety and quality. The cost of the packaging is €4.75. The cost of the transportation is €0.00001/kg * km. The cost of the storage is €32.54/kg. The development of the software and hardware was mentioned but not in detail. There are no data on the recycling revenue. LFP batteries require significant investments in machinery, labor, raw-material costs, energy costs for production and operation, packaging, and storage. Furthermore, the breakdown of the costs for a lithium-ion battery with NMC 532 chemistry over the course of its life is shown in the table above (Table 4). Although the production costs are €74/kg, the cost for purchasing raw materials is €24.27/kg. There are no cost details provided for the installation phase. Energy costs in the installation, operation, and maintenance phases are €0.01/kWh/kg compared to labor costs of €2500/month/person. The recycling revenue is also kept a secret, as are the disposal and recycling costs. Aside from the above costs, there are also €108,954 for machinery, €5.55 for packaging, €0.00001/kg * km for transportation, €24.27/kg for storage, and an unspecified amount for software/hardware development. Additionally, facility maintenance is mentioned, but no information is given. The cost factors for a lithium-ion battery using NMC are highlighted in this table as a result (Table 4).
Also, the cost breakdown of a lithium-ion battery using NMC 622 chemistry in its various life stages is shown in the table above (Table 4). The price for purchasing raw materials or subproducts during the raw-material acquisition phase is €25.57 per kilogram. During the manufacturing process, this price significantly rises and eventually reaches €108.4 per kilogram. The table does not include any specific cost information for the installation phase. The battery, however, incurs energy costs of €0.01 per kilowatt hour per kilogram in the subsequent installation, operation, and maintenance phases, with labor costs remaining constant at €2500 per person per month.
The cost breakdown for the disposal/recycling stage is not shown in the table. Additionally, there are no data on the revenue derived from recycling activities. Additional cost elements outlined include machinery costs amounting to €108,954, the mention of the necessary facility maintenance, safety/quality tests conducted during both the raw-material acquisition and manufacturing stages, packaging costs totaling €5.02, transportation costs of €0.00001 per kilogram per kilometer, and storage costs of €25.57 per kilogram (source: https://www.osti.gov/servlets/purl/7300200 (accessed on 30 January 2024)). However, no details are provided regarding software/hardware development costs.
In summary, the table (Table 4) highlights the cost components associated with a lithium-ion battery using NMC 622 chemistry, encompassing raw-material acquisition, manufacturing, energy, labor, machinery, facility maintenance, safety/quality tests, packaging, transportation, and storage cost results, which are presented in Section 4.3, detailing costs from the model and openLCA and external sources. Table 5 compares both results for NiZn Formulation 2 and a lead–acid battery for the validation of the model and analyzes the percentage deviation between them. In the case of both batteries, the deviation in the results is less than 2%, which shows a very good level of accuracy for the model developed in this study.

5. Limitations and Assumptions

We cannot ignore the fact that certain limitations and assumptions have been made in this LCCA modeling and analysis to simplify the modeling process. These limitations are due to the fact that the NiZn battery is still in the research and development phase, and its comparison is limited to the laboratory scale, while the other two battery types (lithium-ion batteries and lead–acid batteries) are already widely used in energy storage. Because the relevant demonstration case, “Smart Distribution Grid Management”, had not yet begun at the time of the analysis, the scenarios established for the usage scenarios received less support from test data, and the majority of the modeling of the battery use phase was based on assumptions. Also, a closed-loop recycling process is not feasible; the EoL phase of the NiZn battery modeling could not depend on the results of a completed recycling process test. Instead, only preliminary modeling was used, which can be improved in future sustainability studies. Depending on the use, the cooling system in energy storage systems can change. The cooling system may be small or absent in smaller systems, such as home storage [42]. As a result, the cooling system has not been modeled for the lifecycle cost analysis (LCCA). This decision is taken to streamline the analysis and concentrate on the energy storage system’s core components.
For the LOLABAT Project, China produces the NiZn dry battery cells, which are then shipped to Europe to be integrated into battery packs. After that, these battery packs are shipped to different demonstration case locations. Therefore, three categories of transportation within Europe are covered in the modeling process for the production of battery packs. Information and data from the local producer were used for the transportation of the NiZn cell production. To guarantee a fair comparison, the storage application system characteristics in the usage phase modeling are the same for all the battery types. When it came to data sources, the primary data for the NiZn batteries were used whenever possible, while secondary data from the literature—ideally acquired in Europe—were used to construct the other two battery types. Using the most up-to-date and relevant data possible for each type of battery in the study is ensured by this method. The other assumptions related to the data used for the analysis are that the value of the water is assumed to be €0, and the value of the machinery and equipment is kept apart from the primary costs for manufacturing.
Any costs of activities required for building and maintaining the infrastructure, such as the production and servicing of the assembly machines that permit the reference flow, the equipment and accessories required, such as converters and cables for the installation of battery packs at end-users’ locations, the manufacture, shipping, and disposal of the materials and packaging used in the battery transportation, as well as the disposal of spent batteries, are not included in the analysis.

6. Conclusions

The purpose of this study was to assess the economic feasibility of the NiZn battery using two proposed formulas and compare the NiZn battery to four other popular battery choices. This was accomplished with close respect to the LOLABAT Project’s technical criteria. The overall cost was computed by including the battery replacement, charging, and disposal costs. Then, a large-scale operation for data collecting, methodology development, and LCC-based computation was carried out. When all the aspects are considered, the calculations indicate that NiZn is the most cost-effective battery. A lifecycle cost analysis found that the Formulation 1 battery was the most cost effective, followed by the Formulation 2 battery. The Formulation 1 battery had the lowest total lifecycle costs, at €5.61/kg. After Li-ion batteries, it was the second most efficient battery in terms of the final battery mass ratio per unit of energy released. The final price per kilowatt hour of the energy produced was €0.0376. When the modeled formulas were applied to a calculation in openLCA, the predicted results emerged. The NiZn battery ended up being the cheapest. Of the two procedures, the first produced better results, with a battery output value of €5.61 per kilogram of mass. The acquisition of raw materials and production accounted for 82.53 percent, the use scenario for 1.78 percent, and the end of life for 15.69 percent of the total cost (without taking into account the costs of the machinery and infrastructure in each of them). Notably, the lead–acid battery has the lowest production and raw-material acquisition prices, with a cost of €2.37 per kilogram of battery. However, the €4.26/kg of battery cost incurred during the EoL process offsets this benefit. Lithium-ion NMC 622 batteries are the most expensive because they have the highest production cost at €108.81/kg and a total lifecycle cost of €120.55/kg. Both sets of models produced similar results when applied to software-based cost operations. NiZn batteries remained the most cost effective throughout their service life. NiZn Formulation 1 is the least expensive option according to the program. The lithium-ion NMC622 battery was once again the most expensive, costing €49.31 per kilogram. This strengthens the case that there are economic benefits for creating NiZn batteries. Finally, in terms of expenses per unit of energy released, the two scenarios do not differ significantly. NiZn batteries once again outperform other batteries in terms of the cost per kilowatt hour. The NiZn Formulation 1 and 2 batteries have a rating of 0.0067 kg/kWh. This is the lowest ratio, with emission costs of €0.0376/kWh for Formulation 1 and €0.0430/kWh for Formulation 2. When compared with other battery types, lead–acid batteries have the highest cost per unit of energy released. The cost per kilowatt hour of electricity released is €0.6380. This discovery is intriguing because it proves the usefulness and low cost of NiZn batteries. This is because according to earlier methods and software-based estimations, lithium-ion batteries are the most expensive in total. Lead–acid batteries, on the other hand, have the highest cost per energy unit released.
The following are the key advantages of NiZn Formulation 1 and NiZn Formulation 2 batteries over their competitors, as well as a list of factors to consider to further lower costs during their lifecycle:
  • Formula modeling and openLCA v. 1.11 software operations have the lowest costs and the lowest cost per unit of emitted energy. As previously stated, this is based on comparisons between lead–acid and lithium-ion NMC and LFP batteries;
  • The location is critical for infrastructure (material extraction area, manufacturing plant, usage area, recycling plant, etc.). This can have a substantial long-term impact on battery costs;
  • Other aspects to consider include machinery prices, storage, raw-material providers, and shipment numbers. The value of battery-recycling materials is very significant. These aspects have a substantial impact on the battery’s lifetime cost.
Further developments should extend this formulation model for computational purposes to the lifecycle environmental impacts of NiZn batteries, too, and apply AI methods for optimizing both costs and environmental impacts in a multiobjective approach. A sensitivity analysis carried out on this computational optimization model will figure out the robustness of the cost model presented in this paper under varying economic conditions.
The mathematical model and formulas that are introduced in this study can be used to calculate the lifecycle cost of other batteries in further developments. For this case, a minor adjustment is required based on the use cases. As a result, the model has the capability to be extrapolated to other battery types.

Author Contributions

Conceptualization, A.K.M., F.E.S. and I.V.-S.; methodology, A.K.M. and F.E.S.; investigation, A.K.M.; resources, G.D.M., F.E.S., V.Y., I.V.-S. and A.K.M.; writing—original draft preparation, A.K.M. and M.Z.M.; writing—review and editing, A.K.M., F.E.S., G.D.M., I.V.-S., V.Y. and M.Z.M.; supervision, F.E.S., G.D.M., I.V.-S. and V.Y.; project administration, G.D.M. and F.E.S.; funding acquisition, F.E.S., G.D.M. and A.K.M. All authors have read and agreed to the published version of the manuscript.

Funding

This research has received funding from the European Union’s Horizon 2020 research and innovation program within the LOLABAT project, under grant agreement number 963576. This paper reflects only the author’s view and the funding agency is not responsible for any use that may be made of the information it contains.Sustainability 16 01965 i001

Institutional Review Board Statement

Not applicable.

Informed Consent Statement

Informed consent was obtained from all the subjects involved in the study.

Data Availability Statement

The data presented in this study are available on request from the corresponding author.

Acknowledgments

The authors want to thank all the LOLABAT Project partners (https://www.lolabat.eu/ (accessed on 30 January 2024)) and thank the European Commission, which has funded this work.

Conflicts of Interest

The authors declare no conflicts of interest.

References

  1. Lehmusto, M.; Santasalo-aarnio, A. Mathematical framework for total cost of ownership analysis of marine electrical energy storage inspired by circular economy. J. Power Sources 2022, 528, 231164. [Google Scholar] [CrossRef]
  2. Martínez-Fernández, P.; Villalba-Sanchís, I.; Yepes, V.; Insa-Franco, R. A review of modelling and optimisation methods applied to railways energy consumption. J. Clean. Prod. 2019, 222, 153–162. [Google Scholar] [CrossRef]
  3. Battke, B.; Schmidt, T.S.; Grosspietsch, D.; Hoffmann, V.H. A review and probabilistic model of lifecycle costs of stationary batteries in multiple applications. Renew. Sustain. Energy Rev. 2013, 25, 240–250. [Google Scholar] [CrossRef]
  4. EDP Labelec. Long Lasting Batteries; EDP Labelec: Sacavém, Portugal, 2021. [Google Scholar]
  5. Chang, D.; Kim, Y.; Jung, S. Comprehensive study of the performance of alkaline organic redox flow batteries as large-scale energy storage systems. Int. J. Energy Res. 2019, 43, 4449–4458. [Google Scholar] [CrossRef]
  6. Spataru, C.; Bouffaron, P. Off-Grid Energy Storage. In Storing Energy; Elsevier: Amsterdam, The Netherlands, 2013. [Google Scholar] [CrossRef]
  7. Wei, L.; Zeng, L.; Wu, M.C.; Jiang, H.R.; Zhao, T.S. An aqueous manganese-copper battery for large-scale energy storage applications. J. Power Sources 2019, 423, 203–210. [Google Scholar] [CrossRef]
  8. Yousif, M.; Ai, Q.; Wattoo, W.A.; Jiang, Z.; Hao, R.; Gao, Y. Least cost combinations of solar power, wind power, and energy storage system for powering large-scale grid. J. Power Sources 2019, 412, 710–716. [Google Scholar] [CrossRef]
  9. Lai, S.B.; Jamesh, M.I.; Wu, X.C.; Dong, Y.L.; Wang, J.H.; Gao, M.; Liu, J.F.; Sun, X.M. A promising energy storage system: Rechargeable Ni–Zn battery. Rare Met. 2017, 36, 381–396. [Google Scholar] [CrossRef]
  10. IEC 60300-3-3:2017; Dependability Management—Part 3-3: Application Guide—Life Cycle Costing. International Electrotechnical Commission: London, UK, 2017.
  11. Zhou, Z.; Alcalá, J.; Yepes, V. Environmental, economic and social impact assessment: Study of bridges in china’s five major economic regions. Int. J. Environ. Res. Public Health 2021, 18, 122. [Google Scholar] [CrossRef]
  12. ISO 604 61010-1:2001; International Standard International Standard. ISO: Geneva, Switzerland, 2003; Volume 2003, p. 13.
  13. He, G.; Ciez, R.; Moutis, P.; Kar, S.; Whitacre, J.F. The economic end of life of electrochemical energy storage. Appl. Energy 2020, 273, 115151. [Google Scholar] [CrossRef]
  14. Johnson, M.R.; McCarthy, I.P. Product recovery decisions within the context of Extended Producer Responsibility. J. Eng. Technol. Manag.—JET-M 2014, 34, 9–28. [Google Scholar] [CrossRef]
  15. Kampker, A.; Wessel, S.; Fiedler, F.; Maltoni, F. Battery pack remanufacturing process up to cell level with sorting and repurposing of battery cells. J. Remanufacturing 2021, 11, 1–23. [Google Scholar] [CrossRef]
  16. Mathew, M.; Kong, Q.H.; McGrory, J.; Fowler, M. Simulation of lithium ion battery replacement in a battery pack for application in electric vehicles. J. Power Sources 2017, 349, 94–104. [Google Scholar] [CrossRef]
  17. Nagapurkar, P.; Smith, J.D. Techno-economic optimization and environmental Life Cycle Assessment (LCA) of microgrids located in the US using genetic algorithm. Energy Convers. Manag. 2019, 181, 272–291. [Google Scholar] [CrossRef]
  18. Larsson, P.; Borjesson, P. Cost models for battery energy storage systems. Bachelor’s Thesis, KTH School of Industrial Engineering and Management, Stockholm, Sweeden, 2018; p. 31. [Google Scholar]
  19. Mehdijev, S. Dimensioning and Life Cycle Costing of Battery Storage System in residential housing—A case study of Local System Operator Concept. 2017. Available online: https://www.diva-portal.org/smash/record.jsf?pid=diva2:1130036 (accessed on 30 January 2024).
  20. Žižlavský, O. Net Present Value Approach: Method for Economic Assessment of Innovation Projects. Procedia Soc. Behav. Sci. 2014, 156, 506–512. [Google Scholar] [CrossRef]
  21. Santarremigia, F.E.; Poveda-Reyes, S.; Hervás-Peralta, M.; Molero, G.D. A Decision-Making Method for Boosting New Digitalization Technologies. Int. J. Inf. Technol. Decis. Mak. 2021, 20, 635–669. [Google Scholar] [CrossRef]
  22. Schmidt, O.; Melchior, S.; Hawkes, A.; Staffell, I. Projecting the Future Levelized Cost of Electricity Storage Technologies. Joule 2019, 3, 81–100. [Google Scholar] [CrossRef]
  23. Poonpun, P.; Jewell, W.T. Analysis of the cost per kilowatt hour to store electricity. IEEE Trans. Energy Convers. 2008, 23, 529–534. [Google Scholar] [CrossRef]
  24. Mongird, K.; Viswanathan, V.; Balducci, P.; Alam, J.; Fotedar, V.; Koritarov, V.; Hadjerioua, B. An Evaluation of Energy Storage Cost and Performance Characteristics. Energies 2020, 13, 3307. [Google Scholar] [CrossRef]
  25. Mathur, N.; Sutherland, J.W.; Singh, S. A study on end of life photovoltaics as a model for developing industrial synergistic networks. J. Remanufacturing 2022, 12, 281–301. [Google Scholar] [CrossRef]
  26. Dai, Q.; Spangenberger, J.; Ahmed, S.; Gaines, L.; Kelly, J.C.; Wang, M. EverBatt: A Closed-Loop Battery Recycling Cost and Environmental Impacts Model; Argonne National Laboratory: Argonne, IL, USA, 2019; pp. 1–88.
  27. Peters, M.S.; Timmerhaus, K.D. PDandEforC Engineers.pdf. In Plant Design and Economics for Chemical Engineers; McGraw-Hill: New York, NY, USA, 1991. [Google Scholar]
  28. Seuring, S.; Schmidt, W.-P.; Ciroth, A.; Rebitzer, G.; Huppes, G.; Lichtenvort, K. Modeling for Life Cycle Costing. In Environmental Life Cycle Costing; CRC Press: Boca Raton, FL, USA, 2008; pp. 17–34. [Google Scholar] [CrossRef]
  29. Navarro, I.J.; Yepes, V.; Martí, J.V. A review of multicriteria assessment techniques applied to sustainable infrastructures design. Adv. Civ. Eng. 2019, 2019, 6134803. [Google Scholar] [CrossRef]
  30. Rahman, M.M.; Oni, A.O.; Gemechu, E.; Kumar, A. The development of techno-economic models for the assessment of utility-scale electro-chemical battery storage systems. Appl. Energy 2021, 283, 116343. [Google Scholar] [CrossRef]
  31. Schoenung, S.M.; Hassenzahl, W. Long vs. Short-Term Energy Storage: Sensitivity Analysis A Study for the DOE Energy Storage Systems Program; Sandia National Laboratories (SNL): Albuquerque, NM, USA; Livermore, CA, USA, 2007; p. 42.
  32. Marchi, B.; Pasetti, M.; Zanoni, S. Life Cycle Cost Analysis for BESS Optimal Sizing. Energy Procedia 2017, 113, 127–134. [Google Scholar] [CrossRef]
  33. Xu, Y.; Pei, J.; Cui, L.; Liu, P.; Ma, T. The Levelized Cost of Storage of Electrochemical Energy Storage Technologies in China. Front. Energy Res. 2022, 10, 873800. [Google Scholar] [CrossRef]
  34. McCarthy, L.; Delbosc, A.; Currie, G.; Molloy, A. Factors influencing travel mode choice among families with young children (aged 0–4): A review of the literature. Transp. Rev. 2017, 37, 767–781. [Google Scholar] [CrossRef]
  35. Lima, M.C.C.; Pontes, L.P.; Vasconcelos, A.S.M.; de Araujo Silva Junior, W.; Wu, K. Economic Aspects for Recycling of Used Lithium-Ion Batteries from Electric Vehicles. Energies 2022, 15, 2203. [Google Scholar] [CrossRef]
  36. Alfaro-Algaba, M.; Ramirez, F.J. Techno-economic and environmental disassembly planning of lithium-ion electric vehicle battery packs for remanufacturing. Resour. Conserv. Recycl. 2020, 154, 104461. [Google Scholar] [CrossRef]
  37. Lander, L.; Cleaver, T.; Rajaeifar, M.A.; Nguyen-Tien, V.; Elliott, R.J.; Heidrich, O.; Kendrick, E.; Edge, J.S.; Offer, G. Financial viability of electric vehicle lithium-ion battery recycling. iScience 2021, 24. [Google Scholar] [CrossRef]
  38. Squiller, D.; Brody, R. Nickel-zinc batteries for hybrid electric vehicles and stationary storage. In Technical Proceedings of the 2011 NSTI Nanotechnology Conference and Expo, NSTI-Nanotech 2011; 2011; Volume 1, pp. 690–693. Available online: http://www.scopus.com/inward/record.url?eid=2-s2.0-81455133603&partnerID=40&md5=0f751a82e007f50374d0a933362d2ab7 (accessed on 30 January 2024).
  39. Poullikkas, A.; Nikolaidis, P. A comparative review of electrical energy storage systems for better sustainability. J. Power Technol. 2017, 97, 220–245. [Google Scholar]
  40. Halleux, V. New EU Regulatory Framework for Batteries. 2021. Available online: https://www.europarl.europa.eu/RegData/etudes/BRIE/2021/689337/EPRS_BRI(2021)689337_EN.pdf (accessed on 7 July 2021).
  41. Sundén, B. Battery technologies. In Hydrogen, Batteries and Fuel Cells; Elsevier: Amsterdam, The Netherlands, 2019; pp. 57–79. [Google Scholar] [CrossRef]
  42. Institute of Electrical and Electronics Engineers. Nickel Metal Life Cycle Data. In Proceedings of the 2019 18th IEEE Intersociety Conference on Thermal and Thermomechanical Phenomena in Electronic Systems, Las Vegas, NV, USA, 28–31 May 2019. [Google Scholar]
Figure 1. Lifecycle steps of NiZn battery from cradle-to-grave approach for lifecycle cost and environmental impact.
Sustainability 16 01965 g001
Figure 2. Material flow diagram to acquire raw materials for NiZn batteries (source: author’s elaboration).
Sustainability 16 01965 g002
Figure 3. Schematic representation of a lead–acid battery (Poullikkas and Nikolaidis, 2017 [39]).
Sustainability 16 01965 g003
Figure 4. Schematic representation of the working principle of Li−ion batteries during charge and discharge processes.
Sustainability 16 01965 g004
Table 1. Proportionate costs of battery production at manufacturing plant [25].
Cost CriteriaAssumptions of the Equations
A. Total Cost of VariableA.1 + A.2 +A.3
1. Cost of MaterialsThe sum of the cost of the materials
2. Cost of Direct LaborTotal direct labor-hour requirement * hourly labor rate
3. Variable Overhead40% of A.2 + 20% of C.1
B. Total InvestmentB.1 + B.2 + B.3 + B.4
1. Cost of Launch5% of A.1 + 10% of A.2 + 10% of A.3
2. Working Capital15% of A.2 + 15% of A.3
3. Capital EquipmentThe sum of the costs of the capital equipment
4. Cost of BuildingTotal building area * per-square-meter building cost
C. Fixed ExpensesC.1 + C.2 + C.3
1. Depreciation16.7% of B.3 + 5% of B.4
2. GSA Cost25% of A.2 + 25% of A.3 + 25% of C.l
3. R&D Cost40% of C.1
D. Profit5% of B
E. Warranty5.6% of A + 5.6% of C + 5.6% of D
F. Total CostA + C + D + E
Manufacturing cost ( C m   ) = total variable cost ( C v c ) + fixed expenses ( C F E ) + profit ( P f ) + warranty ( C w a r ).
Table 2. Final battery cost calculations based on model formulas.
Final Battery Cost Calculations from Formulas
NumberType of BatteryProduction (Includes Cost of Raw Materials)Use Scenario: Generic UseEoL (End-of-Life)Total (€/kg of Battery Mass)
1NiZn Formulation 14.630.10.885.61
2NiZn Formulation 25.410.10.916.42
3Lead–Acid Battery2.370.14.266.73
4Lithium-Ion Battery LFP19.250.0111.6430.9
5Lithium-Ion Battery NMC 532741.1611.6486.8
6Lithium-Ion Battery NMC 622108.810.111.6120.55
Table 3. Cost per energy unit released.
Cost for Releasing 1 kWh of Energy
NumberBattery NameMass to Release 1 kWh of Energy (kg/kWh)Final Battery Cost (€/kg Battery)Cost per Energy Unit Released (€/kWh)
1NiZn Formulation 10.00675.610.0376
2NiZn Formulation 20.00676.420.0430
3Lead–Acid Battery0.09486.730.6380
4Lithium-Ion Battery LFP0.0051330.00.15852
5Lithium-Ion Battery NMC 5320.0051386.80.44528
6Lithium-Ion Battery NMC 6220.00513120.550.61842
Table 4. OpenLCA and external data cost calculations for all the types of batteries.
Cost ElementsCost Breakdown by Life Stage
Cost of the Raw-Material AcquisitionCost in the Manufacturing StageCost in the Installation PhaseCost in the Installation, Operation, and Maintenance PhasesCost in the Disposal/Recycling Stage
NiZn Formulation 1
Cost for purchasing raw materials or subproducts (€/kg)4.624.62
Energy cost (kWh/kg)0.010.01 0.010.01
Labor cost (€/month * person)25002500 25002500
Machinery cost049,300.4
Safety/quality tests
Packaging
Transportation cost (€/kg * km) 0.00003
Storage cost (€/kg)
(https://www.osti.gov/servlets/purl/7300200 (accessed on 30 January 2024))
4.62
Software/hardware development
Income from recycling (sale of recycled parts)
NiZn Formulation 2
Cost for purchasing raw materials or subproducts (€/kg)5.415.41
Energy cost (kWh/kg)0.010.01 0.010.01
Labor cost (€/month * person)25002500 25002500
Machinery cost049,300.4
Safety/quality tests
Packaging
Transportation cost (€/kg * km) 0.00003
Storage cost (€/kg)
(https://www.osti.gov/servlets/purl/7300200 (accessed on 30 January 2024))
5.41
Software/hardware development
Income from recycling (sale of recycled parts)
Lead–Acid Battery
Cost for purchasing raw materials or subproducts (€/kg)2.362.36
Energy cost (kWh/kg)0.010.01 0.010.01
Labor cost (€/month * person)25002500 25002500
Machinery cost089,500
Safety/quality tests
Packaging
Transportation cost (€/kg * km) 0.00003
Storage cost (€/kg)
(https://www.osti.gov/servlets/purl/7300200 (accessed on 30 January 2024))
2.36
Software/hardware development
Income from recycling (sale of recycled parts)
Lithium-Ion Battery LFP
Cost for purchasing raw materials or subproducts (€/kg)32.5419.25
Energy cost (kWh/kg)01.17 0.010.01
Labor cost (€/month * person)25002500 25002500
Machinery cost0108,954
Safety/quality tests
Packaging 4.75
Transportation cost (€/kg * km) 0.00001
Storage cost (€/kg)
(https://www.osti.gov/servlets/purl/7300200 (accessed on 30 January 2024))
32.54
Software/hardware development
Income from recycling (sale of recycled parts)
Lithium-Ion Battery NMC 532
Cost for purchasing raw materials or subproducts (€/kg)24.2774
Energy cost (kWh/kg)01.86 0.010.01
Labor cost (€/month * person)25002500 25002500
Machinery cost0108,954
Safety/quality tests
Packaging 5.55
Transportation cost (€/kg * km) 0.00001
Storage cost (€/kg)
(https://www.osti.gov/servlets/purl/7300200 (accessed on 30 January 2024))
24.27
Software/hardware development
Income from recycling (sale of recycled parts)
Lithium-Ion Battery NMC 622
Cost for purchasing raw materials or subproducts (€/kg)25.57108.4
Energy cost (kWh/kg)01.86 0.010.01
Labor cost (€/month * person)25002500 25002500
Machinery cost0108,954
Safety/quality tests
Packaging 5.02
Transportation cost (€/kg * km) 0.00001
Storage cost (€/kg)
(https://www.osti.gov/servlets/purl/7300200 (accessed on 30 January 2024))
25.57
Software/hardware development
Income from recycling (sale of recycled parts)
Table 5. Comparison of LCC results obtained from the model and openLCA to validate the model.
Type of BatteryBattery Pack Production Cost Calculated by the Model (€/kg of Battery Mass)Battery Pack Production Cost Calculated by the Software openLCA v. 1.11 (€/kg of Battery Mass)Percentage Deviation
Ni Zn Formulation 26.426.301.90
Lead–Acid Battery6.736.621.66
Disclaimer/Publisher’s Note: The statements, opinions and data contained in all publications are solely those of the individual author(s) and contributor(s) and not of MDPI and/or the editor(s). MDPI and/or the editor(s) disclaim responsibility for any injury to people or property resulting from any ideas, methods, instructions or products referred to in the content.

