Article

Hydrogen Gas Adsorption of the Triassic Chang 7 Shale Member in the Ordos Basin, China

1
Institute of Energy, Peking University, Beijing 100871, China
2
Sinopec Petroleum Exploration and Production Research Institute, Beijing 102206, China
*
Author to whom correspondence should be addressed.
Sustainability 2024, 16(5), 1960; https://doi.org/10.3390/su16051960
Submission received: 3 January 2024 / Revised: 5 February 2024 / Accepted: 18 February 2024 / Published: 27 February 2024
(This article belongs to the Special Issue Porous Materials for Sustainable Futures)

Abstract

:
The present study investigates the adsorption of hydrogen gas by the Triassic Chang 7 Shale Member in the Ordos Basin, China. The mineral composition, microscopic morphology, pore characteristics, hydrogen adsorption capacity, and factors influencing hydrogen adsorption were explored using X-ray diffraction (XRD), thin section observations, nitrogen adsorption, scanning electron microscopy (SEM), and high-pressure hydrogen adsorption experiments. Based on these integrated tools, it was revealed that the Chang 7 Shale Member primarily comprises organic matter (kerogen) and clay minerals (predominantly an illite/smectite-mixed layer [I/S]). Nitrogen adsorption–desorption curves indicated the presence of slit-shaped pores, cracks, and wedge-shaped structures. The adsorption of hydrogen by shale decreases with increasing temperature and increases with increasing pressure. This adsorption behaviour conforms to both the Freundlich and Langmuir equations; moreover, the Freundlich equation provides a better fit. Organic matter (kerogen) and clay minerals considerably influence hydrogen adsorption. The present research provides insights into the occurrence of hydrogen in shale, offering implications for the exploration of natural hydrogen gas.

1. Introduction

Global energy production is currently undergoing a crucial transition from fossil to non-fossil fuels [1]. Hydrogen, a widely available, clean, low-carbon, and efficient fuel source, holds a strategic position in clean energy substitution. The development of hydrogen fuel has gradually become a significant direction for the energy technology revolution to pursue and represents a crucial pathway for achieving energy decarbonisation [2,3,4,5]. Hydrogen is a diatomic element with a molecular weight of 2.01588 [6]. At room temperature and pressure, it is a colourless, odourless gas. Furthermore, it is highly combustible and poorly soluble in water and has a density of 0.089 g/L (101.325 kPa, 0 °C): the lowest known gas density [7].
Recently discovered natural hydrogen, also known as ‘golden hydrogen’ or ‘white hydrogen’, is generated by underground geological processes. Compared to artificially produced hydrogen, natural hydrogen is a genuine zero-carbon and renewable primary energy source [8]. It can aid in addressing energy demand gaps, optimising the hydrogen energy industry structure, and facilitating clean energy substitution [9]. With respect to the backdrop of global efforts to achieve energy decarbonisation and net-zero emissions, natural hydrogen has sparked widespread research and exploration interest, with multiple countries developing plans for producing and utilising natural hydrogen [10]. A surge in the exploration for hydrogen has been observed, with anomalous hydrogen found in different basins in China, such as the Sebei gas field in the Qaidam Basin (hydrogen content: 99%); the Songke Well 2 (SK2) in the Songliao Basin (highest hydrogen content: 26.89%); the Sulige gas field in the Ordos Basin (2.1%); multiple gas fields in the eastern Sichuan Basin, Bohai Bay Basin and Jimo and Dongying Sag areas (1–22.8%); Changbai Mountain (1.24%); Tengchong (1–5.15%) and the Zhengye-1 well in northern Guizhou (24.7–36.98%) [11,12,13,14].
However, current research on natural hydrogen primarily focuses on its genesis, and there is limited understanding of its occurrence. Studying the occurrence of natural hydrogen is crucial for the exploration and development of hydrogen reservoirs. In previous research, the present authors investigated the adsorption of hydrogen onto pure clay minerals [15]. Common clay minerals in geological formations include montmorillonite, kaolinite, illite, chlorite, an illite/smectite-mixed layer (I/S), and chlorite/smectite-mixed layer [16]. These clay minerals have complex morphological structures, distributions, and compositions and have undergone varied transformation processes; therefore, they represent physical, chemical, and biological information about the tectonic history, source input, sedimentary system, and diagenetic evolution of basins. In the 1920s, the introduction of X-ray analysis techniques lead to the determination of the characteristics and nature of clay minerals [17]. A series of works, including the “Formation and Occurrence of Clay Minerals” and “Clay Mineralogy”, laid the foundation for developing clay mineralogy [18]. By 1980, the crystalline chemical classification table proposed by the International Clay Society for layer-type clay minerals had attracted widespread attention from mineralogists and petroleum geologists worldwide. Recently, research on reservoir clay minerals has brought new benefits, with an increasing number of new technologies, methods, applications, and studies on the research and application of clay minerals in domestic oil and gas exploration. Widely distributed in oil and gas basins, clay minerals are not only the main mineral components of mud shale but also the most important pore-filling materials in sandstone reservoirs, wherein their type, content, and occurrence have a crucial impact on the pore-throat structure and storage permeability of sandstone.
To further investigate the hydrogen adsorption capacity of clay minerals in geological samples, the present authors studied the adsorption of natural hydrogen in Donglouku and Yingcheng formations in SK2, which are rich in hydrogen-bearing layers based on geological conditions [19]. However, because the clay mineral content in SK2 Donglouku and Yingcheng formation mudstones is minimal (2–8% chlorite), their hydrogen adsorption capacity is not very high. Therefore, to further investigate the adsorption hydrogen capacity of clay minerals in geological samples, the present authors selected the clay-rich Chang 7 member of the Yanchang formation shale in the Ordos Basin as our study object.
The Ordos Basin, located in the western part of North China’s craton, is one of China’s major oil-bearing basins [20]. Recently, considerable breakthroughs have been made in the exploration of Triassic shale gas in the Chang 7 member in the southeastern extension of the Ordos Basin. The Chang 7 Shale Member has a high total organic carbon (TOC) content, ranging from 2% to 4% [20,21,22]. The Chang 7 Shale Member contains type I and II kerogens, with a vitrinite reflectance (Ro) ranging from 0.7% to 1.2% [23]. Clay minerals in Chang 7 mudstones include illite, kaolinite, montmorillonite, I/S, and chlorite. Previous studies have shown that the clay mineral content is generally between 20% and 60% [24,25,26]. In Chang 7 mudstones, the illite content is relatively high, ranging from 11.01% to 38.21%; the kaolinite content is low, not exceeding 6% of all clay minerals; montmorillonite and I/S are heterogeneously distributed with high contents found in a small proportion of mudstone samples, averaging 7.31% and 11.42%, respectively; and the chlorite content is relatively high, ranging from 5.11% to 33.04% [24,25,26]. The present research on the Chang 7 Shale Member focuses on its formation and shale oil and gas formation; no research is available on the adsorption of hydrogen by shale. Studying the adsorption of hydrogen by shale can help clarify the occurrence of natural hydrogen, further explain the impact of clay mineralogy on hydrogen adsorption, and provide insights for the exploration and development of natural hydrogen reservoirs. Utilizing natural hydrogen contributes to the promotion of sustainable energy development and utilisation, reduces reliance on traditional fossil fuels, drives green economic transition, and contributes to the sustainable development of future society and the environment.

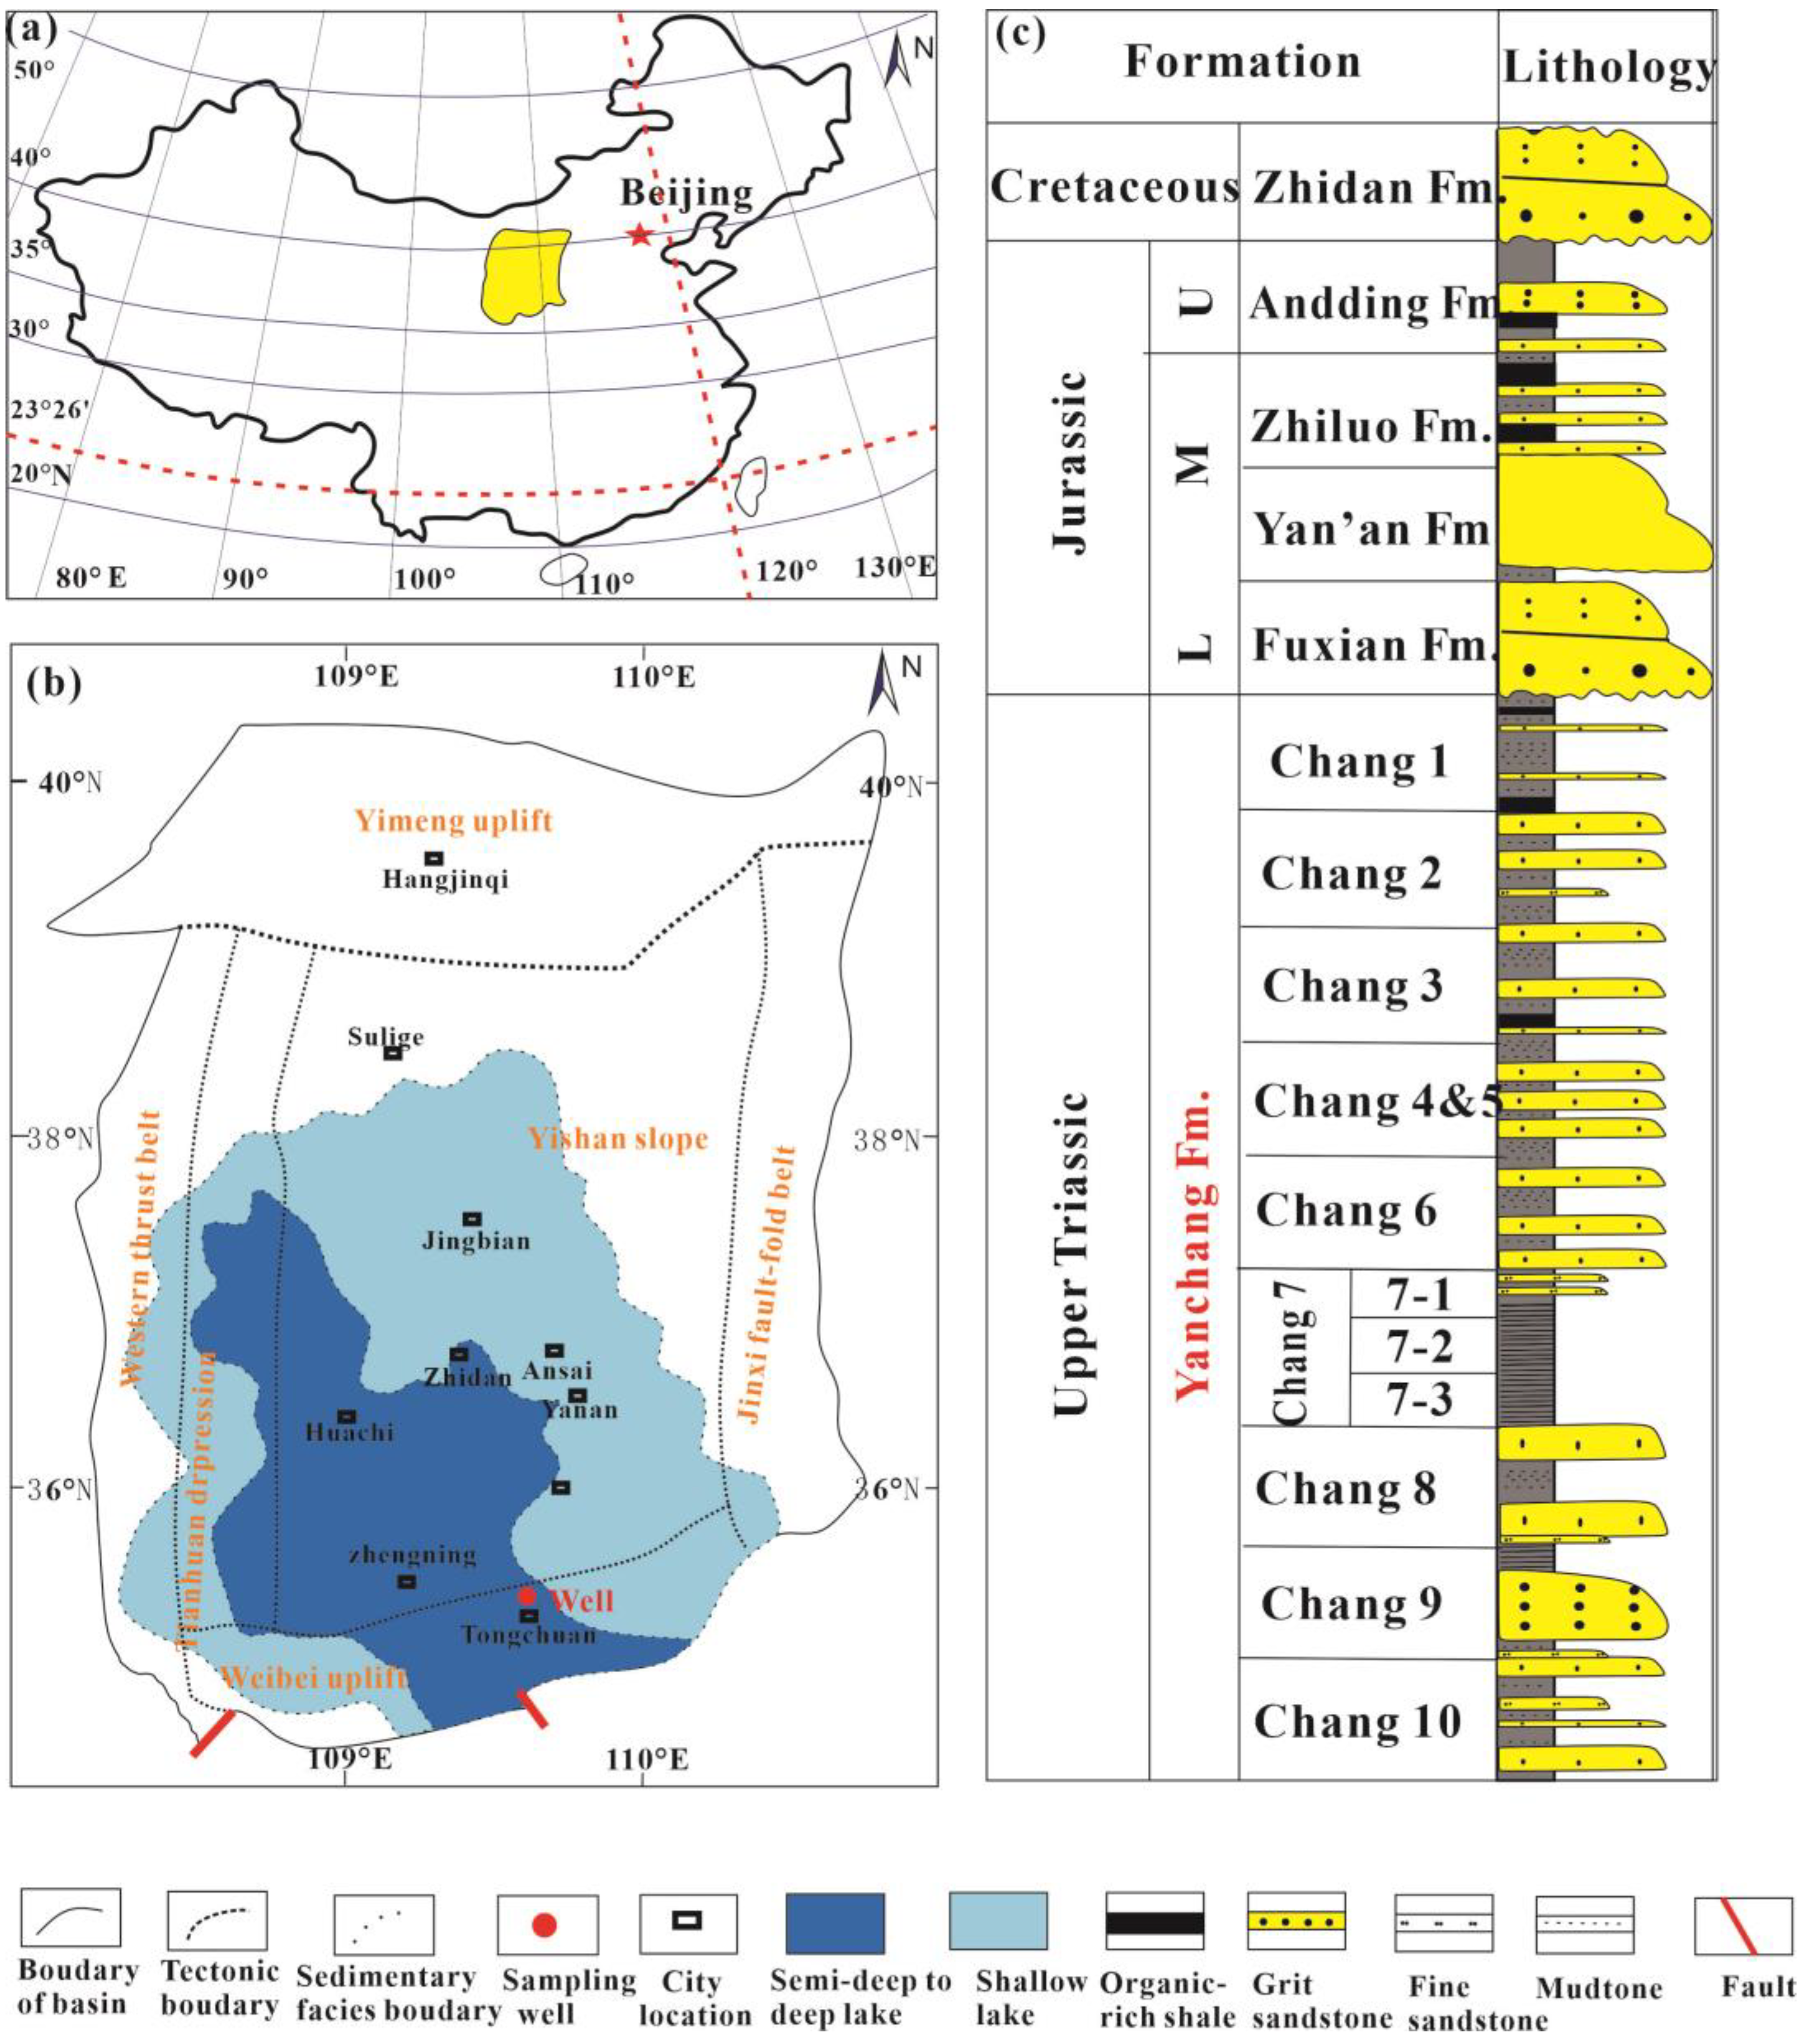
2. Geological Background

The Ordos Basin, a large multicycle superimposed basin, is the second-largest sedimentary oil and gas basin in China, and it contains the largest proven resources of natural gas, coalbed methane, and coal reserves in China [27]. In addition, it contains considerable reserves of petroleum, water, geothermal energy, rock salt, cement limestone, natural alkali, bauxite, and brown iron ore [28,29,30]. The structural history of the Ordos Basin includes the mid-to-late Proterozoic continental rift, an early Palaeozoic North China craton surface sea basin, a late Paleozoic to Middle Triassic intracratonic sag within the North China craton, the development of the Late Triassic to Cretaceous Ordos inland basin and the formation and development of small fault basins around the Ordos Basin in the Cenozoic era [27]. The structure of the Ordos Basin is characterised by a wide, gently sloping eastern side and a narrow, steeply sloping western side. The basin can be divided into six secondary tectonic units, including the Yishan slope, the Yimeng and Weibei uplifts, and others [31] (Figure 1a). During the Mesozoic period, owing to tectonic subsidence, the Ordos Basin became a large lake basin, where the main oil and gas source rock intervals developed [27,31].
During the Middle Jurassic period, a series of oil-bearing formations developed in the Ordos Basin, with the Triassic Yanchang formation being the main source rock. This fluvial–lacustrine–deltaic sedimentary unit records the entire evolution of the lake basin [32]. Based on lithological combinations, sedimentary cycles, and well-log characteristics, the Yanchang formation is divided into 10 segments labelled Chang 10–Chang 1 from bottom to top [33]. The Yanchang formation is interpreted as a third-order sequence and comprises the maximum flooding surface within the Chang 7 interval [34]. The Chang 7 Shale Member comprises deep-water black organic-rich shale, turbidite siltstone, and delta-front distributary channel sandstone. It has a thickness of 20–100 m and is found at depths of <3500 m in the central part of the basin [25,26,27,28,29,30]. It represents the Carnian stage of the Late Triassic and is further divided into the following three parts: Chang 73, Chang 72, and Chang 71. Chang 73, overlying Chang 8 deltaic sandstone, is dominated by thick black organic-rich shale with occasional interbeds of fine-grained siltstone [35]. Chang 72 and Chang 71 comprise interbedded dark grey shale, silt-rich shale, siltstones, and fine-grained sandstone [35]. The Chang 7 Shale Member types I and II kerogen have a total organic carbon content (TOC) ranging from 0.29% to 24.68% (average 13.75%). The Ro ranges from 0.7% to 1.2% [36]. The reservoir is primarily composed of siltstones and fine-grained sandstones, with porosities ranging from 4.8% to 12.6% and permeabilities ranging from 0.01 to 1.35 mD [37]. The Chang 7 Shale Member is known for its high oil content, homogenous distribution, and large reserves. As of 2008, its known reserves exceeded 500 million tonnes, with predicted reserves exceeding 1.3 billion tonnes [38].

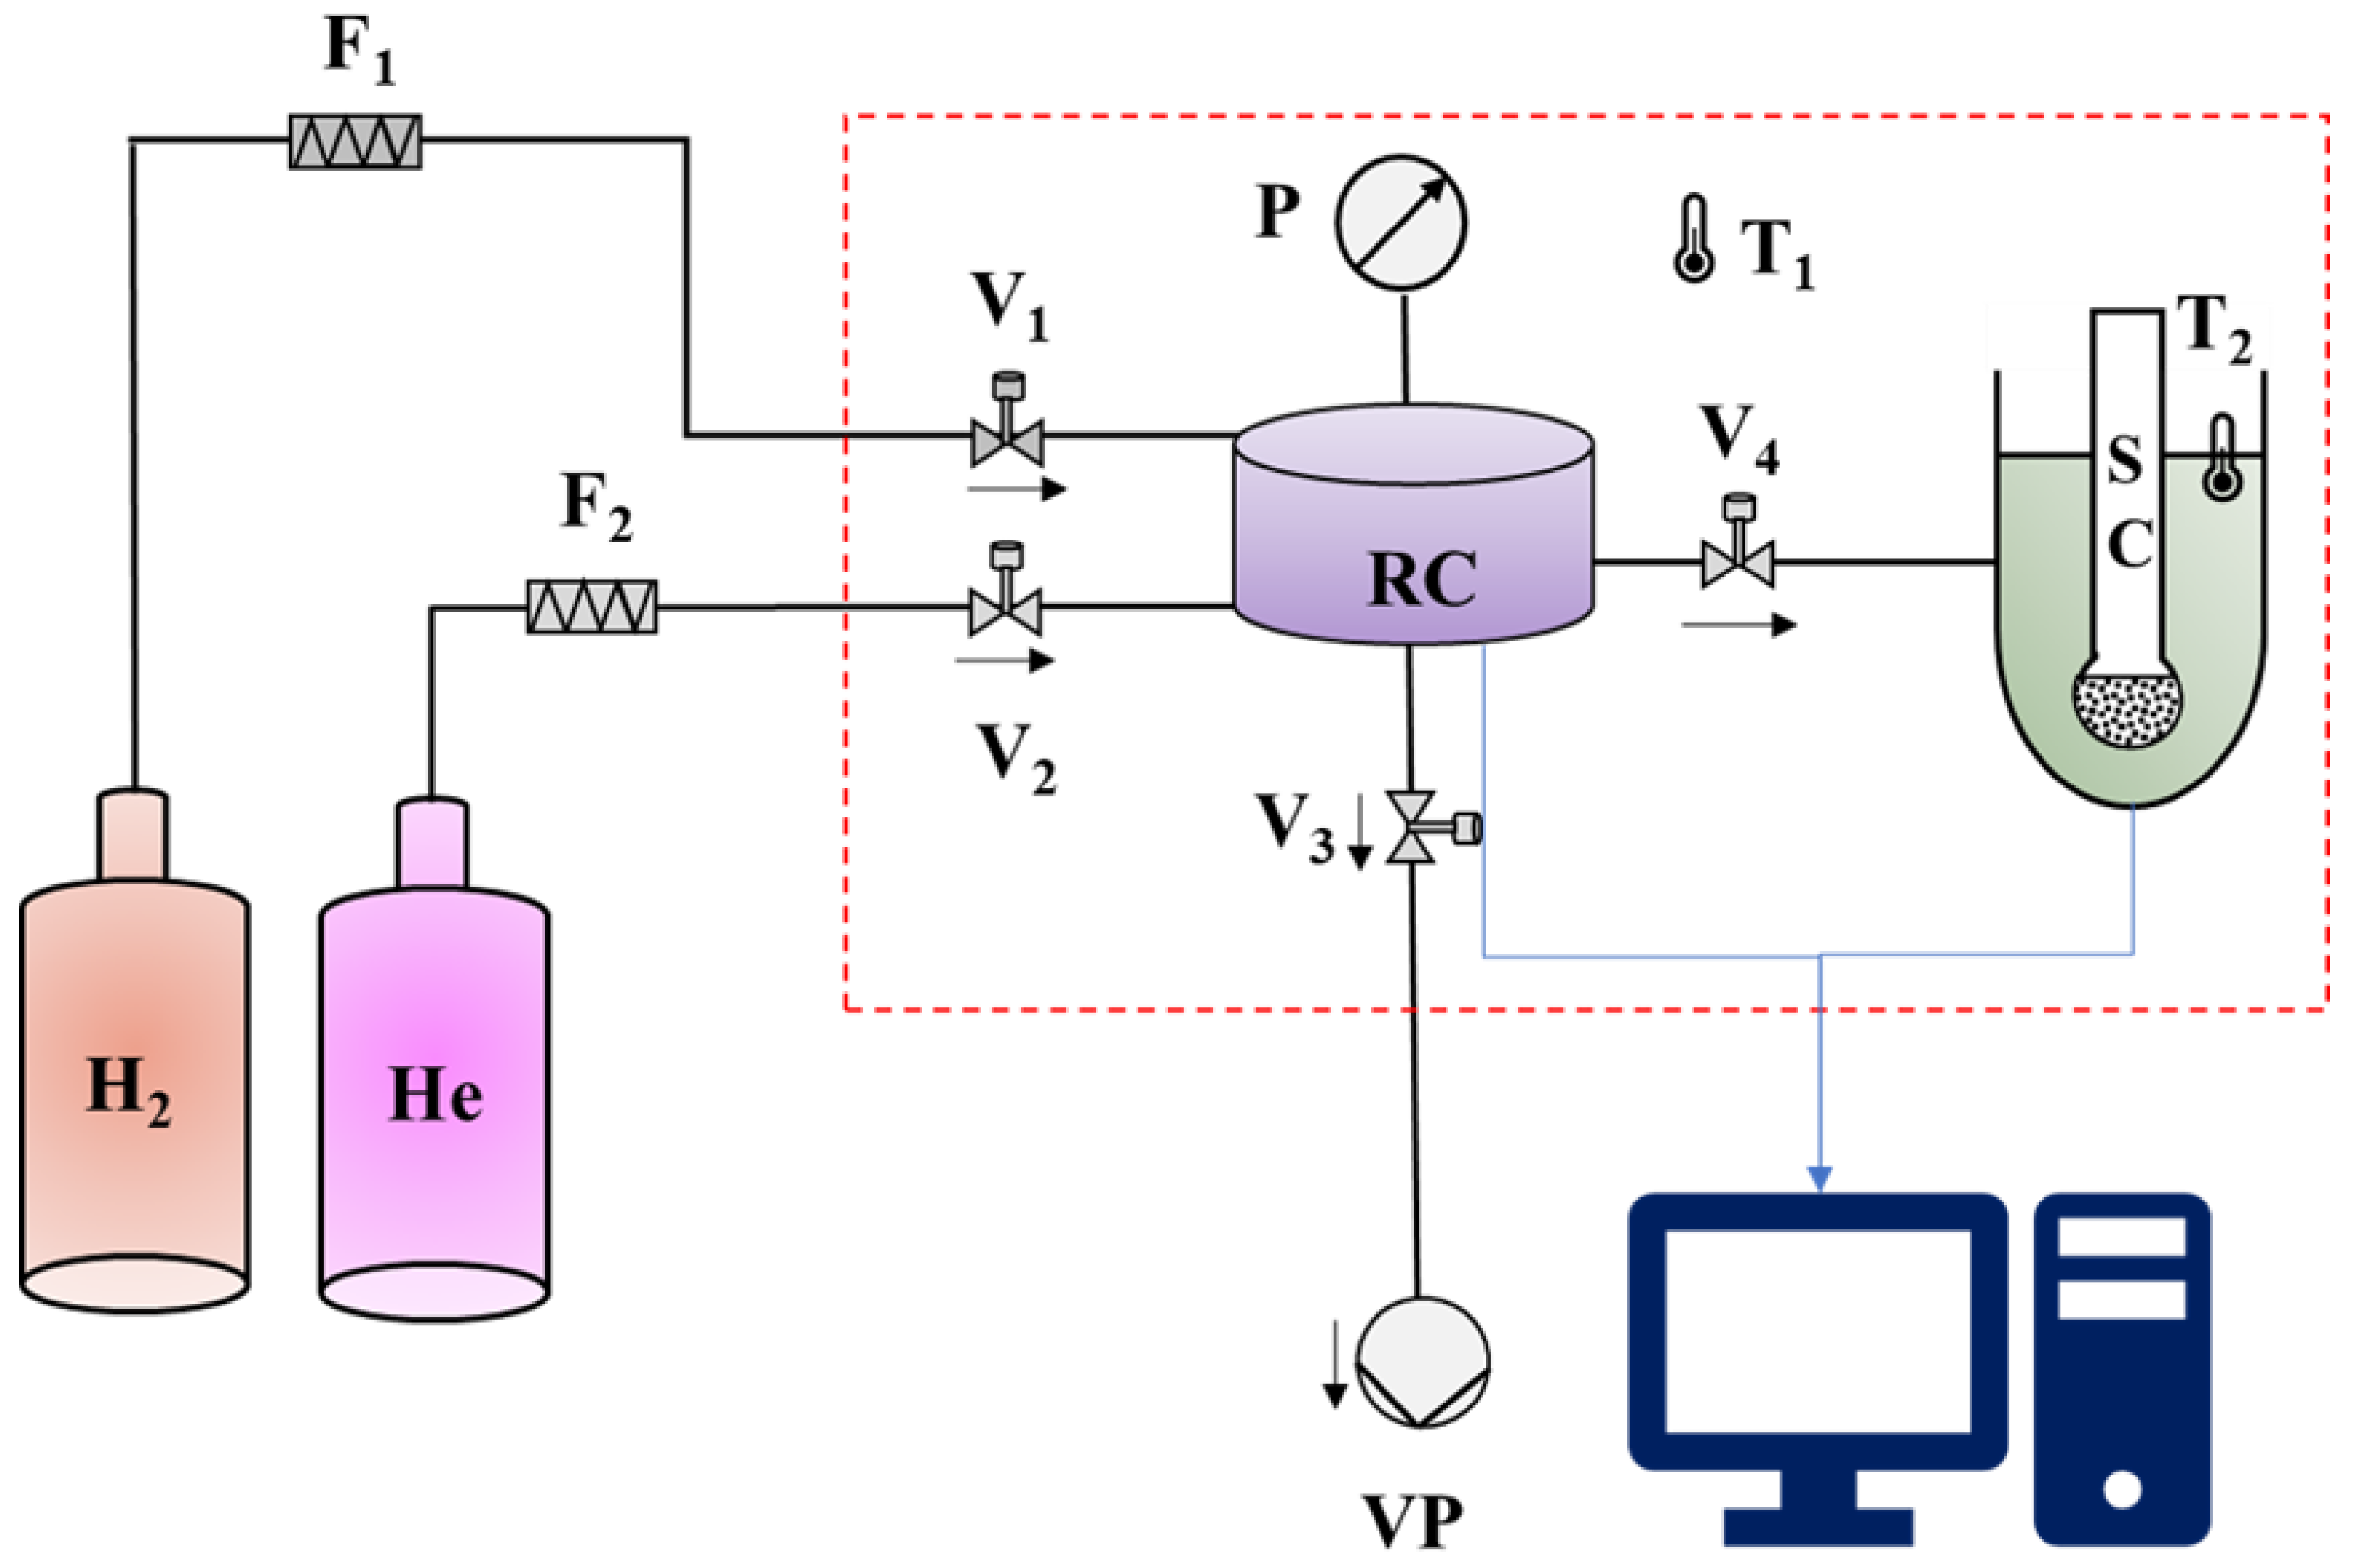
3. Materials and Methods

The samples used in this study were collected from wells near Tongchuan (Figure 1) covering the interval of the Chang 7 Shale Member. Most samples were black/deep grey shales or silty shales. The samples were cut into 30 μm thick sections, and a polarising microscope (EOS 700D; Canon, Tokyo, Japan) was used to analyse their sedimentary structures and composition. A polarising microscope (DM4500P; Leica, Wetzlar, Germany) with reflected and fluorescent light was used to observe the same spots in the thin sections. Subsequently, scanning electron microscopy (SEM; Gemini 300, Carl Zeiss AG, Oberkochen, Germany) was performed on gold/palladium-coated slices and rock fragments to further identify the microtextures and pore characteristics of the samples. The X-ray diffraction (XRD; Panaco Empyrean; PANalytical B.V., Almelo, The Netherlands) of sample components was conducted with 2θ values ranging from 5° to 90°. To determine the composition of clay minerals in the samples, a suspension centrifugation separation method was used to separate the clay, which was then dried and ground to a fine powder. The samples were then prepared as air-dried-oriented slides, ethylene glycol-saturated slides (8 h ethylene glycol saturation at 55 °C), and high-temperature slides (ethylene glycol-saturated slides treated for 3 h at 500 °C). XRD spectra were obtained to determine the clay mineral types, and peak fitting was performed using the symmetric Gaussian–Lorentzian function theory. The mass percentages of clay minerals were quantitatively calculated, and the K values of standard samples were used for calibration.
In order to obtain the total organic content (TOC), the samples were ground to approximately 100 mesh (<0.15 mm), and a carbon/sulfur analyser (LECO CS230) was used according to the Chinese National Standard (2003) 19145-2003 [39]. Before the measurement, 100 mg of powdered shale (100 mesh) was treated in a 5% HCl solution at 80 °C to remove inorganic carbonates. Nitrogen adsorption experiments were conducted using an adsorption analyser (ASAP2020; Micromeritics, Norcross, GA, USA) with dried (non-extracted) shales with a 40–60 mesh particle size. The samples were first vacuum-degassed for 12 h at 105 °C, followed by N2 adsorption measurements at −196 °C in a liquid nitrogen bath at relative pressures (i.e., P/P0) ranging from 0.001 to 0.995. The data were analysed according to the following physical adsorption theories: Gurvich, Brunauer–Emmett–Teller (specific surface area [SSA]), Barrett–Joyner–Halenda (pore volume distribution and total pore volume [TPV]) and Dubinin–Astakhov (micropore volume) [40].
High-pressure hydrogen adsorption was conducted at 25 °C, 45 °C, and 65 °C from 0 to 18 MPa using BSD-PH automatic high-pressure gas adsorption instrument (Figure 2). The sample filling quantity was approximately 30 g to ensure testing accuracy. The volume method was used for testing, and the expansion of the samples was determined using helium. High-precision pressure sensors were used to measure the pressure. Before hydrogen was introduced, the system was evacuated to remove residual gases. For the adsorption measurements, hydrogen gas was continuously transferred from the reference cell to the sample cell. The difference in the transferred gas volume and the free gas volume in the sample cell was the excess hydrogen adsorption. Hydrogen molecules are small, and adsorption equilibrium is achieved quickly, typically within a short period. At each pressure point, the contact duration was approximately 40 min, and the entire adsorption experiment took about 13 h. Regarding the determination of equilibrium, the instrument used in this experiment was the static volumetric method, where equilibrium was judged based on the pressure change within a certain time frame. The equilibrium condition employed in this test was a pressure change per minute less than 0.1% of the current pressure, ensuring that the adsorption error was less than 0.01 mL/g (STP). We supplement relevant details in the methodology section. The specific method can be found in [15].

4. Results

4.1. Characteristics of the Chang 7 Shale Member Samples

The whole rock mineral compositions of the samples are listed in Table 1. Clay minerals, including illite, kaolinite, chlorite, and montmorillonite, dominated the shale samples. The total clay mineral content in samples 412, 413, and 427 was 41%, 45% and 44%, respectively. Quartz and feldspar were the next-most abundant minerals. Carbonates, pyrite, and other minerals were also present alongside the pyrite content in samples 412, 413, and 427, which are 4%, 5%, and 6%, respectively. To accurately analyse the composition of clay minerals, the relative content of the clay minerals was calculated and is presented in Table 2. I/S constitute the majority, exceeding 85%, followed by illite, and chlorite and the kaolinite content is ~1%. The whole rock mineral compositions of the SK2 samples are listed in Table 3.
The maximum pyrolysis temperature (Tmax) and TOC data for the samples are shown in Table 4. The Tmax was between 435 °C and 436 °C. The Tmax is commonly used to evaluate the organic maturity of source rocks. According to statistical studies, the Tmax of 435 °C indicates the beginning of hydrocarbon generation, corresponding to a Ro of 0.5% [41]. Within the range of 435–440 °C, oil and gas generation in the source rocks was limited. Temperatures above 440 °C allowed for abundant oil and gas production. Compared with these standards, the samples were in the early stage of maturity. TOC is the total amount of all organic carbon in shale, including kerogen and other organic matter components. It is the result of kerogen formation through pyrolysis, compaction, and dehydrogenation [25]. TOC is usually used as an important parameter to evaluate the abundance of organic matter in shale and oil and gas exploration potential [24]. The TOC content of samples was between 8 and 15%, and all of them were >2%. Hence, the shale is organic-rich shale.

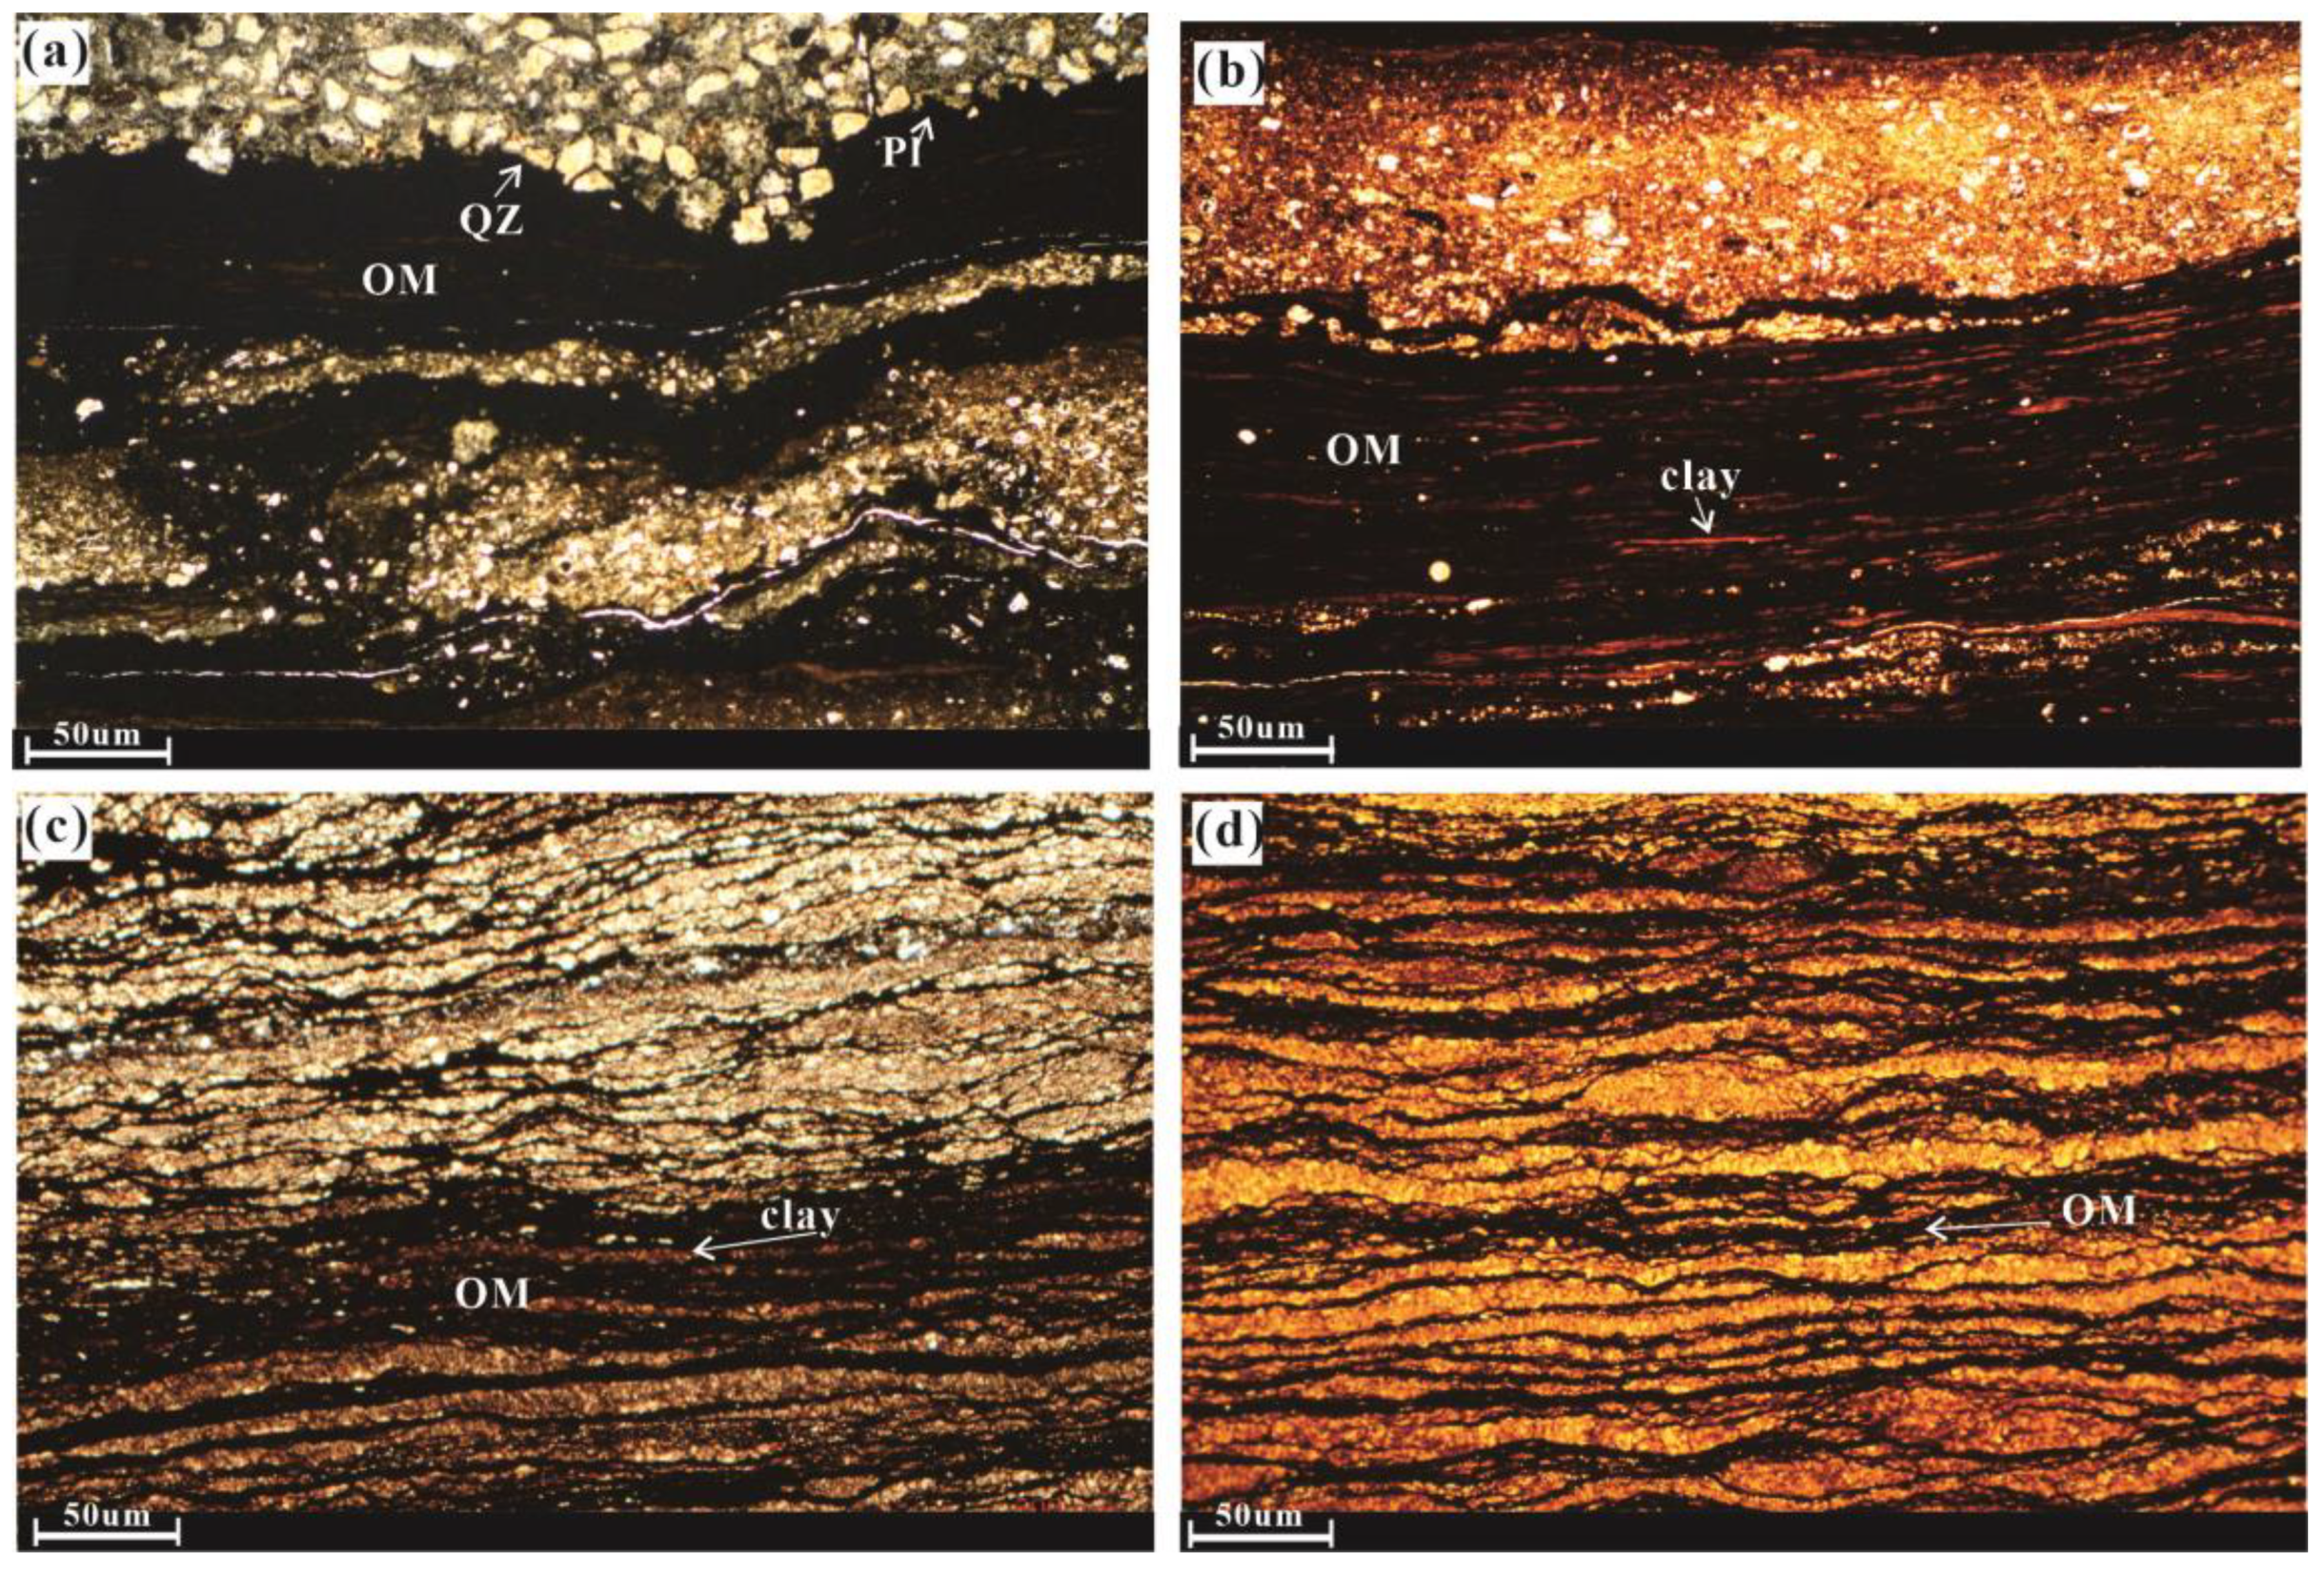
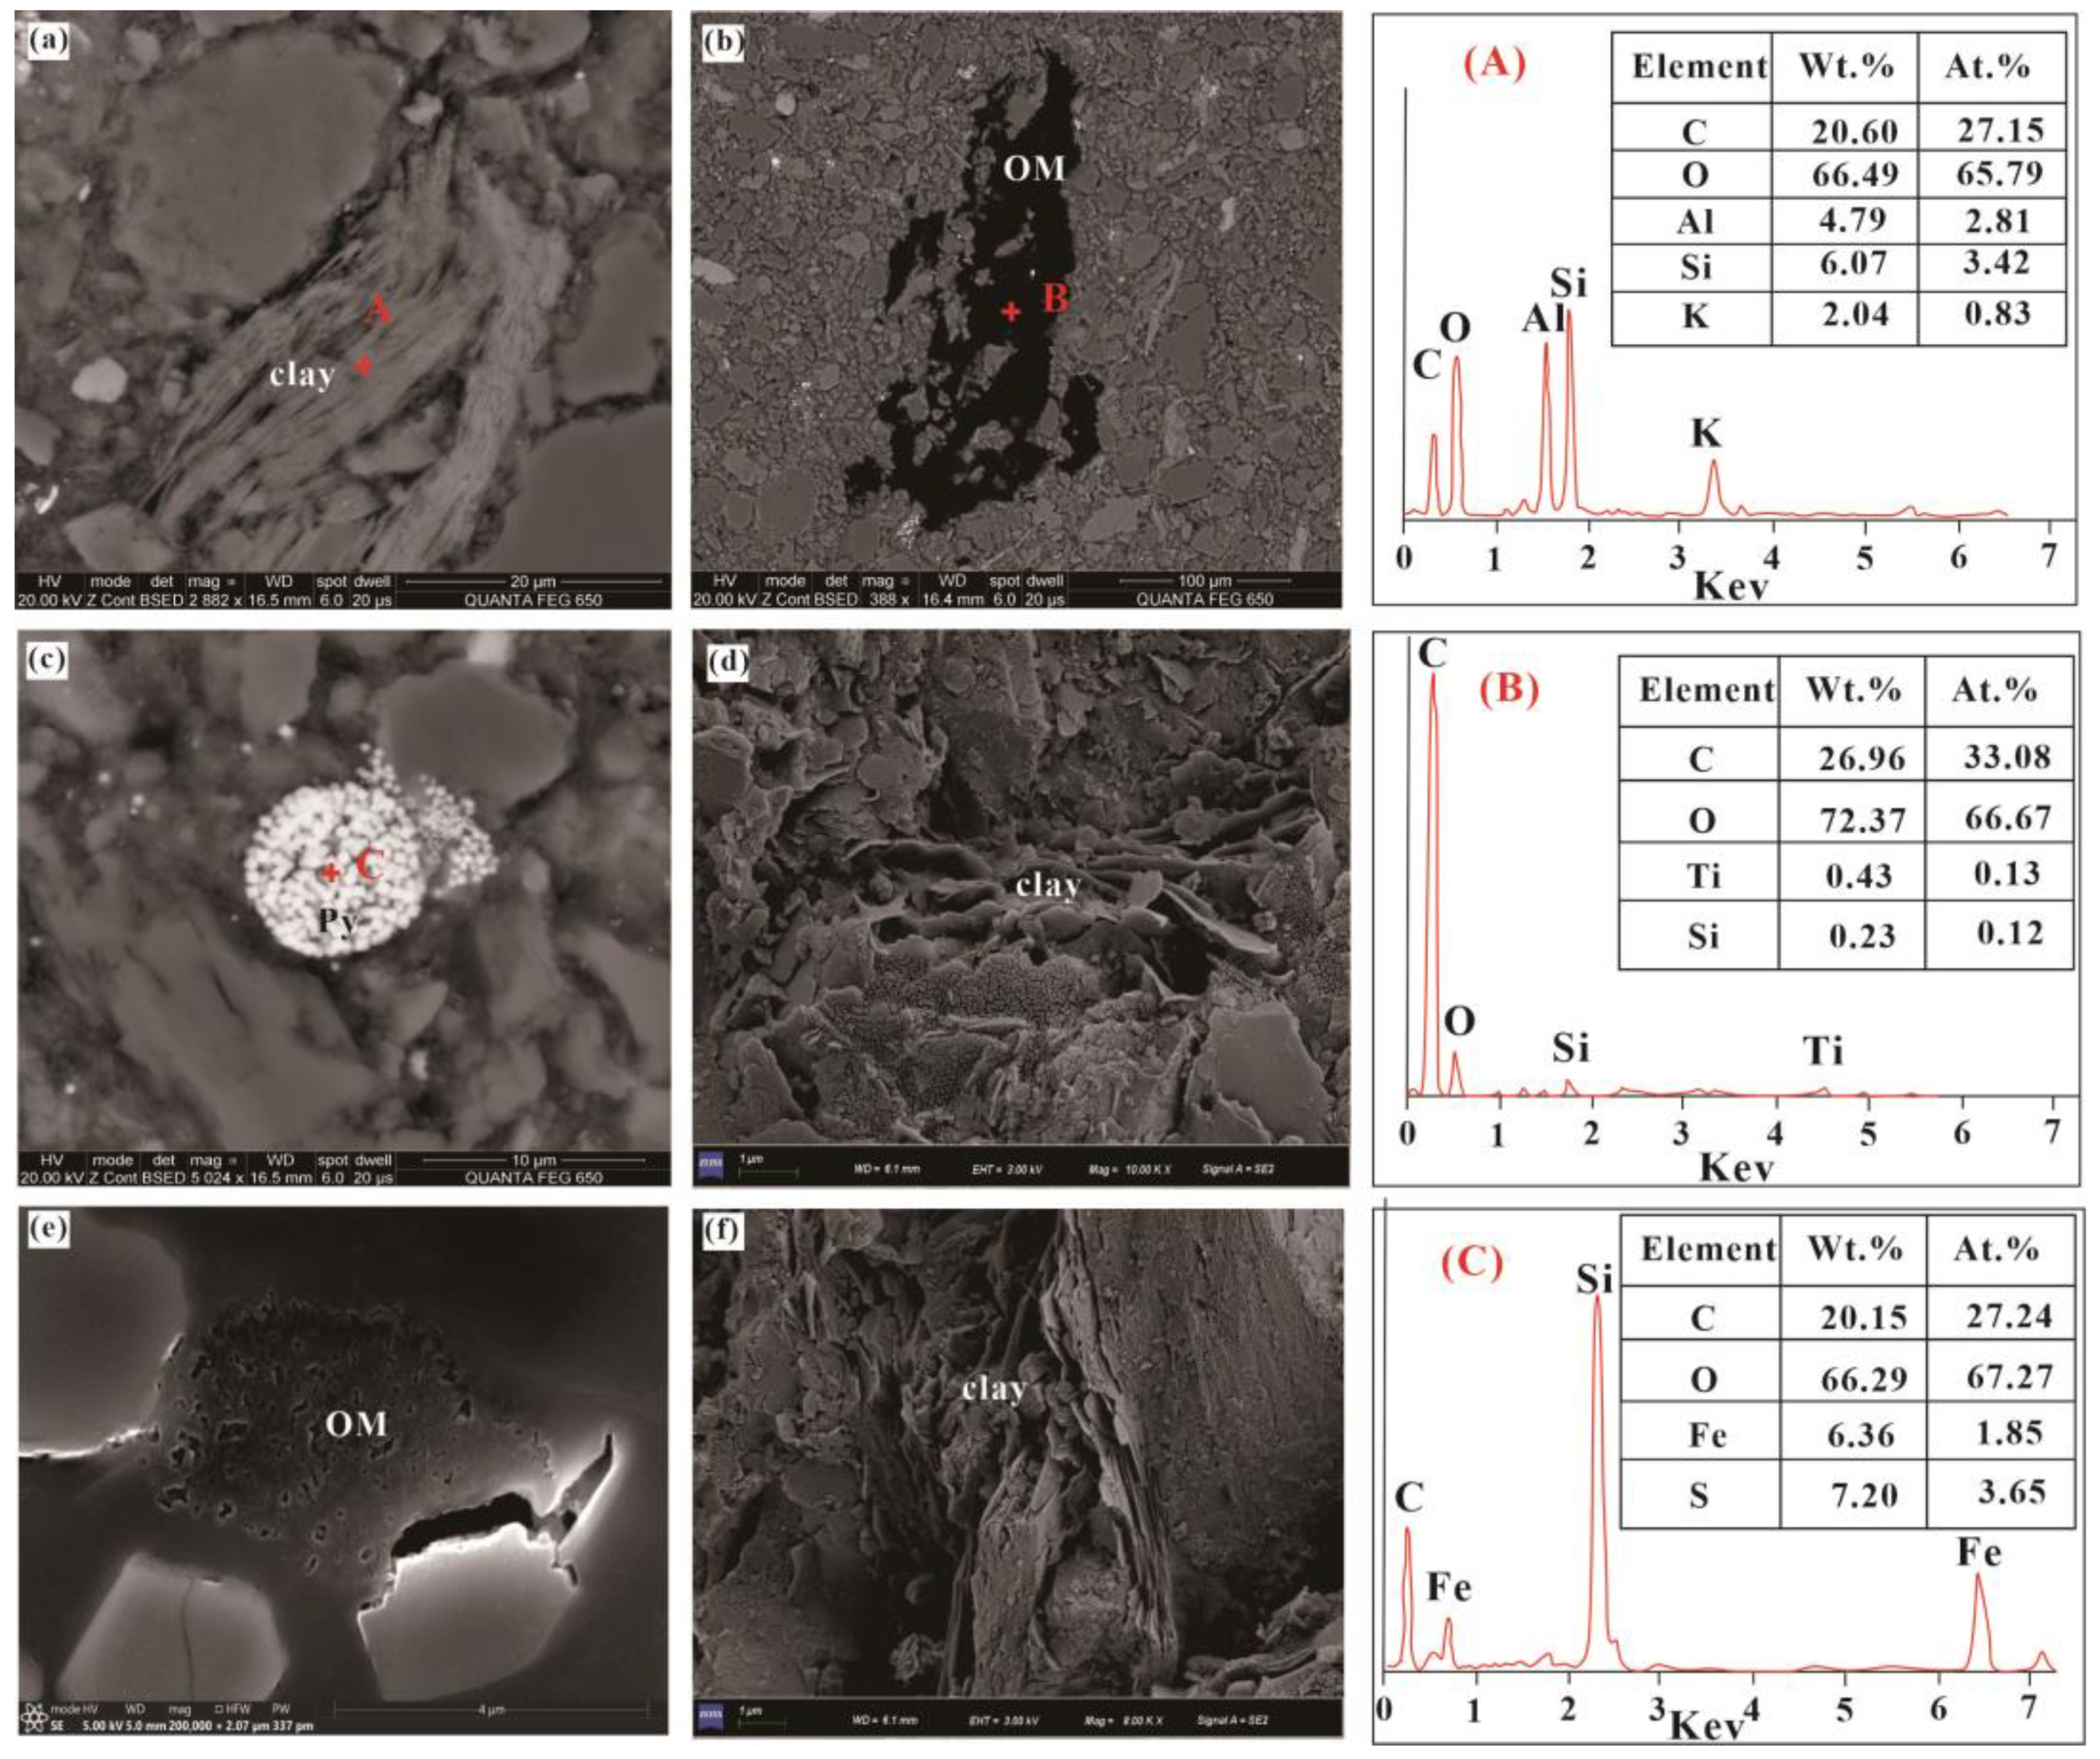
4.2. Microscopic Characteristics of the Chang 7 Shale Member

The thin Chang 7 Shale Member sections revealed well-developed lenticular horizontal and wavy bedding primarily composed of bedded organic matter and clay minerals (Figure 3a–d). These lens-shaped large particles are mainly composed of clay minerals, feldspar and quartz. Figure 3a shows a distinct feldspar and quartz layer overlying thick layers of organic matter containing lens-shaped layers of quartz and feldspar particles. The lower area of Figure 3b shows thinly bedded layers with a high organic matter content; no quartz or feldspar mineral interlayers were observed. The upper area of Figure 3c shows thick layers of clay, quartz, and feldspar, whereas the lower area shows alternating thin, approximately horizontal layers of organic matter and clay, quartz, and feldspar. Figure 3d shows wavy bedded organic matter with some lens-shaped layers and clear layer boundaries. Overall, the Chang 7 Shale Member is rich in organic matter.
The Chang 7 Shale Member is characterised by a relatively high clay mineral content, with the highest proportion found in the I/S (average 88%). Subsequently, the content is observed for illite (average 9.33%), chlorite (average 2%), and kaolinite (average 0.667%). Therefore, the diagenesis of clay minerals may have resulted in the transformation of montmorillonite to illite or I/S, leading to the development of numerous inter- and intragranular pores. Pores in the I/S are generally irregular with uneven edges, which often develop into aggregates of sheet-like pores, forming many intragranular pores (Figure 4d,f). Considerable intragranular pores are also present in the illite. In addition, owing to the considerable content of quartz and feldspar in the samples, cementation or alteration may have occurred within the pores, generating numerous intracrystalline pores during the filling process. Intragranular (intracrystalline) pores are one of the most common pore types that play a crucial role as gas storage spaces [42].
Intergranular pores are widely distributed in the samples, as seen in the strawberry-shaped pyrite (Figure 4c). The pores between the pyrite minerals appear spherical or triangular, depending on the shape of the pyrite. The framboidal pyrite has a particle size of approximately 5 μm, and the intergranular pores are well developed. Intergranular pores are also present between different clay mineral particles; moreover, they are concentrated in the I/S and illite aggregates (Figure 4d,f). Intergranular (intercrystalline) pores are widely and generally densely distributed. Owing to the connectivity between pores, some pores have larger diameters, and they form microfractures.
Furthermore, the Chang 7 Shale Member has a high organic matter content (Figure 4b,e). Organic matter pores were observed in the SEM images. They generally have small diameters. Some pores exhibit good internal connectivity, providing excellent channels for hydrogen storage, transport, and transfer [43]. These pores are formed by two main processes: organic matter maturation and the formation of pores and shrinkage cracks within the organic matter owing to shrinkage. These organic pores include bubble-, sheet- and honeycomb-shaped pores.

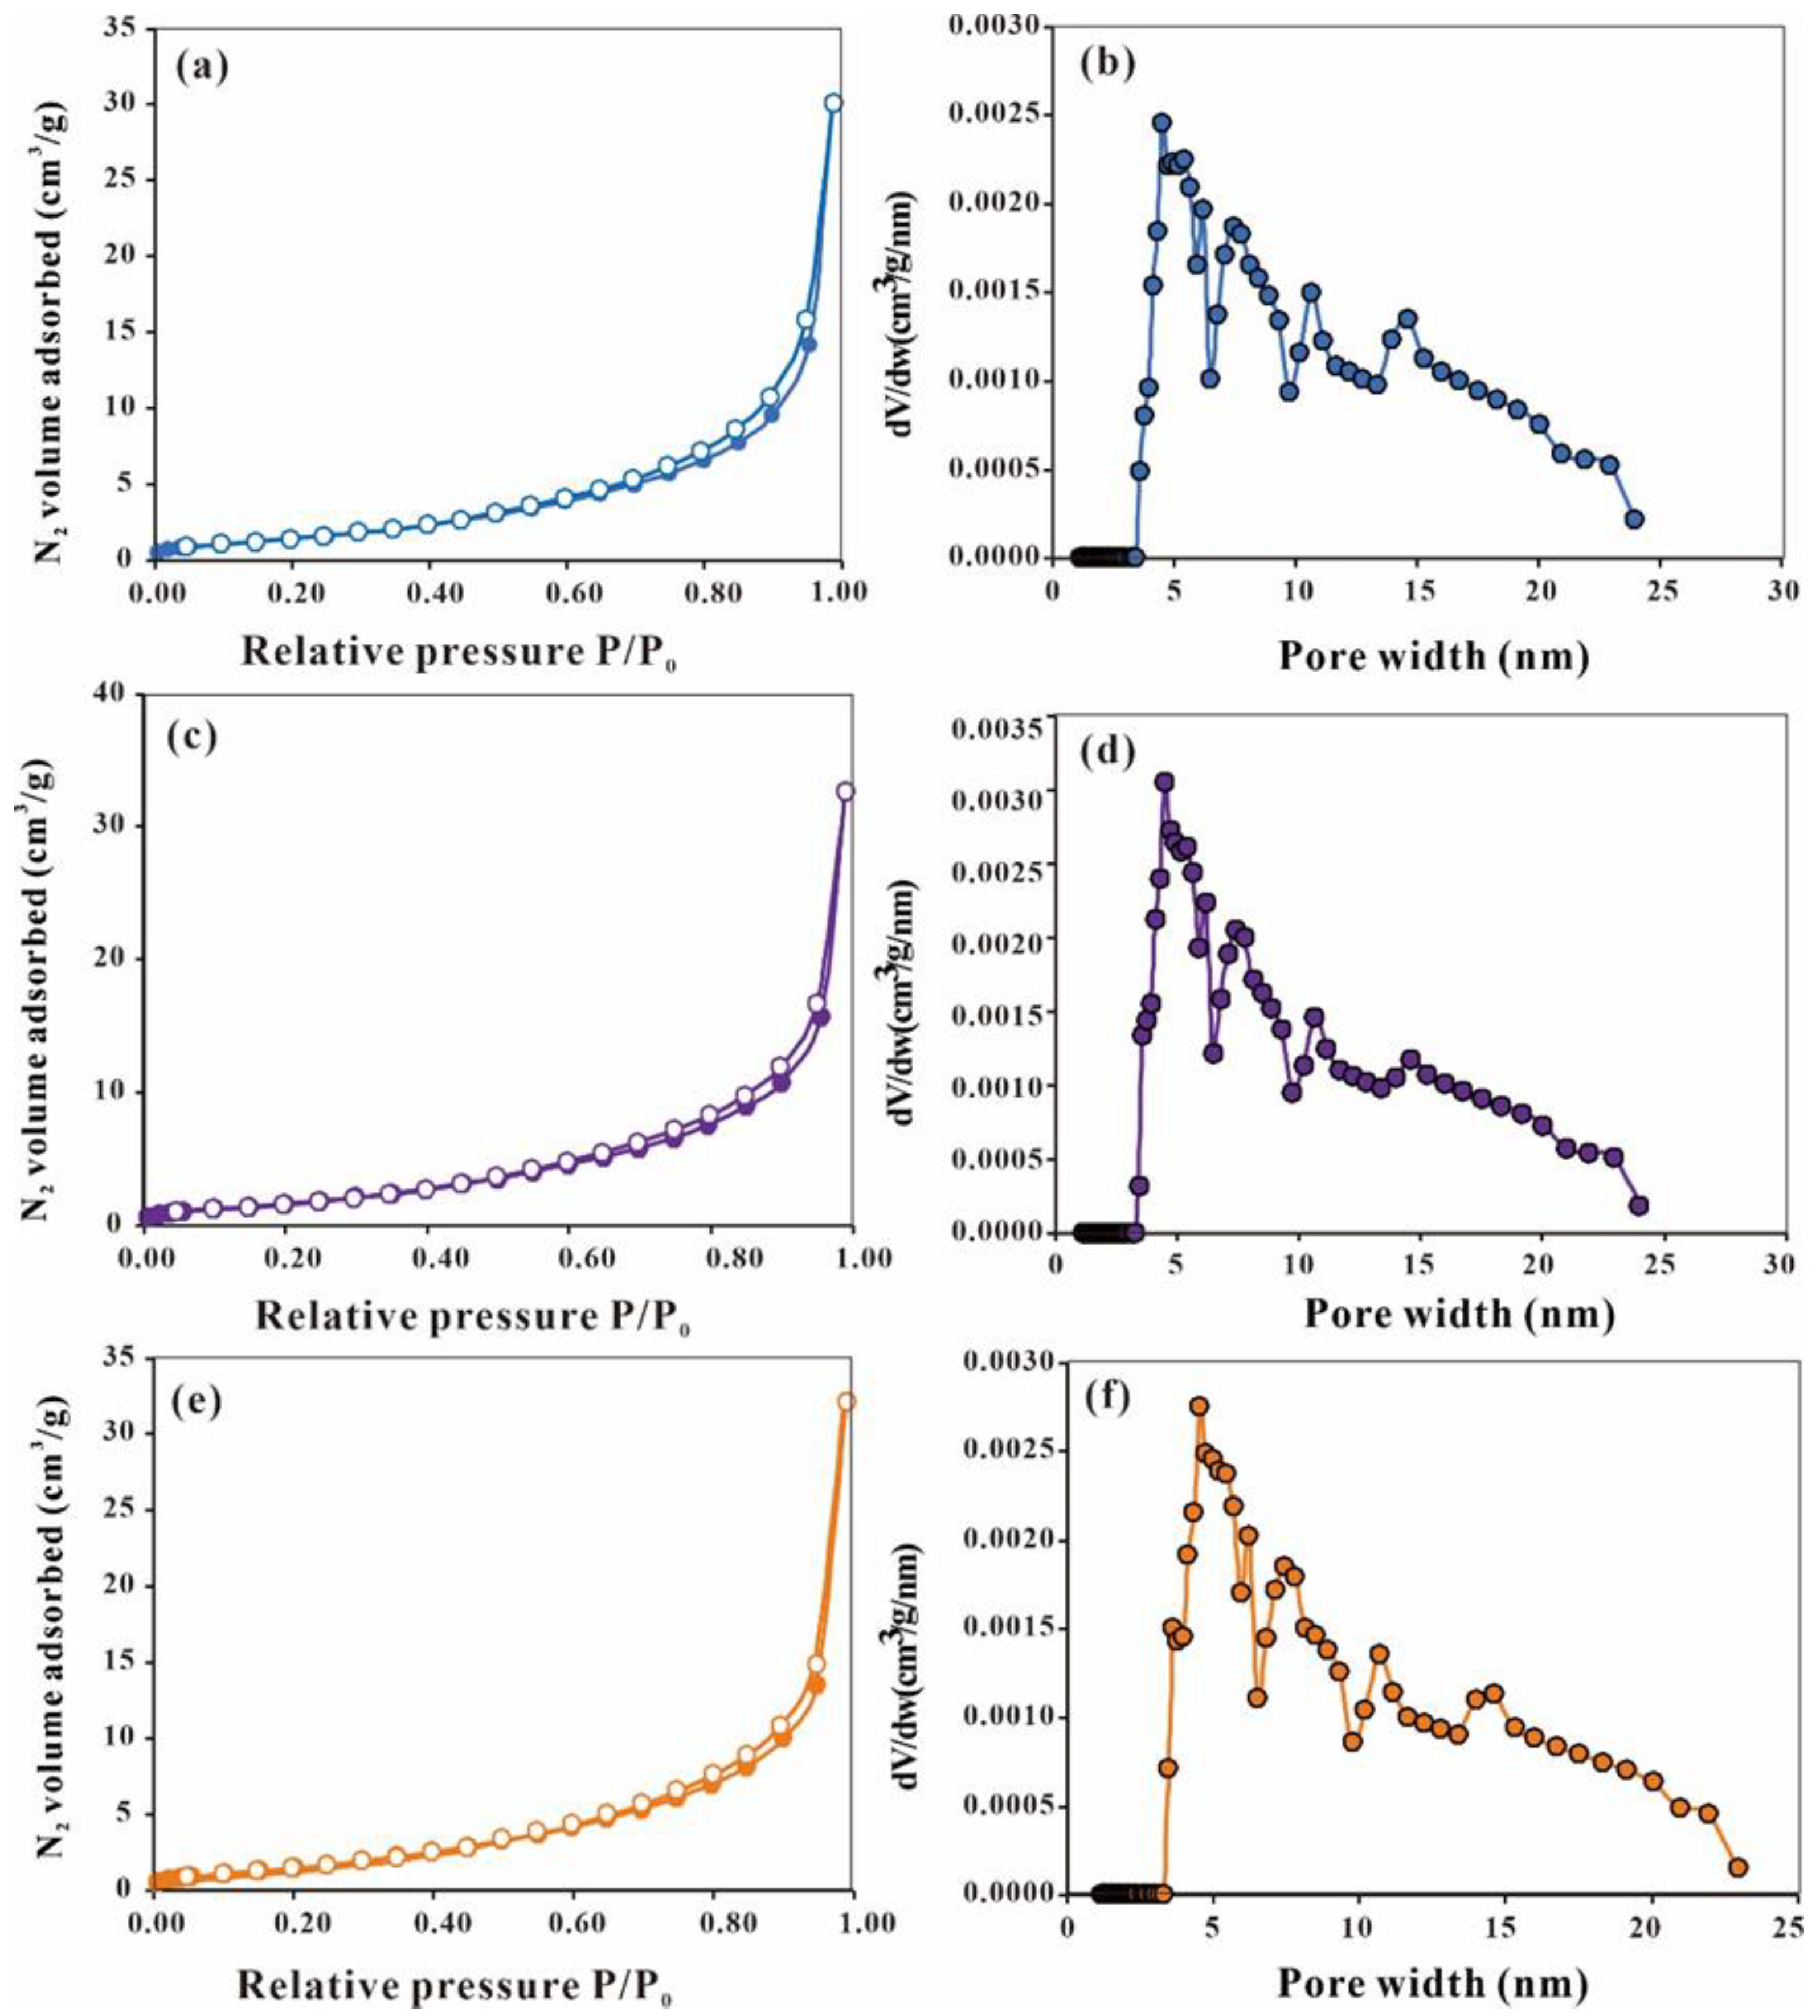
4.3. Pore Characteristics of the Chang 7 Shale Member

As shown in Figure 5, based on the International Union of Pure and Applied Chemistry (IUPAC), the nitrogen adsorption–desorption isotherms of the samples exhibit a typical type V shape with a concave isotherm with no inflection point. The adsorbed gas volume increased with the component’s partial pressure. The concave isotherm was attributed to the stronger interaction between adsorbate molecules than that between the adsorbate and adsorbent [44,45]. The relatively small adsorption heat of the first layer compared with the liquefaction heat of the adsorbate leads to initially difficult adsorption; however, as the adsorption progresses, self-acceleration occurs, and no limit to the number of adsorption layers exists. In addition, owing to capillary condensation, the isotherm rises rapidly in the mid-pressure range and is accompanied by a hysteresis loop. The hysteresis loop is an H3 type, indicating the presence of pores, such as platy fissure structures, cracks, and wedge-shaped structures. These may be pore fissures formed by accumulating lamellar clay mineral particles that exhibit non-saturation in high relative pressure regions and a considerable rise in the high relative pressure region, suggesting the presence of large pores in the samples [44,45]. The analysis results of nitrogen adsorption–desorption isotherms are shown in Table 5.

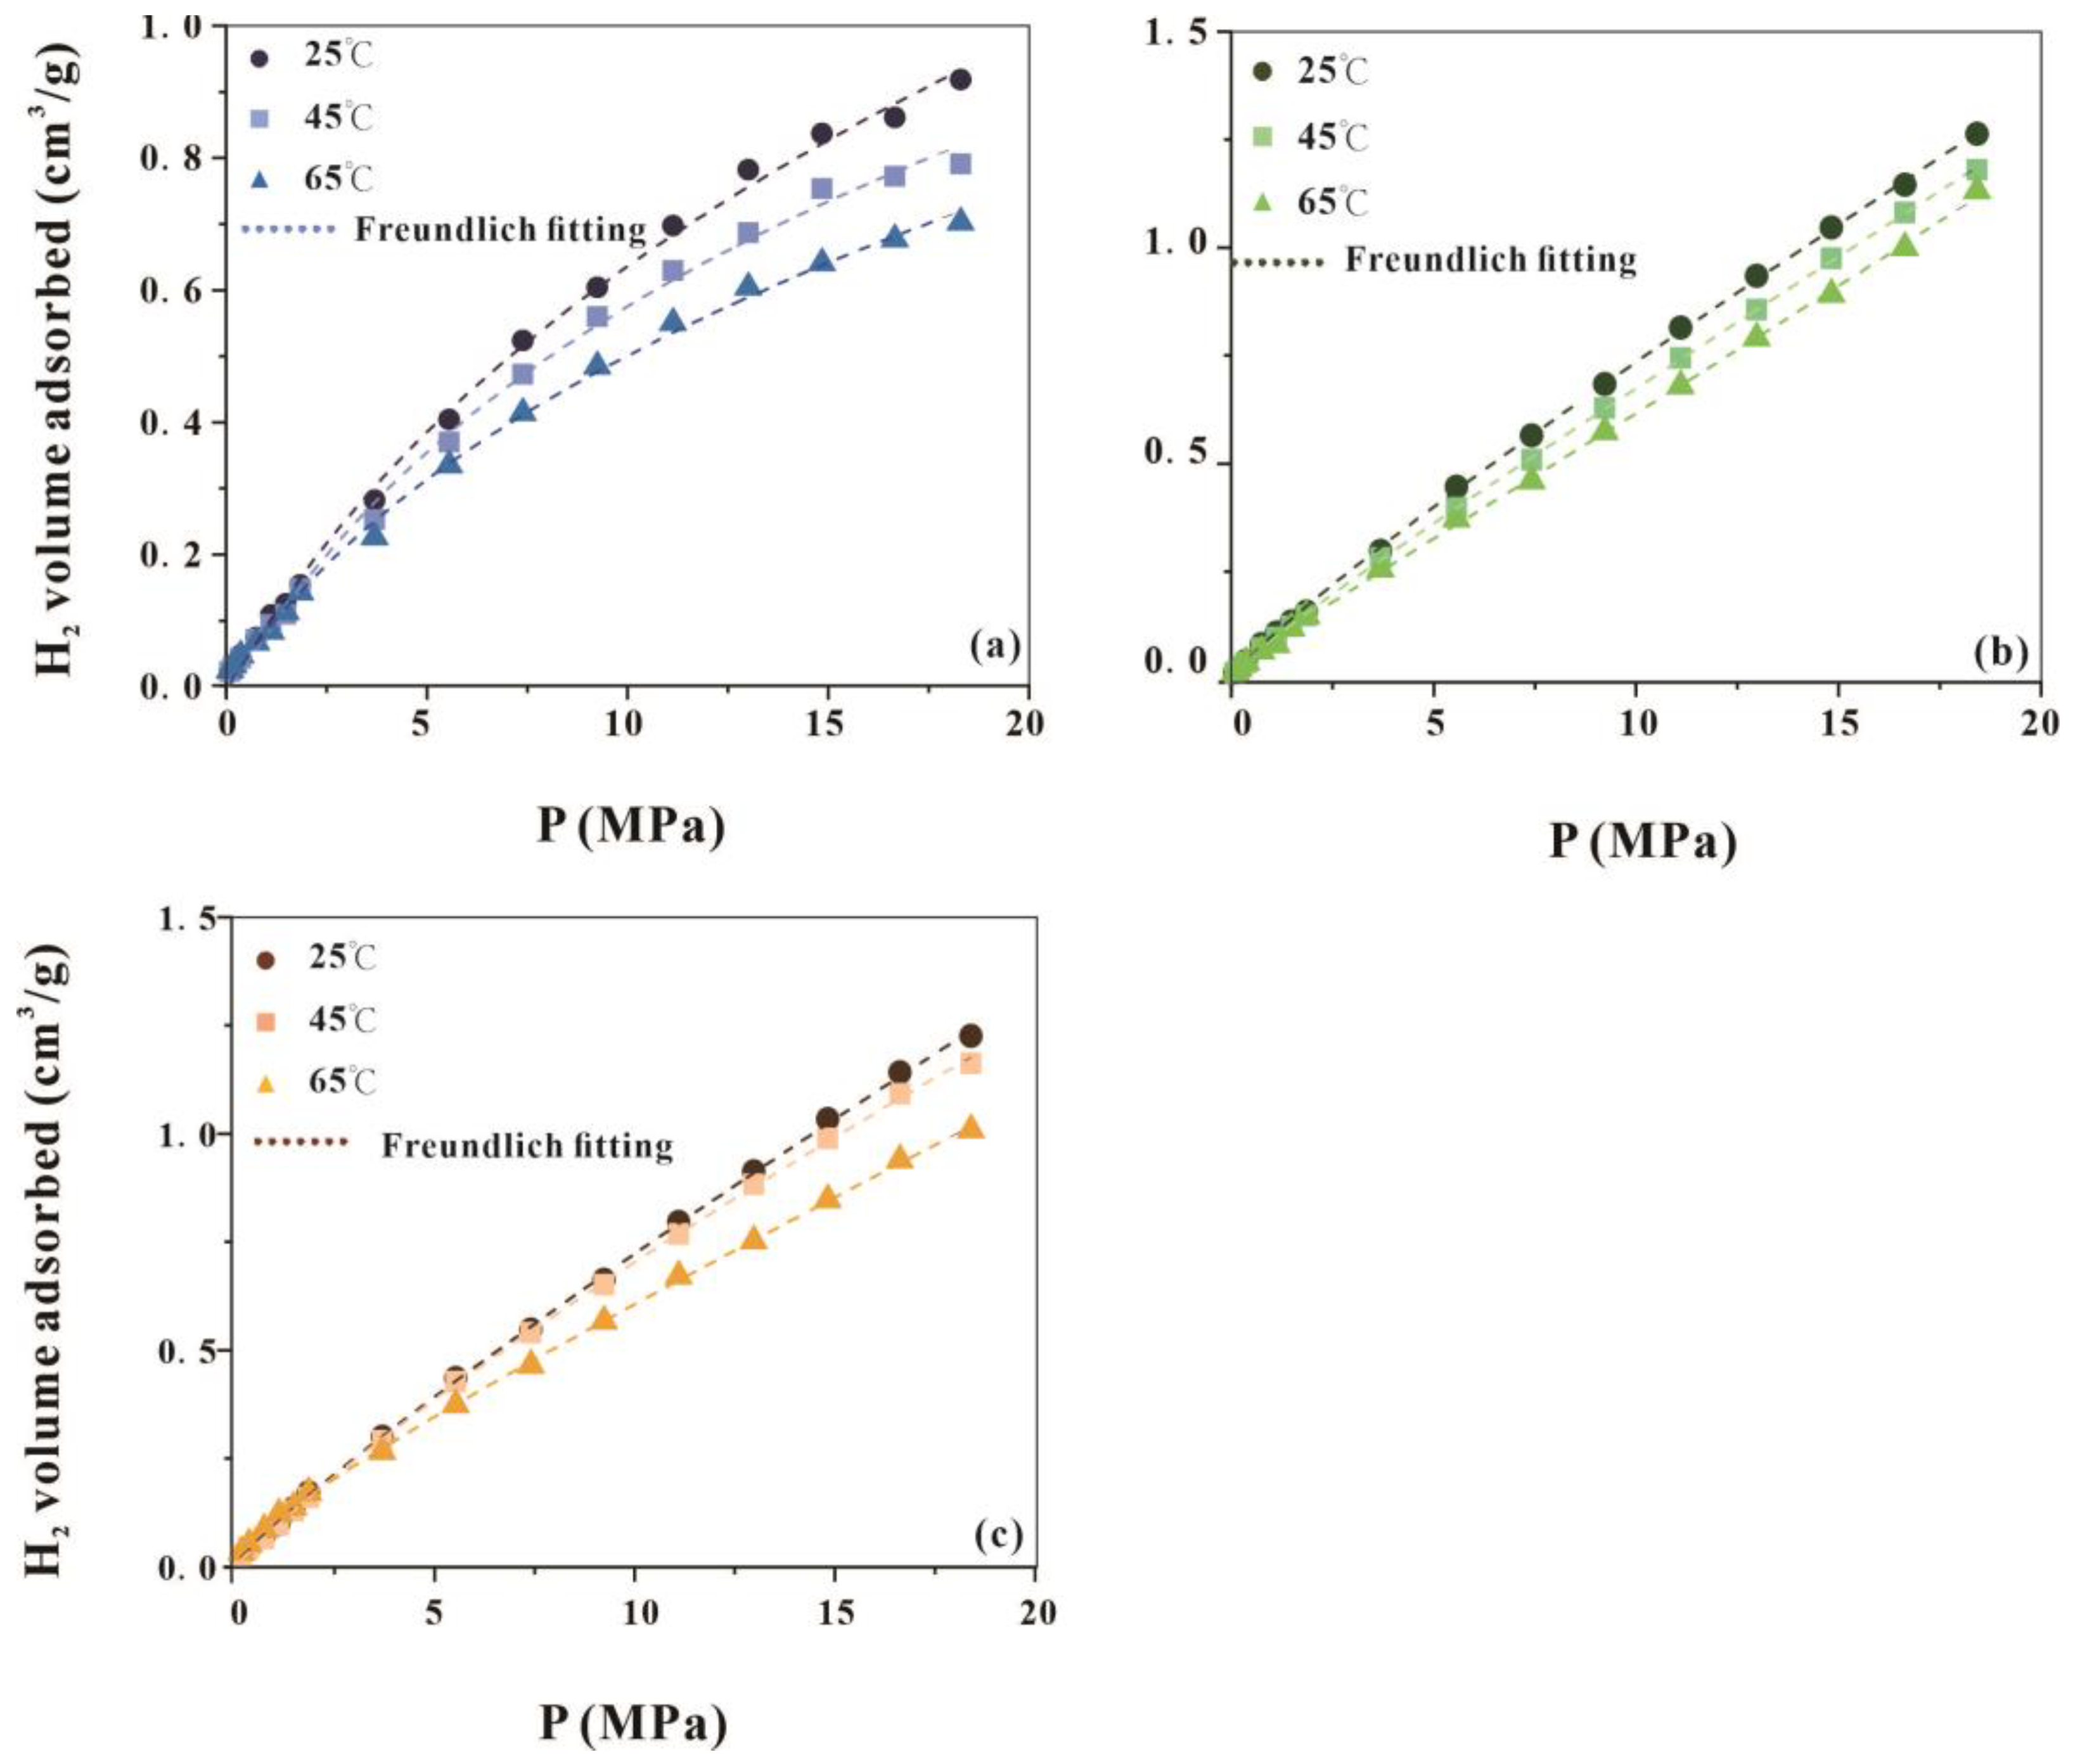
4.4. High-Pressure Hydrogen Adsorption Capacity of the Chang 7 Shale Member

As shown in Figure 6 and Figure 7, the high-pressure hydrogen adsorption curves of the samples indicate that, with increasing temperature, the adsorption capacity of shale for hydrogen decreases, whereas, with increasing pressure, the adsorption capacity of shale for hydrogen increases. The shale hydrogen adsorption follows Freundlich and Langmuir equations. The Freundlich equation is expressed as τ = x/m = kpn, where m is the mass of the adsorbent, x is the amount of the adsorbate, and n and k are empirical constants. The Langmuir equation, assuming monolayer adsorption, is given by V a d s e x c e s s = V L P / ( P + P L ) , where V a d s e x c e s s (cm3/g rock) is the excess sorption amount, V L (cm3/g rock) is the maximum Langmuir capacity, P (MPa)is the gas pressure and P L (MPa) is the Langmuir pressure at which half of the sorption sites are occupied. The parameters for the Freundlich and Langmuir equations are presented in Table 6. The Freundlich equation provides a better fit, which is consistent with previous studies on Sichuan Basin shales [46].

5. Discussion

Organic matter (kerogen) and clay minerals are the main components that influence gas adsorption in shale. A study on SK2 mudstone, comprising mainly purple and green mudstones and mudstone–siltstones containing almost no organic matter and only one clay mineral (2–8% chlorite), found that under the same temperature and pressure conditions used in this study (i.e., 25 °C, 18 MPa), the hydrogen adsorption capacity of the shale was 2–12 times higher than that of SK2 mudstone. This indicates the importance of organic matter and clay minerals for hydrogen adsorption.
Wang et al. compared the hydrogen absorption capacity of shale with and without organic matter (kerogen) at the same temperature (30 °C) and revealed that samples without organic matter had a considerably lower hydrogen adsorption capacity than those containing organic matter and the adsorption capacity of the sample without organic matter accounted for more than half of the sample with organic matter [46]. Inorganic components include clay minerals, quartz and feldspar, and clay minerals, which are the main components of hydrogen adsorption. Therefore, their experimental conclusions are consistent with ours, that both organic matter and clay minerals have important effects on hydrogen adsorption capacity.
Organic matter (kerogen) plays a crucial role in the hydrogen adsorption capacity of shale, similar to its impact on methane adsorption. Previous studies on methane adsorption in shale have suggested that organic matter controls the physical and chemical properties of mud shale [47]. High organic matter content in shale generally corresponds to a higher hydrocarbon generation potential and great adsorption capacity characterised by a high pore volume [47,48]. As the organic matter content increases, hydrocarbon generation strength also increases. Simultaneously, the number and types of pores developed in the organic matter vary with the organic matter content, which also affects the adsorption capacity. Many studies have indicated a positive correlation between clay mineral content and pore volume [49]. For example, using the Chang 7 Shale Member as an example, it was proposed that the clay mineral content controlled mesopore (10–50 nm) development. Similar indirect indications were made for the TPV of <5 nm pores in the samples based on fractal dimensions [25]. Research on marine Longmaxi formation shale suggests that clay minerals primarily affect the development of pores in the range of 2–5 and 20–100 nm. Studies on different types of pure clay minerals have found that clay minerals primarily control the development of 2–50 nm pores [50]. Moreover, the transformation of clay minerals can affect pore structures. For instance, the transformation of montmorillonite to illite results in a reduction in pore volume and SSA. This is because montmorillonite has a larger internal SSA and pore volume than illite. A study suggested a strong correlation between the mesopore volume and total clay content [25]. As the clay mineral content increases, the morphological transition of mesopores from slit- to bottle-shaped occurs. Clay minerals not only control mesopore volume but also influence mesopore morphology, and the total clay content is positively correlated with SSA. In our previous study on the adsorption of hydrogen by clay minerals, montmorillonite exhibited higher adsorption than chlorite, and illite and kaolinite had adsorption capacities lower than the adsorption limit [15]. The adsorption of hydrogen in clay minerals is positively correlated with the SSA and micropore and mesopore volume [15]. Therefore, the higher the clay mineral content, the larger the SSA, and the larger the total pore volume, the stronger the hydrogen adsorption capacity of the shale (Table 5).
Shale is a complex material that contains abundant organic matter in the form of kerogen. Oxygen-containing groups on shale surfaces, such as alcohols and carbonyls, bind to methane more easily than hydrogen, resulting in a lower adsorption capacity of hydrogen than methane in shale [47]. In addition, hydrogen is a nonpolar gas and, therefore, exhibits weak interactions with shale surfaces, leading to weak physical adsorption dominated by weak van der Waals forces.

6. Conclusions

This study investigated the mineral composition, organic carbon content, microscopic morphology, and pore characteristics of Triassic Chang 7 Member shale from the Ordos Basin to gain insights into its hydrogen gas adsorption capacity. The following are the main conclusions of this study:
  • The primary components of Chang 7 Shale Member samples are organic matter (kerogen) and clay minerals (exceeding 30%) primarily composed of I/S and illite. Microscopic observations of the sample bedding revealed well-developed layers.
  • The Chang 7 Shale Member exhibits diverse pore types, including intergranular, intragranular, and intercrystalline types. Nitrogen adsorption isotherm curves are V-shaped and exhibit H3-type hysteresis loops, indicating the prevalence of slit-shaped pores, cracks, and wedge-shaped structures.
  • The adsorption of hydrogen by the Chang 7 Shale Member decreases with increasing temperature and increases with increasing pressure. Organic matter (kerogen) and clay minerals exert considerable influence on hydrogen adsorption.
  • The adsorption behaviour conforms to the Freundlich and Langmuir equation models. And the Freundlich equation is a better fit, suggesting multilayer adsorption.
This study contributes to further research on the natural occurrence of hydrogen in shale.

Author Contributions

L.W.: Conceptualisation, Data curation, Methodology, Writing—original draft. Z.J.: Supervision, Resources, Funding acquisition, Project administration. G.W.: Formal analysis. X.H.: Data curation. Y.S.: Review. Q.Z.: Writing—Review and Editing. All authors have read and agreed to the published version of the manuscript.

Funding

This research is funded by the National Key Research and Development Program of China (No.: 2019YFA0708504), the National Science Foundation of China (42090025) and the American Association of Petroleum Geologists Foundation for the year 2023.

Institutional Review Board Statement

Not applicable.

Informed Consent Statement

Not applicable.

Data Availability Statement

Data will be made available on request.

Acknowledgments

We are grateful to the BSD instrument (www.beishide.com) for the test of nitrogen adsorption and Shiyanjia Lab (www.shiyanjia.com) for the SEM.

Conflicts of Interest

Authors Zhijun Jin and Guanping Wang were employed by Sinopec Petroleum Exploration and Production Research Institute. The remaining authors declare that the research was conducted in the absence of any commercial or financial relationships that could be construed as a potential conflict of interest.

References

  1. Zou, C.; Zhao, Q.; Zhang, G.; Xiong, B. Energy revolution: From a fossil energy era to a new energy era. Nat. Gas Ind. B 2016, 3, 1–11. [Google Scholar] [CrossRef]
  2. Sazali, N. Emerging technologies by hydrogen: A review. Int. J. Hydrogen Energy 2020, 45, 18753–18771. [Google Scholar] [CrossRef]
  3. Zhou, L.; Zhou, Y.; Sun, Y. Enhanced storage of hydrogen at the temperature of liquid nitrogen. Int. J. Hydrogen Energy 2004, 29, 319–322. [Google Scholar] [CrossRef]
  4. Urbaniec, K.; Bakker, R.R. Biomass residues as raw material for dark hydrogen fermentation—A review. Int. J. Hydrogen Energy 2015, 40, 3648–3658. [Google Scholar] [CrossRef]
  5. Nowotny, J.; Veziroglu, T.N. Impact of hydrogen on the environment. Int. J. Hydrogen Energy 2011, 36, 13218–13224. [Google Scholar] [CrossRef]
  6. Fang, Y.; Wang, C.; Tian, W.; Zhang, D.; Su, G.; Qiu, S. Study on high-temperature hydrogen dissociation for nuclear thermal propulsion reactor. Nucl. Eng. Des. 2022, 392, 111753. [Google Scholar] [CrossRef]
  7. Yang, N.; Deng, J.; Wang, C.; Bai, Z.; Qu, J. High pressure hydrogen leakage diffusion: Research progress. Int. J. Hydrogen Energy 2024, 50, 1029–1046. [Google Scholar] [CrossRef]
  8. Heesterman, A.R.G. Renewable energy supply and carbon capture: Capturing all the carbon dioxide at zero cost. Clean Technol. Environ. Policy 2019, 21, 1177–1191. [Google Scholar] [CrossRef]
  9. Ahmad, T.; Zhang, D.; Huang, C.; Zhang, H.; Dai, N.; Song, Y.; Chen, H. Artificial intelligence in sustainable energy industry: Status Quo, challenges and opportunities. J. Clean. Prod. 2021, 289, 125834. [Google Scholar] [CrossRef]
  10. Lebrouhi, B.E.; Djoupo, J.J.; Lamrani, B.; Benabdelaziz, K.; Kousksou, T. Global hydrogen development-A technological and geopolitical overview. Int. J. Hydrogen Energy 2022, 47, 7016–7048. [Google Scholar] [CrossRef]
  11. Pang, X.; Zhao, W.; Su, A.; Zhang, S.; Li, M.; Dang, Y.; Xu, F.; Zhou, R.; Zhang, D.; Xu, Z.; et al. Geochemistry and origin of the giant Quaternary shallow gas accumulations in the eastern Qaidam Basin, NW China. Org. Geochem. 2005, 36, 1636–1649. [Google Scholar] [CrossRef]
  12. Han, S.B.; Xiang, C.H.; Du, X.; Xie, L.F.; Huang, J.; Wang, C.S. Geochemistry and origins of hydrogen-containing natural gases in deep Songliao basin, China: Insights from continental scientific drilling. Pet. Sci. 2023, in press. [Google Scholar] [CrossRef]
  13. Huang, S.; Fang, X.; Liu, D.; Fang, C.; Huang, T. Natural gas genesis and sources in the Zizhou gas field, Ordos Basin, China. Int. J. Coal Geol. 2015, 152, 132–143. [Google Scholar] [CrossRef]
  14. Zhijun, J.; Lu, W. Does Hydrogen Reservoir Exist in Nature. Earth Sci. 2022, 47, 3858–3859. [Google Scholar]
  15. Wang, L.; Cheng, J.; Jin, Z.; Sun, Q.; Zou, R.; Meng, Q.; Liu, K.; Su, Y.; Zhang, Q. High-pressure hydrogen adsorption in clay minerals: Insights on natural hydrogen exploration. Fuel 2023, 344, 127919. [Google Scholar] [CrossRef]
  16. Weaver, C.E. A Discussion on the Origin of Clay Minerals in Sedimentary Rocks. Clays Clay Miner. 1956, 5, 159–173. [Google Scholar] [CrossRef]
  17. Rafiei, M.; Lӧhr, S.; Baldermann, A.; Webster, R.; Kong, C. Quantitative petrographic differentiation of detrital vs diagenetic clay minerals in marine sedimentary sequences: Implications for the rise of biotic soils. Precambrian Res. 2020, 350, 105948. [Google Scholar] [CrossRef]
  18. Howell, A.L.; Bentley Sr, S.J.; Xu, K.; Ferrell, R.E., Jr.; Muhammad, Z.; Septama, E. Fine sediment mineralogy as a tracer of latest Quaternary sediment delivery to a dynamic continental margin: Pandora Trough, Gulf of Papua, Papua New Guinea. Mar. Geol. 2014, 357, 108–122. [Google Scholar] [CrossRef]
  19. Yang, Y.; Li, W.; Ma, L. Tectonic and stratigraphic controls of hydrocarbon systems in the Ordos basin: A multicycle cratonic basin in central China. AAPG Bull. 2005, 89, 255–269. [Google Scholar] [CrossRef]
  20. Wang, L.; Jin, Z.; Liu, Q.; Liu, K.; Meng, Q.; Huang, X.; Su, Y.; Zhang, Q. The occurrence pattern of natural hydrogen in the Songliao Basin, P.R. China: Insights on natural hydrogen exploration. Int. J. Hydrogen Energy 2024, 50, 261–275. [Google Scholar] [CrossRef]
  21. Tang, X.; Zhang, J.; Wang, X.; Yu, B.; Ding, W.; Xiong, J.; Yang, Y.; Wang, L.; Yang, C. Shale characteristics in the southeastern Ordos Basin, China: Implications for hydrocarbon accumulation conditions and the potential of continental shales. Int. J. Coal Geol. 2014, 128–129, 32–46. [Google Scholar] [CrossRef]
  22. Wang, G.; Zhang, Q.; Zhu, R.; Tang, X.; Liu, K.; Jin, Z. Geological controls on the pore system of lacustrine unconventional shale reservoirs: The Triassic Chang 7 member in the Ordos Basin, China. Geoenergy Sci. Eng. 2023, 221, 111139. [Google Scholar] [CrossRef]
  23. Dai, J.; Zou, C.; Dong, D.; Ni, Y.; Wu, W.; Gong, D.; Wang, Y.; Huang, S.; Huang, J.; Fang, C.; et al. Geochemical characteristics of marine and terrestrial shale gas in China. Mar. Pet. Geol. 2016, 76, 444–463. [Google Scholar] [CrossRef]
  24. Cui, J.W.; Zhu, R.K.; Luo, Z.; Li, S. Sedimentary and geochemical characteristics of the Triassic Chang 7 member shale in the southeastern Ordos Basin, Central China. Pet. Sci. 2019, 16, 285–297. [Google Scholar] [CrossRef]
  25. Wang, G.; Jin, Z.; Zhang, Q.; Zhu, R.; Tang, X.; Liu, K.; Dong, L. Effects of clay minerals and organic matter on pore evolution of the early mature lacustrine shale in the Ordos Basin, China. J. Asian Earth Sci. 2023, 246, 105516. [Google Scholar] [CrossRef]
  26. Hou, L.-H.; Wu, S.-T.; Jing, Z.-H.; Jiang, X.-H.; Yu, Z.-C.; Hua, G.; Su, L.; Yu, C.; Liao, F.-R.; Tian, H. Effects of types and content of clay minerals on reservoir effectiveness for lacustrine organic matter rich shale. Fuel 2022, 327, 125043. [Google Scholar] [CrossRef]
  27. Hua, Y.; Xinshe, L.I.U. Progress in Paleozoic coal-derived gas exploration in the Ordos Basin, West China. Pet. Explor. Dev. 2014, 41, 144–152. [Google Scholar]
  28. Li, J.; Zhuang, X.; Querol, X.; Font, O.; Moreno, N. A review on the applications of coal combustion products in China. Int. Geol. Rev. 2018, 60, 671–716. [Google Scholar] [CrossRef]
  29. Liu, R.; Ren, Z.; Ye, H.; Ren, W.; Wang, K.; Huai, Y.; Qi, K. Potential evaluation of geothermal resources: Exemplifying some municipalities and key strata in Ordos Basin as a study case. Geol. Bull. China 2021, 40, 565–576. [Google Scholar]
  30. Jiu, B.; Huang, W.; Mu, N. Mineralogy and elemental geochemistry of Permo-Carboniferous Li-enriched coal in the southern Ordos Basin, China: Implications for modes of occurrence, controlling factors and sources of Li in coal. Ore Geol. Rev. 2022, 141, 104686. [Google Scholar] [CrossRef]
  31. Tang, X.; Zhang, J.; Shan, Y.; Xiong, J. Upper Paleozoic coal measures and unconventional natural gas systems of the Ordos Basin, China. Geosci. Front. 2012, 3, 863–873. [Google Scholar] [CrossRef]
  32. Ritts, B.D.; Hanson, A.D.; Darby, B.J.; Nanson, L.; Berry, A. Sedimentary record of Triassic intraplate extension in North China: Evidence from the nonmarine NW Ordos Basin, Helan Shan and Zhuozi Shan. Tectonophysics 2004, 386, 177–202. [Google Scholar] [CrossRef]
  33. Yang, J.; Liu, X.; Bhalla, K.; Kim, C.N.; Ibrado, A.M.; Cai, J.; Peng, T.-I.; Jones, D.P.; Wang, X. Prevention of Apoptosis by Bcl-2: Release of Cytochrome c from Mitochondria Blocked. Science 1997, 275, 1129–1132. [Google Scholar] [CrossRef]
  34. Meng, Q.; Wang, X.; Wang, X.; Shi, B.; Luo, X.; Zhang, L.; Lei, Y.; Jiang, C.; Liu, P. Gas geochemical evidences for biodegradation of shale gases in the Upper Triassic Yanchang Formation, Ordos Basin, China. Int. J. Coal Geol. 2017, 179, 139–152. [Google Scholar] [CrossRef]
  35. Wang, C.; Wang, Q.; Chen, G.; He, L.; Xu, Y.; Chen, L.; Chen, D. Petrographic and geochemical characteristics of the lacustrine black shales from the Upper Triassic Yanchang Formation of the Ordos Basin, China: Implications for the organic matter accumulation. Mar. Pet. Geol. 2017, 86, 52–65. [Google Scholar] [CrossRef]
  36. Li, Y.; Song, Y.; Jiang, Z.; Yin, L.; Chen, M.; Liu, D. Major factors controlling lamina induced fractures in the Upper Triassic Yanchang formation tight oil reservoir, Ordos basin, China. J. Asian Earth Sci. 2018, 166, 107–119. [Google Scholar] [CrossRef]
  37. Yang, R.; Fan, A.; Han, Z.; van Loon, A. Lithofacies and origin of the Late Triassic muddy gravity-flow deposits in the Ordos Basin, central China. Mar. Pet. Geol. 2017, 85, 194–219. [Google Scholar] [CrossRef]
  38. Pan, S.; Zou, C.; Li, J.; Yang, Z.; Liu, E.; Han, Y. Unconventional shale systems: A comparative study of the “in-source sweet spot” developed in the lacustrine Chang 7 Shale and the marine Barnett Shale. Mar. Pet. Geol. 2018, 100, 540–550. [Google Scholar] [CrossRef]
  39. GB/T19145-2003; Determination of Total Organic Carbon in Sedimentary Rock. Chinese Standard: Beijing, China, 2003.
  40. Dubinin, M.M. Recent Equilibrium and Kinetic Studies of the Adsorption of Gases and Vapours by Microporous Adsorbents. Russ. Chem. Rev. 1977, 46, 1021. [Google Scholar] [CrossRef]
  41. Al-Ameri, T. Khasib and Tannuma oil sources, East Baghdad oil field, Iraq. Mar. Pet. Geol. 2011, 28, 880–894. [Google Scholar] [CrossRef]
  42. Tang, S.; Tang, D.; Liu, S.; Li, S.; Tang, J.; Wang, M.; Zhang, A.; Pu, Y. Multiscale pore characterization of coal measure reservoirs and gas storage and transport behavior in Yanchuannan gas field of China. AAPG Bull. 2022, 106, 2387–2415. [Google Scholar] [CrossRef]
  43. Yu, H.; Xu, H.; Fan, J.; Zhu, Y.B.; Wang, F.; Wu, H. Transport of shale gas in microporous/nanoporous media: Molecular to pore-scale simulations. Energy Fuels 2020, 35, 911–943. [Google Scholar] [CrossRef]
  44. Jaroniec, M.; Kruk, M.; Olivier, J.P. Standard Nitrogen Adsorption Data for Characterization of Nanoporous Silicas. Langmuir 1999, 15, 5410–5413. [Google Scholar] [CrossRef]
  45. Ravikovitch, P.I.; Vishnyakov, A.; Russo, R.; Neimark, A.V. Unified approach to pore size characterization of microporous carbonaceous materials from N2, Ar, and CO2 adsorption isotherms. Langmuir 2000, 16, 2311–2320. [Google Scholar] [CrossRef]
  46. Wang, C.; Zhao, Y.; Wu, R.; Bi, J.; Zhang, K. Shale reservoir storage of hydrogen: Adsorption and diffusion on shale. Fuel 2024, 357, 129919. [Google Scholar] [CrossRef]
  47. Ho, T.A.; Dang, S.T.; Dasgupta, N.; Choudhary, A.; Rai, C.S.; Wang, Y. Nuclear magnetic resonance and molecular simulation study of H2 and CH4 adsorption onto shale and sandstone for hydrogen geological storage. Int. J. Hydrogen Energy 2024, 51, 158–166. [Google Scholar] [CrossRef]
  48. Kuila, U.; McCarty, D.K.; Derkowski, A.; Fischer, T.B.; Topór, T.; Prasad, M. Nano-scale texture and porosity of organic matter and clay minerals in organic-rich mudrocks. Fuel 2014, 135, 359–373. [Google Scholar] [CrossRef]
  49. Saidian, M.; Godinez, L.J.; Prasad, M. Effect of clay and organic matter on nitrogen adsorption specific surface area and cation exchange capacity in shales (mudrocks). J. Nat. Gas Sci. Eng. 2016, 33, 1095–1106. [Google Scholar] [CrossRef]
  50. Wang, X.; Cheng, H.; Chai, P.; Bian, J.; Wang, X.; Liu, Y.; Yin, X.; Pan, S.; Pan, Z. Pore Characterization of Different Clay Minerals and Its Impact on Methane Adsorption Capacity. Energy Fuels 2020, 34, 12204–12214. [Google Scholar] [CrossRef]
Figure 1. (a) Location of the Ordos Basin in China, (b) geological overview of the Ordos Basin, and (c) sampling locations.
Sustainability 16 01960 g001
Figure 2. Schematic of high-pressure hydrogen adsorption apparatus.
Sustainability 16 01960 g002
Figure 3. Photomicrographs of Chang 7 Shale Member thin sections. (a) Quartz (QZ) and plagioclase (Pl) layers overlying thick layers of organic matter (OM) containing lens-shaped layers, (b) thinly bedded layers with OM content, (c) approximately horizontal layers of OM and clay, QZ and Pl, and (d) wavy bedded OM with some lens-shaped layers.
Sustainability 16 01960 g003
Figure 4. Scanning electron microscopy images of the Chang 7 Shale Member. (a) Clay minerals (BSE), (b) organic matter (BSE), (c) framboidal pyrite (BSE), (d) clay minerals showing wavy edges (SE2), (e) pores in organic matter (SE), and (f) lamellar clay minerals (SE2). (A) EDS analyses of the point marked red + sign in (a). (B) EDS analyses of the point marked red + sign in (b). (C) EDS analyses of the point marked red + sign in (c).
Sustainability 16 01960 g004
Figure 5. Nitrogen adsorption-desorption curve and pore size distribution curve of Chang 7 shale Pore characteristics of the Chang 7 Shale Member samples. (a) Nitrogen adsorption-desorption curve of sample 412, (b) pore size distribution curve of sample 412, (c) nitrogen adsorption-desorption curve of sample 413, (d) pore size distribution curve of sample 413, (e) nitrogen adsorption-desorption curve of sample 427, and (f) pore size distribution curve of sample 427.
Sustainability 16 01960 g005
Figure 6. High-pressure hydrogen adsorption and Langmuir fitting of (a) sample 412, (b) sample 427, (c) sample 413, and (d) mudstone samples from SK2 at 25 °C [15].
Sustainability 16 01960 g006
Figure 7. High-pressure hydrogen adsorption and Freundlich fitting of (a) sample 412, (b) sample 427, (c) sample 413.
Sustainability 16 01960 g007
Table 1. Whole-rock mineral compositions of the Chang 7 Shale Member.
Sample No.QuartzMicroclineDolomitePlagioclasePyriteIlliteKaoliniteChloriteMontmorillonite
41212273134175712
41312192175176814
42781515126155915
Table 2. Relative clay mineral contents of the Chang 7 Shale Member.
SampleDepth (m)LithologyRelative Clay Mineral Content (%)Mixed-Layer Ratio, S (%)
I/SIKCI/S
412223.4Mudstone86111215
413223.96Mudstone8881315
427227.91Mudstone909n.d.115
S: montmorillonite, I/S: Illite/smectite mixed layer, I: Illite, K: kaolinite, C: chlorite, C/S: chlorite/smectite-mixed layer.
Table 3. The mineralogical compositions (%) of the SK 2 samples [20].
SamplesQuartzPlagioclaseMicroclineChloriteMicaOthers
S12627167231
S28741026
S31948135141
S4225375121
S52136165211
S6224795161
S7173433511
S8213620815
S9124722613
S10155511559
S1117156656
Table 4. Pyrolysis data.
Sample No.Tmax (°C)S1 (mg/g)S2 (mg/g)TOC (wt %)TS (wt %)
4124352.5842.49.6843.86
413433234.697.9925.19
4274364.1172.9914.322.54
Tmax: maximum pyrolysis temperature, TOC: total organic carbon, and TS: total sulfur; S1: free (indigenous) hydrocarbons and S2: pyrolysable hydrocarbons.
Table 5. Analysis results of LT-N2 GA.
Sample No.SSA (m2/g)APD (nm)TPV (cm3/g)
4125.81132.020.047
4136.56830.690.050
4276.09732.500.050
Note: SSA: specific surface area; TPV: the total volume of pores with diameters smaller than 200 nm; APD: average pore diameter.
Table 6. Langmuir and Freundlich parameters for hydrogen adsorption in samples.
Sample No.TemperatureLangmuirFreundlich
VLPLR2nkR2
412252.1323.290.99181.29820.01760.99785
452.1125.760.99681.31040.01630.9975
651.3516.760.99751.40240.0180.9963
413253.8337.330.97031.15880.01350.99932
453.4538.260.99971.16740.01340.9989
653.0135.340.99341.33650.01940.99912
427253.8538.900.97991.16740.01410.99943
453.0430.060.98661.16050.01270.99954
652.6030.100.98631.18310.01270.99814
Adsorption strength: n; adsorption constant: k.
Disclaimer/Publisher’s Note: The statements, opinions and data contained in all publications are solely those of the individual author(s) and contributor(s) and not of MDPI and/or the editor(s). MDPI and/or the editor(s) disclaim responsibility for any injury to people or property resulting from any ideas, methods, instructions or products referred to in the content.

