Article

Evaluation of the Evolution of the Ecological Security of Oases in Arid Regions and Its Driving Forces: A Case Study of Ejina Oasis in China

1
Shaanxi Key Laboratory of Earth Surface System and Environmental Carrying Capacity, College of Urban and Environmental Sciences, Northwest University, Xi’an 710127, China
2
Department of Environmental Engineering, College of Urban and Environmental Science, Northwest University, Xi’an 710127, China
*
Author to whom correspondence should be addressed.
Sustainability 2024, 16(5), 1942; https://doi.org/10.3390/su16051942
Submission received: 10 January 2024 / Revised: 20 February 2024 / Accepted: 23 February 2024 / Published: 27 February 2024

Abstract

:
Ecological security is an important guarantee of human security and survival, closely related to sustainable development. However, the ecological security evaluation and driving force analysis of oases in arid areas is still insufficient. Ejina Oasis’s ecological security has experienced significant shifts following the centralized management of the Heihe River’s water allocation. Understanding the shifts in ecological security in the Ejina region is paramount for the oasis’s long-term sustainability. This paper employed the Pressure–State–Response (P–S–R) model to select socioeconomic and ecological indicators, establish a comprehensive ecological security evaluation index system, and then analyze the evolving ecological security in the region. Additionally, this paper explored the relationship between changes in the water area, oasis area, and ecological security by using the gray correlation degree to quantify the influence of Land Use Changes (LUCCs) on the overall ecological security. From 2000 to 2012, the ecological security index of Ejina Oasis remained relatively stable at around 0.4. However, a noticeable upward trend in the ecological security index emerged from 2012 to 2020, indicating a shift toward improved ecological security in the region. Critical determinants of this change included the habitat degradation degree, total population, habitat quality, carbon stock, fractional vegetation cover (FVC), the proportion of tertiary industry, and the volume of water discharged from Wolf Heart Mountain. The degree of habitat degradation, fractional vegetation cover (FVC), and the proportion of tertiary industry had the greatest impact on the change in ecological security. The pressure index was dominant in influencing ecological security before 2012 but gradually transitioned to the state index. This study offers a valuable framework for assessing the intricate relationship between LUCCs and ecological security in water-scarce, arid-region oases.

1. Introduction

Human society and the natural environment together constitute a complete social–ecological system. This system is the basis for human survival and social progress. However, the imminent danger posed by humanity’s irrational exploitation and utilization of environmental resources constitutes an enormous obstacle to the progress of human society. Rapid population, economic, and social growth, coupled with the wanton consumption of environmental resources, has led to ecological degradation that seriously threatens the ecological security of social and ecological systems. Therefore, a complete understanding of ecological security’s dynamic and changing status and its corresponding influencing factors is significant in safeguarding ecosystem functions and supporting sustainable socio-economic development [1].
The concept of ecological security was first formalized by the World Commission on Environment and Development (WCED) and the International Institute for Applied Systems Analysis (IIASA) [1,2,3]. Ecological security is a complex issue covering multiple factors, and its concept is divided into the broad and narrow senses [4]. In the narrow sense, ecological security refers to the security of natural and semi-natural ecosystems, which can reflect the integrity and health of ecosystems [5]. Ecological security, in the broad sense, includes three fundamental dimensions: natural ecological security, social–ecological security, and economic and ecological security. Ecological security has been recognized as an essential component of national security, and ecological security is a measure of the overall well-being and soundness of ecosystems in a given region. Ecological security assessments, whether qualitative or quantitative, involve the evaluation of ecological well-being using specific criteria within a defined temporal and spatial framework. The results of such assessments can be used as decision-making tools for local managers [6,7]. The concern surrounding ecological security has attracted considerable interest from diverse sectors. The profound challenge of ecological degradation poses a significant threat to human societies’ sustainable development, economies, and national ecological safety [1,8,9].
Currently, ecological security assessment predominantly focuses on two key dimensions: the quantitative and qualitative analysis of pollutant distribution characteristics and concentration changes, along with the evaluation of regional ecosystem alterations. For instance, Zhao et al. [10] employed the geo-accumulation index and exposure risk model to appraise 10 heavy metals in dust across 58 Chinese cities. Their study delved into the distribution patterns, pollution impacts, and health risks associated with heavy metals in diverse urban settings. Wang et al. [11] scrutinized the distribution, pollution impacts, and health risks of persistent pollutants in China’s Taihu Lake Basin using ecological risk assessment methods. Sultan et al. [12] investigated the sources and distribution characteristics of organochlorine pesticides (OCPs) in Pakistani freshwater, incorporating Human Health Risk Assessment (HHRA) and Ecological Risk Assessment (ERA). These studies focused on characterizing regional ecological security and environmental development based on the distribution of chemical elements. However, the integrated coupling between socio-economic development and ecological changes has not been fully explored. Meanwhile, some studies evaluated the study area itself, assessing regional ecological security through the establishment of an evaluation index system. For example, Zhao et al. [13] explored ecological security changes in lakes on the Inner Mongolia Plateau, utilizing the Driver–Pressure–State–Impact–Response model. Akadiri et al. [14] utilized ecological footprints to analyze changes in the USA’s ecological environment, providing a foundation for the sustainable development of basins such as oases. Additionally, Men and Liu [15] evaluated water resource vulnerability in the Heihe River Basin using the PSR model, identifying and analyzing changing factors. It is noteworthy that the selection of ecological security evaluation indicators and models must align with the specific characteristics of the study area. To date, limitations persist in terms of the selection of evaluation indicators, the delineation of evaluation levels, the identification of driving factors, and the validation of the scientific rigor of evaluation results [16].
In this study, we formulated an ecological security evaluation index framework grounded on the PSR model, encompassing indicators drawn from three fundamental dimensions: natural, social, and economic. To enhance the precision and objectivity of our assessment indicators, we employed the InVEST model to quantify alterations in habitat quality, habitat degradation degree, and carbon stock within the study area. The results from the InVEST model were utilized as an indicator to be included in the ecological security assessment framework, thus introducing a new perspective on the selection of evaluation indicators. For oases in arid regions, the adequacy of water resources is a decisive factor influencing the improvement or deterioration of ecosystem conditions. In this study, we particularly emphasized the impact of water resource regulation indicators on the ecological security of oases. In view of the fact that the main water source of the Ejina Oasis comes from the upper reaches of the Heihe River, we included the regulated water volume of the Langxin Mountain Hydrological Station as an evaluation indicator in the evaluation framework. The Ejina Oasis serves as a critical natural barrier in Northwest China and North China, playing a pivotal role in China’s ecological defense. Preserving its ecological integrity is imperative for upholding regional and national ecological security [17]. Due to the over-exploitation of water resources in the middle reaches of the Heihe River, the population growth, and the rapid and sub-optimal development of agriculture and animal husbandry, the water volume in the lower reaches constantly decreases. This led to the desiccation of the West Juyan Sea in 1961 and the East Juyan Sea in 1992, exacerbating the ecological degradation of the Ejina Oasis year by year [18]. The initiation of the Heihe River Diversion Project represents a pivotal moment, effectively mitigating the swift ecological decline of the Ejina Oasis and progressively enhancing the ecological security scenario [19,20]. In order to maintain the ecological security and sustainability of the Ejina Oasis, it is necessary to evaluate the ecological security and its driving forces in terms of the oasis. In our study, we quantified the evolution of the ecological security status of the Ejina Oasis from 2000 to 2020 through the establishment of an ecological security evaluation index framework. Employing the Grey Relational Analysis (GRA) model, we delved into the interactions between human social activities, natural ecological factors, and the drivers influencing ecological security evolution. Our findings offer a robust ecological security assessment indicator framework tailored for arid-zone oases. This framework can be applied across different watersheds to assess ecological security and analyze sustainability drivers, thereby facilitating informed decision-making for ecological management in arid-zone oases.

2. Materials and Methods
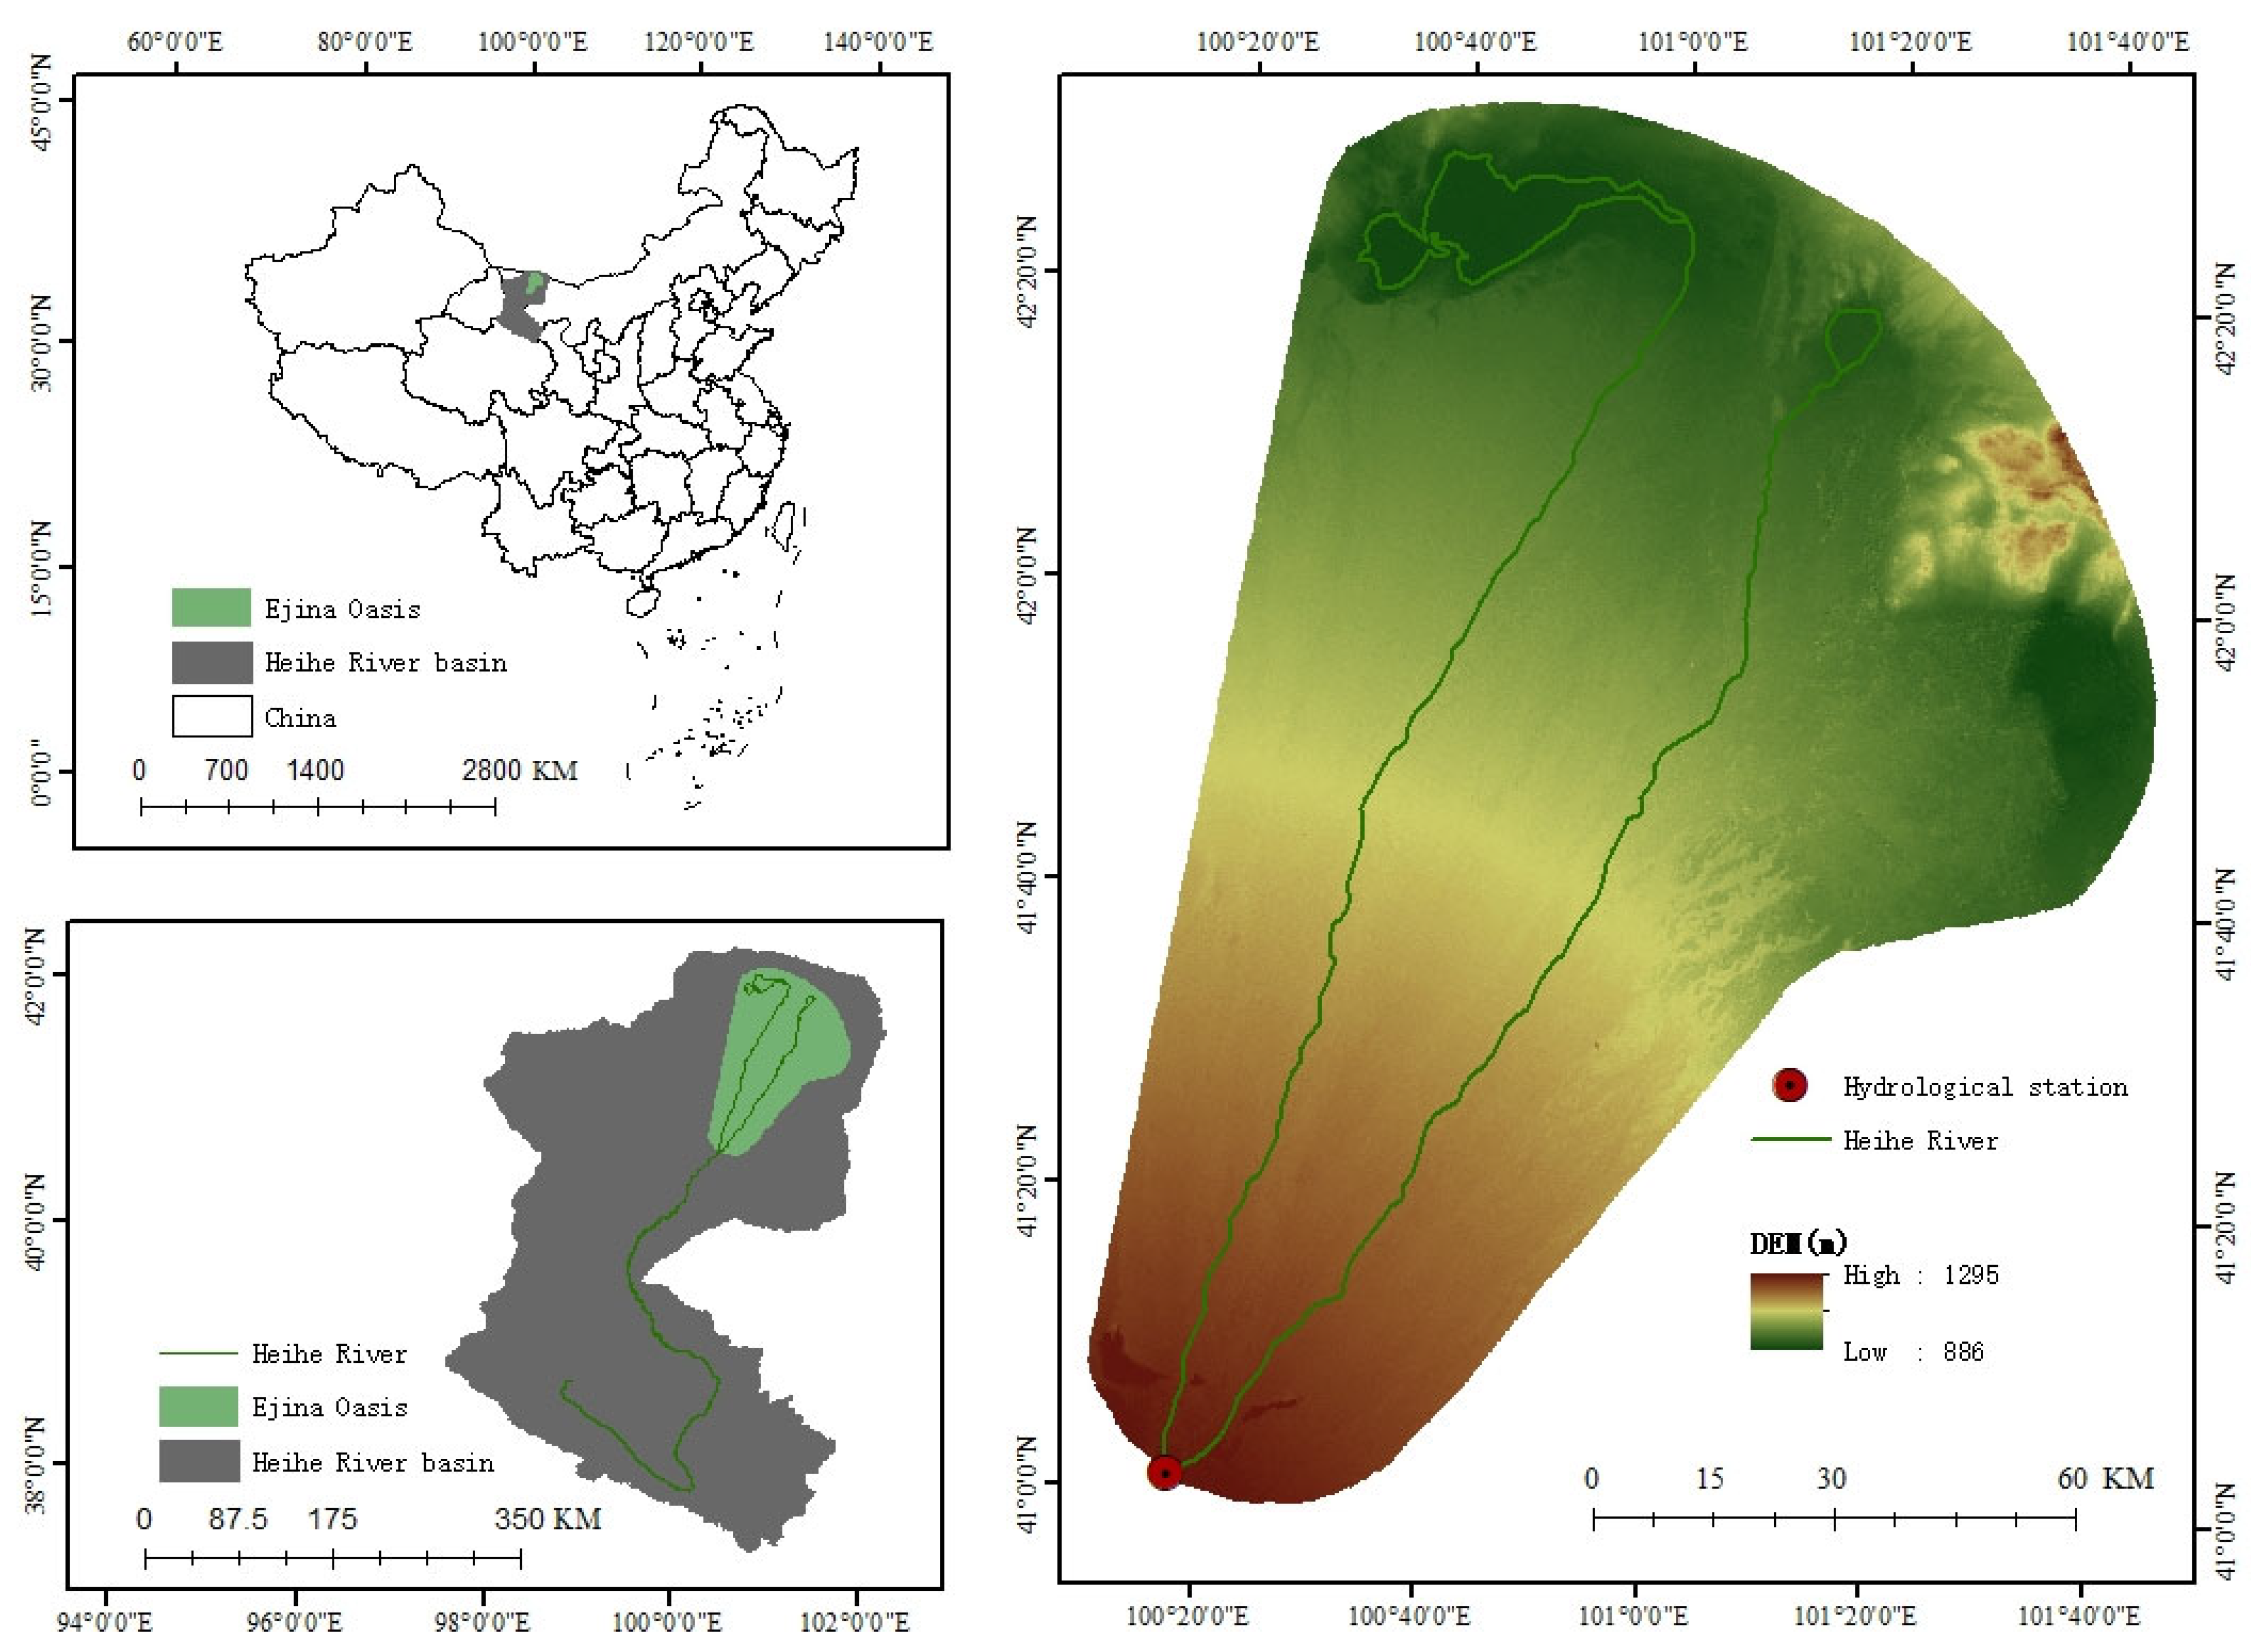
2.1. Study Area

The Ejina Oasis is located at China’s northern border within the lower Heihe River Basin, marking the westernmost point of the Inner Mongolia Autonomous Region’s Alxa League. It lies between 40°57′–42°33′ N latitude and 100°9′–101°46′ E longitude, characterized by a temperate arid monsoon climate with low rainfall, high evapotranspiration, abundant sunlight, and significant temperature fluctuations. With an average annual temperature of 8.3 °C and annual precipitation of just 37 mm, the region primarily relies on the middle reaches of the Heihe River for its water supply. The lower Heihe River region showcases a distinctive oasis landscape featuring Populus euphratica, jujube, tamarisk, and hyacinth vegetation. This oasis plays a pivotal role in preserving the ecological security of the Alxa region and the Hexi Corridor [21]. The ecological security of this region is closely intertwined with the sustainable development of the ecological environment in the Heihe River Basin and the broader context of Northwestern China. Mainly, since the inception of the Heihe River Diversion Program, scholars have increasingly focused their research on vegetation restoration and ecological sustainability in the downstream Heihe River area, acknowledging it as a significant research priority. The location of the Ejina Oasis is depicted in Figure 1.

2.2. Data Resources

The land use data employed in this study were sourced from China’s annual land cover dataset with a spatial resolution of 30 m, collaboratively curated by Professors Yang Jie and Huang Xin at Wuhan University. The classification included seven land use categories: cropland, grassland, forest, wetland, water, impervious, and barren [22].
We utilized the InVEST model to calculate data on habitat degradation, habitat quality, and carbon stock. Digital Elevation Model (DEM) data were sourced from the Geospatial Data Cloud https://www.gscloud.cn/ (accessed on 18 January 2023). Demographic statistics, GDP, GDP per capita, and sector-specific economic data for primary, secondary, and tertiary industries were extracted from the Ejina Banner Statistical Yearbook and the Alxa Statistical Yearbook. Data pertinent to the East Juyan Sea lake surface area, water outflow from the Wolf Heart Mountain, and water inflow into the East Juyan Sea from the Ejina Banner Water Affairs Bureau and the Heihe River Basin Management Bureau were sourced.

2.3. Methods

Scholars worldwide have conducted diverse research on ecological security, examining it from various perspectives. Prominent research foci have centered on vital ecological security monitoring regions, encompassing cities, watersheds, nature reserves, and industrial and mining areas. However, limited ecological security assessments have been undertaken in ecologically delicate regions where agriculture and pastoralism intersect and desert oases, which serve as critical barometers of global changes. In terms of research methodologies, ecological security evaluations predominantly employ methods such as the comprehensive index method, hierarchical analysis method, object–element modeling method, TOPSIS method, ecological footprint method, ecological modeling method, and landscape ecology method [23,24]. The construction of an ecological safety evaluation index system predominantly involves the application of multifactor comprehensive evaluation models, including the PSR model, DPSIR model, and DPSEEA model [25].
The essence of ecological security evaluation hinges on the development of rigorous and rational assessment criteria and indicator frameworks [2]. In this study, we employ the PSR model to evaluate the ecological security status of the lower reaches of the Heihe River. This is accomplished by screening indicators, creating the indicator system, and assigning appropriate weights. Within the PSR framework, environmental problems can be expressed by three different but interrelated indicator types: pressure indicators indicate the causes of ecological problems, focusing on describing the loads on the ecosystem caused by the outside world and human beings; state indicators indicate the changes in environmental quality, natural resources, and ecosystems when the ecosystems are under pressure from the outside world; and response indicators indicate the changes in ecosystems’ conditions and the changes in human efforts to maintain the original ecosystems when the ecosystems are under pressure. The PSR model categorizes the environmental indicators from the interaction and influence between human beings and ecosystems, expresses the causal relationship between human beings and ecosystems, and provides a research method for ecological security evaluation [26].

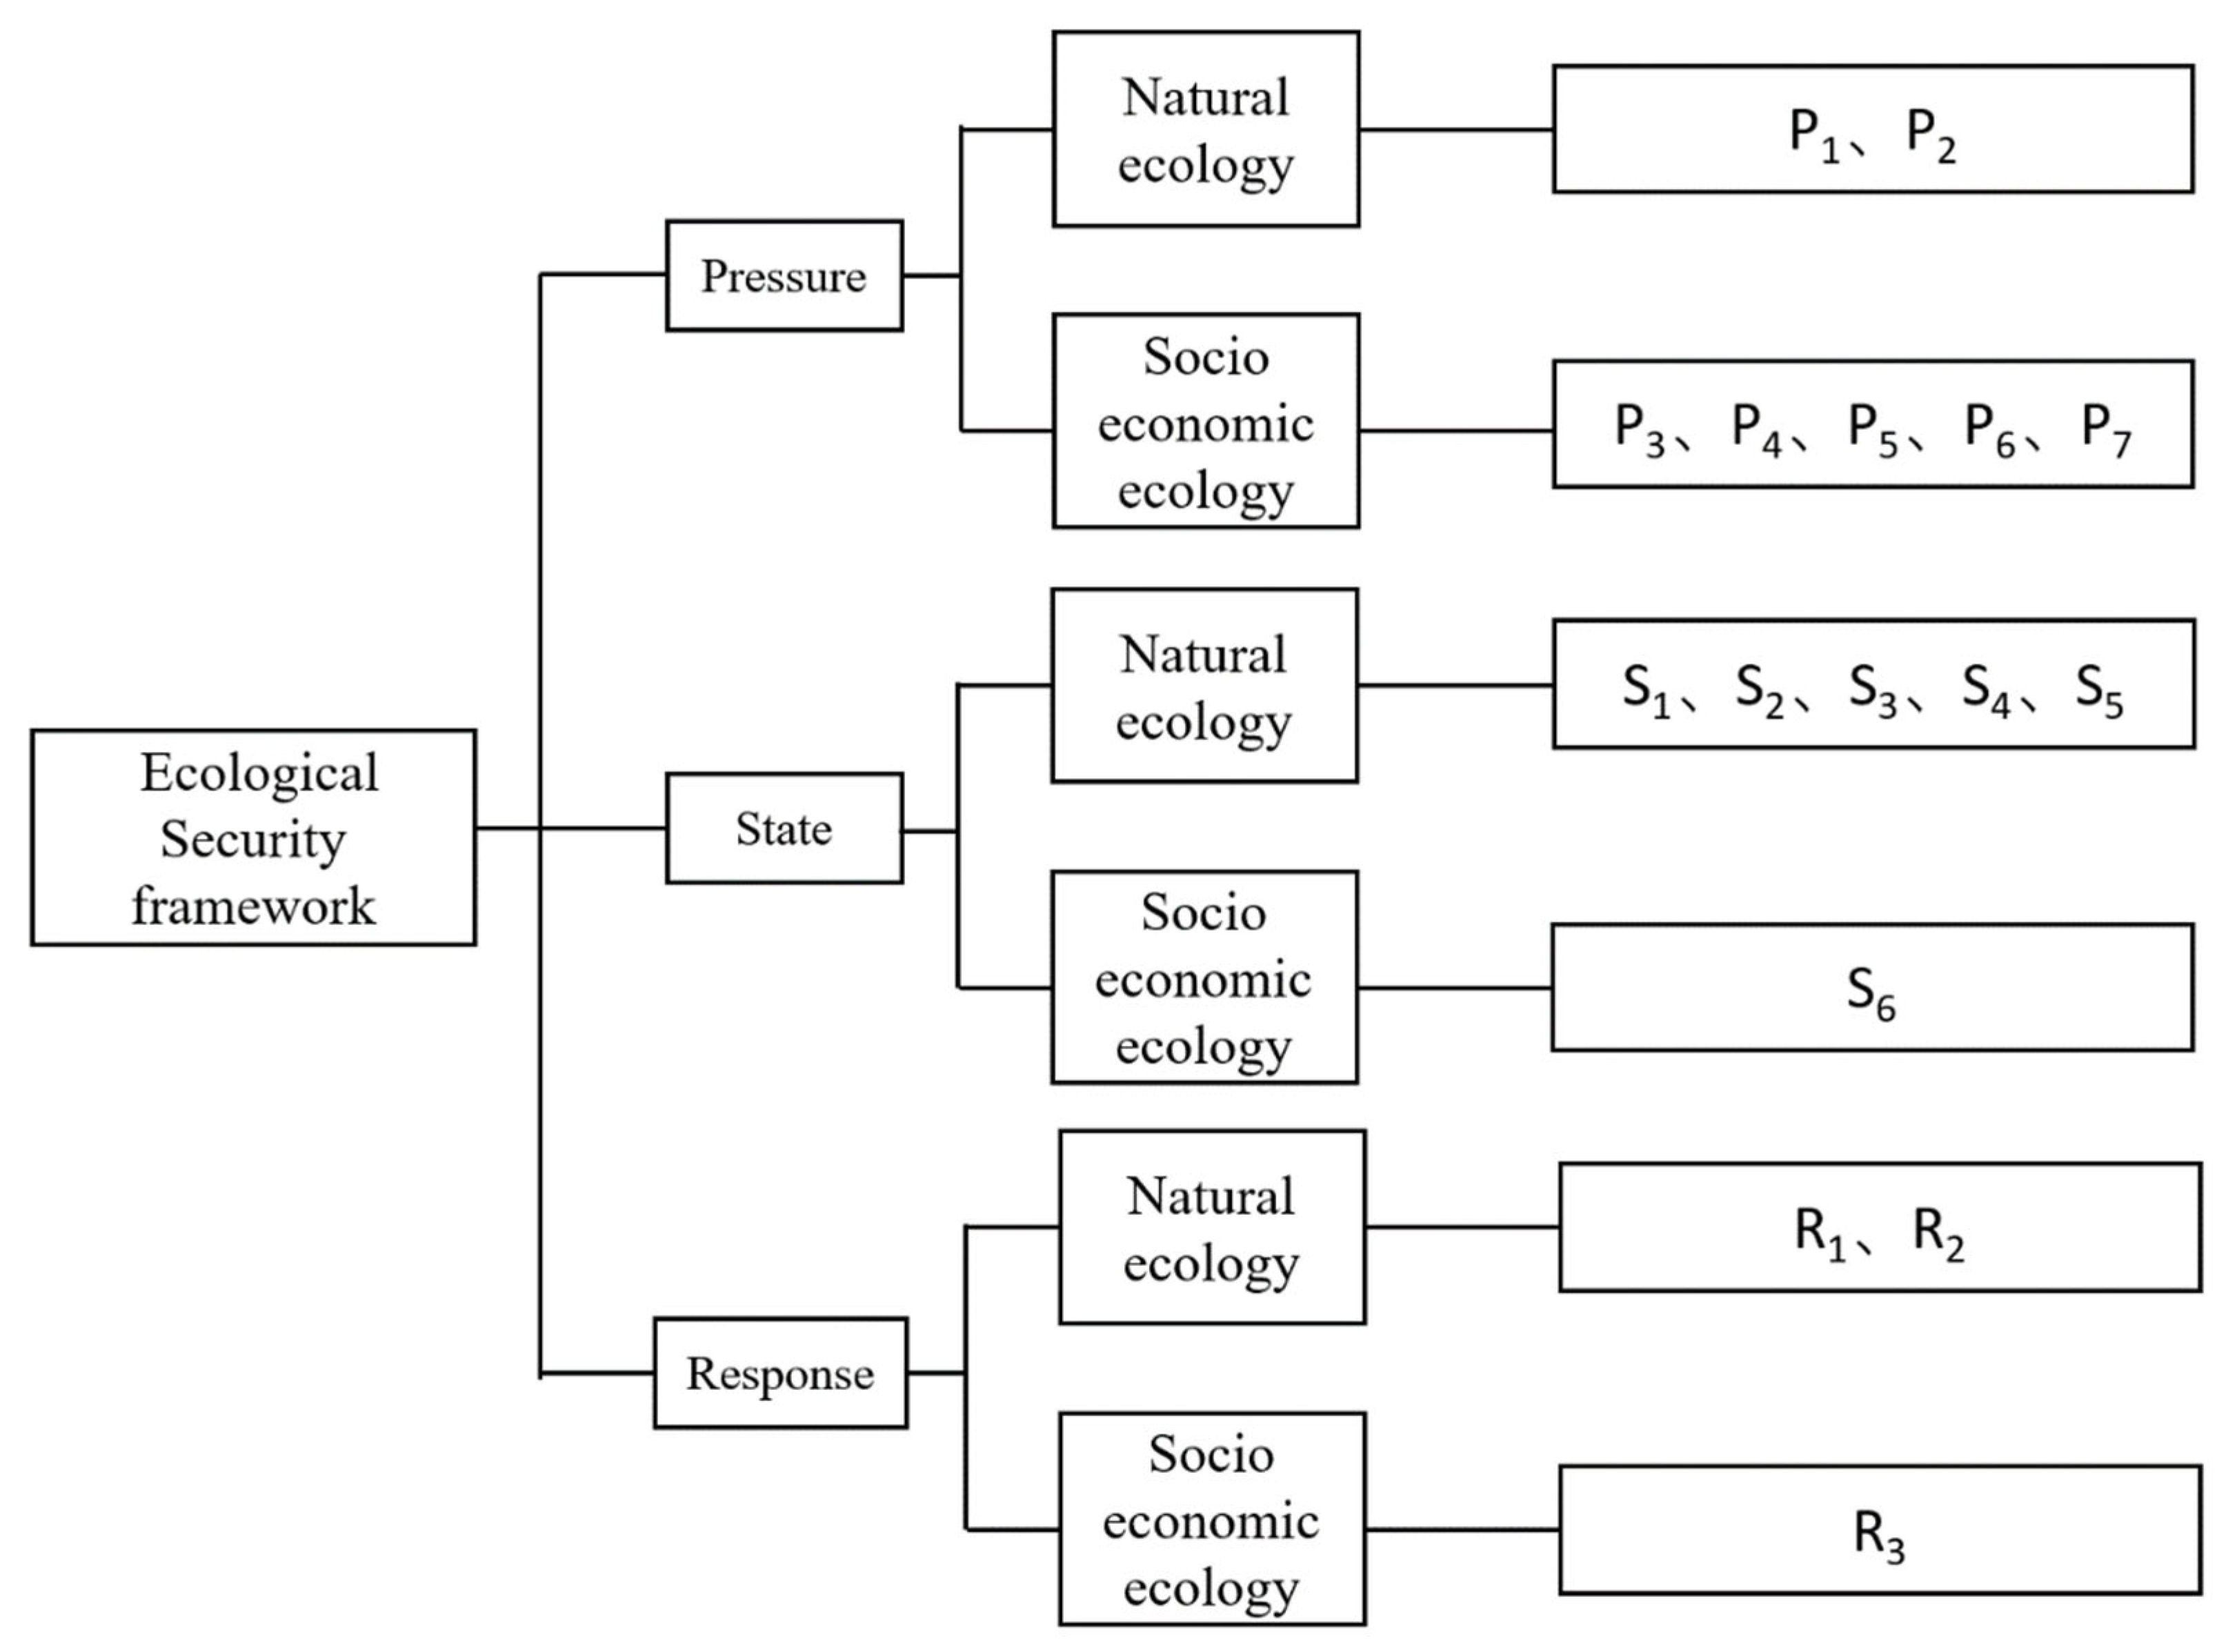
2.3.1. Ecological Security Evaluation Index

Establishing a comprehensive indicator system is the foundation for objective and precise ecological security evaluation. The selection of evaluation indicators and the structure of the indicator system should adhere to the principles of scientific rigor, representativeness, and practicality. The choice of ecological security indicators significantly influences the credibility of the final evaluation results [27,28,29]. The PSR model helps to reveal the causal relationship between the environment and human activities and can be adapted to the coupled society in which human society and natural ecology have a strong influence on each other. It has been widely used in the sustainability evaluation of social–ecological systems and ecological security evaluation, with a certain degree of accuracy and scientific validity. Since ecological security encompasses natural, social–ecological, and economic dimensions, we have chosen evaluation indicators from both the natural and socio-economic facets. Sixteen evaluation indicators were selected. The stress refers to the description of human or natural factors directly or indirectly bring burden to the environment, and we chose the indicators including the habitat degradation degree (P1), cultivated land area (P2), total population (P3), GDP (P4), amount of agricultural fertilizer (P5), the primary industry proportion (P6), and the secondary industry proportion (P7). The state is a reflection of the quality of the environment, natural resources and ecosystems, and the indicators we chose include the carbon stock (S1), habitat quality (S2), East Juyan Sea’s lake surface area (S3), aridity index (S4), Fractional vegetation cover (FVC) (S5), per capita GDP (S6). The response describes the response of the ecosystem itself to environmental changes and the related countermeasures and measures adopted by human society, and we chose the indicators including the volume of water discharged from Wolf Heart Mountain (R1), the inflow of water into East Juyan Sea (R2), and the tertiary industry proportion (R3). These selections have been informed by the prevailing ecological conditions of the Ejina Oasis and previous research on the ecological security of arid-zone oases [30,31]. The descriptions of the indicators and the reasons for their selection are shown in Table 1. The ecological security assessment index system framework employed in this study is illustrated in Figure 2.

2.3.2. Ecological Security Evaluation Model

Normalization of indicators. After the indicators are determined, the magnitude between them is not uniform, so it is not easy to evaluate them. In this study, the normalization method of polar deviation is used to normalize the raw data:
Positive indicator formula:
X i j = X i j m i n X j / m a x X j m i n X j
Negative indicator formula:
X i j = m a x X j X i j / m a x X j m i n X j
where X i represents the standardized value of the indicator, X i j is the value of the jth indicator in a year i, and max X j and min X j denote the maximum and minimum values of the jth indicator.
Two prevalent categories of methods are commonly employed to establish the indicator weights: subjective assignment and objective assignment. Subjective assignment methods encompass hierarchical analysis, expert consultation, and binomial coefficient techniques. Meanwhile, objective assignment methods include entropy weight, principal component analysis, and multi-objective optimization [32]. The Entropy Weight Method (EWM) objectively allocates evaluation weights, eliminating subjectivity compared to subjective methods. This enhances the result objectivity and effectively highlights the indicator distinctions. The EWM measures the degree of variability within the indicators, with a higher degree of variability signifying more excellent dispersion and, consequently, a more substantial influence of the indicators on the comprehensive evaluation [33,34]. In this study, we use the EWM to determine the weight of each indicator. This calculation involves computing the characteristic weight and entropy value for each indicator:
S i j = X i j / i = 1 m X i j
e j = 1 ln m / i = 1 m S i j ln S i j
w j = 1 e j / j = 1 n 1 e j
where m is the study period; n is the number of indicators; Sij is the characteristic weight of the indicators; ej is the entropy value of the indicators; and wj is the weight of the indicators.
Compute the Ecological Security Index (ESI): Following the determination of the indicator weights through the Entropy Weight Method, ecological security is assessed using a comprehensive evaluation technique. The ESI reflects the degree of ecological security within the study area, encompassing the dimensions of pressure, state, and response. A higher ESI signifies a heightened level of ecological security within the region, while a lower ESI suggests the opposite. The ESI calculation formula is as follows:
E S I i = i = 1 m X i j × w j
E S I = i = 1 3 E S I i
In the formula, ESIi represents the ecological security index for three levels: pressure, state, and response; ESI is the composite ecological security index; Xij is the standardized value of the index; and wj denotes the weight of the jth index.
Table 2 displays the weight calculations for the 16 selected indicators in this study. Furthermore, a classification standard for ecological security evaluation (refer to Table 3) has been developed for the absence of a precise ecological security categorization for arid-zone oases. At present, there is no clear classification of the ecological security index in oasis areas. According to previous studies, natural breaks or equal intervals are usually used to classify the grades. In this study, we used the commonly used method for classifying ecological safety grades in oases in arid zones (equal intervals). Ecological security was categorized into five grades: “very insecure”, “insecure”, “very secure”, “relatively secure” and “ideally secure.”

2.3.3. Grey Relation Analysis

Grey Relation Analysis (GRA) assesses the degree to which a variable is influenced by other factors within a gray system. It is instrumental in managing multiple criteria and navigating the intricate interdependencies among them [33]. Following establishing the ecological security evaluation index system for the Ejina Oasis, we performed a Grey Relation Analysis to investigate the relationship between the LUCCs and ecological security variations. The goal was to identify the driving factors behind changes in ecological security and improve the ecological security index. By quantifying the correlation coefficient between LUCCs and ecological security indicators, the Grey Relation Analysis elucidated the coupling relationship between these variables and the influence of ecological security evaluation indicator variations on overall ecological security in the Ejina Oasis [35]. The correlation coefficient was calculated as follows through the formula:
M i t = D m i n + k D m a x D i j t + G i X t + G j Y t
In the Equation, Mi(t) represents the correlation coefficient at time t, measuring the association between the LUCCs and ecological security. Dij indicates the stochastic vector characterizing the ecological security state in the Ejina Oasis, with Dmax and Dmin representing the vector’s upper and lower bounds, respectively. G i X t and G j Y t denote the normalized values of the LUCCs and ecological security at time t. Typically, the resolution coefficient for coupling, represented by “k”, is set at 0.5.
In order to solve the problem of too much dispersion and too many correlation coefficients of the LUCCs and ecological security, the correlation coefficients are usually dealt with by using the averaging formula, which is given as
R i j = 1 n i = 1 n D i t
In the formula, n refers to the number of indicators. Rij denotes the correlation between the LUCCs and ecological security in the Ejina Oasis. The comparison of Rij values serves as a quick screening mechanism for identifying the influential factors on ecological security. When Rij equals 1, it suggests a strong association between ecological security and a Land Use Change (LUCC). If 0 < Rij < 1, with a value approaching 1 signifying a more robust correlation, the connection between the ecological security and LUCC is more pronounced. Conversely, values closer to 0 indicate a weaker correlation. This principle also applies to the correlation between the ecological security and evaluation indicators. We utilized the gray correlation method to investigate the coupling relationship between the LUCCs and ecological security, using the Ejina Oasis as a case study. Given the extensive elements in the ecological security evaluation index system, we processed the correlation coefficient using the arithmetic mean formula to manage the substantial dataset. Subsequently, a gray relation degree model for ecological security was established. This facilitated an examination of the temporal patterns in the coupling strength between the LUCCs and ecological security, providing insights into the critical dynamics of this relationship.

3. Results

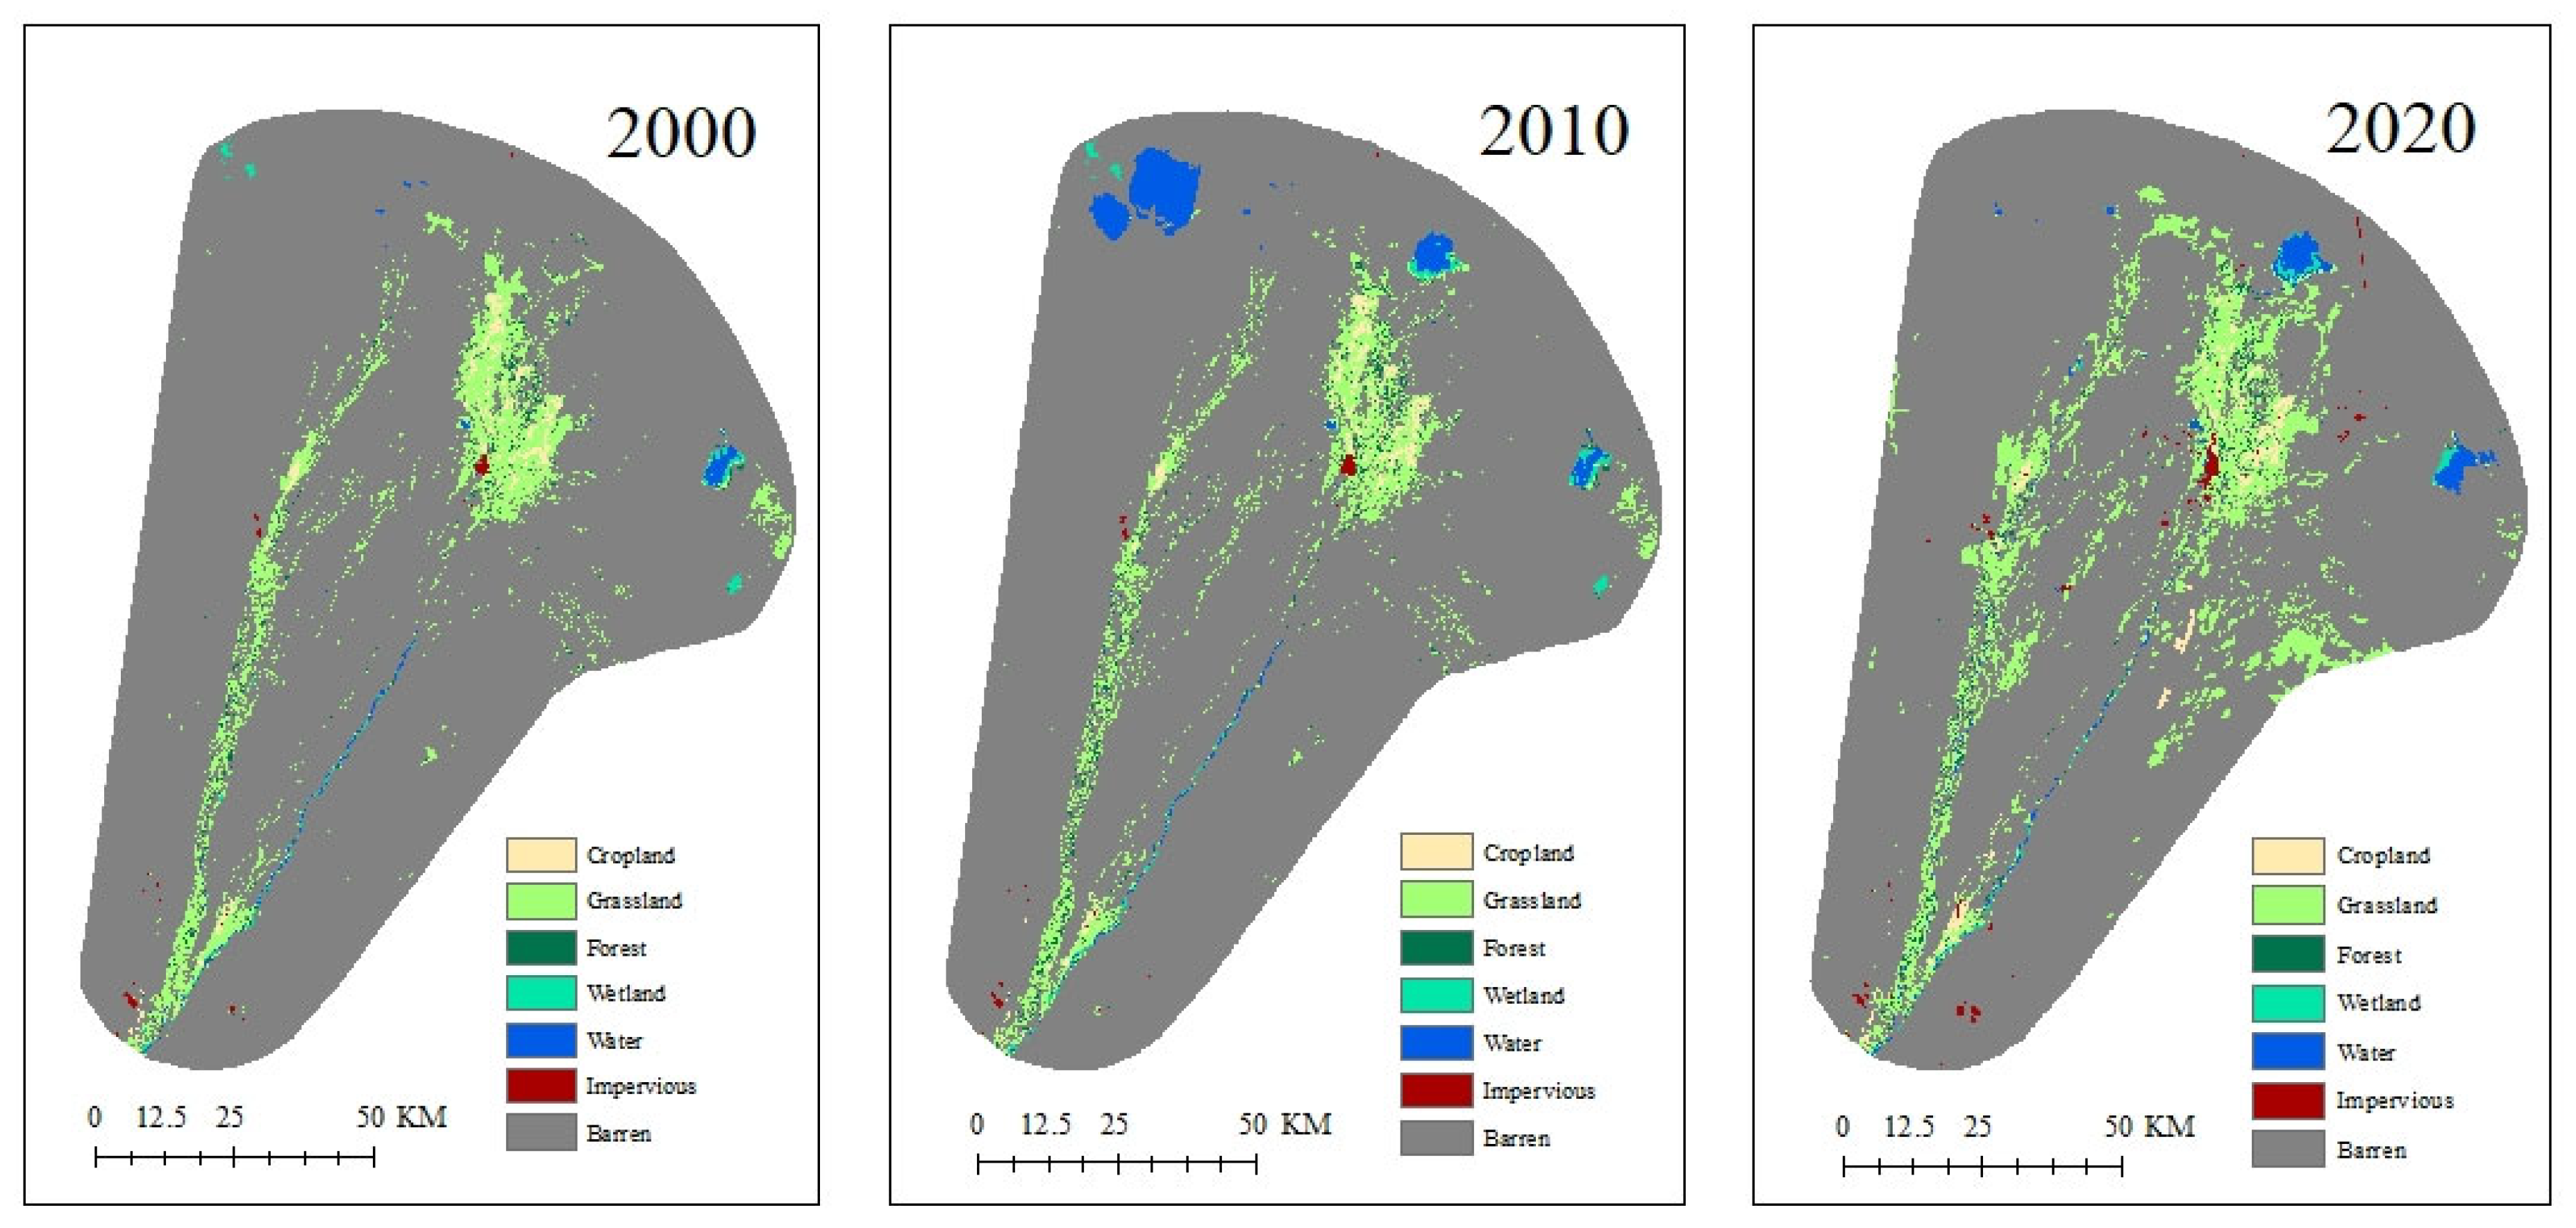
3.1. Temporal and Spatial LUCCs from 2000 to 2020

Figure 3 displays the spatial distribution of land use in the Ejina region for 2000, 2010, and 2020. Table 4 and Table 5 provide data on the land use, incremental area, and annual expansion rates for each land use type between 2000 and 2020. The results highlight significant changes in the area of each land use type in the Ejina region over time, with distinct stages of change. Over the past two decades, the ecological landscape of the Ejina region has undergone significant changes, especially in the oases (including woodland, grassland, and cropland) and total water (including wetland and water). In 2000, Ejina’s oases covered an area of 1069.38 km2, of which grassland covered an area of 909.85 km2, woodland covered an area of 63.88 km2, and cropland covered an area of 95.65 km2. Meanwhile, the total water area was 86.16 km2, divided into 44.87 km2 of water and 41.29 km2 of wetland.
By 2010, the total area of the Ejina’s Oasis was reduced to 999.87 km2. Grassland dominated, with an area of 805.59 km2, while woodland and cropland covered 89.54 km2 and 104.74 km2, respectively. The total water area expanded to 307.82 km2, with a water area of 254.53 km2 and a wetland area of 53.29 km2.
By 2020, the area of the Ejina’s Oasis increased significantly to 1538.19 km2. This increase is marked by a significant expansion of grassland to 1318.87 km2, woodland to 81.99 km2 and cropland to 137.33 km2. Ejina’s total water area reduced to 159.09 km2, comprising 125.79 km2 of water and 33.30 km2 of wetland.
Overall, both the oases and total water are on an upward trend, increasing by 468.81 km2 and 72.93 km2, respectively, from 2000 to 2020, with the area of oases in 2020 being 1.44 times the area in 2000 and the area of total water being 1.85 times the area in 2000. However, a detailed analysis of the land-use change shows different phases. From 2000 to 2010, the area of oases decreased by 69.51 km2, with an annual growth rate of −6.5%; from 2010 to 2020, the area of oases increased significantly by 538.32 km2, with an annual growth rate of 53.84%. Similarly, the area of total water increased by 257.27% (221.66 km2) from 2000 to 2010 and then decreased by 148.73 km2 from 2010 to 2020, with an annual growth rate of −48.32%.

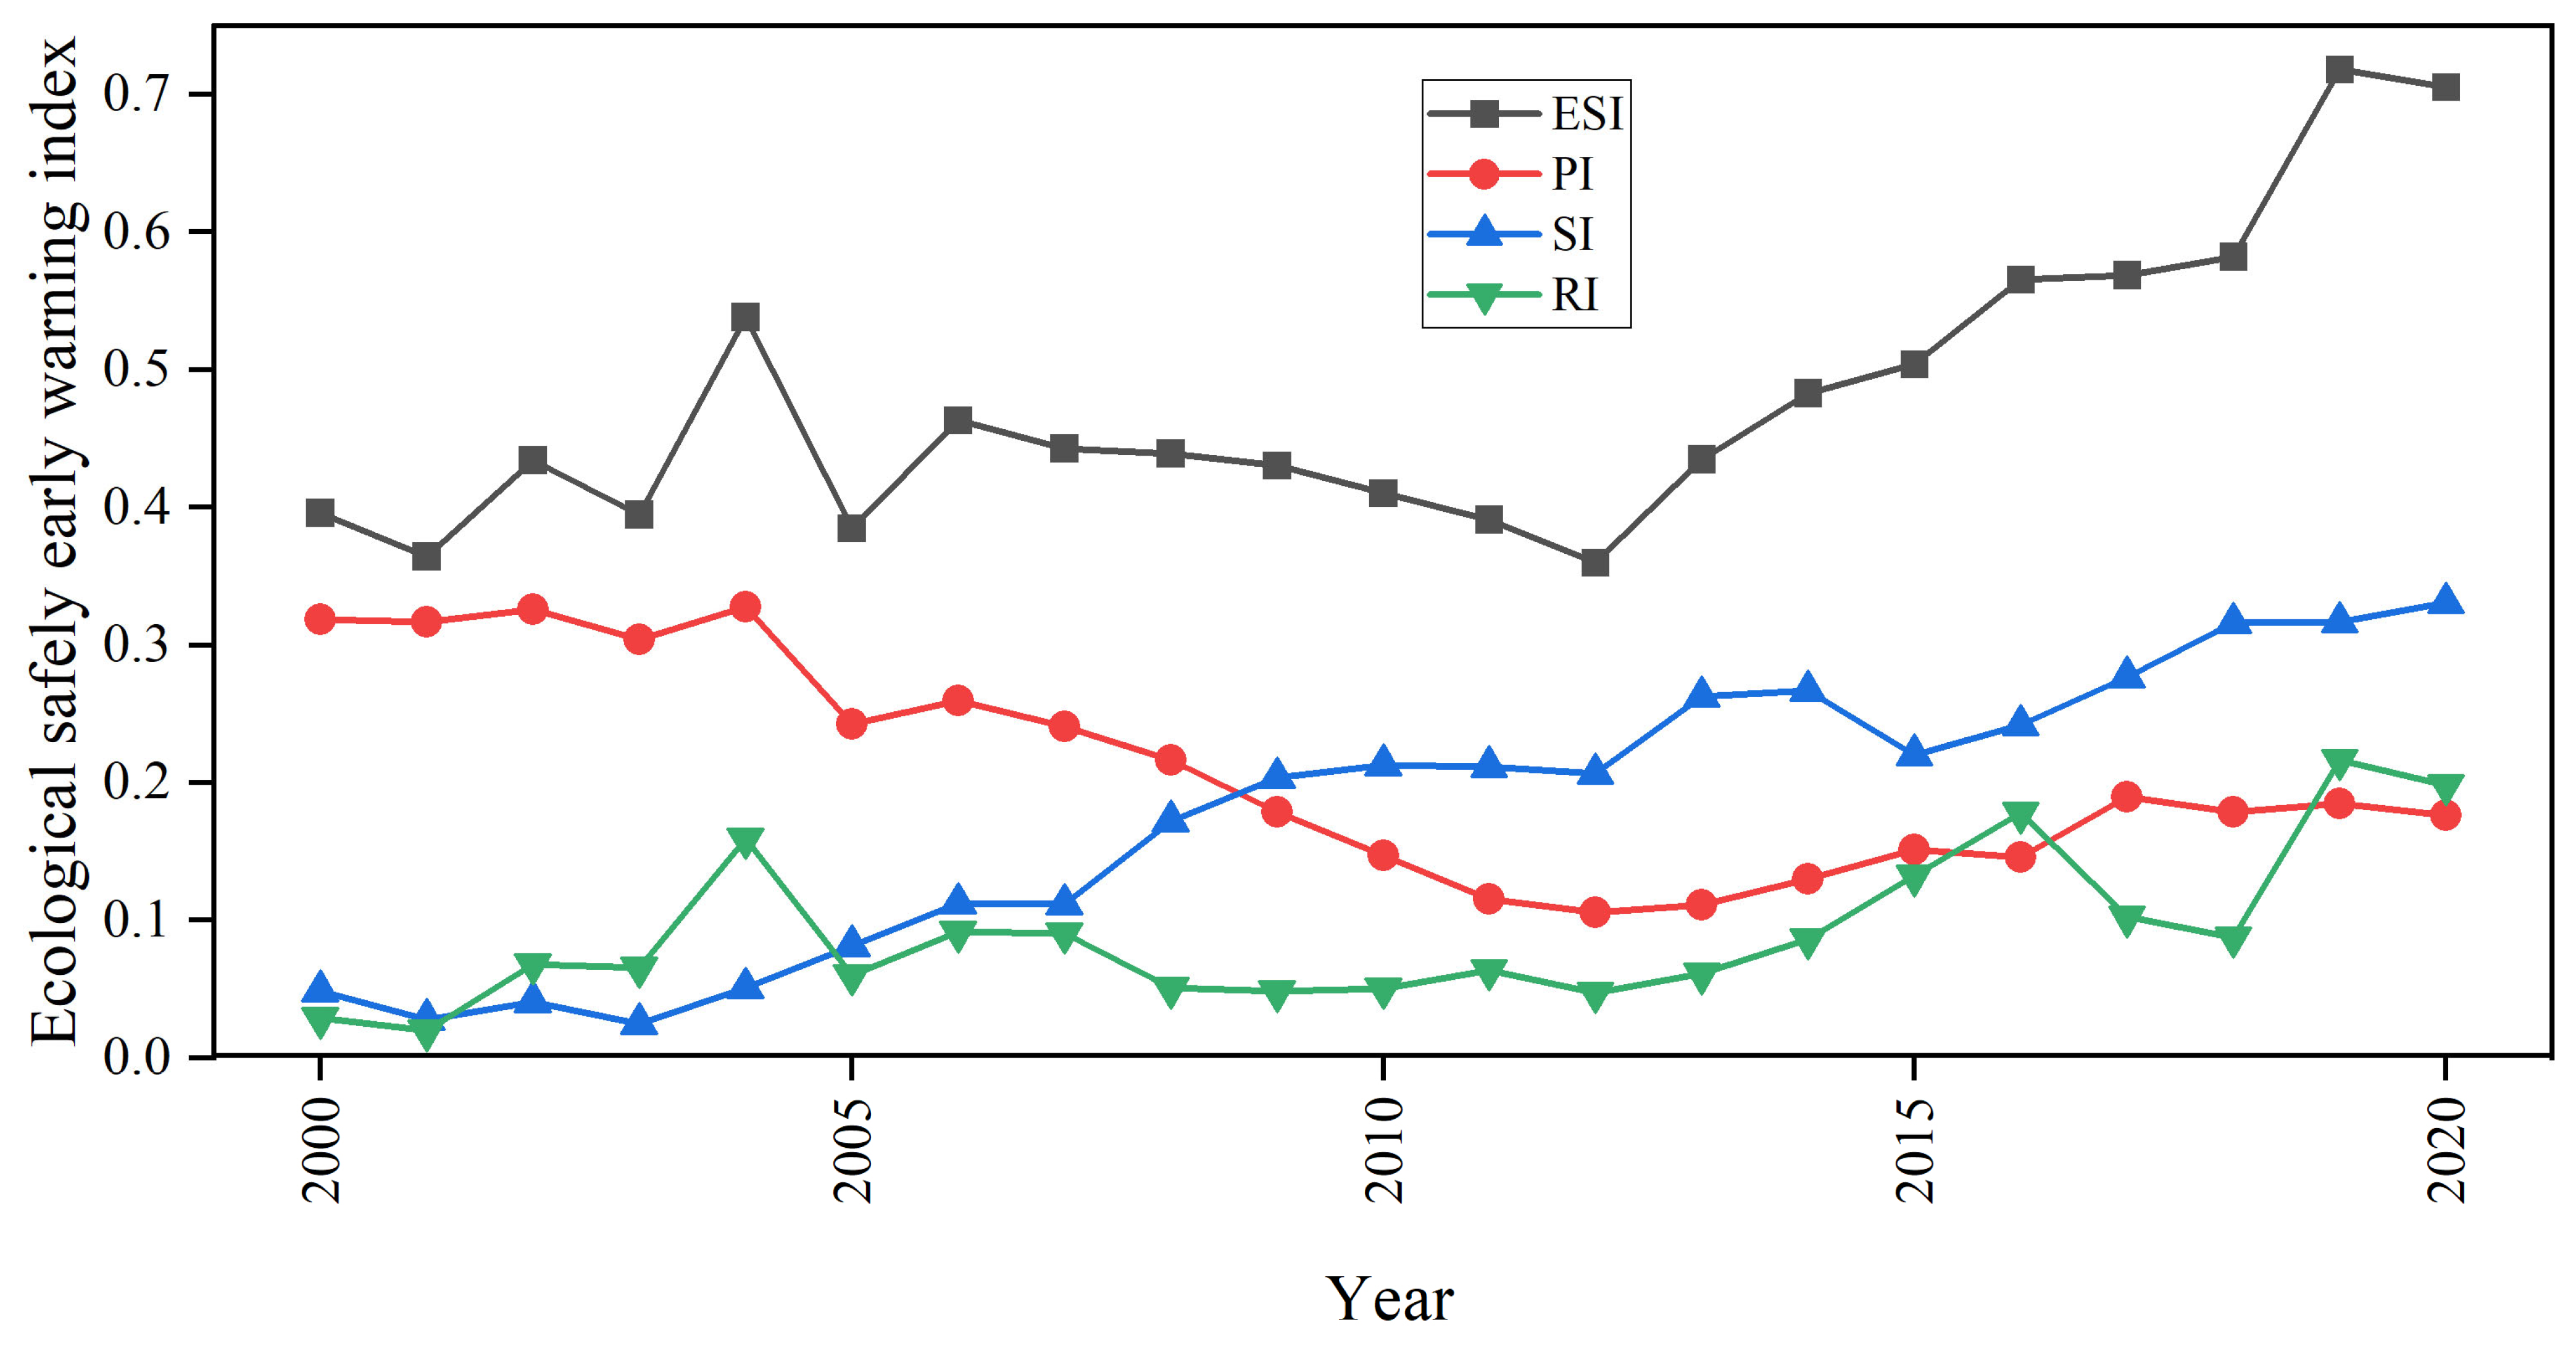
3.2. Ecological Security Index Changes from 2000 to 2020

Figure 4 depicts the temporal changes in the ecological security index (ESI) within the Ejina region from 2000 to 2020. Table 2 presents the grading of the ESI and the associated level ranges. The results indicate significant fluctuations in the ESI over time in Ejina. A lower ESI indicates increased pressure on natural and social ecosystems, suggesting reduced sustainability prospects for Ejina.
The figure reveals that from 2000 to 2012, the ESI consistently remained around 0.4, indicating that Ejina’s ecological security teetered between insecurity and critical security during this period. In the subsequent years, from 2012 to 2020, there was a discernible upward trajectory in the ESI. Specifically, the index was 0.3597 in 2012 and increased to 0.7052 in 2020. Consequently, the ecological security status of the Ejina region transitioned from an insecure state to a more secure one. This implies that since the initiation of the Heihe River Diversion Program, the Ejina region’s ecological conditions have continuously improved, and its overall sustainability has steadily enhanced.
The pressure index (PI) in the Ejina region’s ecological security showed a continuous decrease from 2000 to 2020, followed by a gradual recovery. Simultaneously, the proportion of the PI to the ESI steadily decreased over the study period. Conversely, the ecological security status index (SI) registered a consistent yearly increase from 2000 to 2020. Additionally, the ecological security response index (RI) displayed an overall upward trajectory during the same period, albeit with occasional fluctuations in some years.

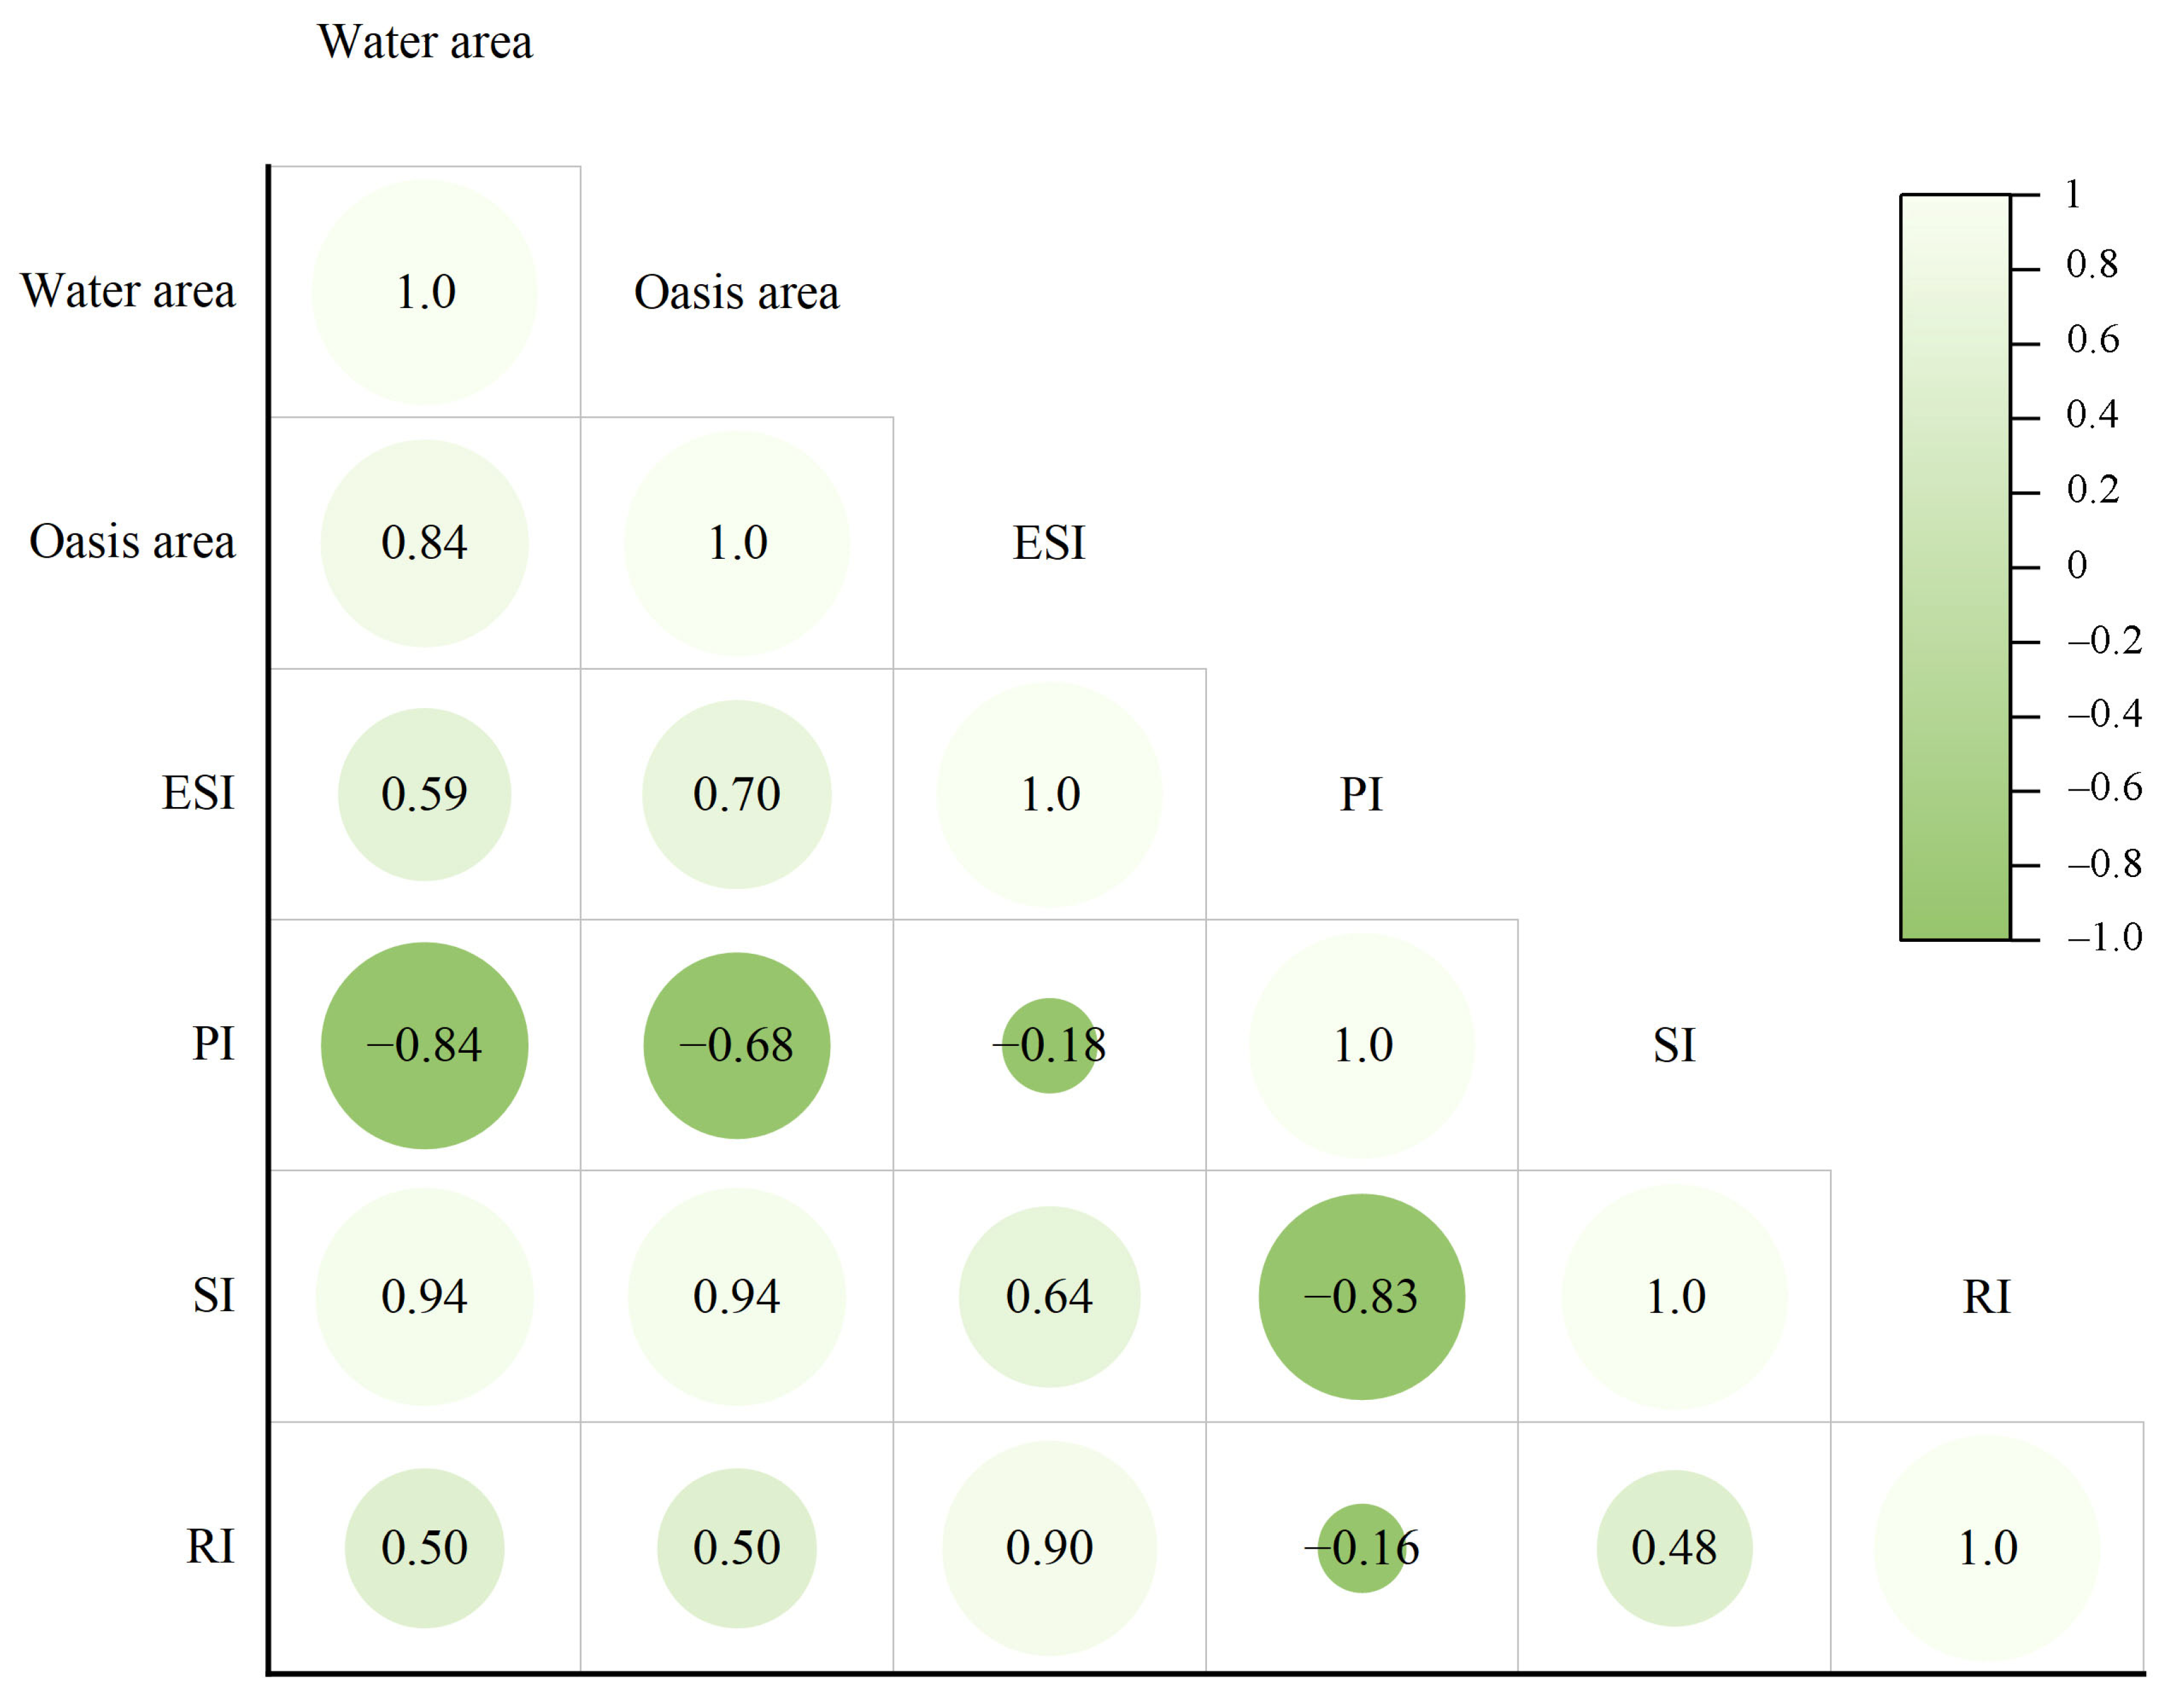
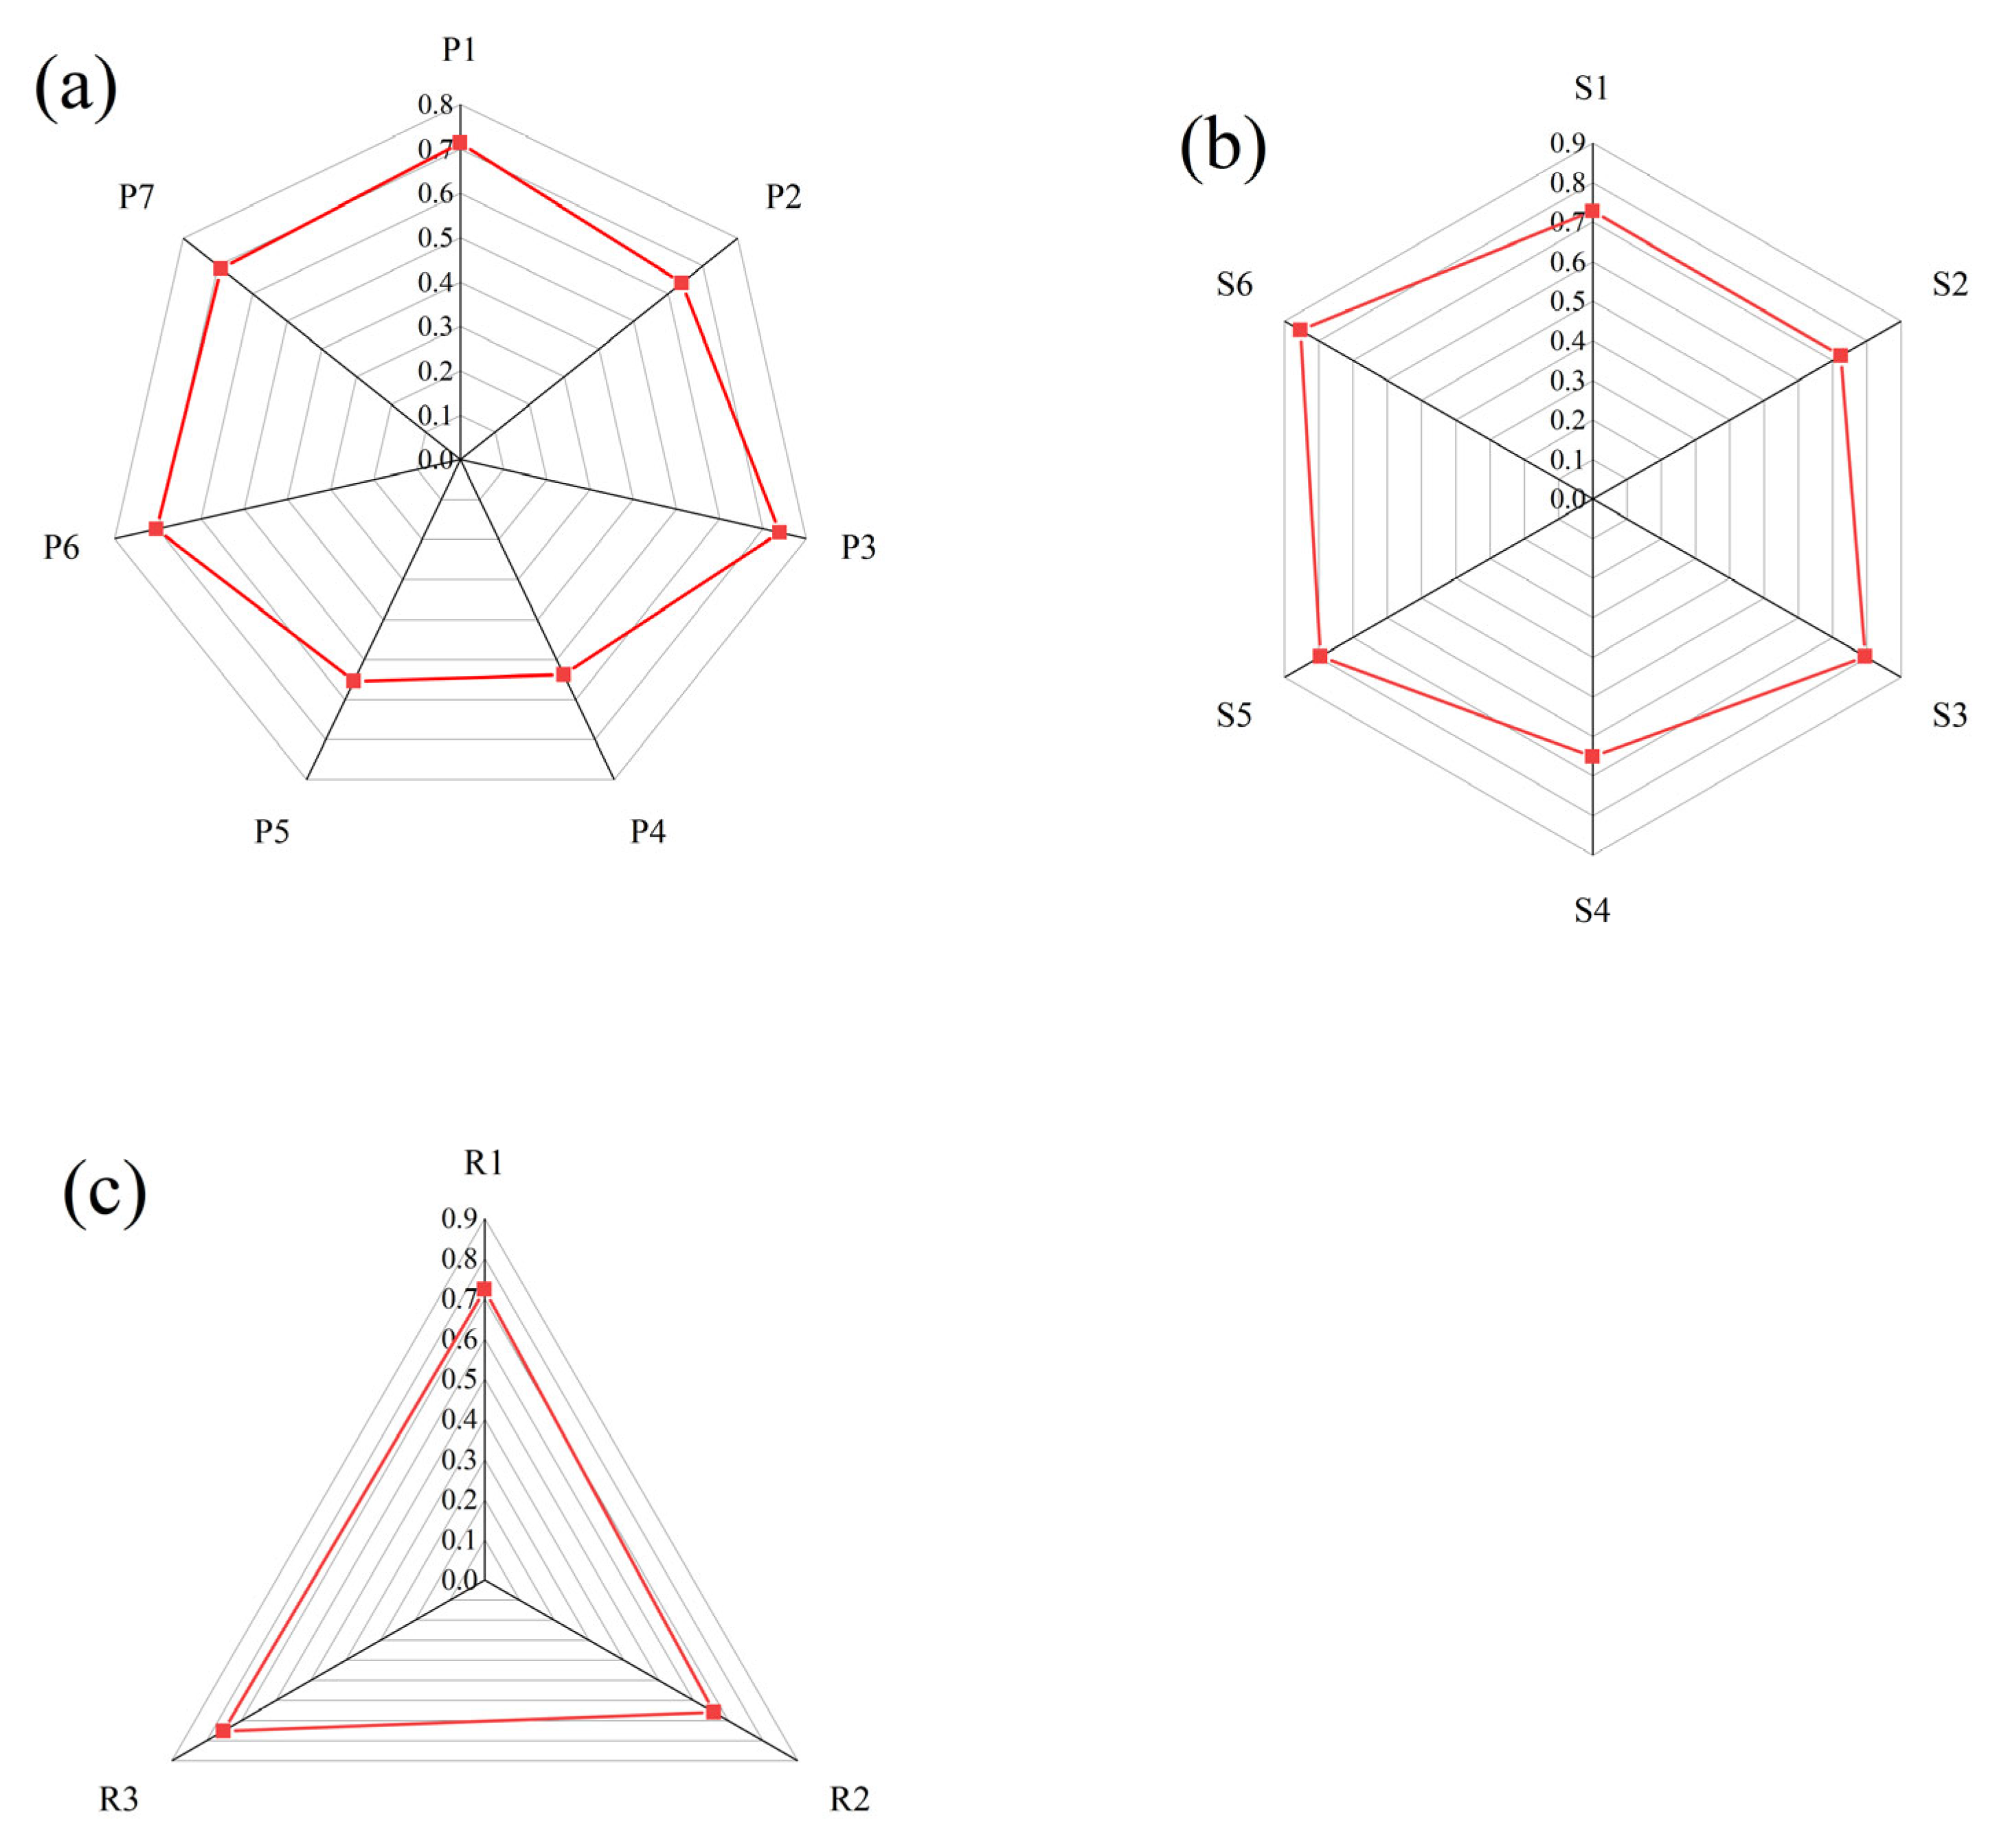
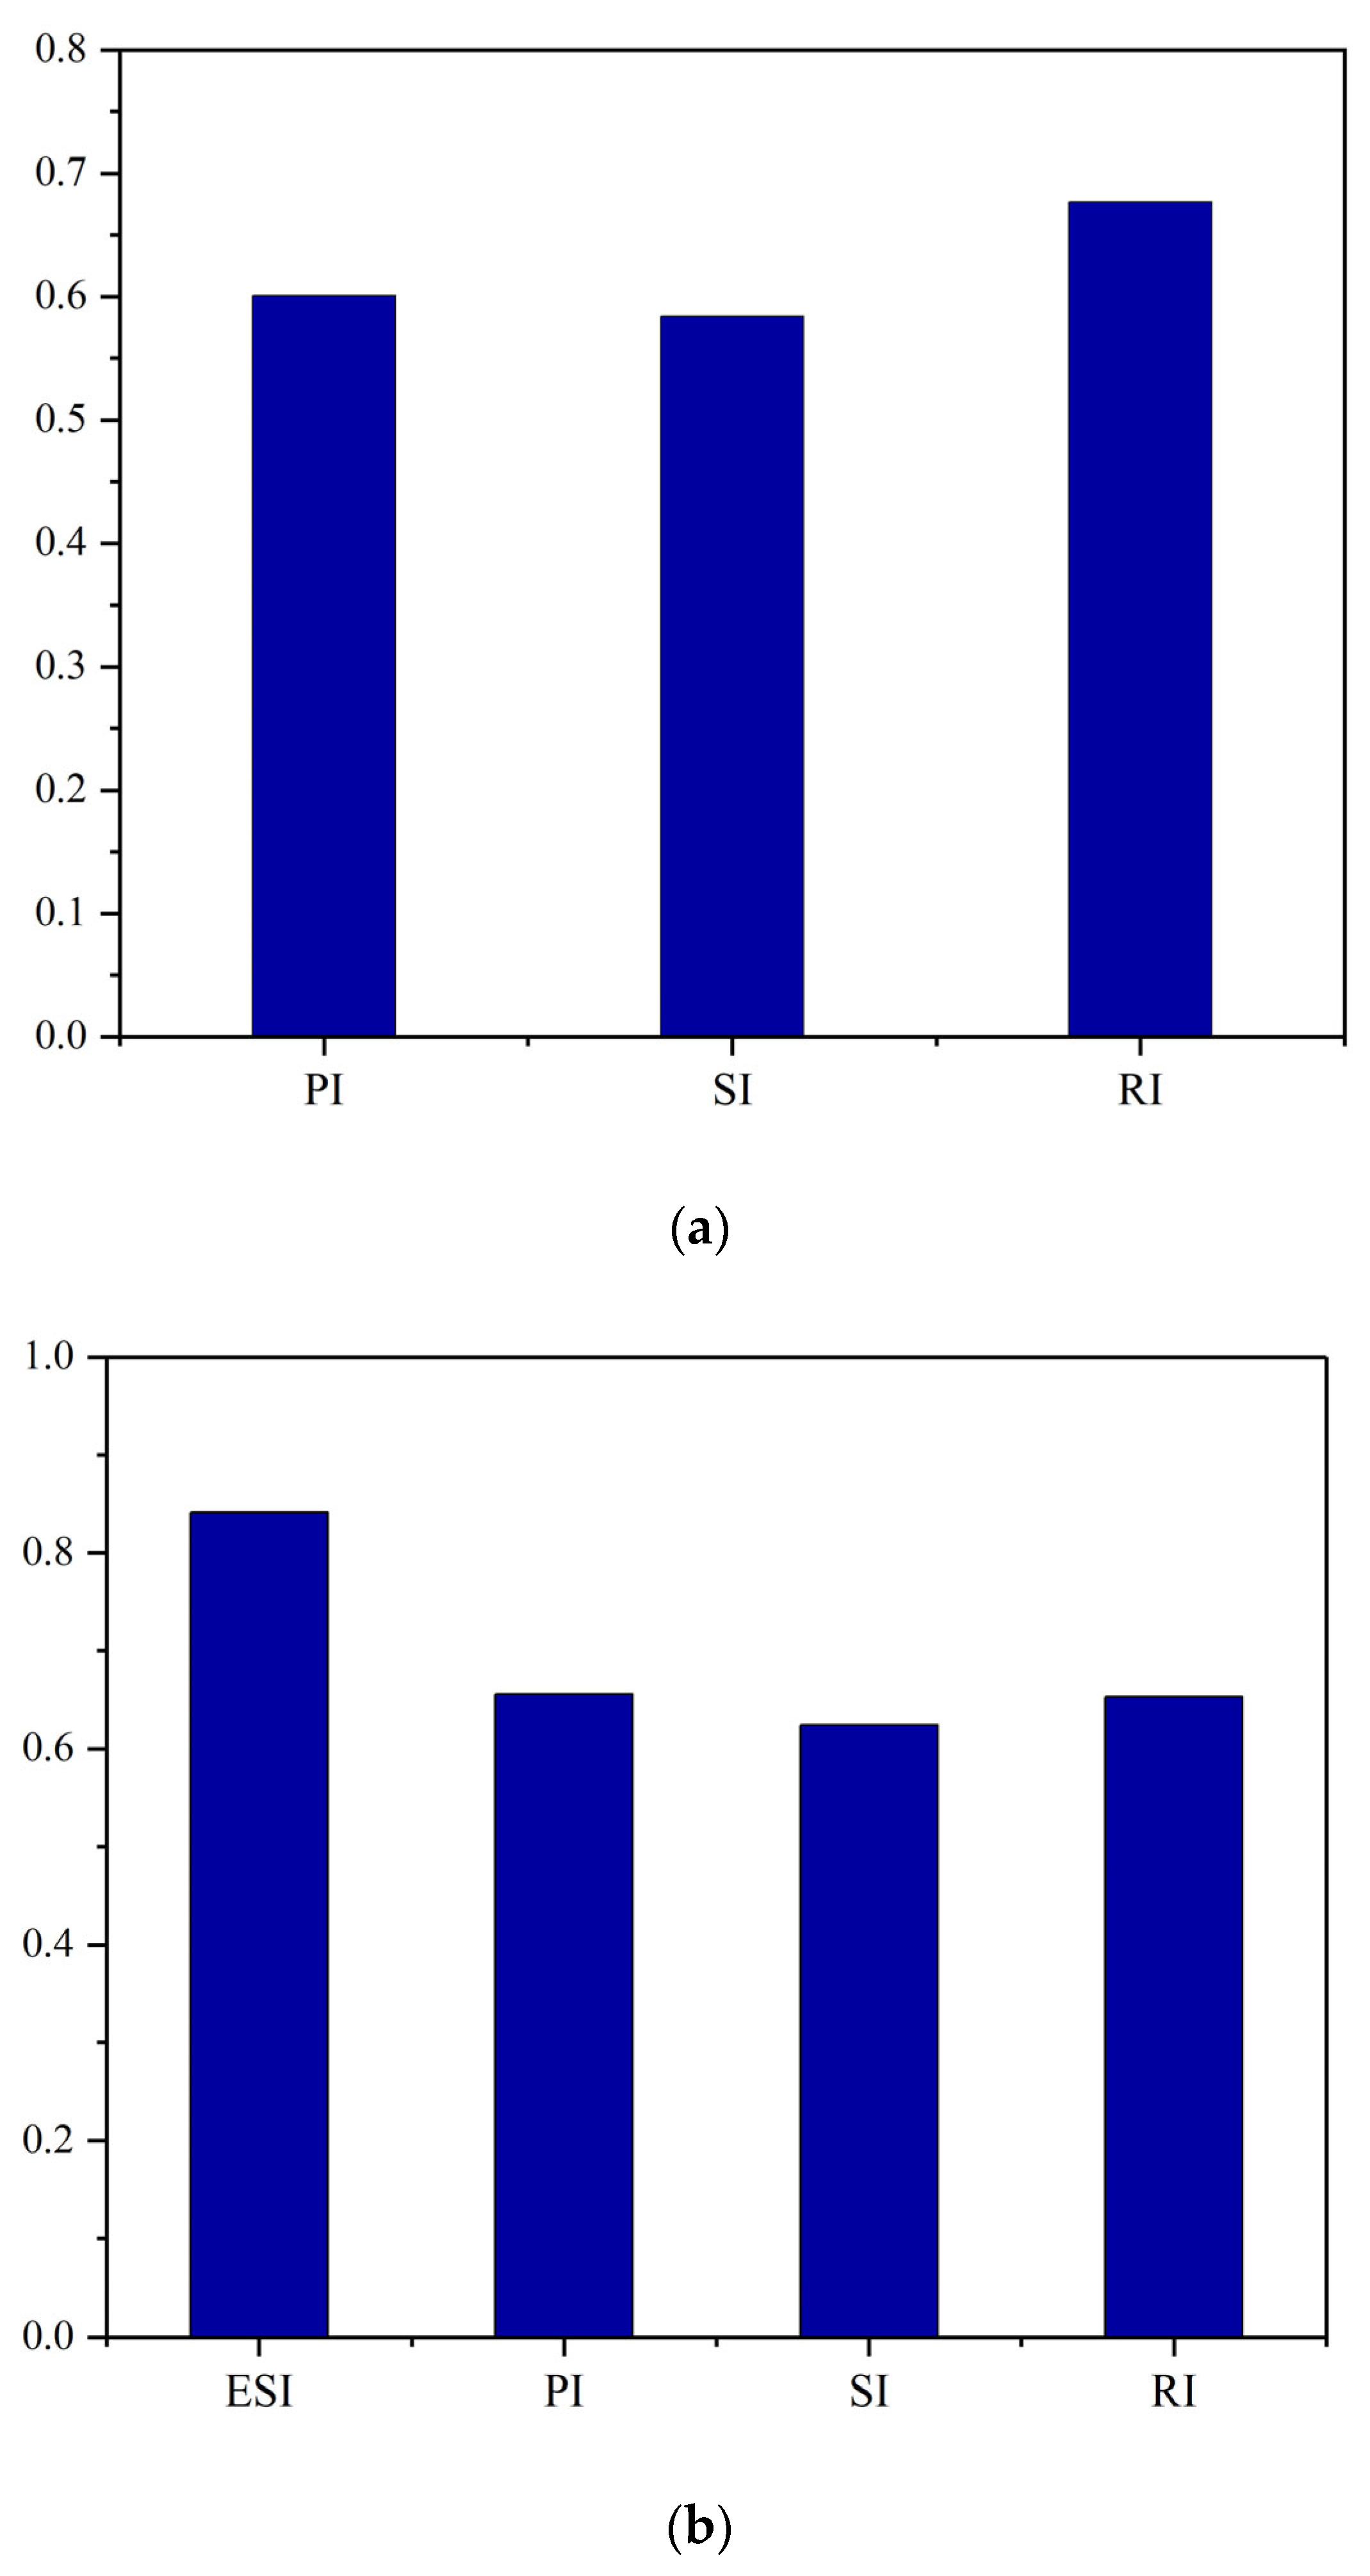
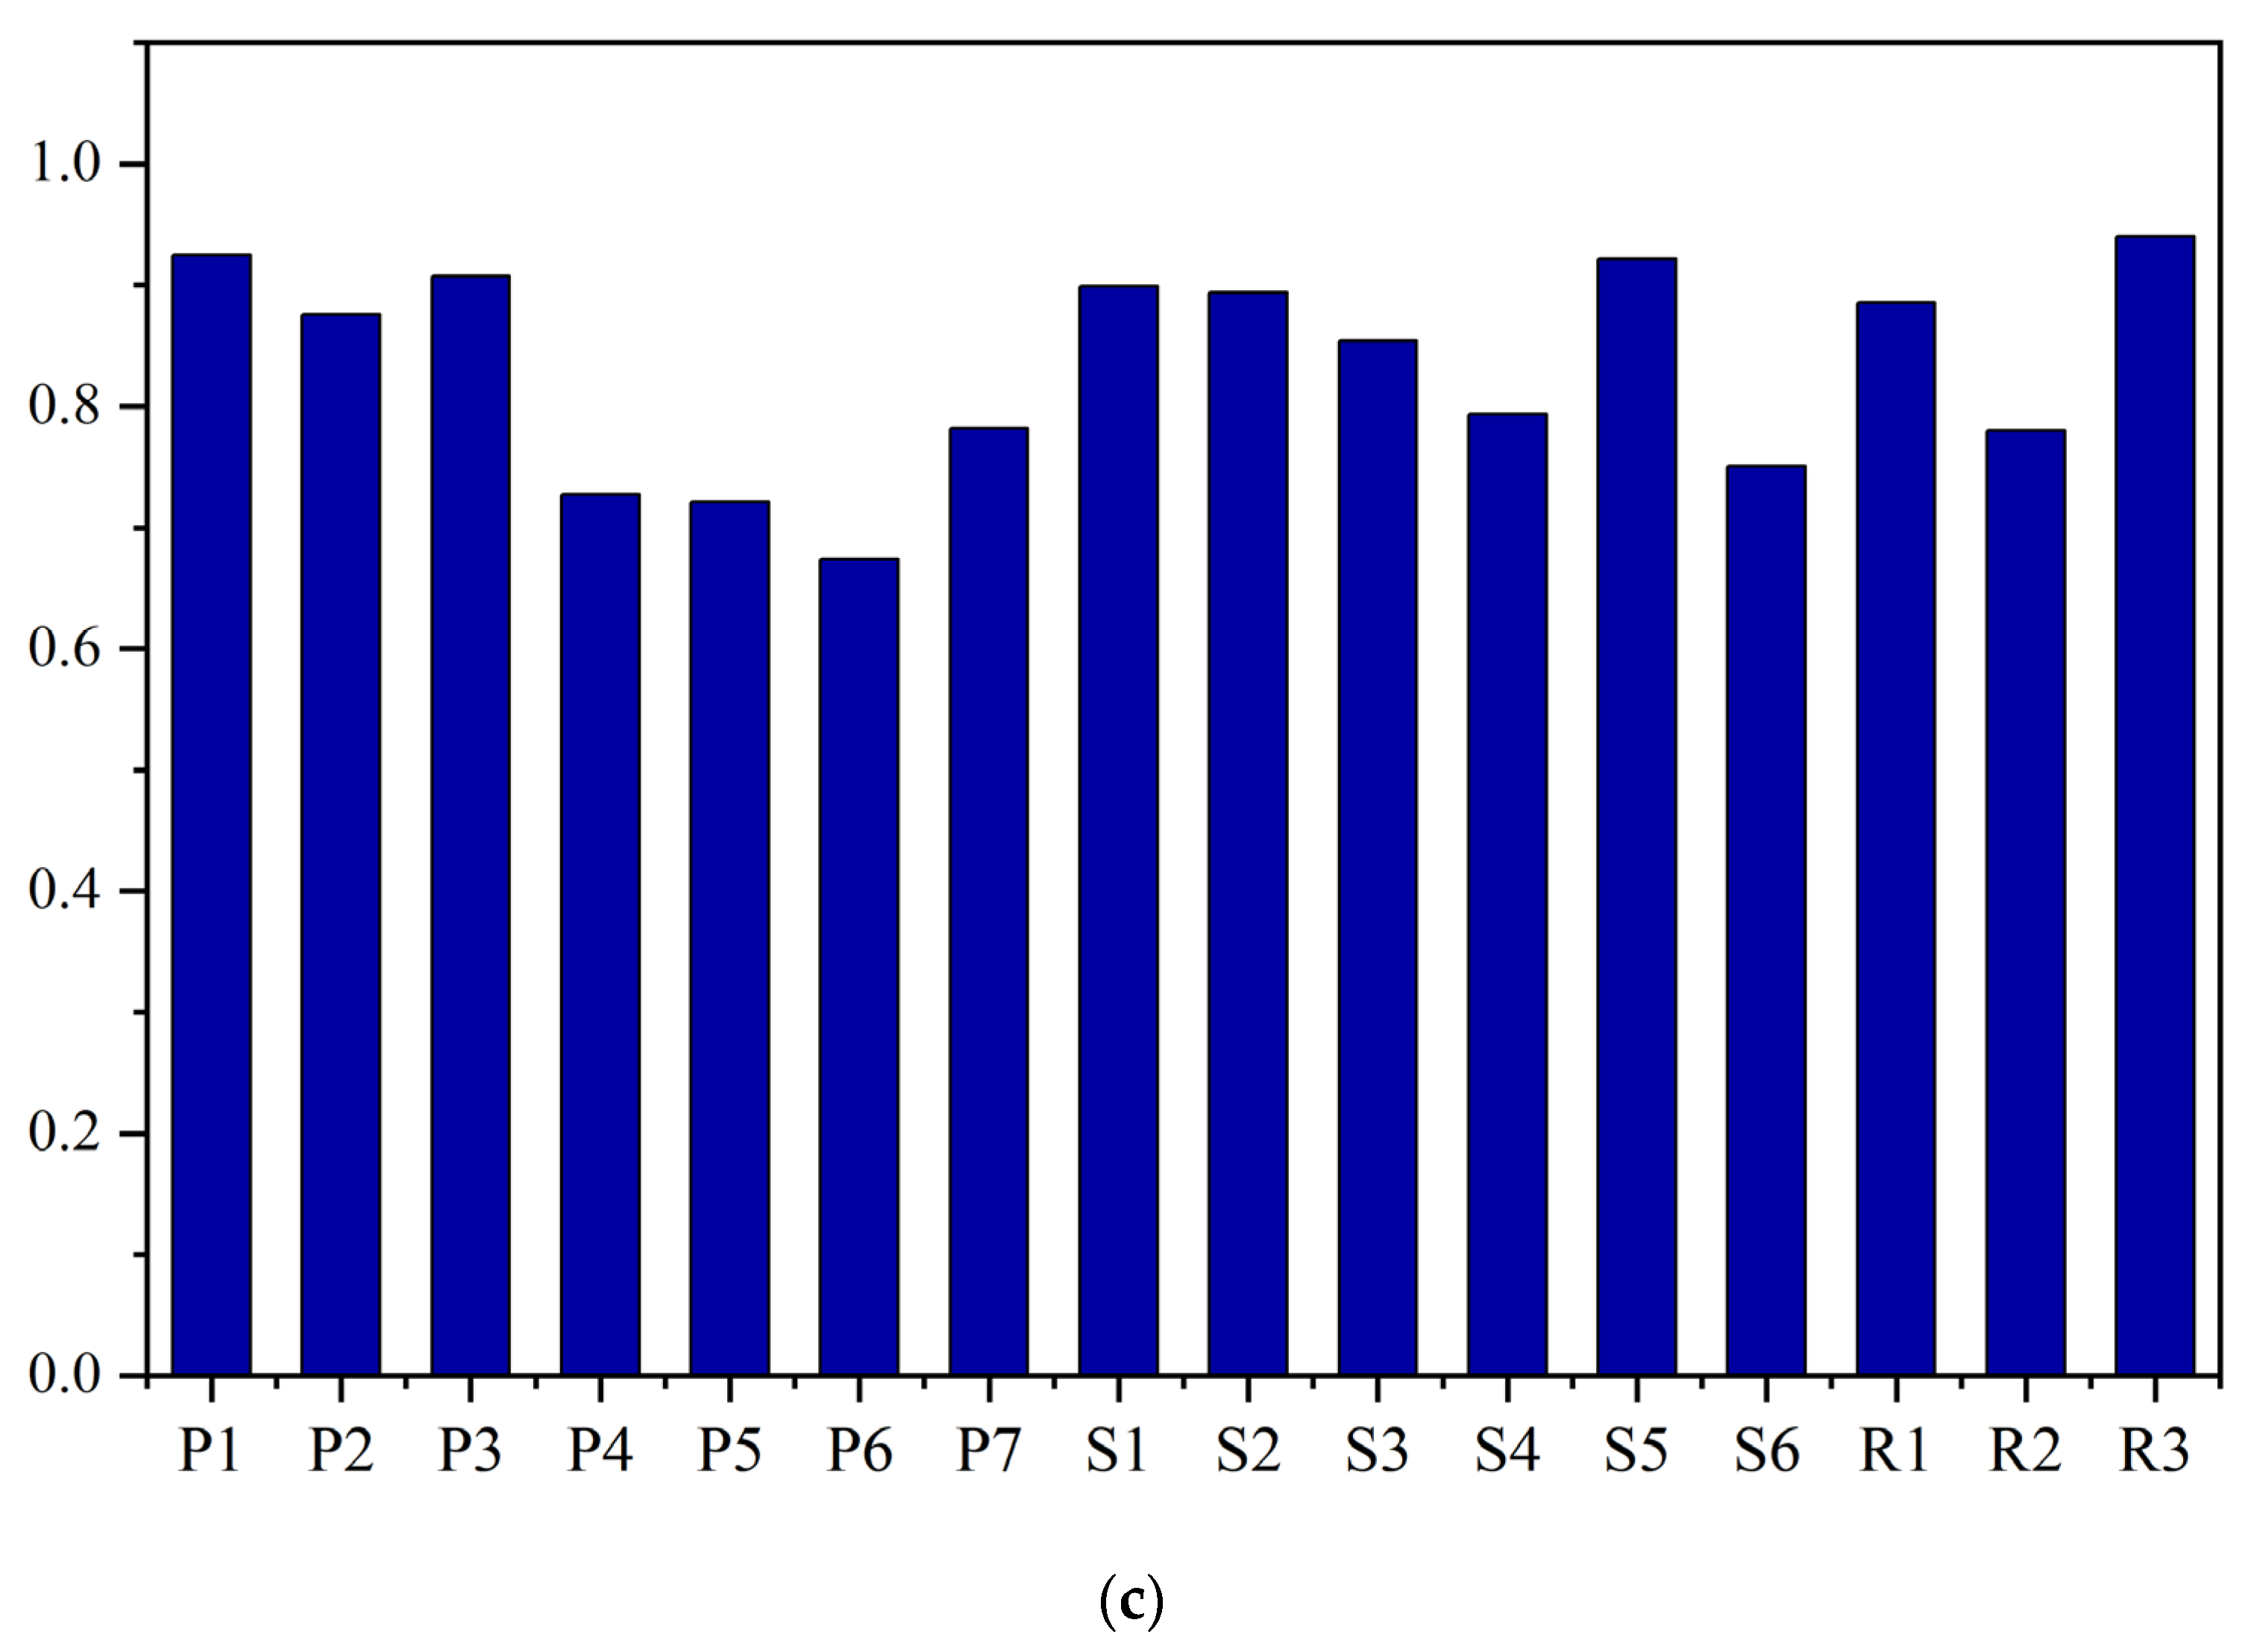
3.3. Analysis of the Evolutionary Drivers of Ecological Security

Figure 5 displays the results of the correlation analysis between the water and oasis areas and the ESI, pressure index (PI), state index (SI), and response index (RI). The findings indicate a positive correlation between the water area in the Ejina region and the oasis area, ecological security index, state index, and response index, with correlation coefficients of 0.84, 0.59, 0.94, and 0.50, respectively. Conversely, there is a negative correlation with the pressure index, represented by a correlation coefficient of −0.84. The oasis area shows positive correlations with the ESI, SI, and RI while maintaining a negative correlation with the pressure index, with correlation coefficients of 0.70, 0.94, 0.50, and −0.68, respectively. The ecological security index exhibits positive correlations with the state and response indexes, characterized by correlation coefficients of 0.64 and 0.90, respectively.
In Figure 6a–c, each indicator exhibits a correlation consistently above 0.5, indicating a strong association with its respective layer. In the stress indicator layer, P1, P3, and P6 exert the most significant influence on the stress index, with average correlation coefficients of 0.71, 0.74, and 0.70, respectively. On the other hand, S3, S5, and S6 emerge as the primary factors affecting the ecological security status index, with notable average correlation coefficients of 0.80, 0.80, and 0.85, respectively. Regarding the ecological security response index, R3 holds the most substantial influence, boasting an average correlation coefficient of 0.75, followed by the average correlation coefficients of the two indicators, R1 and R2, with notable average correlation coefficients of 0.72 and 0.66, respectively.
Based on the established correlations between ecological security and its dimensions (pressure, state, and response) and their connections with the evaluation indicators, as well as the relationship between oasis change and ecological security, the key factors influencing ecological security and the impact of oasis change were determined (refer to Figure 7a–c). The correlation coefficients between the ESI and the PI, SI, and RI were 0.60, 0.58, and 0.68, respectively. Moreover, the correlation coefficients between the oasis change and ESI, PI, SI, and RI were 0.84, 0.66, 0.62, and 0.65, underlining the substantial influence of regional management policies as the primary factor affecting the Ejina Oasis’s ecological security. Referring to Figure 7c, it is evident that the correlation coefficients of the habitat degradation degree, total population, habitat quality, carbon stock, FVC, volume of water discharged from Wolf Heart Mountain, and the proportion of tertiary industry with ecological security surpass 0.89, signifying the profound impact of the current ecological environment on ecological security. Policy measures aimed at augmenting water availability in the oasis hold the potential to enhance the current ecological security status and bolster sustainability levels. Furthermore, local industrial restructuring and an increased focus on tertiary industry sectors can contribute to ameliorating ecological insecurity.
Past research has identified distinctive temporal phases in oasis expansion. In line with the findings of this study, the oasis area in Ejina has exhibited a “V” shaped pattern since 2000. It experienced a gradual contraction from 2000 to 2010, followed by an accelerated expansion from 2010 to 2020 [36]. Previous studies have highlighted the significant influence of economic development, ecological conditions, and total water resources on the sustainability of arid oasis areas. Moreover, factors such as the total population and arable land area can further impact the ecological security of these regions by altering the water resource utilization allocation and affecting changes within the oasis landscape.

4. Discussion

4.1. Applicability of a New Ecological Security Evaluation Framework to Oases in Arid Zones

A quantitative assessment of the ecological security within the social–ecological system of the Ejina Oasis serves as a valuable tool for comprehending the alterations in the regional ecological landscape following the execution of the Heihe River Basin Diversion Program. This assessment also enables the prediction of the trajectory of change within the social–ecological system post-policy implementation, offering valuable insights for decision-makers and managers. Ecological safety assessment studies are often conducted using both qualitative and quantitative approaches, while quantitative assessments tend to quantify changes in pollutant concentrations in the study area and do not provide a comprehensive picture of the overall changes in the social–ecological system; qualitative assessments are more often used in studies of the evolution of social–ecological systems. The single use of qualitative or quantitative assessment does not fully reflect the state and change of the social–ecological system [37]. Therefore, we calculated the habitat quality, carbon stock, and habitat degradation degree through the InVEST model to reflect the ecosystem change status, and at the same time, we qualitatively analyzed the socio-economic development status as a way to better determine the social–ecological system change situation in the Ejina Oasis. In our study, the evaluation index system based on the PSR model can dynamically illustrate the causes of ecosystem deterioration and the drivers of improvement in the Ejina Oasis [38]. The amount of water resources determines the health of the oasis ecosystem in the arid zone [39]. In order to make our study universally applicable in the arid-zone oasis, we added the water outflow from Wolf Heart Mountain, the water inflow to the East Juyan Sea, and the lake surface area of the East Juyan Sea as evaluation indicators to represent water resources. These updated indicators effectively depict the ecological changes in the Ejina Oasis following the upstream water influx from the Heihe River Basin’s Diversion Program. Our ecological security evaluation framework covers the pressure, state, and response dimensions, using the entropy weighting method for quantitative assessments of ecological security in the arid oasis. We validate the framework’s effectiveness within the arid oasis region. Since the implementation of the Heihe River Diversion Program, the downstream oasis has shown an increasing trend of water inflow, and the downstream ecological water use has significantly increased. In contrast, the upstream water inflow has remained flat [40].
Prior studies primarily assessed the current ecological state of the study area, which hindered the portrayal of dynamic environmental changes and the analysis of key drivers influencing ecological security [41,42,43]. In contrast, our investigation comprehensively evaluated the evolution of ecological security in the Ejina Oasis from 2000 to 2020. We systematically analyzed dynamic changes in the contributions of the pressure, state, and response subsystems to the ecological security index, enhancing the validity of our study. Notably, our research considered the impact of the Heihe River diversion project, implemented since 2000, which has yielded significant economic, social, and ecological benefits. Effective water allocation in the Heihe River’s main stream has the raised groundwater levels in the lower reaches, ensuring the sustained inflow to the terminal lake and preventing its drying up [21]. The ecological environment of the Ejina Oasis, characterized prominently by poplars, has notably improved. Consequently, our examination of ecological security changes in the Ejina Oasis from 2000 to 2020 provides valuable insights into the impact of policy interventions on arid-zone oases, offering significance for managerial decisions in arid-zone oasis governance.

4.2. Management Implications and Future Prospects for Oasis Sustainability in Arid Regions

The dynamic assessment of ecological security provides a comprehensive analysis of changes in the sustainability of arid oases after implementing the Heihe River Basin water diversion plan over a specified period. Since the 1960s, the population in the Heihe River Basin has consistently grown, accompanied by significant development in soil and water resource utilization in the middle reaches of the river. This increased tension between socio-economic advancement, ecological environment enhancement, and water resource supply and demand has resulted in a notable ecological supply–demand imbalance for the Ejina Oasis in the lower reaches of Heihe River [36]. In response to the escalating ecological crisis in the Heihe River Basin, unified water resource management for the Heihe River mainstem was introduced in 2000, leading to a continuous flow in the river. As a result, the East Juyan Sea has retained a consistent water surface area of approximately 40 km2 over the past decade [44,45]. From 2000 to 2020, the Ejina Oasis underwent a drastic change.
The assessment of the Ejina Oasis’s ecological security highlights the pivotal role of water resources in enhancing both ecological and socio-economic development. Expanding the oasis can positively impact ecological security but also increase water consumption for forest and grassland areas. This necessitates the formulation of land policies to manage oasis expansion limits. It is essential to recognize that socio-economic development is not only a safeguard of ecological security but can also drive ecological degradation [46]. Altering the industrial structure solves the conflict between economic growth and ecological protection in arid oases like Ejina, the poplar forests, and the East Juyan Sea scenic area. Residents’ income drives this transformation and can significantly affect local ecological preservation.
Our ecological security assessment framework is rooted in the pressure, state, and response dimensions, taking into account both socio-economic and ecological factors of the arid oasis. Given its heavy dependence on water resources from the upper Black River, we also analyzed the impact of policy factors on the sustainable development of the Ejina Oasis. However, there are still some uncertainties and limitations in our study. First, we did not find a suitable ecological security hierarchy result to express our findings. Second, our study mainly analyzes the results of changes in ecological security in the Ejina Oasis over the period from 2000 to 2020 and does not analyze it spatially. Finally, when analyzing the weights of the indicators, we used the entropy weighting method and did not consult experts to delineate the weights of the selected indicators, which will lead to a certain degree of uncertainty in our research results [39]. In addition, there are still some deficiencies in the selection of indicators, ignoring the impact of indicators such as the type of vegetation cover, the nature of the soil, and the investment in water conservancy facilities on ecological security. Future research should focus on balancing the relationship between oasis areas and water resource utilization.

5. Conclusions

This paper establishes an ecological security evaluation index system using the P–S–R model and socio-economic and ecological environment indicators as the basic framework. In addition, the key drivers of ecological security are analyzed using gray correlation.
This study shows that the ecological security index of the Ejina Oasis has been around 0.4 from 2000 to 2012, but it shows a significant upward trend from 2012 to 2020, indicating that the ecological security of the oasis has gradually changed from insecurity to a secure state. Before 2012, the pressure index had a greater influence on ecological security, while after that, it gradually transitioned to the state index becoming dominant. There is a strong correlation between the land use changes and the fluctuation of the ecological security index. The other key determinants of ecological security changes include the degree of habitat degradation, total population, habitat quality, carbon stock, forest cover, Wolf Heart Mountain drainage, and the proportion of tertiary industry.

Author Contributions

Conceptualization, X.J. and X.S.; methodology, X.S.; software, X.S.; validation, Y.L. and Q.W.; formal analysis, Y.Z.; investigation, X.L.; resources, X.J.; data curation, Q.W.; writing—original draft preparation, X.S.; writing—review and editing, X.J.; visualization, X.S.; supervision, Y.L.; project administration, X.J.; funding acquisition, X.J. All authors have read and agreed to the published version of the manuscript.

Funding

This work was supported by the Special Funds of the National Natural Science Foundation of China (Grant No. 52379025 and No. 51779209).

Institutional Review Board Statement

Not applicable.

Informed Consent Statement

Not applicable.

Data Availability Statement

Data will be made available on request.

Acknowledgments

We are especially grateful to the editor and anonymous reviewers for their helpful comments and suggestions, which have improved the quality of the manuscript.

Conflicts of Interest

The authors declare that they have no known competing financial interests or personal relationships that could have appeared to influence the work reported in this paper.

References

  1. Solovjova, N.V. Synthesis of ecosystemic and ecoscreening modelling in solving problems of ecological safety. Ecol. Model. 1999, 124, 1–10. [Google Scholar] [CrossRef]
  2. Ma, L.; Bo, J.; Li, X.; Fang, F.; Cheng, W. Identifying key landscape pattern indices influencing the ecological security of inland river basin: The middle and lower reaches of Shule River Basin as an example. Sci. Total Environ. 2019, 674, 424–438. [Google Scholar] [CrossRef] [PubMed]
  3. Lea, D.A.M.; Löffler, E.; Douglas, I. Review symposium: Our common future: The world commission on environment and development. Aust. Geogr. 1989, 20, 195–201. [Google Scholar] [CrossRef]
  4. Yu, G.; Zhang, S.; Yu, Q.; Fan, Y.; Zeng, Q.; Wu, L.; Zhou, R.; Nan, N.; Zhao, P. Assessing ecological security at the watershed scale based on RS/GIS: A case study from the Hanjiang River Basin. Stoch. Environ. Res. Risk Assess. 2013, 28, 307–318. [Google Scholar] [CrossRef]
  5. Lu, S.; Li, J.; Guan, X.; Gao, X.; Gu, Y.; Zhang, D.; Mi, F.; Li, D. The evaluation of forestry ecological security in China: Developing a decision support system. Ecol. Indic. 2018, 91, 664–678. [Google Scholar] [CrossRef]
  6. Li, Z.; Yuan, M.; Hu, M.; Wang, Y.; Xia, B. Evaluation of ecological security and influencing factors analysis based on robustness analysis and the BP-DEMALTE model: A case study of the Pearl River Delta urban agglomeration. Ecol. Indic. 2019, 101, 595–602. [Google Scholar] [CrossRef]
  7. Xiao, D.; Chen, W.; Guo, F. On the basic concepts and contents of ecological security. Chin. J. Appl. Ecol. 2002, 13, 354–358. [Google Scholar]
  8. Zhang, Y.; Song, W.; Fu, S.; Yang, D. Decoupling of Land Use Intensity and Ecological Environment in Gansu Province, China. Sustainability 2020, 12, 2779. [Google Scholar] [CrossRef]
  9. Wu, J. Urban ecology and sustainability: The state-of-the-science and future directions. Landsc. Urban Plan. 2014, 125, 209–221. [Google Scholar] [CrossRef]
  10. Zhang, Z.; Anwar, M.; Zibibula, S. Pollution assessment and health risks evaluation of (metalloid) heavy metals in urban street dust of 58 cities in China. Environ. Sci. Pollut. Res. 2019, 26, 126–140. [Google Scholar] [CrossRef]
  11. Wang, D.; Wang, Y.; Singh, V.P.; Zhu, J.; Jiang, L.; Zeng, D.; Liu, D.; Zeng, X.; Wu, J.; Wang, L.; et al. Ecological and health risk assessment of PAHs, OCPs, and PCBs in Taihu Lake basin. Ecol. Indic. 2018, 92, 171–180. [Google Scholar] [CrossRef]
  12. Sultan, M.; Hamid, N.; Junaid, M.; Duan, J.; Pei, D. Organochlorine pesticides (OCPs) in freshwater resources of Pakistan: A review on occurrence, spatial distribution and associated human health and ecological risk assessment. Ecotoxicol. Environ. Saf. 2023, 249, 114362. [Google Scholar] [CrossRef] [PubMed]
  13. Zhao, L.; Ma, R.; Yang, Z.; Ning, K.; Chen, P.; Wu, J. Ecosystem health risk assessment of lakes in the Inner Mongolian Plateau based on the coupled AHP-SOM-CGT model. Ecol. Indic. 2023, 156, 111168. [Google Scholar] [CrossRef]
  14. Akadiri, S.S.; Alola, A.A.; Alola, U.V.; Nwambe, C.S. The role of ecological footprint and the changes in degree days on environmental sustainability in the USA. Environ. Sci. Pollut. Res. 2020, 27, 24929–24938. [Google Scholar] [CrossRef] [PubMed]
  15. Men, B.; Liu, H. Water resource system vulnerability assessment of the Heihe River Basin based on pressure-state-response (PSR) model under the changing environment. Water Sci. Technol. Water Supply 2018, 18, 1956–1967. [Google Scholar] [CrossRef]
  16. Ye, X.; Zou, C.; Liu, G.; Lin, N.; Xu, M. Main research contents and advances in the ecological security pattern. Acta Ecol. Sin. 2018, 38, 3382–3392. [Google Scholar]
  17. Qi, S.; Luo, F. Water environmental degradation of the Heihe River Basin in arid northwestern China. Environ. Monit. Assess. 2005, 108, 205–215. [Google Scholar] [CrossRef] [PubMed]
  18. Zhang, Z.; Zheng, Y.; Han, F.; Xiong, R.; Feng, L. Recovery of an endorheic lake after a decade of conservation efforts: Mediating the water conflict between agriculture and ecosystems. Agric. Water Manag. 2021, 256, 107107. [Google Scholar] [CrossRef]
  19. Li, X.; Jiang, X.; Lei, Y. Suitable water surface area of the tail lake under the constraint of water diversion scheme in arid areas based on emergy theory. J. Hydrol. Reg. Stud. 2023, 49, 101491. [Google Scholar] [CrossRef]
  20. Wang, Y.; Qi, F.; Si, J.; Su, Y.; Chang, Z.; Xi, H. The changes of vegetation cover in Ejina Oasis based on water resources redistribution in Heihe River. Environ. Earth Sci. 2011, 64, 1965–1973. [Google Scholar]
  21. Zhao, W.; Ding, J.; Wang, Y.; Jia, L.; Cao, W.; Tarolli, P. Ecological water conveyance drives human-water system evolution in the Heihe watershed, China. Environ. Res. 2020, 182, 109009. [Google Scholar] [CrossRef] [PubMed]
  22. Yang, J.; Huang, X. The 30 m annual land cover dataset and its dynamics in China from 1990 to 2019. Earth Syst. Sci. Data 2021, 13, 3907–3925. [Google Scholar] [CrossRef]
  23. Zhang, L.; Zhang, X.; Yuan, S.; Wang, K. Economic, Social, and Ecological Impact Evaluation of Traffic Network in Beijing–Tianjin–Hebei Urban Agglomeration Based on the Entropy Weight TOPSIS Method. Sustainability 2021, 13, 1862. [Google Scholar] [CrossRef]
  24. Liu, Y.; Hu, Y.; Hu, Y.; Gao, Y.; Liu, Z. Water quality characteristics and assessment of Yongding New River by improved comprehensive water quality identification index based on game theory. J. Environ. Sci. 2021, 104, 40–52. [Google Scholar] [CrossRef] [PubMed]
  25. Jordan, H.; Dunt, D.; Dunn, L.; Verrinder, G. Evaluating the Actions towards Environmental Health Using DPSEEA and Program Logic. Environ. Health 2008, 8, 11–25. [Google Scholar]
  26. Hukkinen, J. Sustainability indicators for anticipating the fickleness of human-environmental interaction. Clean Technol. Environ. Policy 2003, 5, 317–333. [Google Scholar] [CrossRef]
  27. Liu, C.; Li, W.; Xu, J.; Zhou, H.; Li, C.; Wang, W. Global trends and characteristics of ecological security research in the early 21st century: A literature review and bibliometric analysis. Ecol. Indic. 2022, 137, 108734. [Google Scholar] [CrossRef]
  28. Gan, L.; Yang, X.; Chen, L.; Lev, B.; Lv, Y. Optimization path of Economy-Society-Ecology system orienting industrial structure Adjustment: Evidence from Sichuan Province in China. Ecol. Indic. 2022, 144, 109479. [Google Scholar] [CrossRef]
  29. Peng, W.; Sun, Y.; Liu, C.; Liu, D. Study on Urban Land Ecological Security Pattern and Obstacle Factors in the Beijing–Tianjin–Hebei Region. Sustainability 2022, 15, 43. [Google Scholar] [CrossRef]
  30. Tian, S.; Zhang, Y.; Xu, Y.; Wang, Q.; Yuan, X.; Ma, Q.; Chen, L.; Ma, H.; Xu, Y.; Yang, S.; et al. Urban ecological security assessment and path regulation for ecological protection—A case study of Shenzhen, China. Ecol. Indic. 2022, 145, 109717. [Google Scholar] [CrossRef]
  31. Lin, W.; Ya, S.P. A Review of Regional Ecological Security Evaluation. Appl. Mech. Mater. 2012, 1802, 337–344. [Google Scholar] [CrossRef]
  32. Li, X.; Zuo, Q.; Zhai, J.; Zhao, Y.; Wang, Y.; Han, S. Evaluation of Adaptive Utilization Capacity of Water Resources and Analysis of Driving Element: A Case Study of Tarim River Basin. Water 2022, 14, 3820. [Google Scholar] [CrossRef]
  33. Liu, L.; Xue, J.; Mao, D.; Chang, J.; Wang, S.; Li, X. An integrative socio-hydrological resilience assessment and management implications for oasis sustainability in arid regions, Northwest China. J. Hydrol. Reg. Stud. 2023, 47, 101389. [Google Scholar] [CrossRef]
  34. Huang, Q.; Peng, B.; Wei, G.; Wan, A. Dynamic assessment and early warning of ecological security: A case study of the Yangtze river urban agglomeration. Nat. Hazards 2020, 107, 2441–2461. [Google Scholar] [CrossRef]
  35. Zhou, L.; Sun, J. Integrated ecosystem management and regulation strategies in the South China Sea. J. Sea Res. 2022, 190, 102300. [Google Scholar] [CrossRef]
  36. Dong, G.; Lian, Y.; Fan, Z.; Chang, X.; Gu, J. Vegetation Changes of Ejina Oasis in the Lower Reaches of Heihe River before and after Ecological Scheduling for Water Resources. Yellow River 2019, 41, 5–9. [Google Scholar]
  37. Zhu, Z.; Ding, J.; Du, R.; Zhang, Z.; Guo, J.; Li, X.; Jiang, L.; Chen, G.; Bu, Q.; Tang, N.; et al. Systematic tracking of nitrogen sources in complex river catchments: Machine learning approach based on microbial metagenomics. Water Res. 2024, 253, 121255. [Google Scholar] [CrossRef]
  38. Wang, D.; Yu, M.; Mo, W.; Lv, D.; Cheng, J.; Sun, L. Ecological Safety Evaluation for Water Resources of China Based on Pressure-State-Response Model: A Case from Zhoushan Archipelago. Nat. Environ. Pollut. Technol. 2021, 20, 601–612. [Google Scholar] [CrossRef]
  39. Cheng, H.; Zhu, L.; Meng, J. Fuzzy evaluation of the ecological security of land resources in mainland China based on the Pressure-State-Response framework. Sci. Total Environ. 2022, 804, 150053. [Google Scholar] [CrossRef]
  40. Dai, L.; Xue, D. Vertical embedded governance and the production of oasis ecological space: Study of the ecological governance of Ejina Oasis. Arid Land Geogr. 2021, 44, 1459–1470. [Google Scholar]
  41. Zhang, D.; Ren, H.; Sun, P.; Jing, P.; Guo, B. Construction of multi-level ecological security network in fragmented nature landscape using the three-dimensional framework of ecological adaptability. Ecol. Indic. 2023, 157, 111229. [Google Scholar] [CrossRef]
  42. Zhang, H.T.; Li, J.L.; Tian, P.; Pu, R.L.; Cao, L.D. Construction of ecological security patterns and ecological restoration zones in the city of Ningbo, China. J. Geogr. Sci. 2022, 32, 663–681. [Google Scholar] [CrossRef]
  43. Wang, Z.; Shi, P.; Zhang, X.; Tong, H.; Zhang, W.; Liu, Y. Research on Landscape Pattern Construction and Ecological Restoration of Jiuquan City Based on Ecological Security Evaluation. Sustainability 2021, 13, 5732. [Google Scholar] [CrossRef]
  44. Cheng, G.; Li, X.; Zhao, W.; Xu, Z.; Feng, Q.; Xiao, S.; Xiao, H. Integrated study of the water–ecosystem–economy in the Heihe River Basin. Natl. Sci. Rev. 2014, 1, 413–428. [Google Scholar] [CrossRef]
  45. Zeng, Z.; Liu, J.; Koeneman, P.H.; Zarate, E.; Hoekstra, A.Y. Assessing water footprint at river basin level: A case study for the Heihe River Basin in northwest China. Hydrol. Earth Syst. Sci. 2012, 16, 2771–2781. [Google Scholar] [CrossRef]
  46. Liu, X.; Yuan, S.; Yu, H.; Liu, Z. How ecological policy stringency moderates the influence of industrial innovation on environmental sustainability: The role of renewable energy transition in BRICST countries. Renew. Energy 2023, 207, 194–204. [Google Scholar] [CrossRef]
Figure 1. Location of the study area.
Sustainability 16 01942 g001
Figure 2. The framework of the evaluation index system for ecological security.
Sustainability 16 01942 g002
Figure 3. Spatial–temporal distribution of land use in Ejina from 2000 to 2020.
Sustainability 16 01942 g003
Figure 4. Changes in the ecological security index in Ejina from 2000 to 2020.
Sustainability 16 01942 g004
Figure 5. Correlation heat map: Water area, oasis area, and ecological security index in Ejina.
Sustainability 16 01942 g005
Figure 6. Correlation coefficients for the stress, state, and response dimensions and their indicators.
Sustainability 16 01942 g006
Figure 7. (a) Correlation coefficient between ecological security and its three dimensions. (b) Correlation coefficient between oasis change and ecological security. (c) Correlation coefficient between ecological security and evaluation indicators.
Sustainability 16 01942 g007aSustainability 16 01942 g007b
Table 1. Descriptions of the ecological security indicators.
Indicator LayersDescriptions of Indicators
Habitat degradation degreeThe level of habitat degradation degree score indicates the degree of land use type by the degree of coercion of stress factors, and a higher the habitat degradation degree indicates that the land use type is threatened by the higher degree of vulnerability.
Total populationIncrease in total population indirectly affects changes in land-use types while increasing water demand.
GDPGDP growth is usually accompanied by an increase in environmental pollution and demand for water resources, and at the same time, it affects changes in land use types.
Cultivated land areaExpansion of arable land can lead to degradation of grasslands and woodlands, while agricultural water use crowds out ecological water use, causing ecological deterioration.
Amount of agricultural fertilizerAn increase in the amount of agricultural fertilizer means an increase in environmental pollution.
The primary industry proportionAn increase in the proportion of primary industry implies an expansion of agricultural production, which usually affects the type of land use and water demand.
The secondary industry proportionAn increase in the proportion of secondary industry implies an expansion of industrial production, which usually leads to environmental pollution.
Carbon stockAn increase in carbon stock means an increase in the ecosystem carbon sequestration capacity, which can measure the health of ecosystems.
Habitat qualityHabitat quality measures the health and integrity of ecosystems.
East Juyan Sea’s lake surface areaAfter the breakup of the Heihe River, the Juyan Sea gradually dried up, and after the implementation of the water diversion project, the surface area of the lake gradually stabilized, which is used to characterize the health of water resources in the basin.
Aridity indexAridity index describes the impact of rainfall and evapotranspiration on oases in arid zones.
FVCFractional vegetation cover expresses the distribution and density of plants on the surface and has a profound effect on the structure and functioning of ecosystems.
Per capita GDPHigher GDP per capita means local capacity to invest in environmental protection.
The volume of water discharged from Wolf Heart MountainThe amount of water reaching the Wolf Heart Mountain Hydrological Station after the implementation of the water diversion project, which should be used for the ecological restoration of the Ejina Oasis and the maintenance of the surface area of the Juyan Sea.
The inflow of water into East Juyan SeaThe amount of water that reaches the end lake after distribution is used to keep the lake healthy.
The tertiary industry proportionAn increase in the proportion of the tertiary sector means an expansion of the service economy, and the improvement of the ecological environment in the Ejina Oasis attracts tourists to come to see the poplar forests, and the increase in the tourism economy in turn stimulates the protection of the ecological environment.
Table 2. Ejina Oasis’s ecological security index system.
Indicator LayerDirectionalIndicator EntropyIndicator Weights
Habitat degradation degree-0.95580.0500
Total population-0.99820.0020
GDP-0.92860.0807
Cultivated land area-0.94150.0662
Amount of agricultural fertilizer-0.96280.0421
The primary industry proportion-0.97900.0238
The secondary industry proportion-0.88730.1275
Carbon stock+0.91210.0995
Habitat quality+0.95280.0534
East Juyan Sea’s lake surface area+0.98050.0221
Aridity index-0.99810.0022
FVC+0.92870.0806
Per capita GDP+0.90660.1057
The volume of water discharged from Wolf Heart Mountain+0.96280.0420
The inflow of water into East Juyan Sea+0.95930.0461
The tertiary industry proportion+0.86200.1561
Table 3. Ecological security classification criteria.
Ecological Security LevelSecurity IndexDegree of Ecological SecurityCharacterization of the Ecological Security Level.
VESI ≤ 0.2Very unsafeSevere degradation of ecosystem services, inferior resistance to disturbance, poor self-recovery, and ecosystems in a very insecure state.
IV0.2 < ESI ≤ 0.4InsecurityEcological font services are degraded, less resistant to disturbance, less able to recover themselves, and ecosystems are in an insecure state.
III0.4 < ESI ≤ 0.6Critical safetyEcosystems are in a state of critical safety, although they have suffered a certain degree of disruption, but are still within their capacity to recover and withstand a certain degree of disturbance.
II0.6 < ESI ≤ 0.8SaferMinor degradation of ecosystem services, strong resistance to disturbance and self-recovery, and ecosystems in a relatively secure state.
IESI > 0.8Ideal securityEcosystem services are not degraded, are highly resistant to disturbance, do not require self-restoration, and ecosystems are in a state of ideal security.
Table 4. Area of each land use type in Ejina.
Type of Land Use/km2200020102020
Cropland95.65104.74137.33
Grassland909.85805.591318.87
Forest63.8889.5481.99
Oasis (include grassland and forest)1069.38999.871538.19
Wetland41.2953.2933.30
Water44.87254.53125.79
Total water (include wetland and water)86.16307.82159.09
Impervious14.5415.6348.69
Barren12,870.8812,717.6512,294.99
Table 5. Annual expansion rate of various land use types in Ejina.
2000–20102010–20202000–2020
Type of Land UseGrowth/km2Annual Expansion Rate %Growth/km2Annual Expansion Rate %Growth/km2Annual Expansion Rate %
Cropland9.089.5032.6031.1241.6843.57
Grassland−104.26−11.46513.2963.72409.0344.96
Forest25.6640.17−7.55−8.4318.1128.35
Oasis (include grassland and forest)−69.51−6.5538.3253.84468.8143.91
Wetland12.0129.08−20.00−37.52−7.99−19.36
Water209.66467.30−128.74−50.5880.92180.36
Total water (include wetland and water)221.66257.27148.7348.3272.9384.64
Impervious1.097.4833.06211.5234.15234.82
Barren−153.24−1.19−422.66−3.32−575.90−4.47
Disclaimer/Publisher’s Note: The statements, opinions and data contained in all publications are solely those of the individual author(s) and contributor(s) and not of MDPI and/or the editor(s). MDPI and/or the editor(s) disclaim responsibility for any injury to people or property resulting from any ideas, methods, instructions or products referred to in the content.

