Article

Climate Change and Jump Dispersal Drive Invasion of the Rosy Wolfsnail (Euglandina rosea) in the United States

Department of Earth and Planetary Sciences, University of Tennessee, Knoxville, TN 37996, USA
*
Author to whom correspondence should be addressed.
Sustainability 2024, 16(5), 1929; https://doi.org/10.3390/su16051929
Submission received: 9 January 2024 / Revised: 19 February 2024 / Accepted: 22 February 2024 / Published: 27 February 2024
(This article belongs to the Section Air, Climate Change and Sustainability)

Abstract

:
The rosy wolfsnail (Euglandina rosea) is a carnivorous, highly detrimental invader in many parts of the world. Although its negative impact on endemic island mollusk populations has been well documented, little is known about its range expansion in North America, where populations are not constrained by oceanic barriers. In this study, we present three compelling lines of evidence indicating significant ongoing and projected geographic range expansion of E. rosea: (1) We analyze the current range using data from iNaturalist; (2) we report on the demographics and persistence of an isolated extra-limital satellite population in Nashville, Tennessee, since its discovery in 2006; and (3) we employ a predictive ecological model that incorporates environmental variables indicating that the range expansion will continue into the central U.S. well beyond its present range. The findings of this study shed light on the underlying mechanisms behind the invasion of this species. First, the invasion is frequently associated with jump dispersal events, which are often linked to horticultural and landscaping activities. Second, the establishment and proliferation of satellite populations are facilitated by common landscape management practices, such as irrigation, as well as the urban heat island effect (UHI). Third, there is a possible synergistic interplay between the UHI effect and climate change that accelerates the range expansion via global warming.

1. Introduction

Global temperature isotherms are migrating toward both poles at an approximate rate of 27.5 km per decade [1]. These warmer aggregate temperatures have created conditions favorable for many species, leading to the expansion of their geographic range [2]. According to one estimate, the leading edge of terrestrial species’ poleward migration has moved at an average rate of 6.1 km per decade [3], but this is likely to accelerate as the rate of global warming increases. These climate change-driven poleward shifts now play a major role in the ongoing spread of invasive species, documented across many taxa, as temperature barriers to a diversity of thermophilic species are removed [4,5]. The increasing need to predict distributional shifts and their potential impacts has therefore precipitated the use of tools such as ecological niche models (ENMs) to delineate the expansions of species under current and future climate change scenarios.
In this report, the potential range expansion of the predatory invasive snail Euglandina rosea, commonly referred to as the “rosy wolfsnail”, is discussed as a consequence of climate change and jump dispersal. This is a topic of great significance due to the destructive impact of E. rosea, which has become widespread through misguided biological control introductions around the world [6,7]. E. rosea is a voracious predator that mainly feeds on other mollusk species, particularly terrestrial snails [8]. In comparison to most gastropod species, E. rosea is remarkably fast and can rapidly capture its prey once a slime trail has been detected [9]. These traits make E. rosea a uniquely effective predator.
Between the 1950s and 1970s, scientists and policymakers thought E. rosea’s proficiency in hunting combined with their unique diet could make them a valuable biological control agent. In 1936, the giant African land snail (Lissachatina fulica), another invasive species, was introduced to the Hawaiian Islands [10], perhaps from Japan or Taiwan, as a food source [11]. L. fulica soon became established [10], consuming a wide variety of plants, including beans, peas, cucumbers, and melons [12]. Consequently, the Hawaiian Territorial Department of Agriculture (HTDA) launched a widespread campaign to eradicate them [13]. Between 1950 and 1959, HTDA introduced 19 different snail species and 11 different insect species as potential biological control agents [7]. Out of the 30 species that the HTDA introduced, none of them were effective in controlling L. fulica. Importantly, one introduced species, E. rosea, became established on the islands [10,14]. At the same time, similar E. rosea invasions were unfolding elsewhere in the Pacific and Indian Oceans, facilitated by government agencies in French Polynesia, Samoa, Mauritius, and Micronesia [7].
As often happens, the introduction of E. rosea has led to major unintended ecological consequences [15]. Rather than acting as a biological control agent for the giant African snail, E. rosea has become a predator of native snails, many of which were already endangered or threatened [16,17,18]. The Hawaiian Islands are home to a large number of native terrestrial snail species [19], with Cowie [20] estimating 752 species, the majority of which are endemic (99.5%) [21]. E. rosea has had a particularly negative impact on the Oahu tree snails (Achatinella spp.) in Hawaii, resulting in significant declines [14]. This has led to the extinction of several Oahu tree snail species, with others now classified as endangered [18].
Unfortunately, E. rosea populations can now be found in many other parts of the world, often from its introduction as an unsuccessful biological control agent [22,23]. Moreover, there is evidence that E. rosea is expanding its range in the United States, facilitated by modern horticultural practices and climate change [24]. Although the impact of E. rosea on endemic mollusk populations in island environments has been extensively researched by invasion biologists, little is known about the expansion of its native range in North America, where populations have not been intentionally introduced and are not restricted by oceanic barriers.
Previous studies have indicated that E. rosea is native to several states in the southeastern United States, including Alabama, Florida, Georgia, Louisiana, Mississippi, North Carolina, South Carolina, and southeastern Texas [25]. However, since 2006, a persistent population of E. rosea has been observed outside of this assumed range, just south of Nashville, Tennessee [24]. The stability of this population suggests a type of range expansion of E. rosea that may be facilitated by factors such as climate change, the urban heat island effect (UHI), and modern horticultural commerce. Our paper examines this potential range expansion using publicly available data sets provided by the Global Biodiversity Information Facility [26]. Furthermore, we document the persistence of and provide demographic data (abundance, age, size of individuals) of the extra-limital satellite population of E. rosea since its discovery in 2006. Finally, we apply a predictive ecological model that incorporates environmental variables to delineate potential suitable habitats for E. rosea. We predict that E. rosea is expanding its range northward in the United States.

2. Materials and Methods

2.1. Species Presence and Occurrence Records

In the summer of 2006, a Nashville homeowner contacted the Tennessee Department of Environment and Conservation (TDEC) to report the presence of several large unidentified land snails in the yard, apparently introduced with recently installed landscaping materials (plants and mulch). The snails were determined to be E. rosea. The TDEC expected that the population would soon become extirpated by the upcoming winter temperatures, as the population was found much further north than the presumed native range of this relatively thermophilic species. However, the homeowner continued to observe these snails each year from 2006 to 2009. In 2009 and 2010, the area experienced a relatively cold winter where temperatures dropped to −13 and −15 degrees Celsius, respectively, and no live snails were observed thereafter. It was then inferred that the population had indeed become extirpated. However, in 2014, following a relatively warm winter where temperatures remained above −9 degrees Celsius, another live snail was found. The homeowner reported that no foreign landscaping materials had been installed on his or any adjoining property in that timeframe, which suggests that this population was able to tolerate several years of colder minimum temperatures.
In 2015, the junior author (MLM) was contacted by the TDEC to conduct more thorough and systematic surveys of the area. These investigations were conducted at the homeowner’s residence, in the Hill Place neighborhood, located in southwest Nashville. Properties in this neighborhood have expansive yards and well-maintained landscaping features. This property is characterized by mature oak trees that shade the entire backyard, short ornamental shrubs, full-shade groundcover (e.g., English ivy), and fescue grass. Much of the vegetation on this property is not endemic. It requires more water than vegetation native to central Tennessee. A permanent irrigation system provides water to the vegetation and maintains a high level of humidity throughout the year. There are few physical barriers such as privacy fences, roads, or waterways.
Two surveys of the homeowner’s yard and adjacent yards, were carried out in April 2015 and September 2015. These two surveys were extensive, lasting 30 person-hours and 14 person-hours, respectively, using methods described in Irwin et al. (2016). These surveys found no living E. rosea but did find 25 shells of individuals dead for some time, indicated by the absence of fresh tissue. The presence of juvenile shells among the dead implied that reproduction may have occurred. As the exhaustive surveys turned up no live individuals on the property or surrounding properties, it was concluded that the population may have become extirpated after 2013, possibly due to two exceptionally cold winters in 2014 and 2015 [24]. However, in March 2022, nine years after the last live sighting, the same Nashville homeowner discovered a single adult living specimen of E. rosea. This prompted two more additional surveys. These were conducted in April 2022 and November 2022 to observe and collect any additional living or dead E. rosea individuals.

Local Species Data Collection and Recording

In April 2022, the Nashville property, covering more than 13,000 square feet, was searched for 2.5 h by five people. Thus, the total search effort was 12.5 person-hours. In November 2022, the search was carried out by 6 people for 2.5 h for a total of 15 person-hours. In both cases, we searched the entire area for living or dead E. rosea. In addition to the large yard, smaller microhabitats were searched, which included the vertical exterior walls of the home, trees up to head height, under loose mulch, inside potted vegetation, and underneath leaves of vegetation. We also searched adjacent nearby yards that immediately surrounded the homeowner’s property.
Observed E. rosea were collected and placed in individual containers for transportation and observation. The location and microhabitat of the collection site were recorded. Using digital calipers, the shells of all collected E. rosea were measured for length to the nearest 0.01 mm at the longest point of the central axis. To examine population data in the context of temperature changes, monthly temperature data for 2000–2022 for this area were collected from the NOAA Centers for Environmental Information [27].

2.2. Species Presence in the Contiguous United States

2.2.1. Collecting North American Data on E. rosea

We utilized GBIF to assess the current distribution of E. rosea in the United States. In total, 1879 E. rosea occurrence records were downloaded for use in this study [26]. GBIF is an international organization that aims to make biodiversity data easily available and accessible. It is a network of organizations that collect and share data on species distribution, abundance, and other characteristics [28]. These data were processed and included mostly research-grade observations obtained from iNaturalist [29]. Such research-grade observations are those where a species identification has been reviewed; the community is in agreement; the upload contains valid data, the location, and a photograph; and the subject is not a captive/cultivated organism [30]. Unlike other terrestrial snails, E. rosea can usually be accurately identified due to their large size and distinct morphology. This study was interested in the current endemic range of E. rosea in the contiguous United States and potential range expansion due to predicted climate change scenarios. Historical and other curated archival records made up a negligible portion (less than 0.1%) of total downloaded records. These records were checked for accuracy and quality and were considered reliable observations in the large majority of cases [31].
Current and projected climate data were acquired from the AdaptWest Project (adaptwest.databasin.org) [32], comprising 33 parameters evaluated for their relevance in predicting E. rosea presence on 11 November 2023 (Table 1). Our ecological niche model utilized an ensembled mean of 13 projected climate simulations, CMIP6 AOGCMs SSP3-7.0, where human influence on climate is moderate [33]. This dataset used a predicted emissions scenario that is considered “middle of the road” [33]. Climate data were downloaded at a 1 km resolution and covered the period from 2000 to 2040 in two 20-year increments [33].

2.2.2. Data Processing

To clean and process our E. rosea occurrence records, we first eliminated all duplicate records. These were records where the latitude and longitude of the record were identical. Next, we plotted all points in ArcGIS Pro (version 3.0.2), investigated suspicious records by searching those locations on iNaturalist, and removed any points that were deemed unreliable. Records deemed unreliable were those that were misidentified or originally observed at commercial garden retailers. We assumed that E. rosea records observed at commercial garden retailers were likely hitchhikers. In total, only three occurrence outliers were removed due to unreliability. To ensure consistency in spatial accuracy, we then removed all data points with coordinate specificity greater than 1000 m [34]. The recorded coordinates of a data point may not necessarily correspond to its exact collection location due to differences in specificity levels. Lastly, our data were spatially thinned to mitigate observation bias and account for overrepresentation in areas of high human population. Occurrence records were thinned to 10 km where no two observations could be reported withing the same area [35]. After these steps had been implemented, 574 occurrence records remained for use in our ecological niche model.
All bioclimatic layers were processed in ArcGIS Pro (version 3.0.2) and R (version 4.3.2). Bioclimatic layers were projected in ArcGIS Pro to ensure that the spatial resolution and map extent were identical for all environmental variables. The layers were exported as ASCII (.asc) files with 1 km resolution and a map extent that included all of North America for additional processing in R. All 33 bioclimatic layers were analyzed for their relatedness using the R package “ENMeval”, and a correlation matrix was generated using the function “raster.cor.matrix” [36,37]. For example, the bioclimatic variable “mean annual precipitation” (MAP) had a high positive correlation of 0.969 with the bioclimatic variable “mean autumn precipitation” (PPT_at). The results of the matrix analysis enabled the determination of variables that could be disregarded due to their contribution of predominantly redundant data to the model, posing a risk of overfitting. Bioclimatic variables with a correlation index greater than ±0.4 were not considered for our final niche model. In total, four bioclimatic variables remained after evaluation: winter mean temperature (December–February), summer mean temperature (June–August), winter precipitation (December–February), and summer precipitation (June–August). These remaining variables were deemed most suitable, as many other bioclimatic layers depended on various combinations of other variables and were highly inter-correlated (i.e., yearly precipitation and precipitation in wettest quarter), as noted by Root [38]. We asked the model to perform a “jackknife” assessment of the variables to determine variable importance. The variable “mean summer temperature” was removed from the model because it made a less than 2% contribution to the model.

2.2.3. Model Calibration

We employed the maximum entropy approach to perform ecological niche modeling (ENM) using MaxEnt 3.4.4 (https://github.com/mrmaxent/Maxent, accessed on 12 November 2023) [39,40,41]. MaxEnt is a modeling algorithm that estimates the likelihood of a species’ presence based on observed values within a raster. This algorithm calculates the probability and assigns each point a value representing the highest and lowest likelihood of species presence. MaxEnt then extrapolates from areas with similar conditions in the study region using those calculations. We developed a correlative niche model that related environmental conditions with 574 E. rosea presence records. To optimize the model’s complexity and predictive power, we employed the function “ENMevaluate” in the R package “ENMeval”, which implemented MaxEnt across a range of settings and provided evaluation metrics to assist in selecting settings that balance model fit and predictive ability [37]. The final model selected had a combination of regularization multiplier and bioclimatic variables that had the lowest omission rate and Akaike information criterion (AIC). Our final model used the following features for parameterization: linear, quadratic, product, and hinge (LPQH).
To generate the final model for E. rosea in current and future climate scenarios, we used the following settings. The number of iterations was set to the default (500), the number of background points was set to 10,000, the replicate run type was set to “crossvalidate”, the output type was set to “logistic”, and the feature selected was LQPH. The model was replicated 10 times for each run. Variable importance was measured using the “jackknife” test to determine dominant climatic factors. We employed a regularization multiplier of 1. By selecting “random seed”, a different random background sample was used for validating the model with each iteration. Each procedure was carried out with no clamping, and the “10-percentile training presence” rule was applied [42] to transform each map into binary. The resulting ENM for E. rosea was projected in ArcGIS. A step-by-step detailed description of our ecological niche modeling process and correlation matrix is available in the Supplementary Materials.

2.2.4. Model Validation

We assessed the optimization of the model by examining the area under the receiver operating characteristic curve (AUC) and Boyce index [43,44]. The AUC evaluates a model’s ability to correctly rank a random background point and a random presence point, with values ranging from 0.0 to 1.0. An ideal model would have an AUC of 1.0, but relying solely on this measure is problematic because the overall extent of model application significantly impacts well-predicted absences and AUC scores [44,45]. The Boyce index compares the predicted and expected number of occupied sites based on habitat suitability. Boyce index values range from −1 to 1, where positive values indicate a model consistent with the presence distribution, values near zero suggest predictions close to random, and negative values indicate predictions contrary to presence distributions [43]. Additionally, Boyce indices generate predicted-to-expected ratio curves, offering further insights into the model’s quality, including robustness, habitat suitability resolution, and deviation from randomness [46].

3. Results

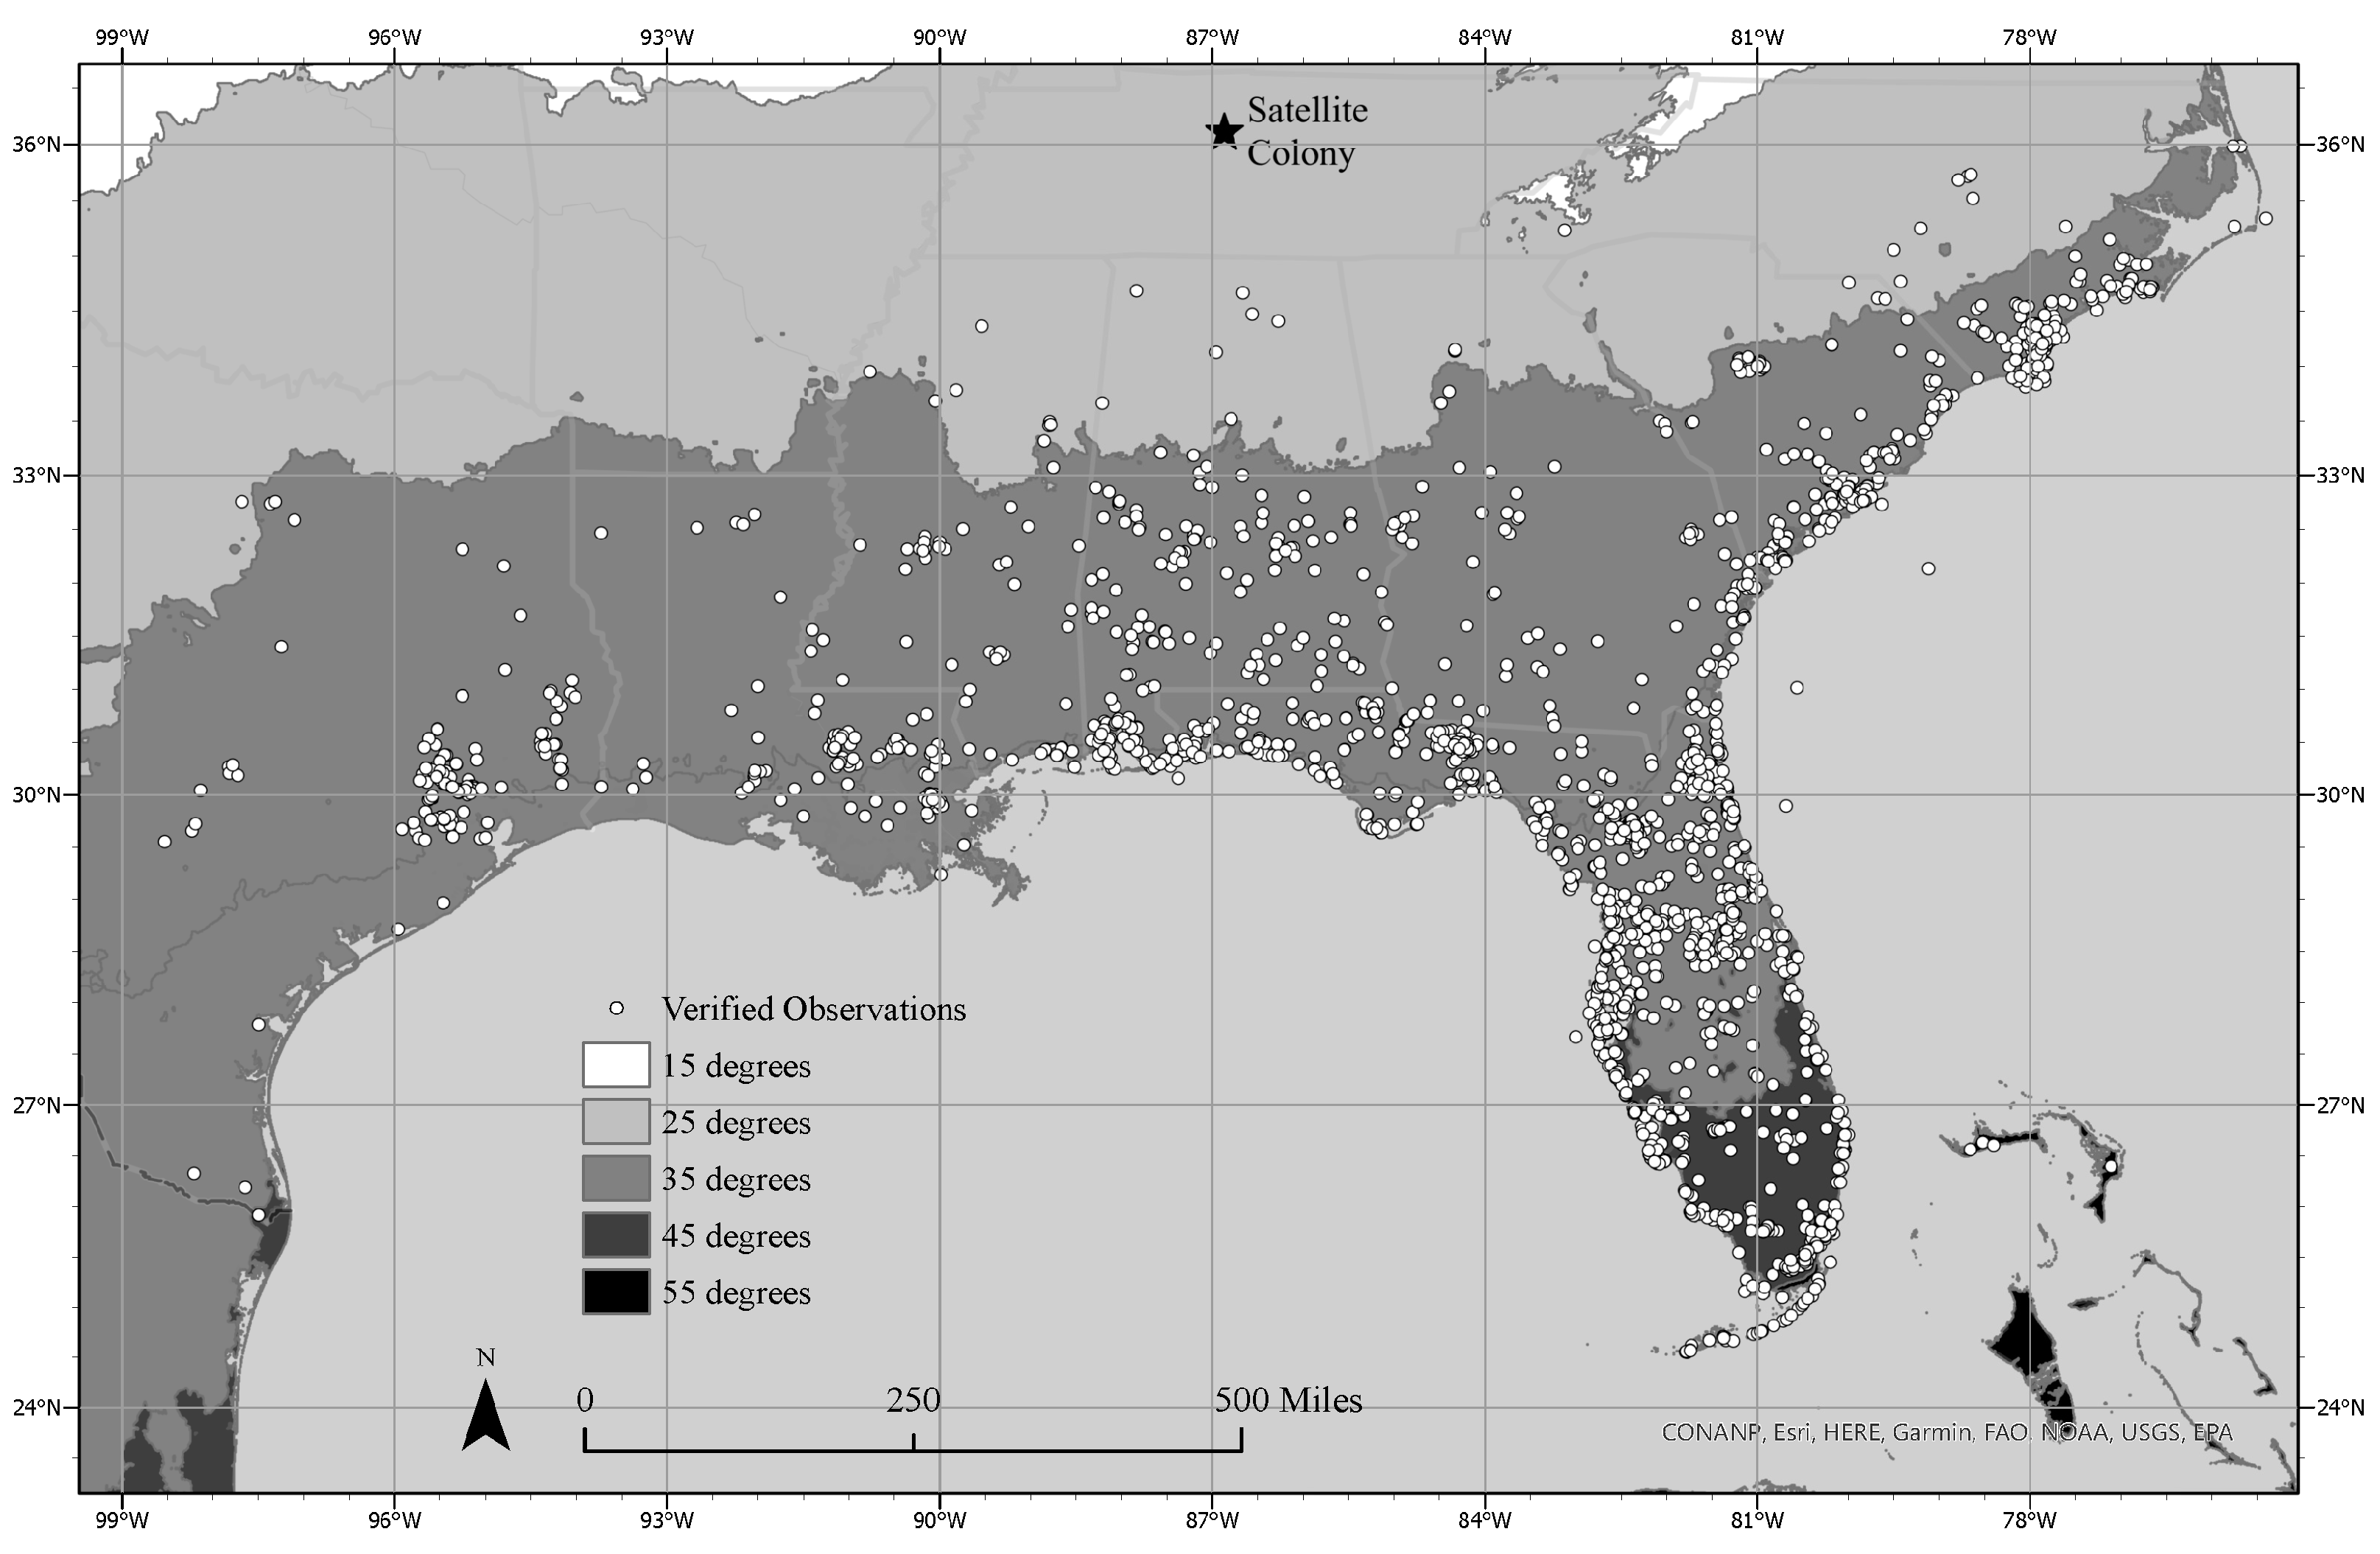
3.1. Current Geographical Range

The current geographical range of E. rosea is primarily the Southeastern United States (Figure 1). In areas where the average minimum temperature of the coldest month is less than 25 degrees, instances of E. rosea observations are sparser. Our satellite colony discovered in 2006 is both the farthest reproducing population from the coast and the only recorded reproducing population north of the 36th parallel. It is also approximately 125 miles from the next nearest E. rosea observation (Figure 1).

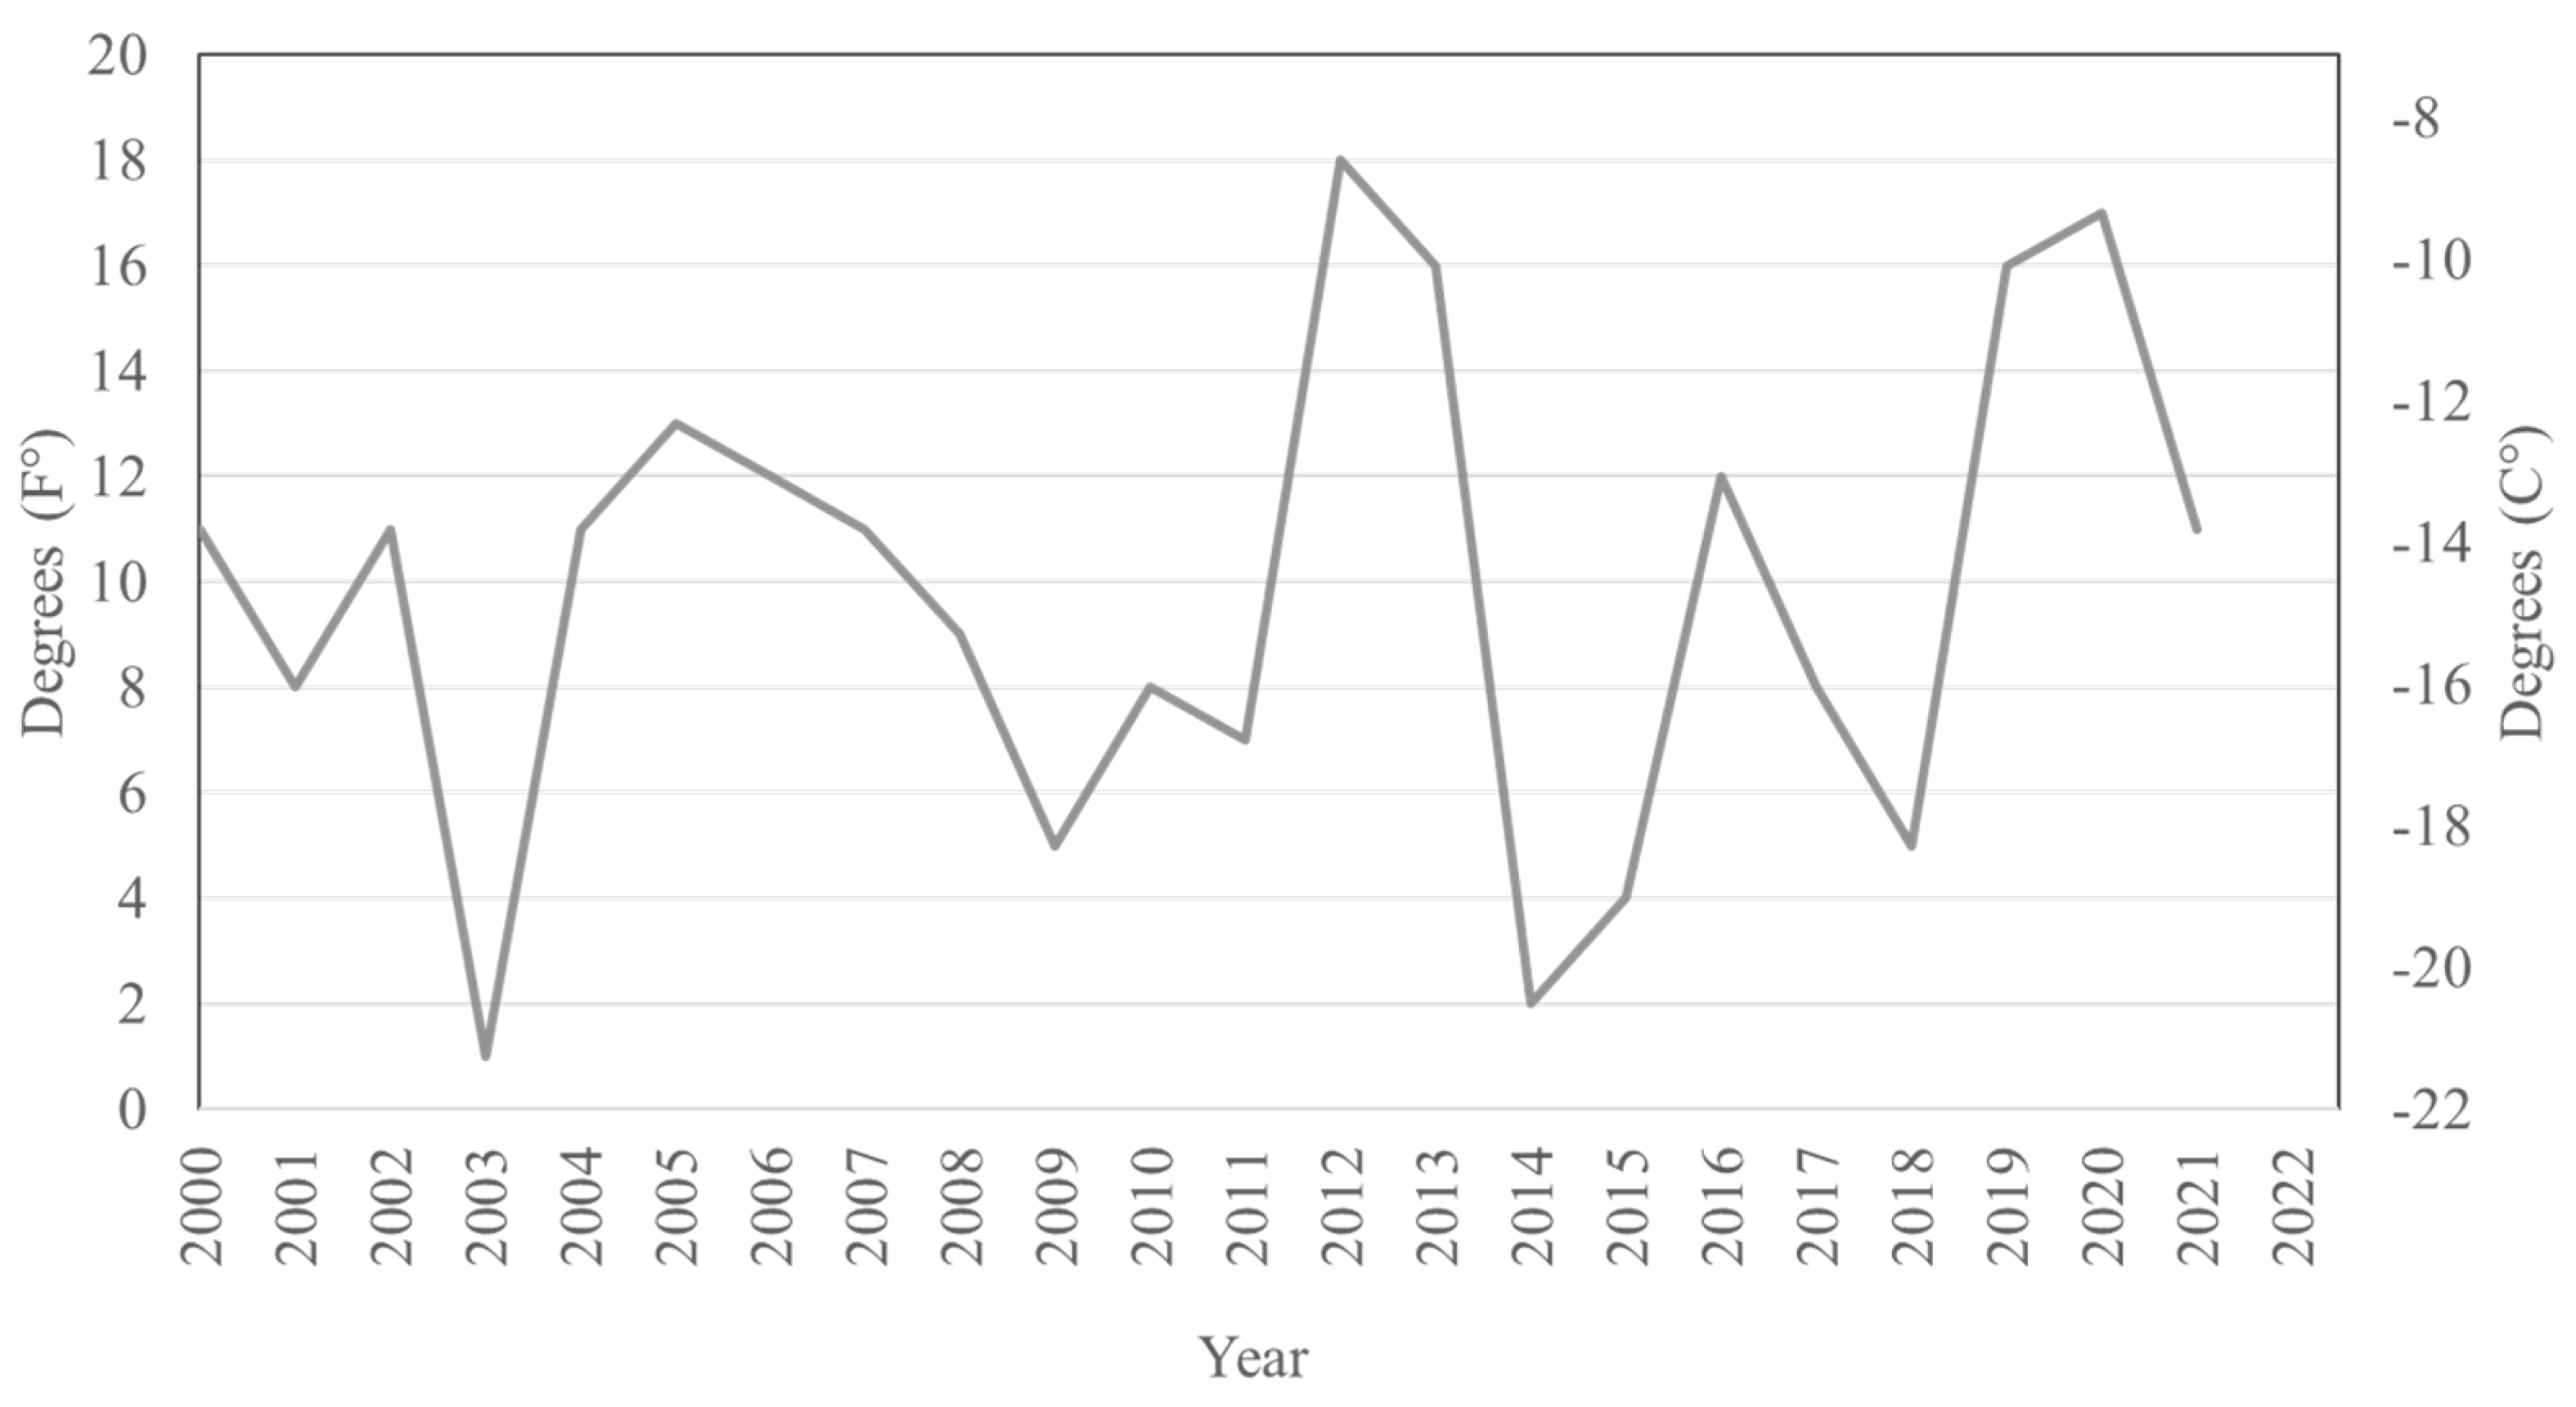
3.2. Satellite Population Persistence

Based on our surveys, a self-sustaining reproducing E. rosea population has been observed in Nashville, TN, periodically since 2006, when it was first discovered [24]. It was assumed that the population had been extirpated in winter 2011 and 2014, because no individual specimens were sighted for one or more years due to freezing winter temperatures, which are not suitable for E. rosea survival. In 2014, for example, the local minimum temperature fell to 2 °F (−17 °C) [27]. However, our investigation shows that this population has indeed persisted despite these inhospitable conditions. Specifically, 9 years after the last sighting, on 24 April 2022, two additional adult E. rosea specimens were captured in the yard of the Nashville residence and placed in separate artificial habitats for observation. These specimens measured 44.86 mm and 48.82 mm. This suggests that these individuals were more than 460 days old, according to growth tables produced by Gerlach [9], and they had likely survived two winters prior to collection (Table 2). Furthermore, both of the individuals were sexually mature and produced viable eggs in captivity approximately 21 days after capture, suggesting a fertilization event had occurred prior to our investigation. These two specimens produced a total of 45 offspring.
In November 2022, one more small, live E. rosea individual was captured in the yard of the same Nashville, Tennessee, residence. Importantly, this specimen was small at 14.99 mm in length. It was estimated to be a juvenile between 100 and 150 days old [9], indicating that a recent reproductive event had occurred sometime in early 2022. This is a significant finding because it implies that the satellite colony in Nashville, Tennessee, is stable and able to reproduce.
We note that observations of E. rosea tend to occur after periods of warm winters where the temperature does not measure below 11 °F (−12 °C) for an extended period. To date, no studies have investigated the behavior and survival of E. rosea at their thermal limits. Observations become less frequent after periods where the temperature measures below 5 °F (−15 °C) (Figure 2). This may be due to a reduced population size and, therefore, less opportunity for observation during colder years. Because we observed a reemergence of E. rosea even after long periods of absence, we infer that some of the population may be overwintering in smaller microhabitats where they are able to endure temperatures in regions that are below their documented tolerance levels. This is feasible due to their avoidance of direct exposure to these colder temperatures. In residential areas, potential warm microhabitats might include areas adjacent to houses emitting heat or well-insulated sites, like beneath logs, within stacks of wood, or in underground burrows. It may be possible that some of the population can withstand these temperatures and remain in aestivation until conditions become more suitable.

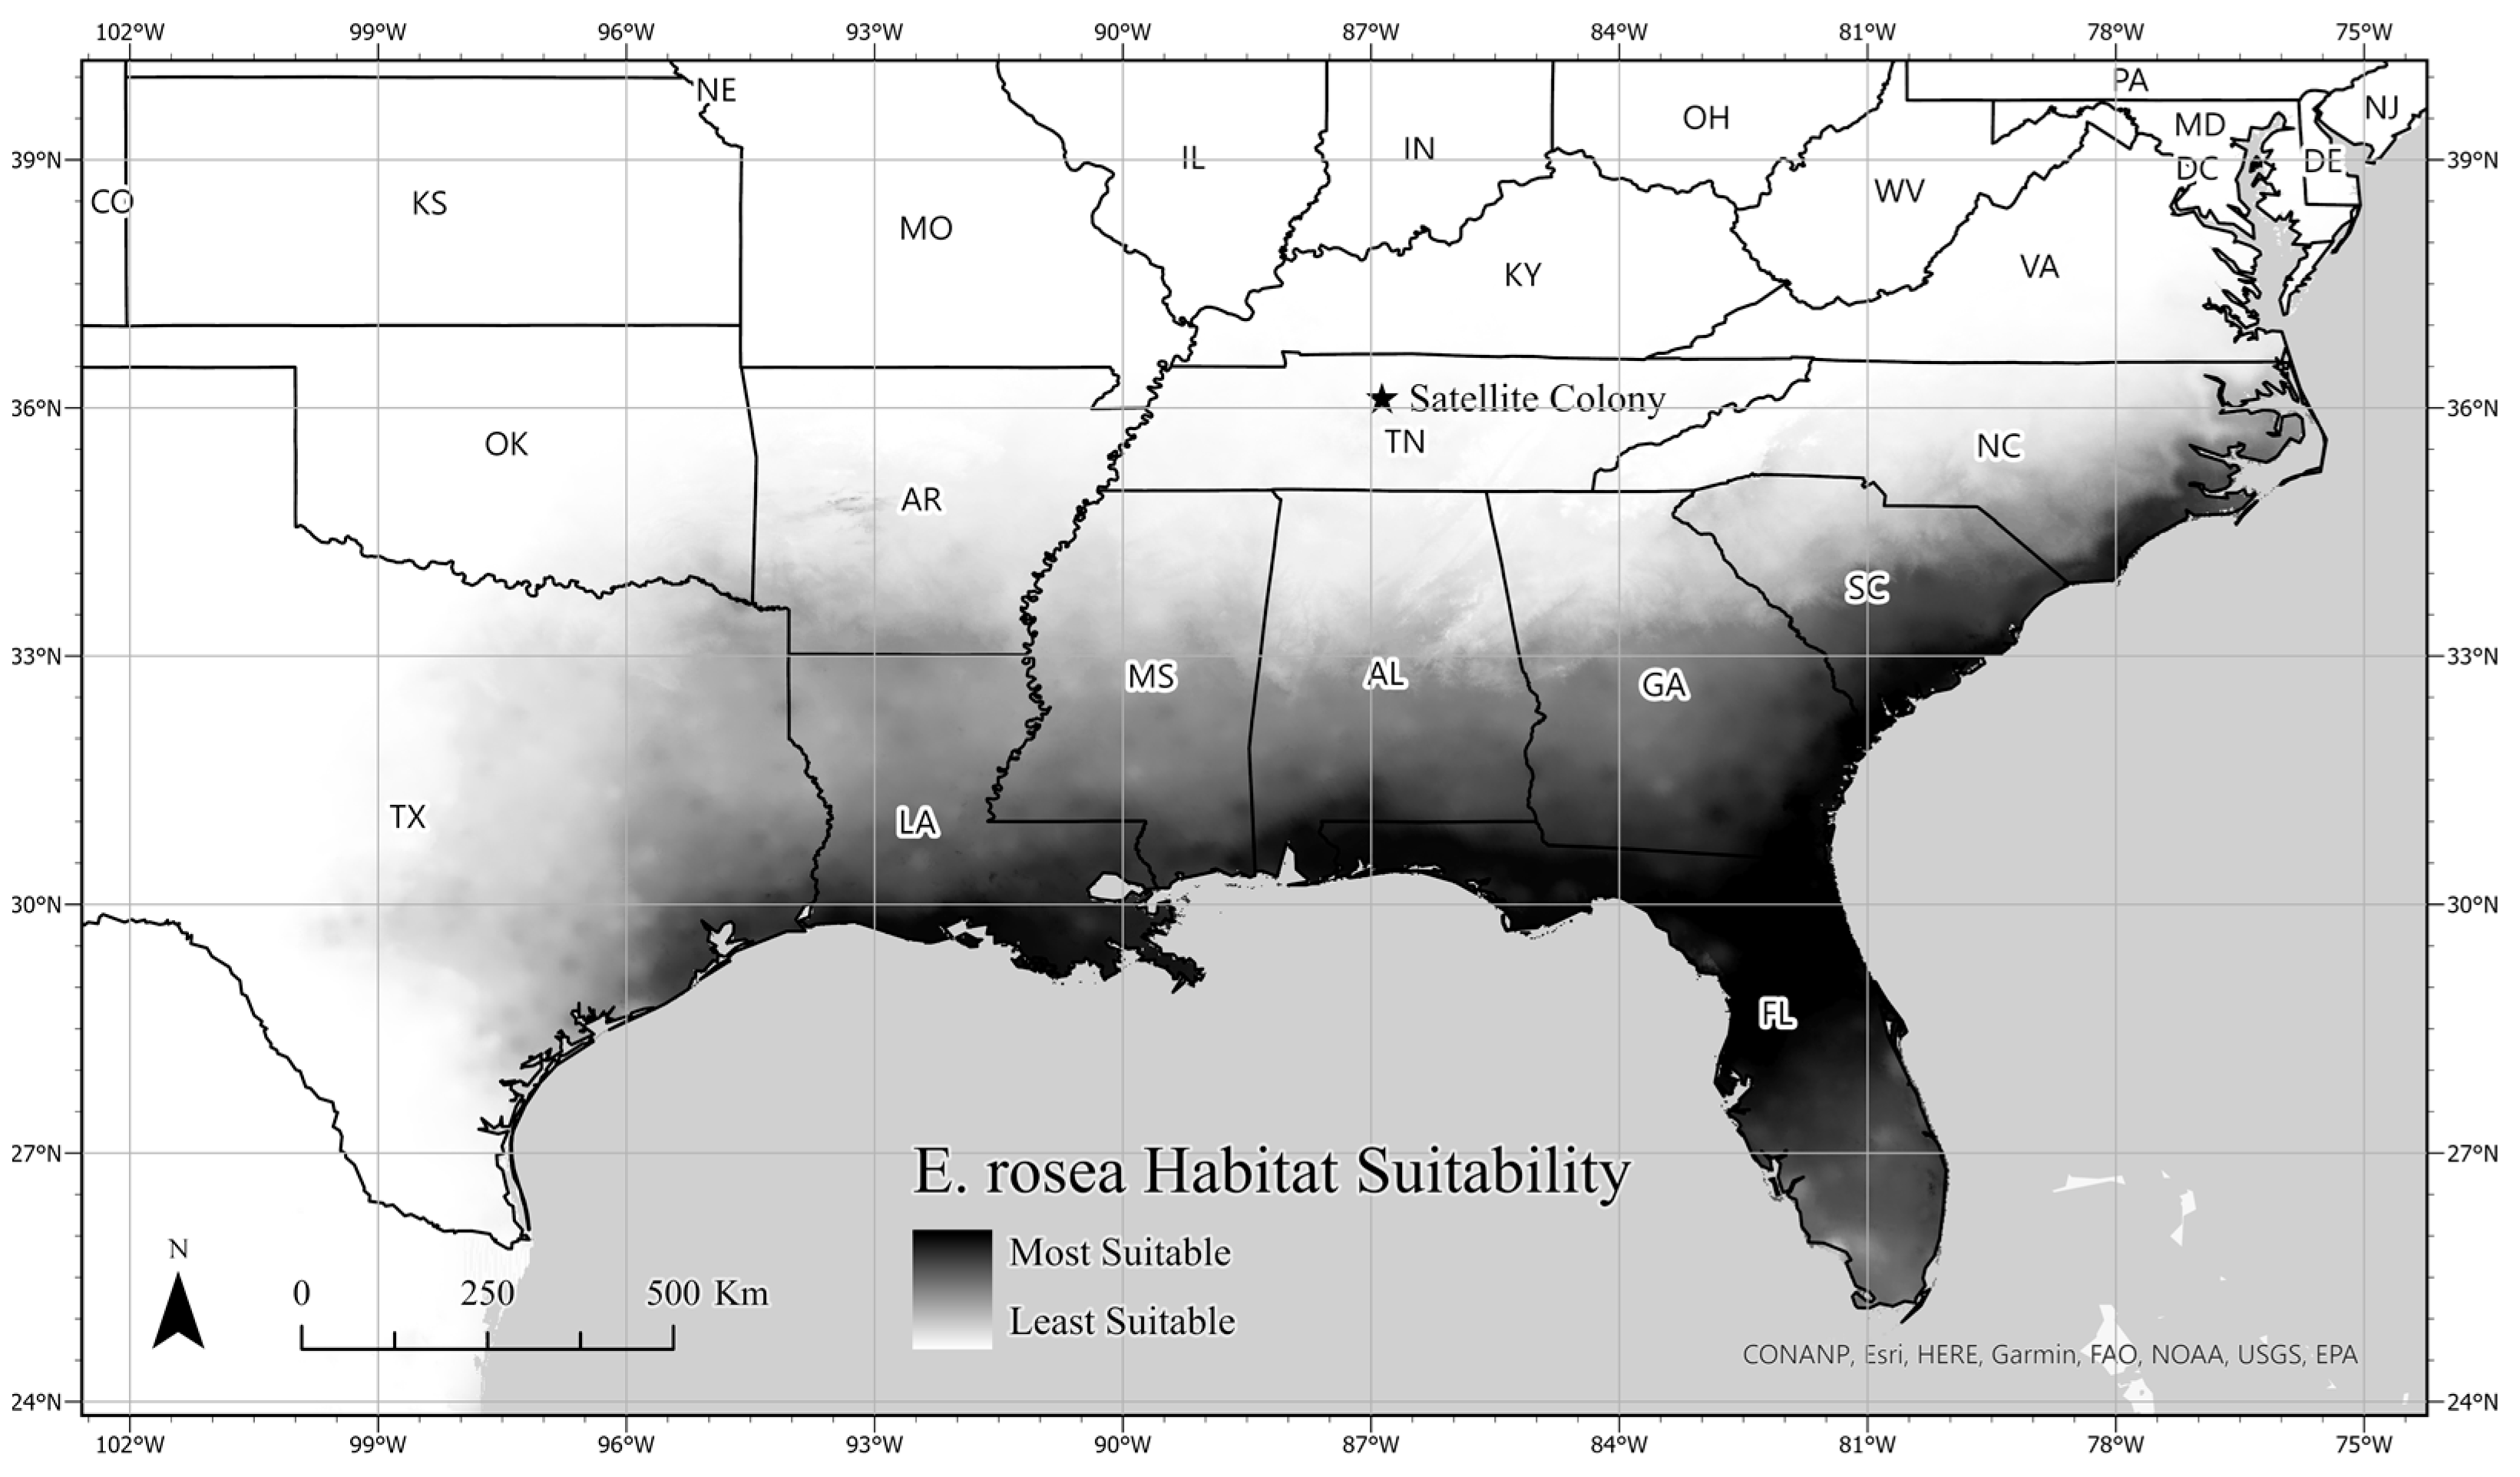
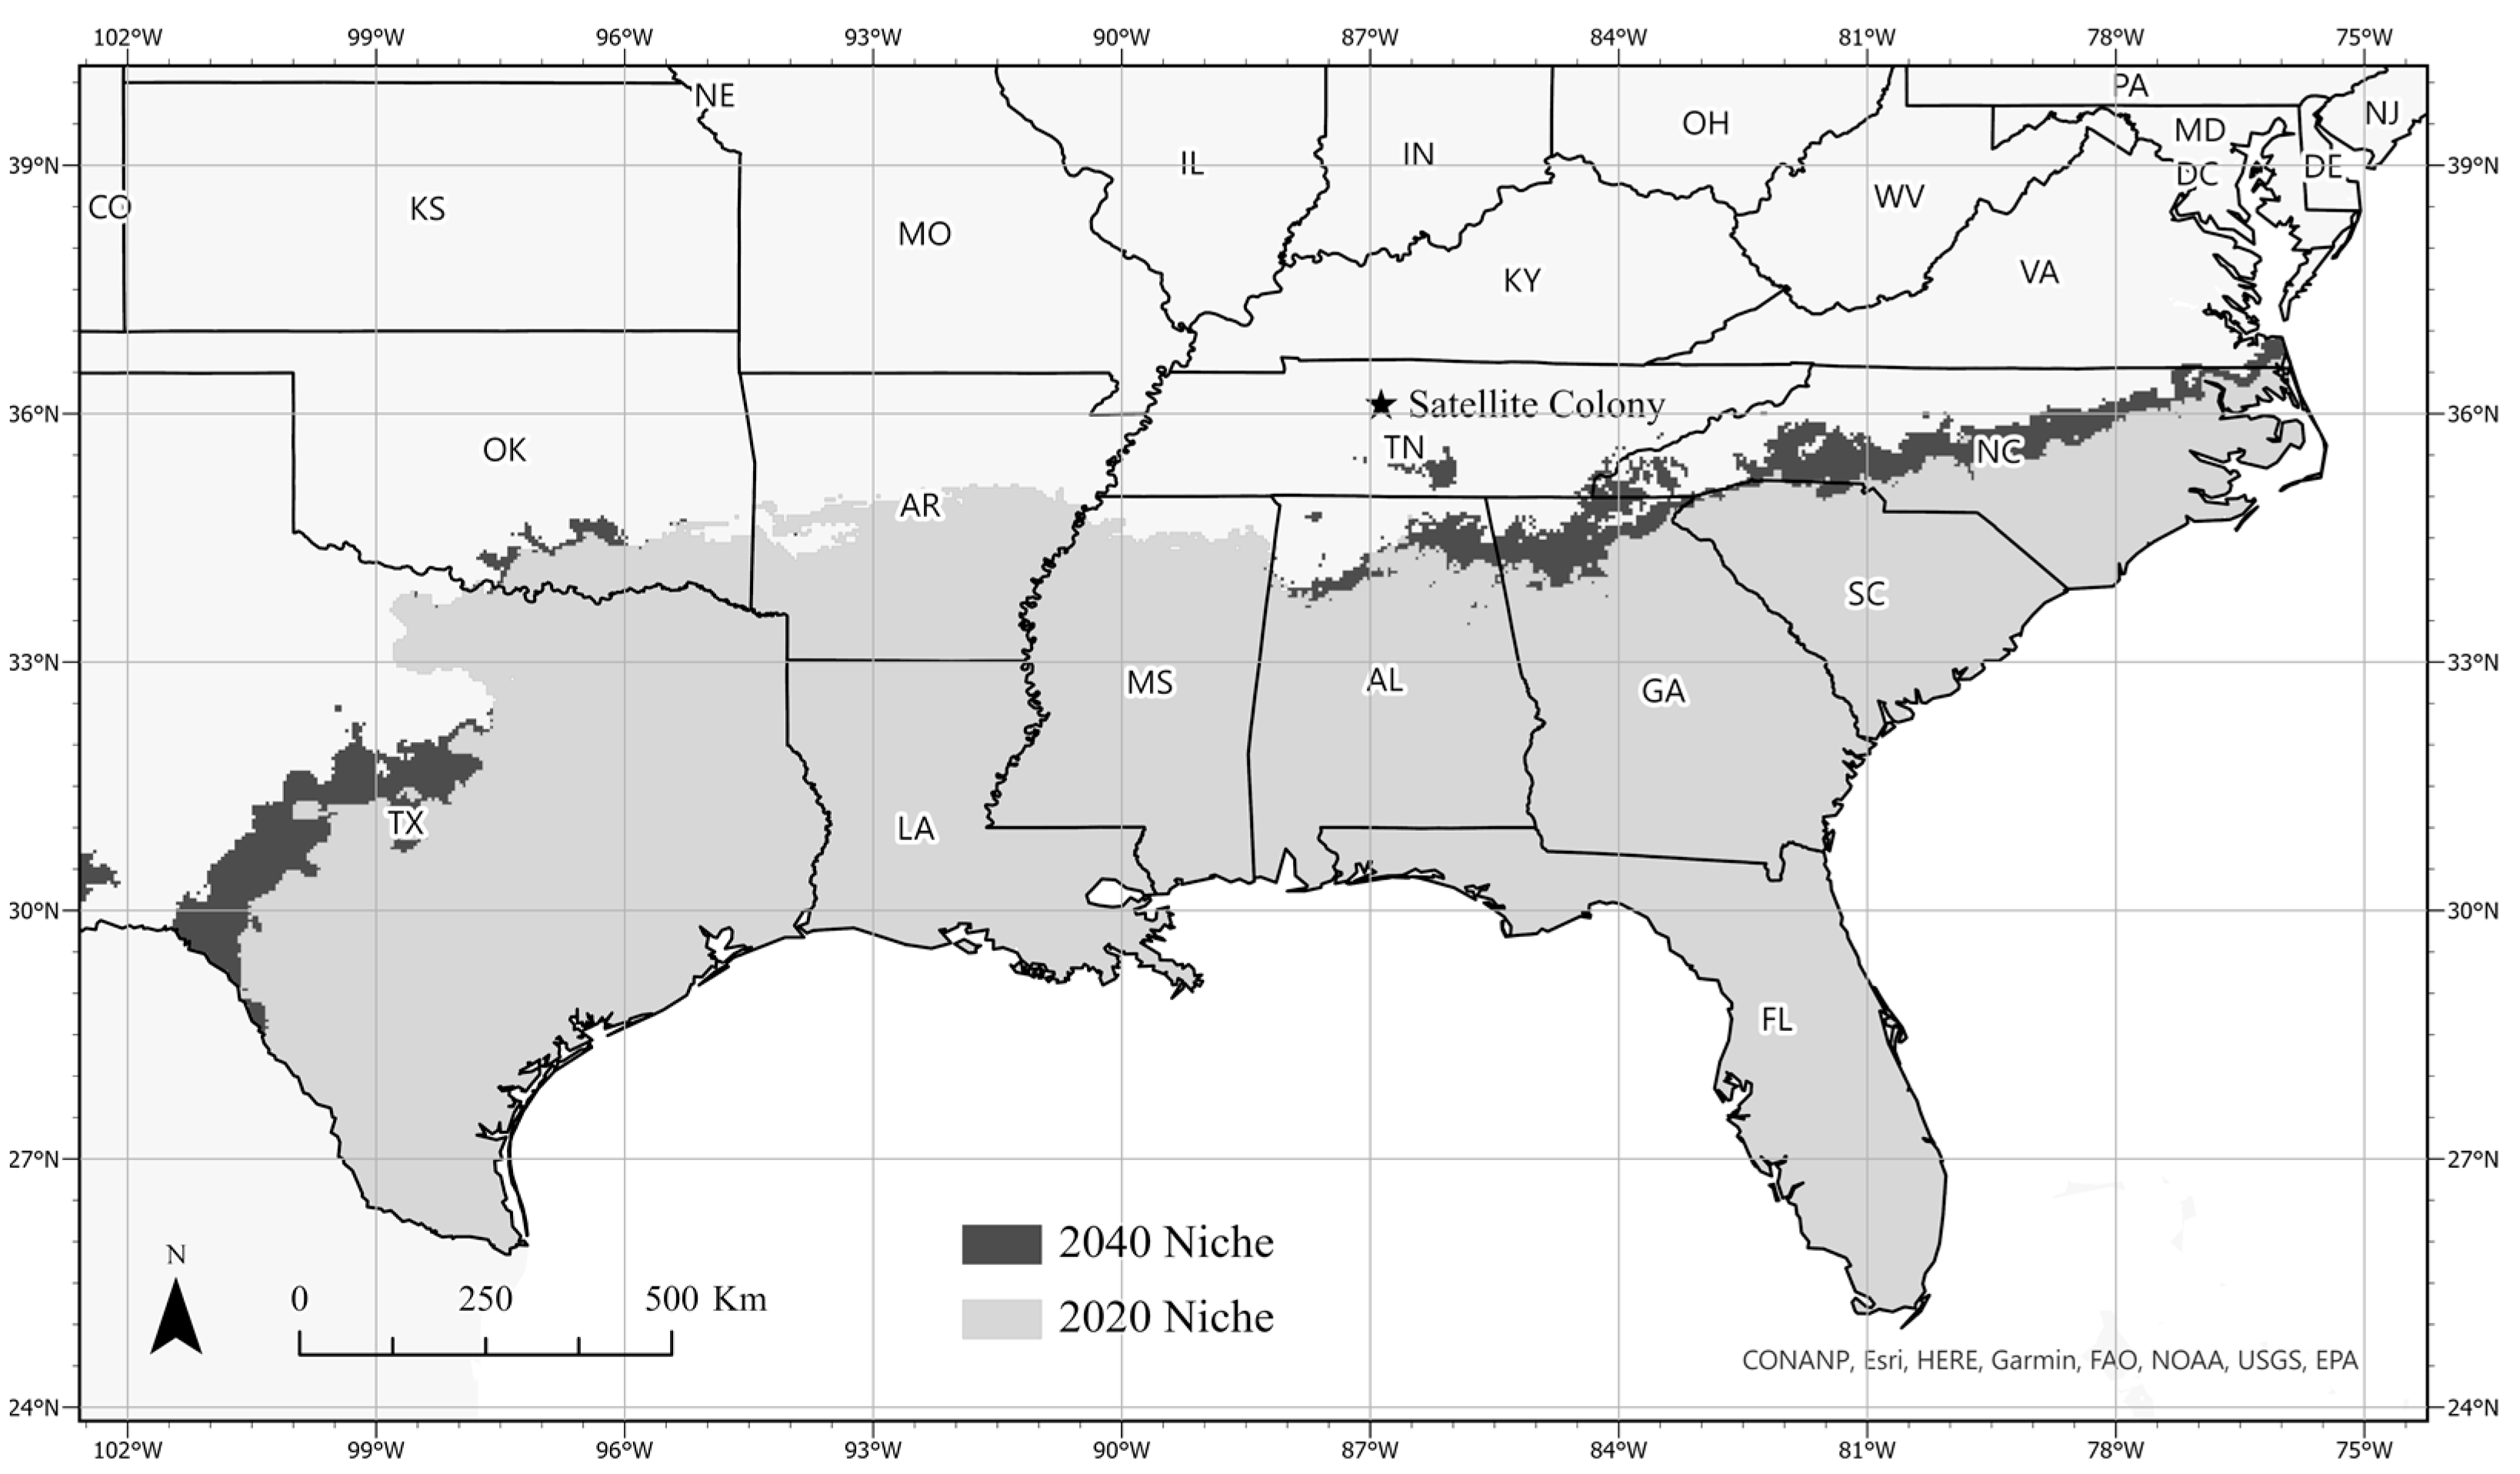
3.3. Ecological Niche Modeling

MaxEnt generated two geostatistical maps that predicted the suitable habitat and niche for E. rosea. At 25% training presence, the training omission rate was 0.098 and the test omission rate was 0.105. The average test AUC for the replicate runs was 0.924, and the standard deviation was 0.008. The Boyce index value was 0.949. The omission rate, AUC, and Boyce index values all indicate that our model is calibrated well and should be considered reliable for predicting the niche of E. rosea. The continuous habitat suitability map suggests that E. rosea are more likely to be found in coastal regions and areas where there are regular precipitation events and warmer temperatures (Figure 3). The binary map indicates areas that are suitable for E. rosea and describes this species’ predicted niche with a 10% threshold (Figure 4). MaxEnt determined that the mean winter temperature had the greatest contribution to the model, with a 49.0% contribution. Precipitation in winter and precipitation in summer were the next largest contributors to the model, with 26.1% and 25.0%, respectively (Table 3).

4. Discussion

An invasive species is considered established if it has a self-sustaining population that is reproducing and spreading in a new ecosystem [47,48]. Our results indicate that the colony population in Nashville, Tennessee, has indeed been successfully established for at least 16 years. Our results also imply some insights into the mechanism of persistence: The apparent hatching of larger numbers of this species after warming temperatures indicates an ability to survive colder temperatures until more ideal temperatures occur. This ability is documented for a few species of land gastropods. For example, the land snail Helix aspersa is cold tolerant during periods of hibernation, including even some ice formation on its body [49]. Aside from hibernation, some land gastropods have relatively cold-tolerant eggs. For example, the slug Arion lusitanicus has very cold-tolerant eggs that survive subzero temperatures [50]. We know of no studies on E. rosea that indicate exactly which developmental adaptations are promoting survival of this species during colder temperatures. Thus, this is an interesting topic for future study.
Our most recent sampling events also indicate that this satellite population continues to reproduce. The E. rosea specimens captured in our most recent 2022 collection found two adults that laid viable eggs 21 days after capture and one additional juvenile. E. rosea have a gestation period of about 30 days from fertilization to the laying of the first egg [9]. E. rosea are cross-fertilizing hermaphrodites, with both male and female reproductive organs, but they require a partner for sexual reproduction [25]. These animals typically lay between 25 and 40 eggs a year. The two adult specimens that were captured in 2022 laid 27 and 25 viable eggs. Because the two adult specimens were separated after collection, we estimate that a fertilization event occurred approximately one week prior to our 2022 sampling event.
Our results also indicate a strong likelihood that E. rosea has significant potential for continued geographic spread. However, the region where our satellite population has become established does not appear to be one of them. We suspect that this unique satellite population in Nashville, TN, will not persist indefinitely without anthropogenic influence. Human interventions such as supplemental irrigation during dryer seasons and poor home insulation may be artificially sustaining this satellite population. However, there are several regions where our model indicated that the habitat and environmental conditions are suitable for E. rosea outside of its current realized niche. Specifically, it seems likely that expansion will occur beyond its current range in the next two decades, which is centered on southern and coastal states of the U.S. (Figure 1), and will begin to penetrate more deeply into Texas, Alabama, Georgia, and Virginia, as well as isolated regions in central Tennessee (Figure 3 and Figure 4).
Regarding mechanisms of spread, there are several ways that alien species can disperse and spread to new areas. Natural dispersal occurs when an organism can spread on its own by means of its own locomotion or through natural processes such as wind, water, or being carried by other animal vectors [51,52]. Human-mediated dispersal occurs when humans intentionally or unintentionally transport organisms to new areas, such as through the movement of goods, ships, or vehicles [53]. Dispersal can also be facilitated through climate change, where changes in the environment, such as rising temperatures or changes in precipitation patterns, allow organisms to colonize new areas [54].
In the case of the wolfsnail, we suspect that the introduction of E. rosea in Nashville was a human-mediated dispersal event caused by a “hitchhiker” on mulch or plants purchased for the homeowner’s garden in conjunction with climate change. Here, we use “hitchhiker” to define organisms that are dispersed by unintended anthropogenic pathways [55]. This is a common way that invasive species are distributed to new habitats [47,48]. For land snails, it is well documented that horticultural and landscaping activities are a major mechanism of non-native species introductions [56]. This was especially apparent when we identified the three outliers in our occurrence records that were observed in commercial garden retailers. One was located in Lancaster, Ohio; another in Florence, Kentucky; and the third in St. Louis, Missouri. All three of these E. rosea specimens were likely hitchhikers.
In the U.S., the extent, scale, and volume of such introductions must be enormous given the quantity of landscaping materials purchased in both commercial and non-commercial quantities at large home supply distribution centers across the United States [57]. Following such long-distance “jump” dispersal events via home supply distribution centers in cities in many parts of the U.S., these nonnative snails often survive and become established, as is well documented by Bergey and Figueroa [58] in residential yards. Because residential and other urban green space habitats are generally moist, nutrient-rich, and generally hospitable to land snails [58], this can lead to the establishment of isolated satellite populations of nonnative snails that are far removed from the source or other populations. Once established in residential and other urban green space habitats, these nonnative snails can spread on their own. A long-term study in 2019 by Bergey [59] showed that the invasive common garden snail, Cornu aspersum, spread across 16 residential yards (up to 110 m) in Norman, Oklahoma, over a period of 6 years, moving outward in a generally diffusive pattern.
A critical observation about this satellite population is that there are very likely many more nonnative land snail populations in residential areas throughout the U.S. that are undetected. The homeowner in this study who found the reported population is a physician who has a strong avocational interest in invertebrates, and it is very likely that the average homeowner would not have noticed the unusual nature of this snail and contacted the TDEC. In general, land snails are greatly understudied relative to many other groups. This is exemplified by a recent inventory of land snails of Knox County, Tennessee: Of the 151 species found in Knox County, nearly half (70 species) had never been reported in the county and 15 of those had never been recorded in the entire state. Most importantly, 11 of these 15 unreported state species were nonnatives [60]. Most of these nonnatives were found in urban habitats, and many were found in vegetation adjacent to plant nurseries and landscaping businesses [60], as predicted by previous studies [56].
Our findings may also be relevant to the urban heat island (UHI) effect, which allows for the establishment of populations outside their normal temperature range [61]. The UHI occurs because the temperature in urban areas is higher than the temperature in surrounding rural areas, which is caused by heat-absorbing surfaces such as buildings, roads, and other infrastructure [62]. This produces higher temperatures, particularly during the summer months [63], and promotes the establishment of invasive species that could not otherwise survive at higher latitudes [64]. As a result, invasive species in cities are now experiencing temperatures not predicted to occur for another 50–100 years in outlying non-urban areas [64]. In this case, the long distance and isolation of the established satellite Nashville population from the general distribution of known wolfsnail observations (Figure 1) may be attributed to the higher temperatures of the UHI in the suburban environment, which is located near a heavily commercialized part of Nashville. This is reflected in our ecological niche modeling of E. rosea (Figure 4), which indicates that areas within the Cumberland Plateau in Tennessee are not suitable habitats for this snail species. However, pockets of isolated populations may persist within anthropogenic microhabitats caused by human land management behaviors [62].
The importance of satellite populations in invasive species range expansions has been noted elsewhere, such as in the well-documented cane toad invasion of Australia. In this case, they are expanding not only as a continuous front but also by human translocation of a few individuals far from this front, creating isolated satellite populations [65]. The practical application of this observation is that finding and eradicating such satellite populations are essential to mitigating the invasion process [65].
In summary, our results indicate the persistence of a satellite population of E. rosea outside of its range. We also provide insights into the specific processes driving this ecologically impactful invasion. One, it is often characterized by jump dispersal events typically related to horticultural and landscaping activities. Two, establishment (persistence) and expansion of these satellite populations are aided by landscape management practices including irrigation and possibly the urban heat island effect (UHI). Three, there may be a synergistic interaction between climate change (global warming) and the UHI effect whereby the latter accelerates isothermal range expansion by allowing “sleeper” populations to persist outside their normal isothermal limits in the cooler nonurban countryside where specific niche requirements are met [64]. This is not to say that climate change inevitably leads to range expansion throughout the geographic range of an invasive species. For example, warming-induced sea-level rise will soon be removing large areas of coastal E. rosea habitat as it is covered by ocean waters [66].

5. Conclusions

This study sheds light on the successful establishment and persistence of a satellite population of E. rosea outside its native range in Nashville, Tennessee. The evidence presented indicates that this invasive species has been reproducing for at least 16 years, with recent observations suggesting ongoing reproductive activity. Although the unique satellite population is likely sustained by anthropogenic influences, our findings suggest a strong potential for the continued geographic spread of E. rosea.
The mechanism of introduction appears to be human-mediated dispersal, likely through the unintended transport of snails on landscaping materials such as mulch or plants. The prevalence of dispersal events, particularly through commercial garden retailers, highlights the substantial impact of landscaping activities on the introduction and establishment of non-native snail populations in urban and suburban areas. This study emphasizes the importance of recognizing and addressing satellite populations, as they play a crucial role in the range expansion of invasive species. The potential for these populations to persist and spread is influenced by various factors, including climate change, jump dispersal events, and the urban heat island effect. Understanding these dynamics is essential for developing effective strategies to mitigate the invasion process and prevent further ecological impacts.

Supplementary Materials

The following supporting information can be downloaded at: https://www.mdpi.com/article/10.3390/su16051929/s1. A detailed description of our ecological niche modeling process and correlation matrix.

Author Contributions

Conceptualization and methodology, D.H.M. and M.L.M.; data curation, formal analysis, investigation, software, validation, visualization, and writing—original draft, D.H.M.; project administration, resources, supervision, and writing—review and editing, M.L.M. All authors have read and agreed to the published version of the manuscript.

Funding

This research received no external funding.

Institutional Review Board Statement

Not applicable.

Informed Consent Statement

Not applicable.

Data Availability Statement

The E. rosea occurrence datasets analyzed during the study are available in the Global Biodiversity Information Facility repository and can be accessed using the following link: https://doi.org/10.15468/dl.bfxtvg. Current and predicted climate data analyzed during this study are made available by AdaptWest—A Climate Adaptation Conservation Planning Database for North America and can be accessed using the following link: https://adaptwest.databasin.org/pages/adaptwest-climatena accessed on 11 November 2023.

Acknowledgments

We thank Howard Rosenblum for taking a keen interest in the biodiversity of his backyard and giving us full site access. Without his curiosity, this E. rosea colony would not have been discovered. We also thank David Withers, with the Tennessee Natural Heritage Program, Department of Environment and Conservation, for investigating the initial E. rosea sightings.

Conflicts of Interest

The authors declare no conflicts of interest.

References

  1. Burrows, M.T.; Schoeman, D.S.; Buckley, L.B.; Moore, P.; Poloczanska, E.S.; Brander, K.M.; Brown, C.; Bruno, J.F.; Duarte, C.M.; Halpern, B.S.; et al. The Pace of Shifting Climate in Marine and Terrestrial Ecosystems. Science 2011, 334, 652–655. [Google Scholar] [CrossRef]
  2. Lenoir, J.; Svenning, J.C. Climate-Related Range Shifts—A Global Multidimensional Synthesis and New Research Directions. Ecography 2015, 38, 15–28. [Google Scholar] [CrossRef]
  3. Parmesan, C.; Yohe, G.; Andrus, J.E. A Globally Coherent Fingerprint of Climate Change Impacts across Natural Systems. Nature 2003, 421, 37–42. [Google Scholar] [CrossRef]
  4. Robinet, C.; Roques, A. Direct Impacts of Recent Climate Warming on Insect Populations. Integr. Zool. 2010, 5, 132–142. [Google Scholar] [CrossRef]
  5. Pauchard, A.; Milbau, A.; Albihn, A.; Alexander, J.; Burgess, T.; Daehler, C.; Englund, G.; Essl, F.; Evengård, B.; Greenwood, G.B.; et al. Non-Native and Native Organisms Moving into High Elevation and High Latitude Ecosystems in an Era of Climate Change: New Challenges for Ecology and Conservation. Biol. Invasions 2016, 18, 345–353. [Google Scholar] [CrossRef]
  6. Gerlach, J.; Barker, G.M.; Bick, C.S.; Bouchet, P.; Brodie, G.; Christensen, C.C.; Collins, T.; Coote, T.; Cowie, R.H.; Fiedler, G.C.; et al. Negative Impacts of Invasive Predators Used as Biological Control Agents against the Pest Snail Lissachatina Fulica: The Snail EuglandinaRosea’ and the Flatworm Platydemus Manokwari. Biol. Invasions 2021, 23, 997–1031. [Google Scholar] [CrossRef]
  7. Lowe, S.; Browne, M.; Boujelas, S.; De Poorter, M. 100 of the World’s Invasive Species; ISSG: Auckland, New Zealand, 2004. [Google Scholar]
  8. Cook, A. Factors Affecting Prey Choice and Feeding Technique in the Carnivorous Snail Euglandina rosea Ferussac. J. Molluscan Stud. 1989, 55, 469–477. [Google Scholar] [CrossRef]
  9. Gerlach, J. The Ecology of the Carnivorous Snail Euglandina rosea. Ph.D. Thesis, Wadham College, Oxford, UK, 1994. [Google Scholar]
  10. Davis, C.J.; Butler, G.D. Introduced Enemies of the Giant African Snail, Achatina Fulica Bowdich, in Hawaii (Pulmonata: Achatinidae). Proc. Hawaii. Entomol. Soc. 1964, XVIII, 377–390. [Google Scholar]
  11. Lv, S.; Zhang, Y.; Steinmann, P.; Zhou, X.-N. Emerging Angiostrongyliasis in Mainland China. Emerg. Infect. Dis. 2008, 14, 161–164. [Google Scholar] [CrossRef] [PubMed]
  12. USDA. Lissachatina Fulica. Available online: https://www.aphis.usda.gov/plant_health/plant_pest_info/gas/lissachatina-fulica.pdf (accessed on 26 March 2023).
  13. Ezzell, C. Strangers in Paradise: Alien Species Disrupt the Ecology of Hawaii. Sci. News 1992, 149, 314–316. [Google Scholar] [CrossRef]
  14. Solem, A. How Many Hawaiian Land Snail Species Are Left? And What We Can Do for Them. Bish. Mus. Occas. Pap. 1990, 30, 27–40. [Google Scholar]
  15. Hadfield, M.G.; Miller, S.E.; Carwile, A.H. The Decimation of Endemic Hawaiian Tree Snails by Alien Predators’. Am. Zool. 1993, 33, 610–622. [Google Scholar] [CrossRef]
  16. Meyer, W.M.; Cowie, R.H. Feeding Preferences of Two Predatory Snails Introduced to Hawaii and Their Conservation Implications. Malacologia 2010, 53, 135–144. [Google Scholar] [CrossRef]
  17. Holland, B.S.; Chock, T.; Lee, A.; Sugiura, S. Tracking Behavior in the Snail Euglandina rosea: First Evidence of Preference for Endemic vs. Biocontrol Target Pest Species in Hawaii. Am. Malacol. Bull. 2012, 30, 153–157. [Google Scholar] [CrossRef]
  18. Hadfield, M.G. Extinction in Hawaiian Achatinelline Snails. Malacologia 1986, 27, 67–81. [Google Scholar]
  19. Holland, B.S.; Hadfield, M.G. Origin and Diversification of the Endemic Hawaiian Tree Snails (Achatinellidae: Achatinellinae) Based on Molecular Evidence. Mol. Phylogenet. Evol. 2004, 32, 588–600. [Google Scholar] [CrossRef] [PubMed]
  20. Cowie, R.H. Variation in Species Diversity and Shell Shape in Hawaiian Land Snails: In Situ Speciation and Ecological Relationships. Evolution 1995, 49, 1191–1202. [Google Scholar] [CrossRef] [PubMed]
  21. Lydeard, C.; Cowie, R.H.; Ponder, W.F.; Bogan, A.E.; Bouchet, P.; Clark, S.A.; Cummings, K.S.; Frest, T.J.; Gargominy, O.; Herbert, D.G.; et al. Global Decline of Nonmarine Mollusks. Bioscience 2004, 54, 321–330. [Google Scholar] [CrossRef]
  22. Simberloff, D.; Stiling, P. How Risky Is Biological Control? Ecology 1996, 77, 1965–1974. [Google Scholar] [CrossRef]
  23. Mack, R.N.; Simberloff, D.; Lonsdale, W.M.; Evans, H.; Clout, M.; Bazzaz, F.A. Biotic Invasions: Causes, Epidemiology, Global Consequences, and Control. Ecol. Appl. 2000, 10, 689–710. [Google Scholar] [CrossRef]
  24. Irwin, K.L.; McKinney, M.L.; Womble, S.; Irwin, K.L. First Reported Occurrence of the Invasive Land Snail Euglandia Rosea in Tennessee: Implications for Global Warming. Tenn. Acad. Sci. 2016, 91, 49–51. [Google Scholar]
  25. Auffenberg, K.; Stange, L.A. Snail-Eating Snails of Florida, Gastropoda; University of Florida: Gainsville, FL, USA, 2021. [Google Scholar]
  26. GBIF.org (12 November 2023) GBIF Occurrence Download. Available online: https://www.gbif.org/occurrence/download/0056190-231002084531237 (accessed on 12 November 2023).
  27. NOAA Global Summary of the Year. Available online: https://www.ncei.noaa.gov/data/gsoy/ (accessed on 24 May 2023).
  28. Ivanova, N.V.; Shashkov, M.P. The Possibilities of GBIF Data Use in Ecological Research. Russ. J. Ecol. 2021, 52, 1–8. [Google Scholar] [CrossRef]
  29. iNaturalist Observations of Euglandina rosea from the United States. Available online: https://www.inaturalist.org (accessed on 7 May 2023).
  30. Cox, G. What Is a ‘Verifiable Observation’ and How Does It Reach ‘Research Grade’? Available online: https://www.inaturalist.org/posts/26549-what-is-a-verifiable-observation-and-how-does-it-reach-research-grade (accessed on 11 November 2023).
  31. Maldonado, C.; Molina, C.I.; Zizka, A.; Persson, C.; Taylor, C.M.; Albán, J.; Chilquillo, E.; Rønsted, N.; Antonelli, A. Estimating Species Diversity and Distribution in the Era of Big Data: To What Extent Can We Trust Public Databases? Glob. Ecol. Biogeogr. 2015, 24, 973–984. [Google Scholar] [CrossRef] [PubMed]
  32. AdaptWest Project. Gridded Current and Projected Climate Data for North America at 1km Resolution, Generated Using the ClimateNA v7.30 Software (T. Wang et al., 2022). Available online: https://adaptwest.databasin.org (accessed on 11 November 2023).
  33. Mahony, C.R.; Wang, T.; Hamann, A.; Cannon, A.J. A Global Climate Model Ensemble for Downscaled Monthly Climate Normals over North America. Int. J. Climatol. 2022, 42, 5871–5891. [Google Scholar] [CrossRef]
  34. Feng, X.; Park, D.S.; Walker, C.; Peterson, A.T.; Merow, C.; Papeş, M. A Checklist for Maximizing Reproducibility of Ecological Niche Models. Nat. Ecol. Evol. 2019, 3, 1382–1395. [Google Scholar] [CrossRef] [PubMed]
  35. Boria, R.A.; Olson, L.E.; Goodman, S.M.; Anderson, R.P. Spatial Filtering to Reduce Sampling Bias Can Improve the Performance of Ecological Niche Models. Ecol. Modell. 2014, 275, 73–77. [Google Scholar] [CrossRef]
  36. Muscarella, R.; Galante, P.J.; Soley-Guardia, M.; Boria, R.A.; Kass, J.M.; Uriarte, M.; Anderson, R.P. ENMeval: An R Package for Conducting Spatially Independent Evaluations and Estimating Optimal Model Complexity for Maxent Ecological Niche Models. Methods Ecol. Evol. 2014, 5, 1198–1205. [Google Scholar] [CrossRef]
  37. Kass, J.M.; Muscarella, R.; Galante, P.J.; Bohl, C.L.; Pinilla-Buitrago, G.E.; Boria, R.A.; Soley-Guardia, M.; Anderson, R.P. ENMeval 2.0: Redesigned for Customizable and Reproducible Modeling of Species’ Niches and Distributions. Methods Ecol. Evol. 2021, 12, 1602–1608. [Google Scholar] [CrossRef]
  38. Root, T. Environmental Factors Associated with Avian Distributional Boundaries. J. Biogeogr. 1988, 15, 489–505. [Google Scholar] [CrossRef]
  39. Phillips, S.B.; Anderson, R.P.; Schapire, R.E. Maximum Entropy Modeling of Species Geographic Distributions. Ecol. Modell. 2006, 190, 231–259. [Google Scholar] [CrossRef]
  40. Phillips, S.J.; Anderson, R.P.; Dudík, M.; Schapire, R.E.; Blair, M.E. Opening the Black Box: An Open-Source Release of Maxent. Ecography 2017, 40, 887–893. [Google Scholar] [CrossRef]
  41. Phillips, S.J.; Dudík, M.; Schapire, R.E. [Internet] Maxent Software for Modeling Species Niches and Distributions (Version 3.4.1). Available online: http://biodiversityinformatics.amnh.org/open_source/maxent/ (accessed on 19 February 2024).
  42. Radosavljevic, A.; Anderson, R.P. Making Better Maxent Models of Species Distributions: Complexity, Overfitting and Evaluation. J. Biogeogr. 2014, 41, 629–643. [Google Scholar] [CrossRef]
  43. Boyce, M.S.; Vernier, P.R.; Nielsen, S.E.; Schmiegelow, F.K.A. Evaluating Resource Selection Functions. Ecol. Model. 2002, 157, 281–300. [Google Scholar] [CrossRef]
  44. Hanley, J.A.; McNeil, B.J. The Meaning and Use of the Area under a Receiver Operating Characteristic (ROC) Curve. Radiology 1982, 143, 29–36. [Google Scholar] [CrossRef] [PubMed]
  45. Lobo, J.M.; Jiménez-valverde, A.; Real, R. AUC: A Misleading Measure of the Performance of Predictive Distribution Models. Glob. Ecol. Biogeogr. 2008, 17, 145–151. [Google Scholar] [CrossRef]
  46. Hirzel, A.H.; Le Lay, G.; Helfer, V.; Randin, C.; Guisan, A. Evaluating the Ability of Habitat Suitability Models to Predict Species Presences. Ecol. Modell. 2006, 199, 142–152. [Google Scholar] [CrossRef]
  47. Lockwood, J.L.; Hoopes, M.F.; Marchetti, M.P. Invasion Ecology, 2nd ed.; John Wiley & Sons: Hoboken, NJ, USA, 2013; ISBN 978-1-444-33364-0. [Google Scholar]
  48. Simberloff, D. Invasive Species; Oxford University Press: Oxford, UK, 2013; ISBN 9780199922017. [Google Scholar]
  49. Ansart, A.; Vernon, P.; Daguzan, J. Elements of Cold Hardiness in a Littoral Population of the Land Snail Helix Aspersa (Gastropoda: Pulmonata). J. Comp. Physiol. B 2002, 172, 619–625. [Google Scholar] [CrossRef] [PubMed]
  50. Slotsbo, S.; Hansen, L.M.; Holmstrup, M. Low Temperature Survival in Different Life Stages of the Iberian Slug, Arion lusitanicus. Cryobiology 2010, 62, 68–73. [Google Scholar] [CrossRef] [PubMed]
  51. Reynolds, C.; Miranda, N.A.F.; Cumming, G.S. The Role of Waterbirds in the Dispersal of Aquatic Alien and Invasive Species. Divers. Distrib. 2015, 21, 744–754. [Google Scholar] [CrossRef]
  52. Planchuelo, G.; Catalán, P.; Delgado, J.A. Gone with the Wind and the Stream: Dispersal in the Invasive Species Ailanthus Altissima. Acta Oecologica 2016, 73, 31–37. [Google Scholar] [CrossRef]
  53. Buck, J.H.; Marshall, J.M. Hitchhiking as a Secondary Dispersal Pathway for Adult Emerald Ash Borer, Agrilus Planipennis. Great Lakes Entomol. 2009, 41, 197–199. [Google Scholar]
  54. Perkins, A.T.; Phillips, B.L.; Baskett, M.L.; Hastings, A. Evolution of Dispersal and Life History Interact to Drive Accelerating Spread of an Invasive Species. Ecol. Lett. 2013, 16, 1079–1087. [Google Scholar] [CrossRef] [PubMed]
  55. Coulson, R.N.; Witter, J.A. Forest Entomology: Ecology and Management; John Wiley & Sons, Inc.: Hoboken, NJ, USA, 1984; ISBN 9780471025733. [Google Scholar]
  56. Bergey, E.A.; Figueroa, L.L.; Mather, C.M.; Martin, R.J.; Ray, E.J.; Kurien, J.T.; Westrop, D.R.; Suriyawong, P. Trading in Snails: Plant Nurseries as Transport Hubs for Non-Native Species. Biol. Invasions 2014, 16, 1441–1451. [Google Scholar] [CrossRef]
  57. Dyer, A.R.; Cochran, J.E.; Phillips, J.M.; Layne, K.I.; Berry, M.E.; Kule, A.K. Bagged Commercial Soils Are an Avenue for Regional Dispersal of Weedy Plant Species. Am. Midl. Nat. 2017, 178, 275–283. [Google Scholar] [CrossRef]
  58. Bergey, E.A.; Figueroa, L.L. Residential Yards as Designer Ecosystems: Effects of Yard Management on Land Snail Species Composition. Ecol. Appl. 2016, 26, 2536–2545. [Google Scholar] [CrossRef]
  59. Bergey, E.A. Dispersal of a Non-Native Land Snail across a Residential Area Is Modified by Yard Management and Movement Barriers. Urban. Ecosyst. 2019, 22, 325–334. [Google Scholar] [CrossRef]
  60. Dinkins, B.J.; Dinkins, G.R. An Inventory of the Land Snails and Slugs (Gastropoda: Caenogastropoda and Pulmonata) of Knox County, Tennessee. Am. Malacol. Bull. 2018, 36, 1–22. [Google Scholar] [CrossRef]
  61. Borden, J.B.; Flory, S.L. Urban Evolution of Invasive Species. Front. Ecol. Environ. 2021, 19, 184–191. [Google Scholar] [CrossRef]
  62. Gallo, K.P.; Tarpley, J.D.; Mcnab, A.L.; Karl, T.R. Assessment of Urban Heat Islands: A Satellite Perspective. Atmos. Res. 1995, 37, 37–43. [Google Scholar] [CrossRef]
  63. Yang, L.; Qian, F.; Song, D.X.; Zheng, K.J. Research on Urban Heat-Island Effect. Proc. Eng. 2016, 169, 11–18. [Google Scholar] [CrossRef]
  64. Frank, S.D.; Just, M.G. Can Cities Activate Sleeper Species and Predict Future Forest Pests? A Case Study of Scale Insects. Insects 2020, 11, 142. [Google Scholar] [CrossRef] [PubMed]
  65. Greenlees, M.J.; Harris, S.; White, A.W.; Shine, R. The Establishment and Eradication of an Extra-Limital Population of Invasive Cane Toads. Biol. Invasions 2018, 20, 2077–2089. [Google Scholar] [CrossRef]
  66. Jevrejeva, S.; Jackson, L.P.; Riva, R.E.M.; Grinsted, A.; Moore, J.C. Coastal Sea Level Rise with Warming above 2 °C. Proc. Natl. Acad. Sci. USA 2016, 113, 13342–13347. [Google Scholar] [CrossRef] [PubMed]
Figure 1. States encompassing the home range and verified observations of E. rosea, including the satellite colony in Nashville, TN [26], and the average temperature during the coldest months of the year [27].
Sustainability 16 01929 g001
Figure 2. Lowest recorded temperature in Davidson County, Tennessee, for the years 2000 to 2022 [27].
Sustainability 16 01929 g002
Figure 3. Current continuous map of predicted suitable habitat for E. rosea in the southeastern United States, raw maximum entropy output. Dark areas indicate regions of higher habitat suitability and light areas indicate regions of lower predicted suitability. Two-letter abbreviations represent official U.S. state names.
Sustainability 16 01929 g003
Figure 4. Binary map of predicted potential suitable habitat based on the 10th percentile presence threshold. Grey indicates the predicted niche for E. rosea between the period 2000–2020. Black indicates the predicted niche for E. rosea between the period 2021–2040. Two-letter abbreviations represent official U.S. state names.
Sustainability 16 01929 g004
Table 1. Bioclimatic variables and their abbreviations, downloaded from the AdaptWest Project for use in ecological niche modeling [32]. Present and future climate scenario data files are available in 1 km resolution at adaptwest.databasin.org.
Variable
Abbreviation
Description
MATMean annual temperature (°C)
MWMTMean temperature of the warmest month (°C)
MCMTMean temperature of the coldest month (°C)
TDDifference between MCMT and MWMT (°C)
MAPMean annual precipitation (mm)
MSPMean summer (May to Sep) precipitation (mm)
AHMAnnual heat moisture index, calculated as (MAT + 10)/(MAP/1000)
SHMSummer heat moisture index, calculated as MWMT/(MSP/1000)
DD_0Degree-days below 0 °C (chilling degree days)
DD5Degree-days above 5 °C (growing degree days)
DD_18Degree-days below 18 °C
DD18Degree-days above 18 °C
NFFDNumber of frost-free days
FFPFrost-free period
bFFPJulian date on which the frost-free period begins
eFFPJulian date on which the frost-free period ends
PASPrecipitation as snow (mm)
EMTExtreme minimum temperature over 30 years
EXTExtreme maximum temperature over 30 years
ErefHargreave’s reference evaporation
CMDHargreave’s climatic moisture index
MARMean annual solar radiation (MJ m−2 d−1)
RHMean annual relative humidity (%)
CMIHogg’s climate moisture index (mm)
DD1040(10 < DD < 40) degree-days above 10 °C and below 40 °C
Tave_wtWinter (December to February) mean temperature (°C)
Tave_spSpring (March to May) mean temperature (°C)
Tave_smSummer (June to August) mean temperature (°C)
Tave_atAutumn (September to November) mean temperature (°C)
PPT_wtWinter (December to February) precipitation (mm)
PPT_spSpring (March to May) precipitation (mm)
PPT_smSummer (June to August) precipitation (mm)
PPT_atAutumn (September to November) precipitation (mm)
Table 2. Relative size and age categories based on shell length, measured from the apex of the shell to the base of the aperture. Relative categories were assigned using growth rate data from “The ecology of the carnivorous snail Euglandina rosea” by Gerlach [9].
Relative Age CategoryApproximate AgeShell Length
Hatchling0–41 days<10 mm
Juvenile42–311 days10–30 mm
Subadult312–460 days31–40 mm
Adult>460 days>40 mm
Table 3. Estimates of relative contributions of the environmental variables to the MaxEnt model.
DescriptionPercent Contribution
Mean winter temperature (C°) (December–February)49.0%
Winter precipitation (mm) (December–February)26.1%
Summer precipitation (mm) (June–August)25.0%
Disclaimer/Publisher’s Note: The statements, opinions and data contained in all publications are solely those of the individual author(s) and contributor(s) and not of MDPI and/or the editor(s). MDPI and/or the editor(s) disclaim responsibility for any injury to people or property resulting from any ideas, methods, instructions or products referred to in the content.

