Article

Sustainability Evaluation of Plant-Based Beverages and Semi-Skimmed Milk Incorporating Nutrients, Market Prices, and Environmental Costs

by
Peter de Jong
1,2,*,
Franciska Woudstra
1 and
Anne N. van Wijk
1
1
Sustainable Dairy & Food Processing, Van Hall Larenstein University of Applied Sciences, Agora 1, 8934 CJ Leeuwarden, The Netherlands
2
NIZO, Kernhemseweg 2, 6718 ZB Ede, The Netherlands
*
Author to whom correspondence should be addressed.
Sustainability 2024, 16(5), 1919; https://doi.org/10.3390/su16051919
Submission received: 19 January 2024 / Revised: 13 February 2024 / Accepted: 14 February 2024 / Published: 26 February 2024
(This article belongs to the Special Issue Food Processing Technology and Nutrition)

Abstract

:
Developing a reliable method to compare food sustainability is gaining traction, with efforts like those by the Food and Agriculture Organization (FAO). This research aims to contribute to a comprehensive scientific comparison of food categories based on CO2 emissions linked not to weight but to their primary function: nutrient availability and uptake in the consumer’s body. The study utilizes a multi-criteria evaluation for sustainability, incorporating the Nutrient Rich Food (NRF) score, protein digestibility, and essential amino acid content. A case study compares one serving of semi-skimmed milk (SSM) with various plant-based beverages (oat, soy, rice, coconut, and almond), considering their carbon footprints in relation to nutrient content and environmental costs. The analysis integrates protein quality through essential amino acid proportion and digestibility. Findings reveal that achieving an NRF11.3 score of 50 requires more servings of unfortified plant-based beverages than semi-skimmed milk, resulting in higher carbon footprints, except for soy drink. However, when considering emerging farm management measures, semi-skimmed and soy drinks show comparable carbon footprints for a given NRF score. Fortified plant-based beverages (soy, oat, and almond) exhibit lower footprints relative to the calculated NRF scores. Yet, when converting carbon footprints to euros using the European Union Emissions Trading System and adding them to retail prices per kilogram, semi-skimmed milk emerges as the option with the lowest “societal costs” (environment and consumer costs). The research underscores that understanding a food product’s nutritional value requires more than knowledge of its composition; uptake into the body maintenance and potential synergistic effects of other components in the food matrix play crucial roles.

1. Introduction

In the scientific literature and popular media, many comparisons between the degree of sustainability of bovine milk and milk alternatives can be found. In most cases, sustainability is quantified by the carbon and water footprint of the product. The scientific literature and official reports from the Food and Agriculture Organization (FAO) provide data on greenhouse gas emissions, measured in kilograms of CO2-equivalents per kilogram of food product. However, these figures vary depending on the production chain and factors such as the geographical region, milk production per cow, and farm size [1,2,3]. Those values are far from equal. For example, the values at farm gate differ from 6.7 in Africa to 1.3 kg CO2-eq per kg of milk in the United States [1]. The same holds for plant-based beverages (PBBs). The carbon footprint of dairy alternatives, much like that of milk, depends on their source of origin. Yield per hectare, energy source and use, and soil treatment will differ from region to region [3,4,5]. For example, values between 0.4 and 3.8 and 0.2 and 2.5 CO2-eq per kg have been reported for tree nuts and pulses, respectively [6]. Those carbon footprints are based on life cycle analyses (LCA). LCA is a holistic tool to compute the footprint of a product between defined system boundaries. The variation of published footprints might be caused by several factors, for example, different system boundaries, variation in farm management, and differences in processing equipment and conditions.
Major concerns about climate change and the growing global population stimulate efforts to look for more sustainable food production chains [7]. One example is the so-called protein transition, wherein animal-based proteins are replaced by plant-based proteins. The improvement in sustainability is quantified, among others, by the greenhouse gasses (GHGs), i.e., CO2-eq per kg of product. In general, plant-based alternatives tend to have lower footprints. For example, the footprint of dairy alternatives such as soy, oat, and almond beverages are presented as significantly lower than that of milk [6]. As a result, dairy is being debated more and more [8]. In the US, the market share of plant-based dairy alternatives is more than 7% of the total milk market and are believed to be better food products for the planet by the majority of consumers [9,10].
However, in the first place, food is a carrier of nutrients aiming to maintain the body. The main challenge in feeding the growing world population is the availability of nutrients and not kilograms or even calories. Since several PBBs have fewer nutrients per serving than milk [11,12], the FAO have encouraged including nutritional properties in so-called nLCA studies [13]. Several authors have begun relating nutrient density of food products to the emission of GHGs in kg CO2-eq per kg of product. Since the nutrient density of a dairy alternative is in many cases much lower than that of bovine milk [14], comparison with PBBs lead to smaller differences in GHG emission per amount of nutrients [15,16]. Some authors begin with the premise that nutrients derived from animal sources are not environmentally sustainable. As a result, they redefine the nutrient density index by excluding any nutrients derived from animals [17]. When this approach is taken, it becomes unfeasible to directly compare the sustainability of nutrients from bovine sources with those from plant-based sources.
Given that any nutritional deficiencies in a person’s diet can typically be compensated by incorporating other food items [18], PBBs are often considered a viable milk alternative. However, it is important to note that consumers might view PBBs as a direct substitute for bovine milk. Therefore, gaining insight into the greenhouse gas emissions per unit of nutrients per serving for these beverages is of significance.
From the FAO report [13], it is clear that a comprehensive evaluation of all relevant aspects of environmental costs and nutritional aspects are still far too complex. For example, GHG emissions are only one aspect of many other factors that describe the environmental impact of food products [19]. This research aims to contribute to the initial stages in developing a more balanced scientific comparison between food categories where CO2 emissions are not related to kilograms of a food product but to its primary function: availability and uptake of nutrients in the consumer’s body. This will result in a multi-criteria evaluation of the sustainability of food categories incorporating the Nutrient Rich Food (NRF) score, digestibility of proteins, and amount of essential amino acids. In addition, a true price is defined which combines the supermarket price and the environmental cost of a product in euro’s. As a case study, one serving of semi-skimmed milk (SSM) is compared with a serving of several PBBs, both fortified and non-fortified, namely oat-, soy-, rice-, coconut-, and almond-based beverages.

2. Materials and Methods

2.1. Definition and Scope

In the literature, several methods are used to compare food products in terms of the GHG emission-based LCA studies. The most important parameter is the system boundary. In this research, the GHG emissions are defined as kg CO2-equivalent per kg of product or ingredient, incorporating the amount of CO2, CH4, and N2O, from cradle to factory gate. Environmental sustainability encompasses various facets including GHG emissions, water footprint, soil health, animal welfare, and biodiversity. However, this study focuses on employing GHG emissions from food production as a widely used key indicator of environmental sustainability. As a consequence, this is not a comprehensive study on all aspects of sustainability.
Weighing the nutrients in milk and its alternatives can be performed in many ways. For example, milk and its alternatives can be evaluated as part of a certain diet. In that way, the lack of certain vitamins or amino acids can and need to be compensated. Therefore, no real comparison is possible. Each alternative to milk (e.g., water or even beverages like cola) may be a potential replacement. For that reason, the evaluation is focused on one serving of a beverage (100 g), either milk or a PBB. The following main question will be addressed: which serving is the most sustainable choice, defined as the amount of GHG emissions in relation to the amount of essential nutrients? The following products were evaluated: semi-skimmed milk (the most consumed milk beverage in the Netherlands), oat-, soy-, rice-, coconut-, and almond-based beverages. Most PBBs are fortified with additional ingredients (nutrients). Therefore, PBBs were evaluated with and without fortification.

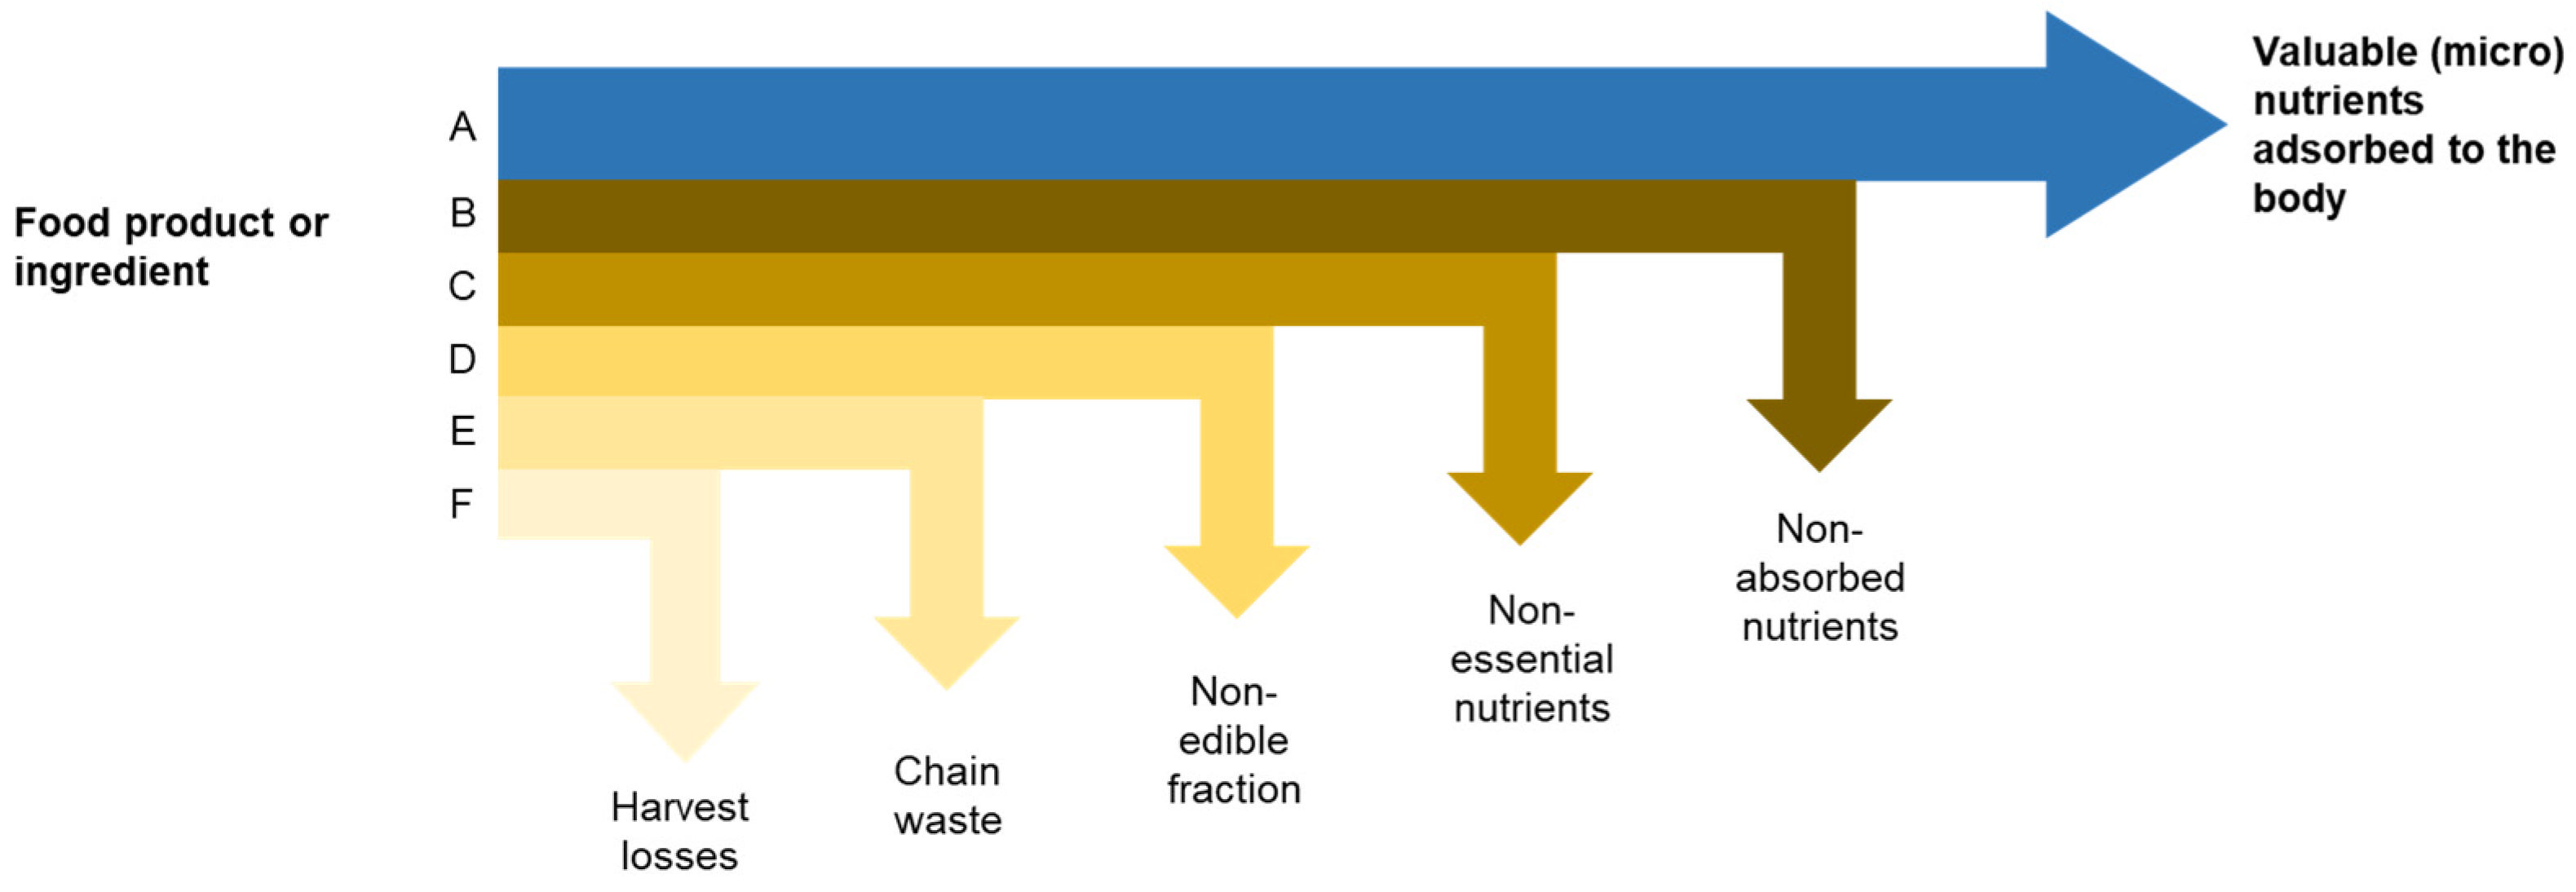
2.2. Production Chain Approach

The LCA approach is widely used to estimate the emission of GHG in terms of kg CO2-eq per kg of product. A fundamental prerequisite is to relate the amount of GHG to the main purpose or functionality of a food product: maintenance (including energy and growth) of the body. Therefore, the emission of GHG should be related not to the weight of a product but to the amount of essential nutrients for body maintenance such as proteins, carbohydrates, fat, minerals, vitamins, and fibers. Figure 1 shows the relationship between GHG in CO2-eq needed for food and ingredient production on the one hand and the effective nutrition value. Losses of food material occur at many points along the production chain, for example during harvesting and factory processing. Fouling and cleaning result in additional losses of material. Moreover, microbial spoilage is a source of waste. In addition, only a fraction of the raw material can be considered as edible. For example, for milk, 100% of the raw material is considered as edible, while soybeans, beans, and peas are on average 88%, 52%, and 31%, respectively, edible [20]. Also, for waste in the chain, there have been some numbers reported on a high aggregation level [21]. The Dutch database on the carbon footprint of food [22] reports that chain waste is included in the LCA but does not provide the basis and numbers. Some products and ingredients require more complex process configurations. This results in a higher level of energy consumption per kg. In most LCA studies, processing is included at an aggregated level. Obviously, harvest losses and chain waste (i.e., E and F in Figure 1) lead to an increased footprint per kg of product. For example, if 50% is being lost, 2 kg agri-food material needs to be harvested for 1 kg of product. In addition, since only the (micro) nutrients adsorbed in the body contribute to body maintenance, non-edible fractions, non-essential nutrients, and non-absorbed nutrients (i.e., D, C, B in Figure 1) should not influence any footprint comparison between food products. Within the production chain, particularly during processing, it is notable that side-streams can yield valuable by-products. In such instances, these by-products are not characterized as losses; rather, the allocation of emissions becomes a requisite consideration [21].
LCA’s for dairy products are relatively well-established [23,24], making a well-defined separation between all parts of the production chain and their contribution to the carbon footprint. For PBBs, the GHG-emissions are less well-established. The production chain for delivering plant proteins out of, for example, almond, peas, and coconut is relatively new. For example, for plant proteins, the process design and operation to prepare ingredients for use is not fully developed yet. Several research groups are looking for an increased process efficiency of getting plant proteins out of plant materials [25,26,27]. In the estimation of the carbon footprint, the effect of land use change (LUC) was taken into account. LUC refers to a change in the use of a parcel of land, for example, by switching crops on agricultural land or introducing previously unmanaged land to a productive use.
Biophysical allocation is a method used in life cycle assessment (LCA) to allocate environmental impacts, such as carbon emissions or resource use, among different co-products of a production process. In the context of determining the carbon footprint of a product, like semi-skimmed milk, biophysical allocation based on protein content would involve allocating carbon emissions or other environmental impacts according to the proportion of protein in each co-product. This method aims to provide a more accurate reflection of the environmental impact associated with each component, taking into account their specific attributes [28].

2.3. Incorporating Nutrients Comparing Carbon Footprints

2.3.1. Nutrients

Since the main function of food is defined by its nutrients and not by kilograms or calories, GHG-emission should be related to the amount of nutrients. For the relative importance of a nutrient the composition of a product can be compared to the dairy recommended values. The NRF score [16] summarizes this relative importance of several nutrients, for example per 100 g of product.
NRF n = i = 1 n N 100 g , i RDV i · 100
where N100g,i is the amount of nutrient i per 100 g of product and RDVi is the recommend daily value of nutrient i. Units of N100g,i and RDVi are equal per nutrient. The n subscore refers to the count of nutrients recommended for consumption. It is also possible to account for components (saturated fatty acids, added sugars, sodium) that should be limited [16]. This is indicated by an additional subscore (3 in case of three nutrients to be limited).
NRF n . 3 = i = 1 n N 100 g , i RDV i · 100 j = 1 3 N 100 g , j MRV j · 100
where j is the number of a nutrient with a defined maximum level and MRV is the maximum recommended value of a nutrient; since, in this research, the focus is on one serving of 100 g the maximum level or limiting nutrients are less relevant. In one serving, all these limiting nutrients remain below the critical levels.
The following components are incorporated in the NRF scores:
  • NRF9: protein (g), fibers (g), vitamin A, C, D (mg), Ca, Fe, Mg, K (mg)
  • NRF11: NRF9 + vitamin B12 (ug), Sn (mg)
  • Limited nutrients: saturated fatty acids (g), sugars (g), Na (mg)
In the literature, in most cases, the NRF9 score (indicating the score with 9 nutrients) is used. Since milk is an important source of vitamin B12, which is an essential nutrient, in this research, the NRF11 score is used. If additional nutrients are integrated into the NRF score, for example, using the NRF15 score this does not have significant impact on the comparison between the scores of PBBs and semi-skimmed milk (see also Section 3.2).

2.3.2. Protein Quality

This research focuses on the carbon footprint of a food ingredient related to its main functionality: body maintenance. In almost all cases, this is connected to the bioavailability of, for example, a protein in a consumer body. As a consequence, the main question is as follows: what is the carbon footprint related to the amount of the ingredient that is being used to maintain the body? In fact, this holds for all the nutrients in the NRF score. However, only for protein has this been extensively investigated. The bioavailability of a protein depends on its (essential) amino acid composition, the matrix, and digestibility [29,30]. For example, the digestibility of dairy proteins has been shown to be twice as high as that of plant proteins [31]. Also, the absorption of proteins contained in vegetal foods (including grains and legumes) may be limited and/or somehow impaired because of the presence of fibers as well as anti-nutritional compounds, particularly in soy [20]. In addition, soil management influences the composition of crops, such as soy [32]. Processing might have a relatively large additional impact on digestibility and availability of amino acids. For example, it was observed that toasting of soybean and rapeseed in the presence of sugars resulted in 30–40% decrease in reactive lysine [33]. Nowadays, the digestible indispensable amino acid score (DIAAS) is used as an appropriate measure to protein quality [34,35,36,37]. The DIAAS value accounts for both the composition of amino acids and digestibility. More specifically, the DIAAS value relates the amount of the first limiting amino acid to the optimal required amount for a target group. This information is of use by evaluating different diets from a nutritional point of view. However, in one serving of 100 g, it can be argued that all indispensable amino acids (IAAs) are relevant for body maintenance. For this specific reason, a new parameter was defined in this study to quantify the protein quality of 100 g of product similar to NRF: the DIAA rich food score (DIAARF). This value accounts for all IAAs in 100 g serving.
DIAARF = i N 100 g , i · d i RDV i · 100
where N100g,i is the amount of IAA i per 100 g of product, di is the digestibility of an indispensable amino acid i in %, and RDVi is the recommend daily value of IAA i. In order to compare the NRF scores of different products incorporating the protein quality, the following equation was defined.
N 100 g , protein * = DIAARF product DIAARF SSM · N 100 g , protein
where N*100g,protein is the amount of effective protein in terms of concentration of IAA per 100 g of product compared to the DIAARF of semi-skimmed milk (SSM). The NRF* score is the score with amount N* for the nutrient protein. In other words, when the protein in a PPB has a lower amount of IAAs per g than semi-skimmed milk, the amount of digestible protein in that PPB is corrected, i.e., decreased.

2.3.3. Quantitative Comparison of Footprints

The following equation was defined to quantitatively compare the carbon footprints of semi-skimmed milk and PBBs.
CF 100 g * = CF 100 g · NRF reference * NRF product *
where CF100g is the carbon footprint in g CO2-eq per 100 g of product based on the LCA at factory gate, NRF*product is NRF score of a product corrected for amount of IAAs related to recommended amounts (N*100g,protein), and NRF*reference similar for a reference product (i.e., semi-skimmed milk).

2.3.4. Combining Environmental and Product Costs

A key question for evaluation of food products is what the total financial costs are to obtain a certain amount of nutrient intake. One way to describe this is to transform the carbon footprint from kg to euro per kg of product, using the conversion factors of the European Union Emissions Trading System (ETS) [38]. At this moment, the price for 1 ton CO2-eq emission is around 85 euro [39]. The total cost to obtain a nutrient intake from PBBs similar to 100 g of semi-skimmed milk is calculated by:
Costs env + prod = P retail . 100 g + P CO 2 . ton · CF kg 10 · 1000 · NRF reference * NRF product *
where Pretail.100g is the retail price for 100 g product in euro, PCO2.ton is ETS price for 1 ton CO2 emission, and CFkg is de carbon footprint of a product in kg CO2-eq per kg. Additionally, 10 and 1000 are conversion factors for kg to 100 g and ton to kg, respectively. By summing up environmental and consumer costs, an indication of the costs for society are given.

2.4. Data Used

2.4.1. LCA Data

For semi-skimmed milk, data from the Dutch dairy sector report [24] were used. The data in the report are based on nationwide data sources from 291 farms. The farming conditions of these farms are a representative sample of the Dutch dairy sector. To transform concentrations of CH4 and N2O into CO2-equivalents, time horizon of 100 years was used (GWP100). The conversion factors applied for this transformation were 34 for CH4 and 298 for N2O [24]. For GHG-emission of PBBs data from Blonk Consultants was used [40]. Blonk Consultants is the main provider of LCA data in the Netherlands for several food products [22]. The data provided include estimated raw material losses due to harvesting and processing [41]. For all products, the GHG-emission was determined at the factory gate, assuming corrections for chain losses, including processing. The potential impact of farm management on the GHG emissions associated with semi-skimmed milk was assessed using data from all farmers as well as from the top 5% best-performing farmers in the Netherlands, representing both the average and lowest emissions at the farm level, respectively [24]. The potential effect of new feed additives affecting cow’s metabolism and selected cow breeding was taken from first measures by Fouts et al. [42] and De Haas et al. [43], indicating that a methane emission reduction by 40% at the farm might be feasible in the near future.

2.4.2. Nutritional Data

In order to calculate the NRF score, the compositional food database [44] was used, including websites of manufacturers of PBBs [45,46]. The amounts of IAAs of a product were also found in the literature as the amounts of recommended daily values for adults [37]. In order to estimate the NRF score of non-fortified PBBs, the composition of the raw material (e.g., soy, oat) was used.

2.4.3. Data Processing

All calculations were executed using a calculation model implemented in Excel (version 2308, 2024), employing the equations detailed in this article. It is worth mentioning that the data utilized for both LCA and NRF scores did not report statistical variation, a common occurrence in such analyses.

3. Results

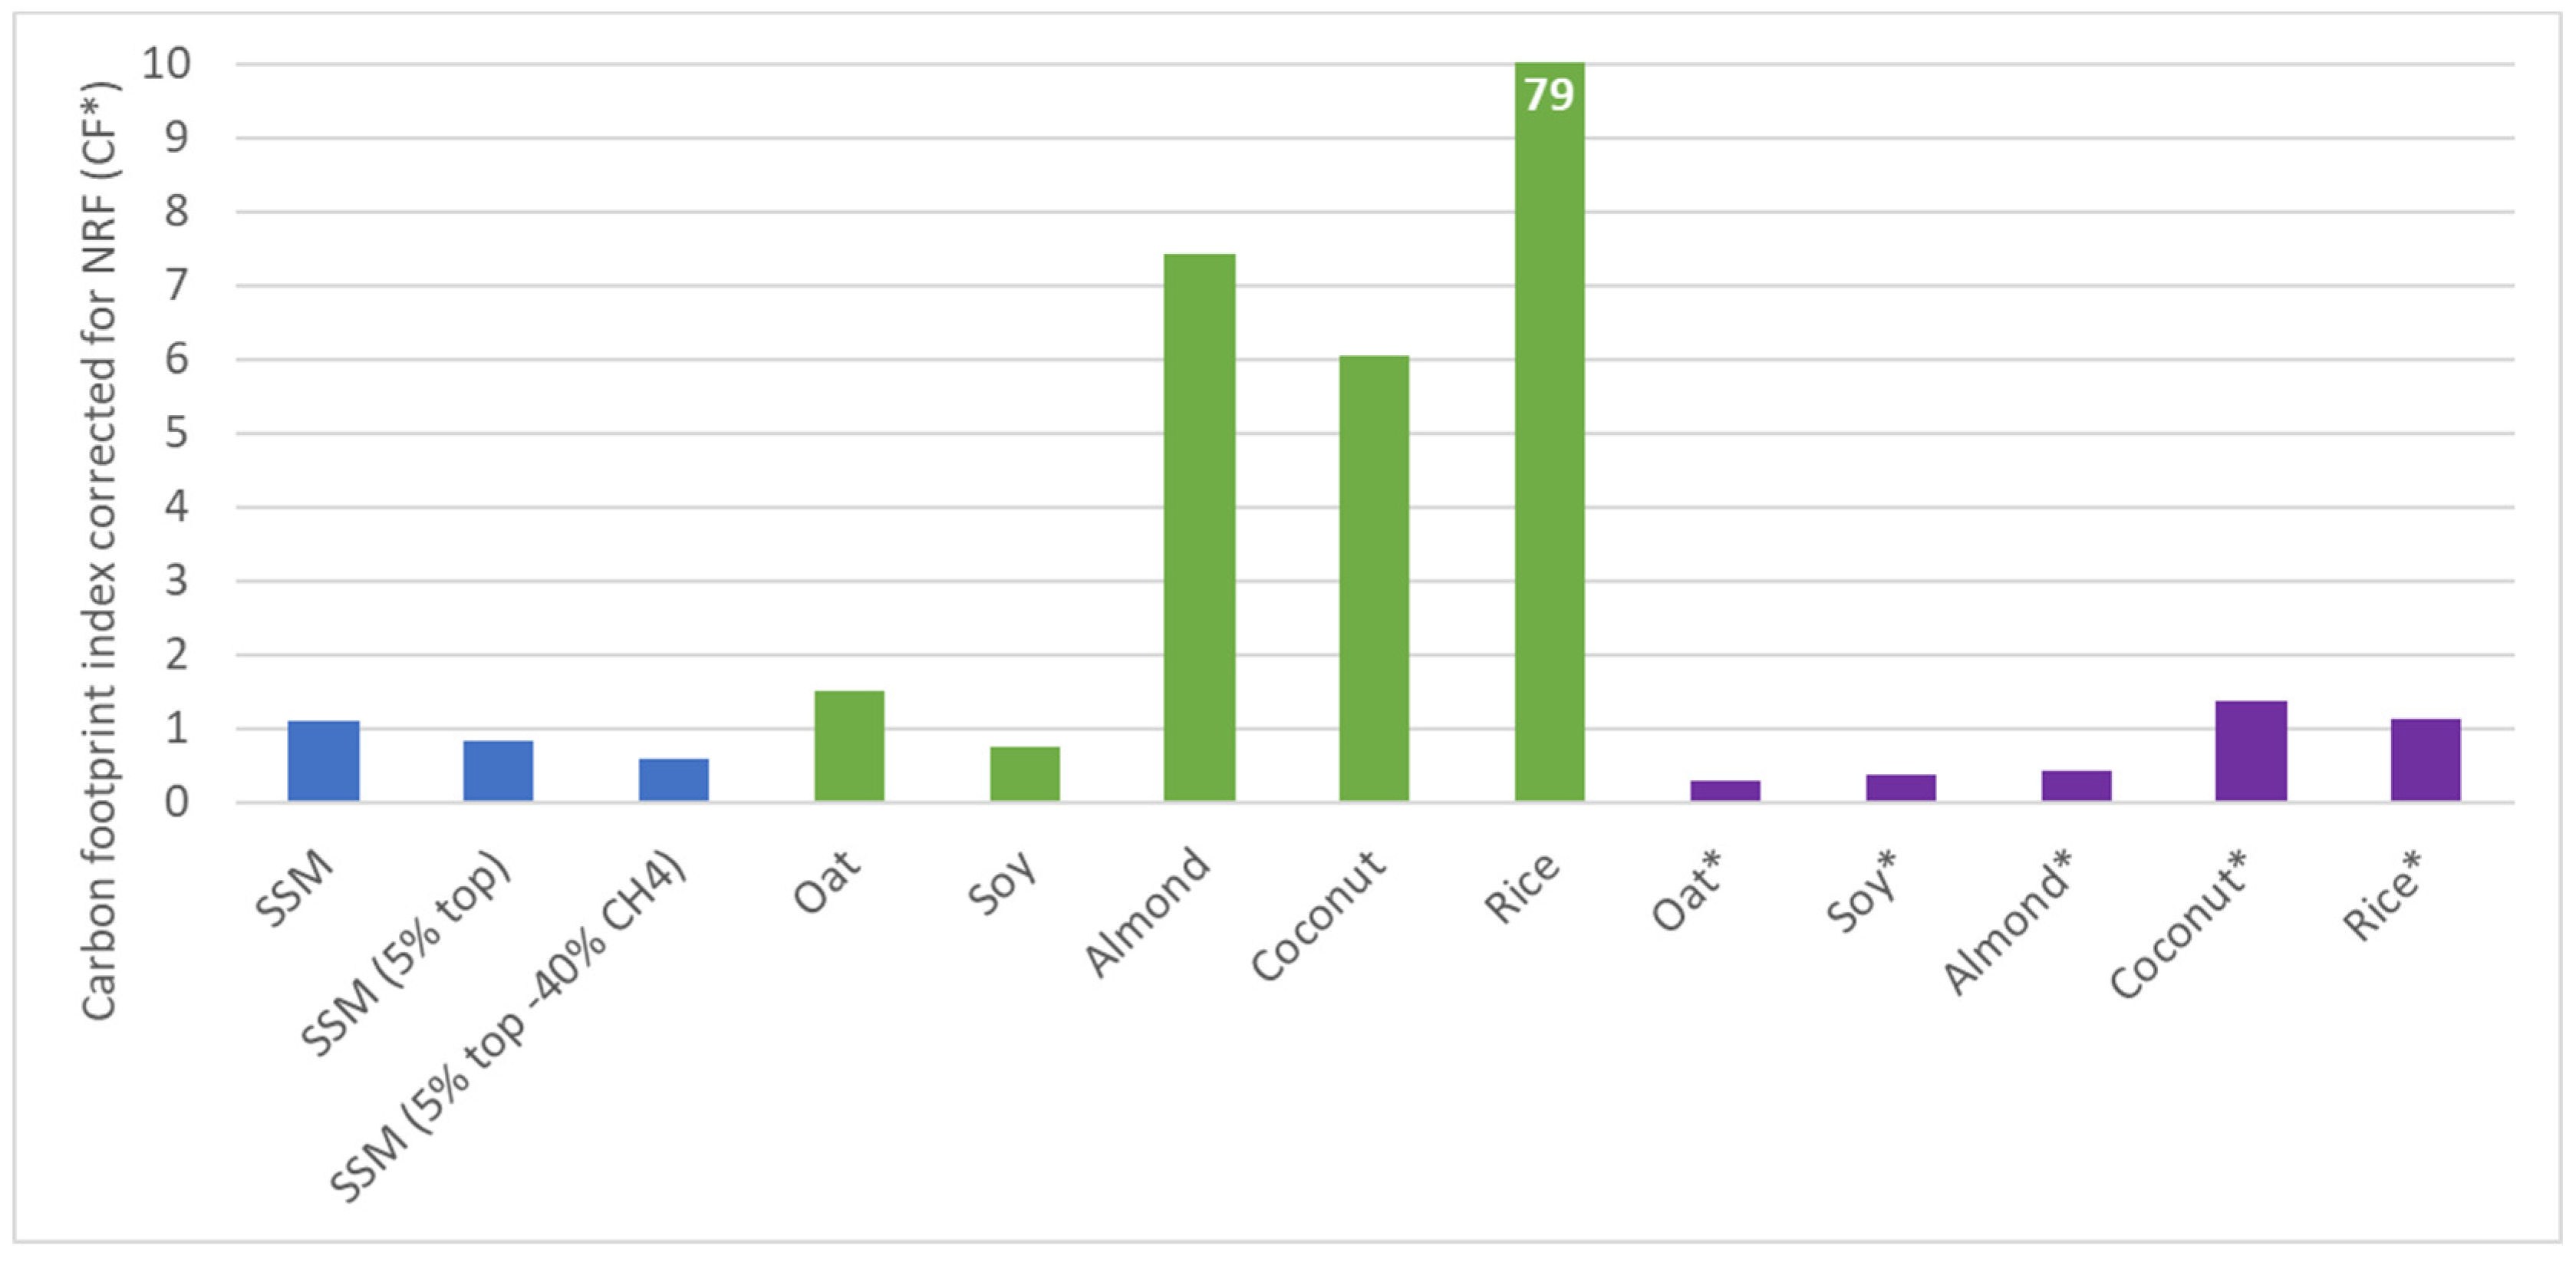
3.1. Carbon Footprint

In Figure 2, the calculated carbon footprints of semi-skimmed milk in the Netherlands and PBBs at factory gate are compared. In general, the footprint per kg of product is higher for skimmed milk, although new measures regarding farm management and feed additives for reduction in methane emission may result in comparable footprints per kg (0.55 kg CO2-eq). Another observation is that processing of PBBs results in three times higher emissions of GHG than with milk. For a limited part, this is caused by the high-temperature processing that is needed because of the heat-resistant microbial spores. The major part of processing is due harvesting and disclosure of the nutrients. The oat beverage shows an exception because of its very basic processing [45]. The higher contribution of packaging to the overall footprint with PBBs is primarily attributed to the utilization of smaller volumes on average.

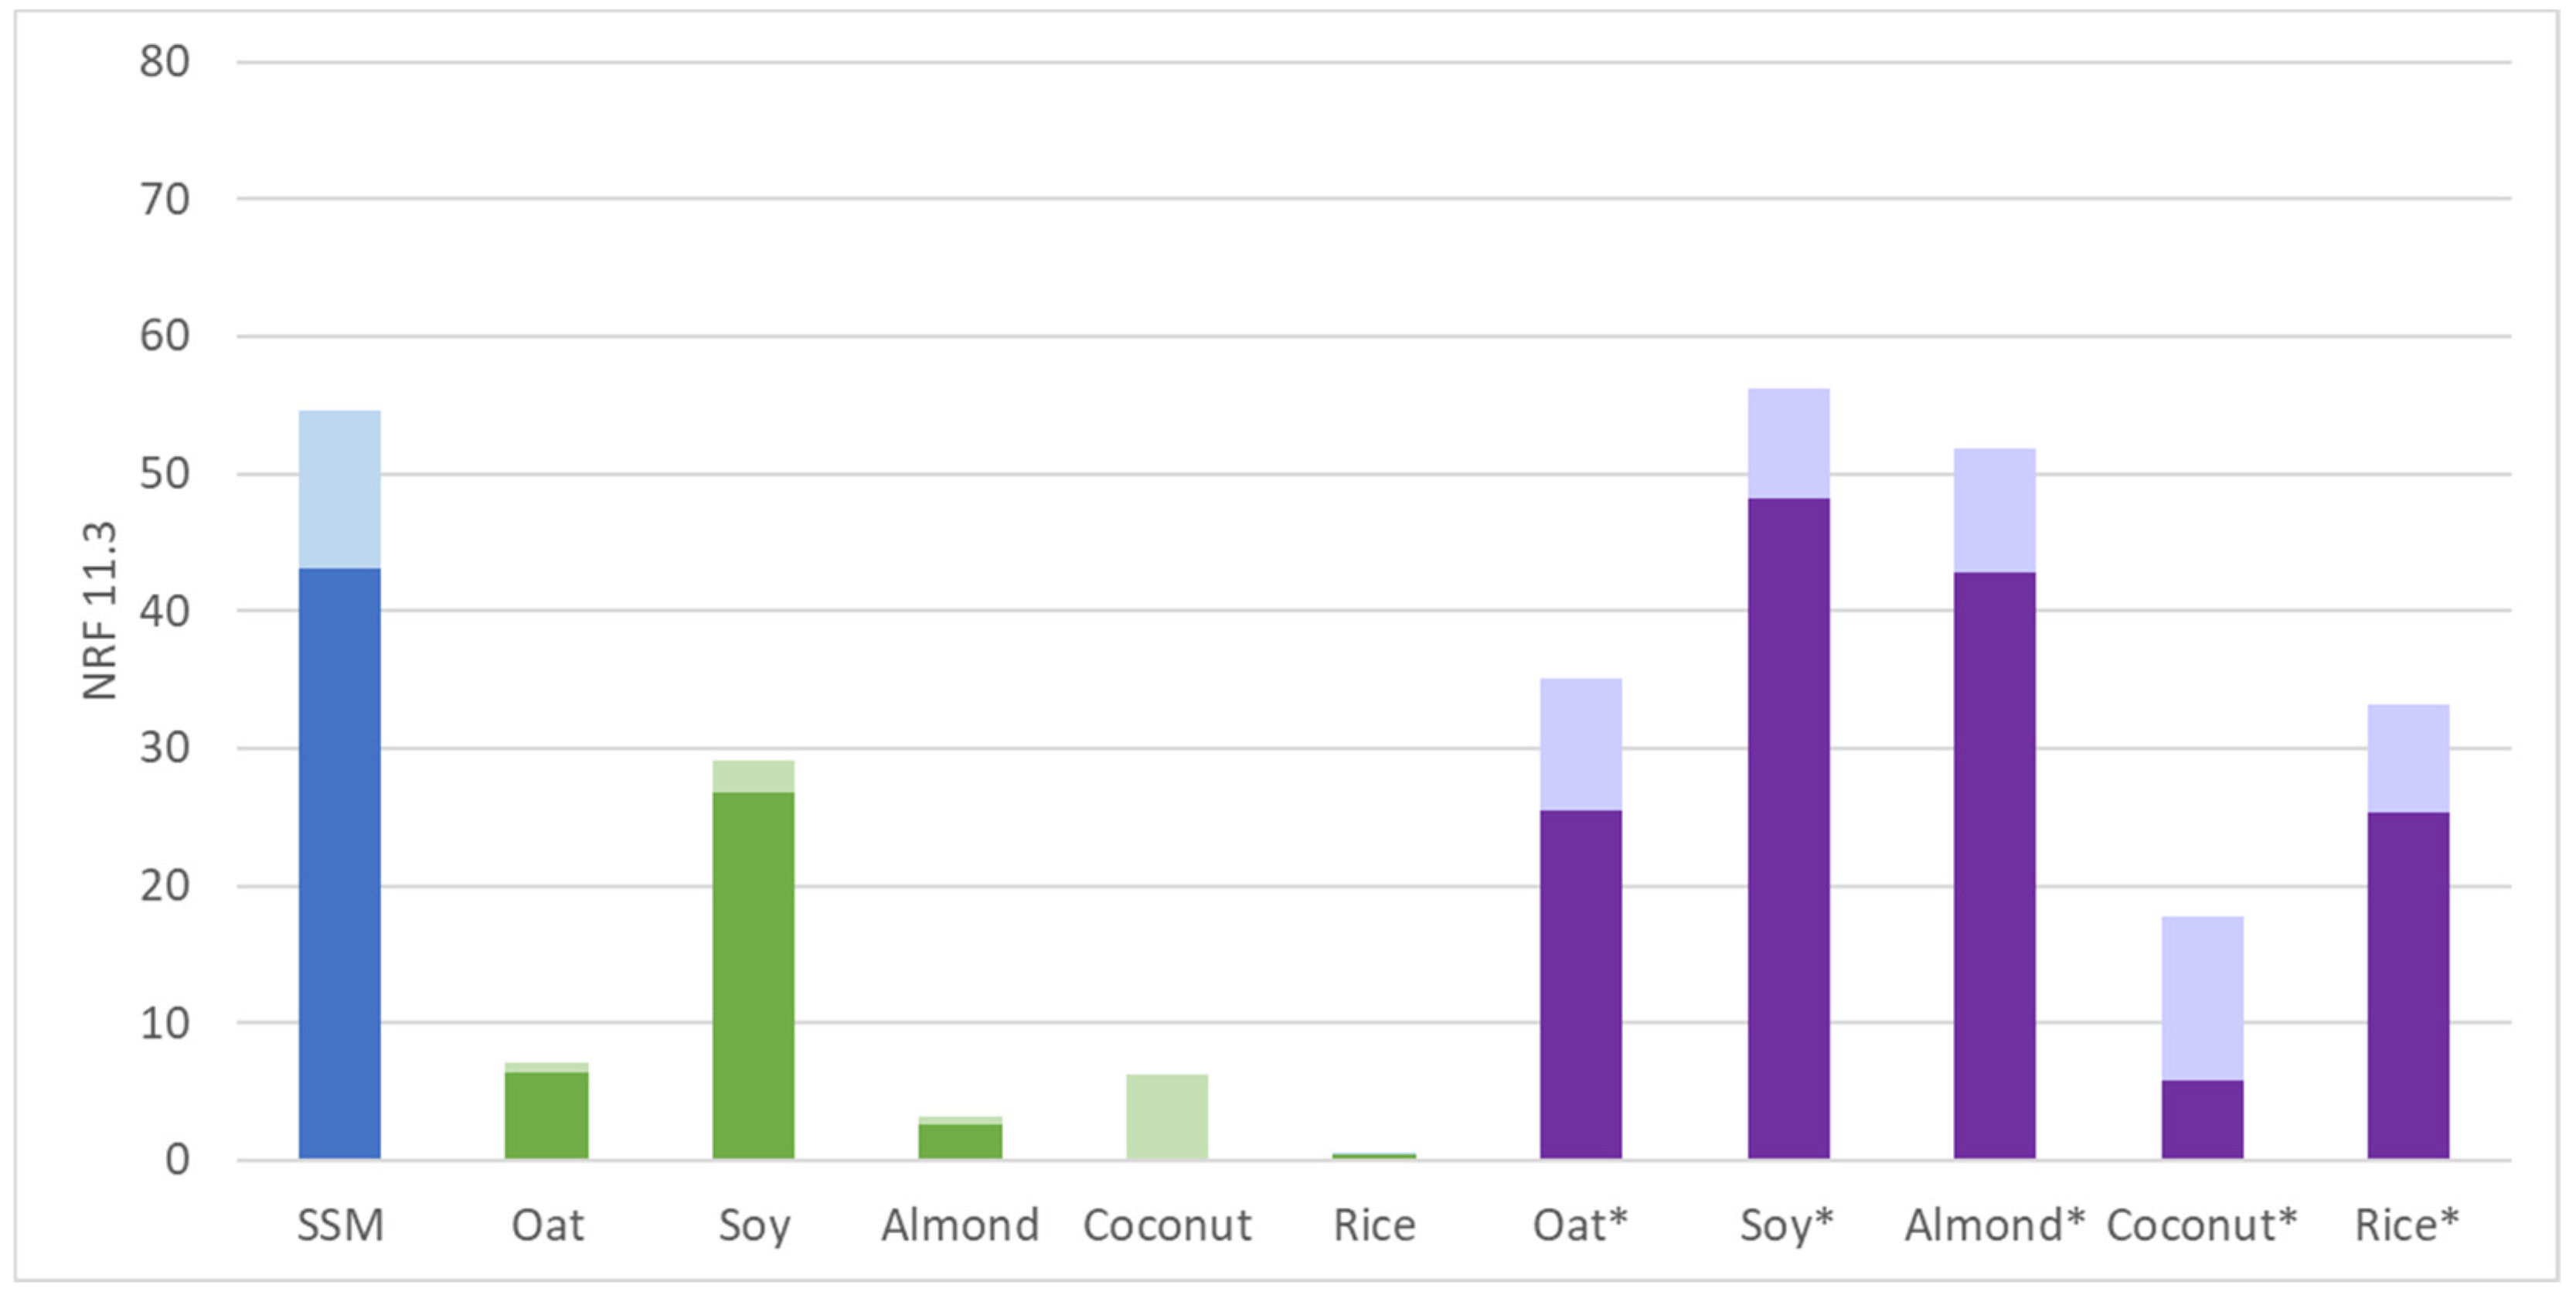
3.2. Nutrient Rich Food Scores

In order to incorporate nutritional value into sustainability evaluation, the concept of Nutrient Rich Food (NRF) scores was used. In Figure 3, the NRF11 and NRF 11.3 for each product is given, meaning the amount of 11 nutrients in one serving of 100 g. Since one serving is considered, the effect of the limiting nutrients is less relevant here. It can be concluded that semi-skimmed milk has roughly an NRF score 10 times higher than non-fortified PBBs (only base material and water). Soy beverage is an exception but has a 45% lower NRF score than milk. The difference between fortified PBBs and semi-skimmed milk is less. If additional nutrients are integrated into the NRF score, it can result in a minor adjustment in the ratio between semi-skimmed milk and PBBs. For instance, when considering 15 nutrients (including vitamin D, B1, B2, folate, mono unsaturated fat, and excluding Mg) instead of the original 11, the ratio shifts from 1.6 to 1.7 for NRF11 to NRF15 and from 2.0 to 1.9 for NRF11.3 to NRF15.3.

3.3. NRF Scores Corrected for Protein Quality

In fact, it is more appropriate to base the NRF scores on the amount of nutrients that is being absorbed by the human body. According to Equations (3)–(5), this can be performed for protein where protein quality is defined as the amount of indispensable amino acids (IAAs) compared to semi-skimmed milk. In Table 1, the used composition of all indispensable amino acids is given. In general, in relation to milk the corrected protein N* content of PBBs is 20–40% lower. Given the definition of N* (Equation (4)), this means a lower amount of IAAs. However, the impact on the NRF score is limited (<10%) since protein is only one of the 11 nutrients in the NRF score.
In Figure 4, the carbon footprint is shown when a minimal NRF* score of 50 (roughly the score of 100 g of semi-skimmed milk) is needed. In this way, the amount of nutrients is incorporated into the footprint of a product. Fortified PBBs have a similar footprint to semi-skimmed milk, especially when farm management and feed improvements that are in the proven concept phase are implemented. However, the non-fortified plant-based products show equal (soy) or much higher footprints. Figure 4 shows that PBBs on the market only provide a limited contribution to lowering the carbon footprint compared with a SSM, when the amount of nutrients are considered.

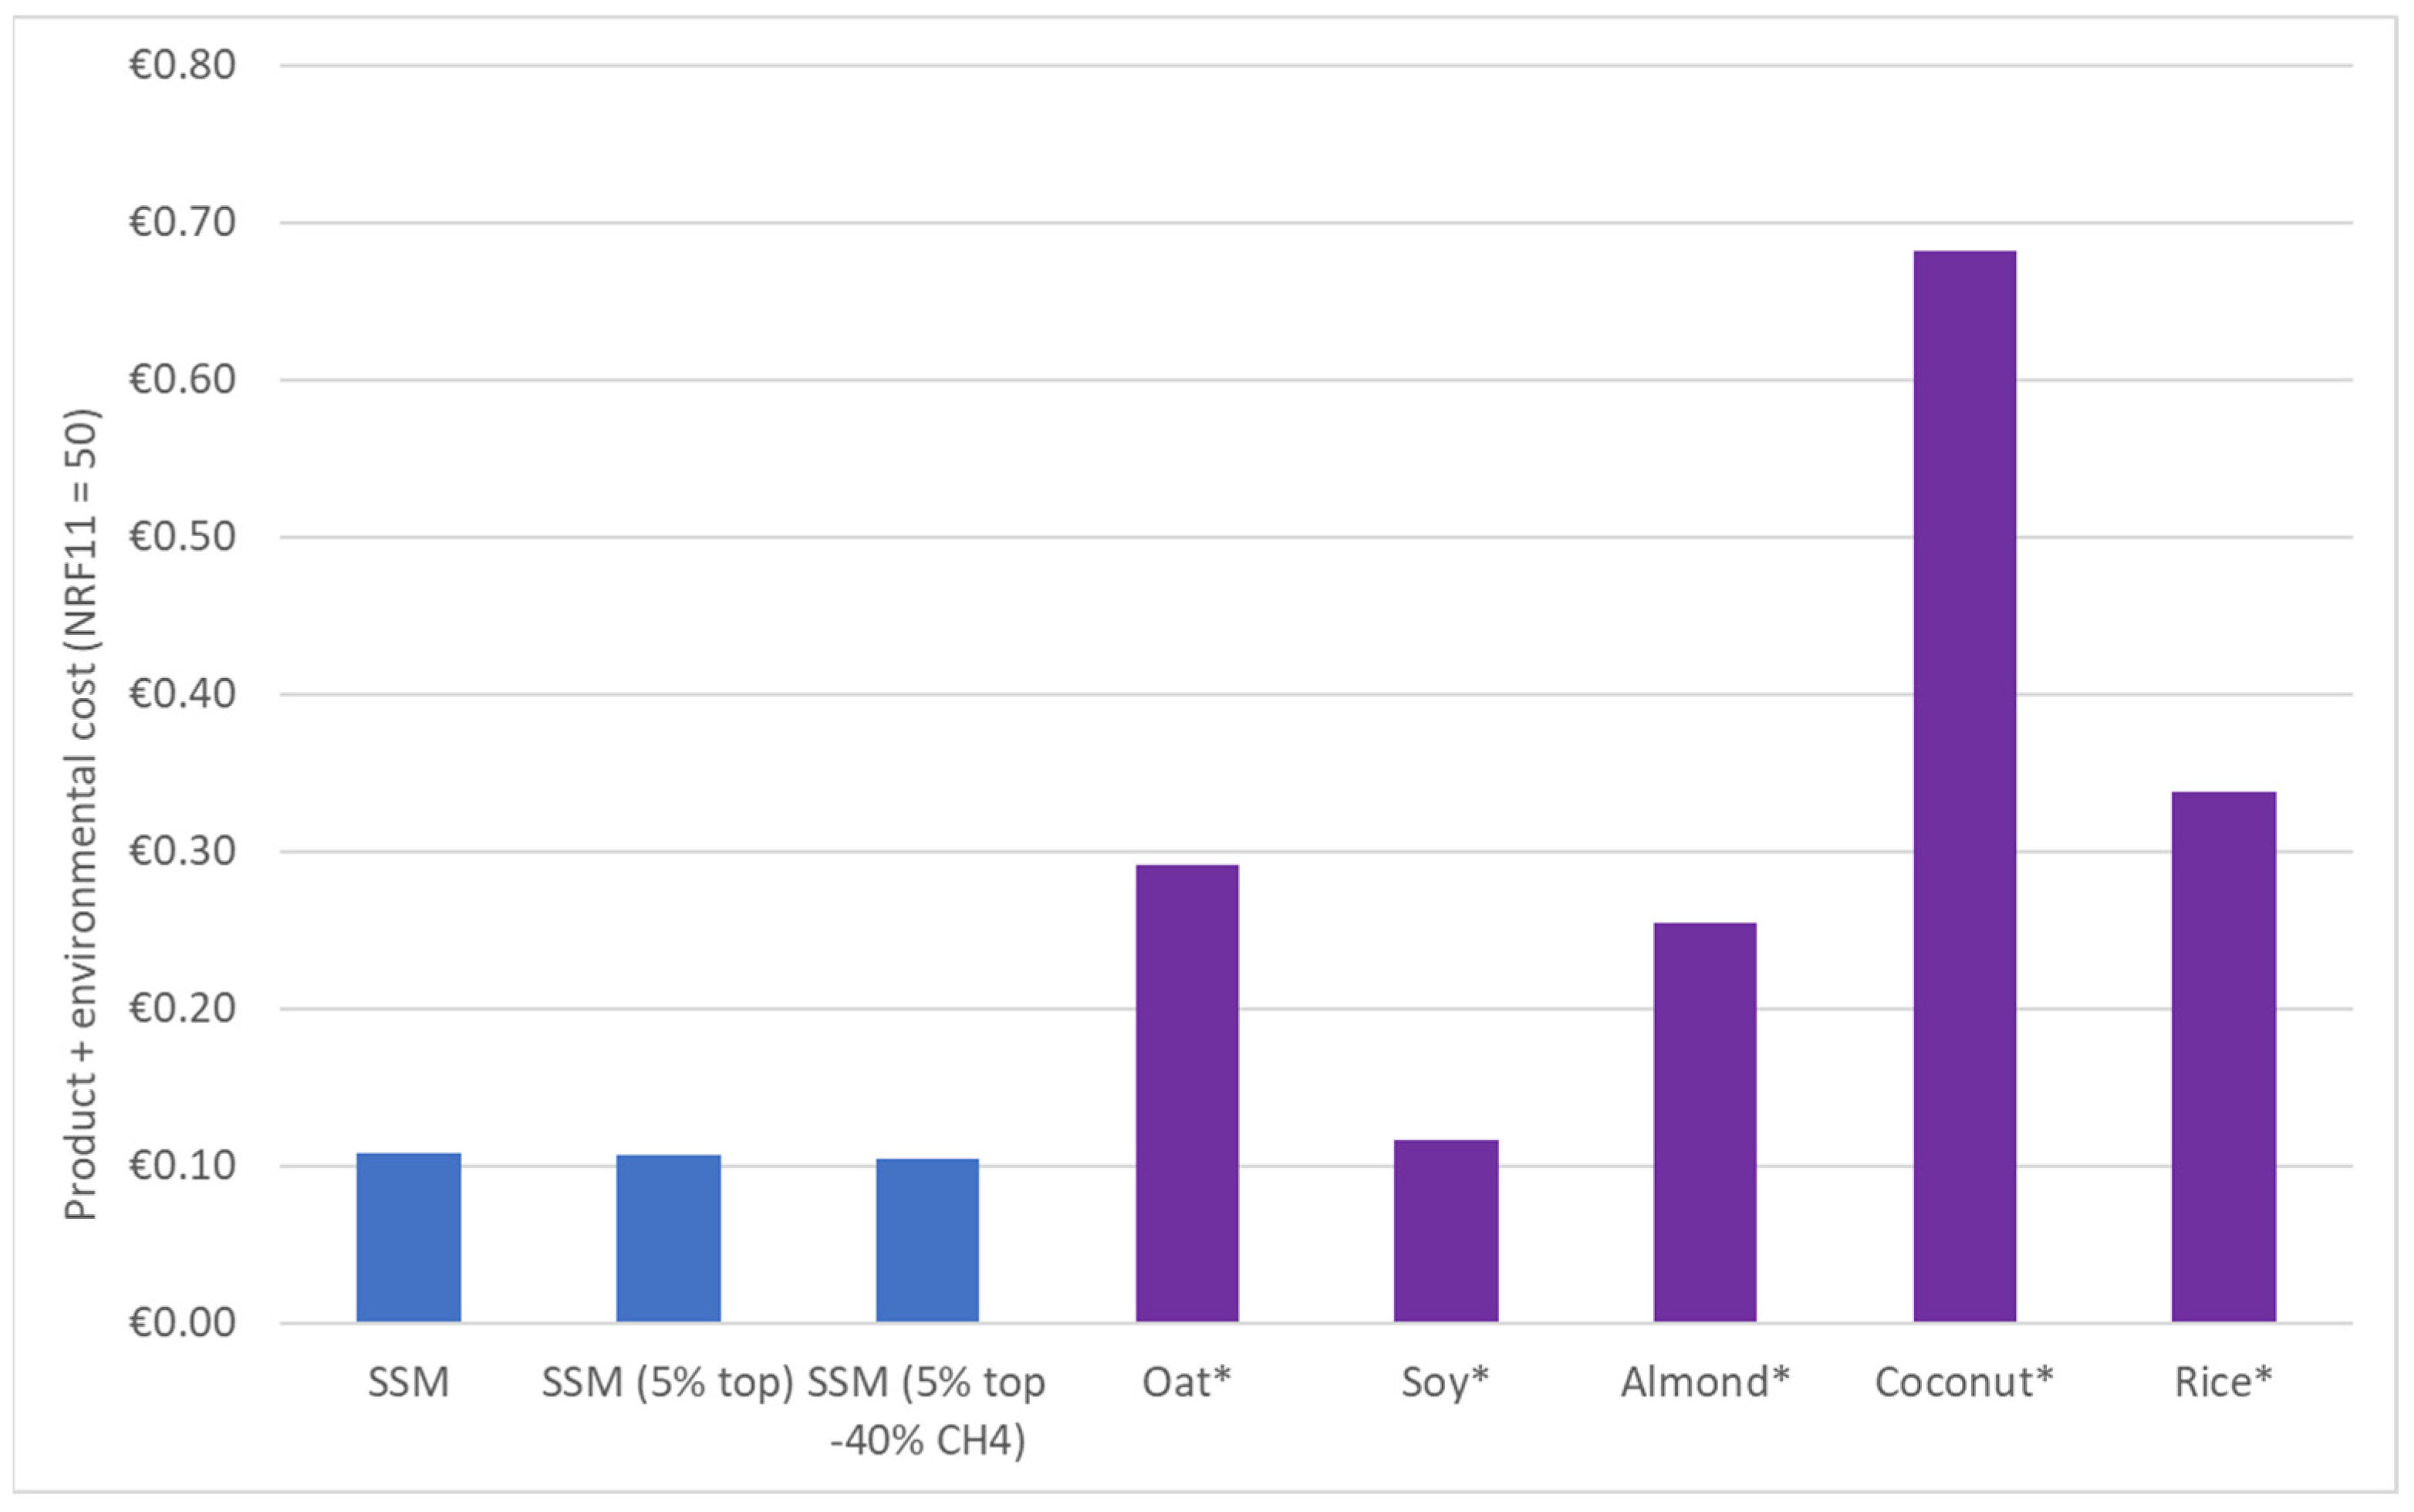
3.4. Environmental and Consumer Cost of Nutrients

In Figure 5, the environmental costs and costs for consumers for both semi-skimmed milk and PBBs to obtain a nutrient intake similar to milk, as outlined in Equation (6), are outlined. The conclusion is that semi-skimmed milk is the best choice to obtain a certain intake of nutrients, both from an environmental cost view as a consumer budget view. It should be noticed that the contribution of the cost for CO2-emission to the total costs is relatively low (i.e., 7% for milk, 1–3% for PBBs). The total costs of soy beverage are most close to that of milk. The combination of relatively high retail prices and lower amounts of nutrients leads to high total costs of other PBBs.

4. Discussion

The fact that the consumption of PBBs that are used as an alternative to milk is increasing, at least in the Western part of the word, could give rise to some concerns from a public health point of view. When bovine milk is replaced by common plant-based alternatives without any compensation from other food sources, individuals might consume an insufficient quantity of nutrients [11,12,14,49]. Nevertheless, it can be debated if a healthy diet is just a matter of summing up all the required micro and macro nutrients, as in the NRF score concept. From the literature, it is known that the bioactivity of an ingredient also depends on the food matrix, i.e., other components in the matrix which increase the bioactivity in the body. For example, lactose in bovine milk enhances the bioactivity of calcium and other minerals, whereas sugars in plants do not [50]. In addition, casein micelles stabilize calcium phosphate and form gels in the acidic environment of the stomach, slowing down digestion and results in more time to effectively digest the other nutrients [51]. Another concern is that PBBs may increase the intake of components that decreases the bioactivity of micronutrients such as minerals, for example, phytic acid in cereals [14]. In summary, from a health point of view, replacing a nutrient-rich product like bovine milk needs more than just replacing the original and adjusting diets. Given the complex interplay between food matrix components and bioactivity, future research should delve deeper into understanding the specific mechanisms (e.g., nutrient absorption, metabolism) through which various matrix components modulate nutrient bioavailability and effectiveness. Long-term clinical studies are required to draw solid conclusions on nutrient effectiveness and health impacts.
All the streams as indicated in Figure 1 should be quantified. However, at this moment, it is not possible to obtain well-determined and reproducible numbers for the carbon footprint of PBBs from open sources. Already, the amount of harvest losses and upstream chain waste is very unclear in most cases. As with milk, clear guidelines and a sufficient detail level should be applied and published.
Regarding evaluating the carbon footprint of milk and PBBs, it should be noted that this study makes a comparison between (non-fortified) milk, fortified PBBs, and PPBs purely based on their basic plant-based material such as soy and oats. Evaluating the NRF scores shows that the health benefit from the plant material itself, as indicated in the name of the product, is limited. In other words, from a nutrient point of view, oat-based products do not constitute a complete replacer of milk. This observation raises the concern that labeling these products as “milk” may be somewhat misleading. Even a lighter beverage as lemonade could also be a base for a fortified product with a high NRF score and a low carbon footprint. This underscores the argument against using the term “milk” for PBBs [52].
This study was primarily focused on assessing the environmental footprints of products, overlooking the footprint of the added nutrients in fortified PBBs. These nutrients come with their own production chains and footprints, depending on allocation methods used. While their direct contribution to the final footprint may seem small, collectively, they do influence it. Neglecting this aspect could lead to an incomplete assessment of PBBs’ environmental impact. To comprehensively evaluate, future studies should consider the environmental impacts of added nutrients, including resource inputs, energy consumption, and emissions.
Although semi-skimmed milk belongs to the group of food products with the best value for money, plant-based ingredients will be and must be part of the future diet. Given the growing world population and the associated worldwide need for more nutrients, including proteins [1], it is necessary to find an optimal use of the available land, ending up in an optimal mix of plant-based and animal-based food ingredients [53]. In addition to proteins, the relatively large amount of fibers in plant-based streams has a positive contribution to the world’s diet. Both from a carbon footprint and nutrition point of view, soy seems to have the highest potential to become a basis for sustainable PBBs in addition to milk. One issue is that plant-based ingredients are relatively highly processed. The contribution of processing with plant-based ingredients to carbon footprint is around 30% [54], while with semi-skimmed milk this is less than 10% [55]. However, since processing of plant-based materials towards ingredients is still emerging and on a relatively small scale, it might be expected that the processing part in the carbon footprint will decrease in the coming years. Another issue is related to the substantial influence of LUC associated with certain plant-based sources, such as soy, on the overall GHG emissions. While manufacturers are adopting sustainable cultivation practices for soy, it remains pertinent to acknowledge that increased soy consumption [56] inherently augments the mean global extent of LUC attributed to soy production.
The use of retail prices and ETS carbon prices is not a comprehensive method to compare the true costs by so-called true cost accounting methodologies. However, it is a transparent attempt to incorporate important drivers for consumers looking for sustainable and affordable food products. Moreover, recent development of true cost accounting methodologies shows that it is still difficult to compare the results obtained because of different methodologies used [57].
When developing products, it is crucial to prioritize the functionality, digestibility, and effectiveness of added nutrients within PBBs. Transparency with consumers regarding the nutritional composition, quantity of added nutrients, and potential health implications is essential. For instance, although plant-based alternatives may provide certain nutrients, they might not entirely replicate the nutritional advantages offered by products such as milk.

5. Conclusions

The evaluation of the sustainability of milk and PBBs incorporating nutrients and their bioactivity has shown that this subject is in need of a comprehensive investigation. Despite this, the reported data on carbon footprints and the amount of nutrients in PBBs offers opportunities for quantitative comparisons in terms of sustainability linked to nutrition. From this study, the following conclusions can be drawn. The carbon footprint of PBBs defined as per unit mass is lower than that of semi-skimmed milk. However, when considering the footprint relative to the nutrient content in non-fortified PBBs, semi-skimmed milk generally possesses a lower footprint. Only the soy-based beverage has a slightly lower footprint. With the utilization of advanced farm management and newly developed feed additives, the footprint of semi-skimmed milk is expected to match that of soy-based beverage. For fortified PBBs, the nutrient-based footprint of soy, oat, and almond-based beverages is lower than that of semi-skimmed milk, while coconut and rice exhibit higher footprints. These findings underscore the necessity of fortification to attain a reasonable sustainability footprint for PBBs. Furthermore, it indicates that, apart from soy, the plant-based materials themselves do not solely contribute to the health benefits in terms of nutrients. The comprehensive method used, which considers retail price, environmental costs, and nutrient content, demonstrates that, in terms of sustainability, choosing a serving of semi-skimmed milk remains the optimal choice. Following this, soy-based beverages represent the next best alternative.

Author Contributions

Conceptualization, P.d.J.; methodology, P.d.J.; formal analysis, P.d.J.; investigation, P.d.J. and A.N.v.W.; writing—original draft preparation, P.d.J.; writing—review and editing, P.d.J., A.N.v.W. and F.W.; visualization, P.d.J., A.N.v.W. and F.W.; supervision, P.d.J.; funding acquisition, P.d.J. All authors have read and agreed to the published version of the manuscript.

Funding

This research was funded by an unrestricted grant from the Dutch Dairy Association (Nederlandse Zuivel Organisatie) 2021–2023.

Institutional Review Board Statement

Not applicable.

Informed Consent Statement

Not applicable.

Data Availability Statement

The data presented in this study are available on request from the corresponding author.

Conflicts of Interest

The authors declare no conflicts of interest. The funder had no role in the design of the study; in the collection, analyses, or interpretation of data; in the writing of the manuscript; or in the decision to publish the results.

References

  1. FAO; GDP. Climate Change and the Global Dairy Cattle Sector—The Role of the Dairy Sector in a Low-Carbon Future; FAO: Rome, Italy, 2018; p. 36. [Google Scholar]
  2. Adewale, C.; Reganold, J.P.; Higgins, S.; Evans, R.D.; Carpenter-Boggs, L. Agricultural carbon footprint is farm specific: Case study of two organic farms. J. Clean. Prod. 2019, 229, 795–805. [Google Scholar] [CrossRef]
  3. Poore, J.; Nemecek, T. Reducing food’s environmental impacts through producers and consumers. Science 2018, 360, 987–992. [Google Scholar] [CrossRef]
  4. Persson, U.M.; Henders, S.; Cederberg, C. A method for calculating a land-use change carbon footprint (LUC-CFP) for agricultural commodities–applications to Brazilian beef and soy, Indonesian palm oil. Glob. Chang. Biol. 2014, 20, 3482–3491. [Google Scholar] [CrossRef]
  5. Liao, X.; Gerichhausen, M.J.; Bengoa, X.; Rigarlsford, G.; Beverloo, R.H.; Bruggeman, Y.; Rossi, V. Large-scale regionalised LCA shows that plant-based fat spreads have a lower climate, land occupation and water scarcity impact than dairy butter. Int. J. LCA 2020, 25, 1043–1058. [Google Scholar] [CrossRef]
  6. Clune, S.; Crossin, E.; Verghese, K. Systematic review of greenhouse gas emissions for different fresh food categories. J. Clean. Prod. 2017, 140, 766–783. [Google Scholar] [CrossRef]
  7. IPCC. Climate Change 2022: Impacts, Adaptation and Vulnerability. In Contribution of Working Group II to the Sixth Assessment Report of the Intergovernmental Panel on Climate Change; Pörtner, H.-O., Roberts, D.C., Tignor, M., Poloczanska, E.S., Mintenbeck, K., Alegría, A., Craig, M., Langsdorf, S., Löschke, S., Möller, V., et al., Eds.; Cambridge University Press: Cambridge, UK; New York, NY, USA, 2022; p. 3056. [Google Scholar] [CrossRef]
  8. Röös, E.; Garnet, T.; Watz, V.; Sjörs, C. The Role of Dairy and Plant-Based Dairy Alternatives in Sustainable Diets; SLU Future Food Reports 3, Swedish University of Agricultural Sciences, the research platform Future Food; SLU Future Food: Uppsala, Sweden, 2018. [Google Scholar]
  9. Schiano, A.N.; Harwood, W.S.; Gerard, P.D.; Drake, M.A. Consumer perception of the sustainability of dairy products and plant-based dairy alternatives. J. Dairy Sci. 2020, 103, 11228–11243. [Google Scholar] [CrossRef]
  10. Mintel Group Ltd. Milk and Non-Dairy Milk—US—October 2019. 2019. Available online: https://academic.mintel.com/display/919346/ (accessed on 19 December 2019).
  11. Kalyn, M.; Collard, M.D.; David, P.; McCormick, M.D. A nutritional comparison of cow’s milk and alternative milk products. Acad. Pediatr. 2020, 21, 1067–1069. [Google Scholar] [CrossRef]
  12. Walther, B.; Guggisberg, D.; Badertscher, R.; Egger, L.; Portmann, R.; Dubois, S.; Haldimann, M.; Kopf-Bolanz, K.; Rhyn, P.; Zoller, O.; et al. Comparison of nutritional composition between plant-based drinks and cow’s milk. Front. Nutr. 2022, 9, 988707. [Google Scholar] [CrossRef] [PubMed]
  13. McLaren, S.; Berardy, A.; Henderson, A.; Holden, N.; Huppertz, T.; Jolliet, O.; De Camillis, C.; Renouf, M.; Rugani, B.; Saarinen, M.; et al. Integration of Environment and Nutrition in Life Cycle Assessment of Food Items: Opportunities and Challenges; FAO: Rome, Italy, 2021. [Google Scholar] [CrossRef]
  14. Chalupa-Krebzdak, S.; Long, C.J.; Bohrer, B.M. Nutrient density and nutritional value of milk and plant-based milk alternatives. Int. Dairy J. 2018, 87, 84–92. [Google Scholar] [CrossRef]
  15. Smedman, A.; Lindmark-Mansson, H.; Drewnowski, A.; Edman, A.K.M. Nutrient density of beverages in relation to climate impact. Food Nut. Res. 2010, 54, 5170. [Google Scholar] [CrossRef] [PubMed]
  16. Drewnowski, A.; Rehm, C.D.; Martin, A.; Verger, E.O.; Voinnesson, M.; Imbert, P. Energy and nutrient density of foods in relation to their carbon footprint. Am. J. Clin. Nutr. 2015, 101, 184–191. [Google Scholar] [CrossRef] [PubMed]
  17. Van Dooren, C.; Douma, A.; Aiking, H.; Vellinga, P. Proposing a Novel Index Reflecting Both Climate Impact and Nutritional Impact of Food Products. Ecol. Econ. 2017, 131, 389–398. [Google Scholar] [CrossRef]
  18. Lukas, M.; Rohn, H.; Lettenmeier, M.; Liedtke, C.; Wiesen, K. The nutritional footprint—Integrated methodology using environmental and health indicators to indicate potential for absolute reduction of natural resource use in the field of food and nutrition. J. Clean. Prod. 2016, 132, 161–170. [Google Scholar] [CrossRef]
  19. Geburt, K.; Albrecht, E.H.; Pointke, M.; Pawelzik, E.; Gerken, M.; Traulsen, I. A comparative analysis of plant-based milk alternatives. Part 2: Environmental Impacts. Sustainability 2022, 14, 8424. [Google Scholar] [CrossRef]
  20. Tessari, P.; Lante, A.; Mosca, G. Essential amino acids: Master regulators of nutrition and environmental footprint? Sci. Rep. 2016, 6, 26074. [Google Scholar] [CrossRef] [PubMed]
  21. FAO. Global Food Losses and Food Waste—Extent, Causes and Prevention; FAO: Rome, Italy, 2011. [Google Scholar]
  22. RIVM, National Institute for Public Health and the Environment in the Netherlands. 2019. Available online: https://www.rivm.nl/voedsel-en-voeding/duurzaam-voedsel/database-milieubelasting-voedingsmiddelen (accessed on 10 September 2021).
  23. Bengoa, X.; Dubois, C.; Humbert, S. Product Environmental Footprint Category Rules for Dairy Products; European Dairy Association: Schuman, Brussels, 2018. [Google Scholar]
  24. Doornewaard, G.J.; Hoogeveen, M.W.; Jager, J.H.; Reijs, J.W.; Beldman, A.C.G. Sectorrapportage Duurzame Zuivelketen; Prestaties 2019 in perspectief; Report 2020-120; Wageningen Economic Research: Wageningen, The Netherlands, 2020; p. 210. ISBN 978-94-6395-681-9. [Google Scholar] [CrossRef]
  25. Lam, A.C.Y.; Can Karaca, A.; Tyler, R.T.; Nickerson, M.T. Pea protein isolates: Structure, extraction and functionality. Food Rev. Int. 2018, 34, 126–147. [Google Scholar] [CrossRef]
  26. Tanger, C.; Engel, J.; Kulozik, U. Influence of extraction conditions on the conformational alteration of pea protein extracted from pea flour. Food Hydrocoll. 2020, 107, 105949. [Google Scholar] [CrossRef]
  27. Möller, A.C.; van der Padt, A.; van der Goot, A.J. From raw material to mildly refined ingredient—Linking structure to composition to understand fractionation processes. J. Food Eng. 2021, 291, 110321. [Google Scholar] [CrossRef]
  28. Kyttä, V.; Roitto, M.; Astaptsev, A.; Saarinen, M.; Tuomisto, H.L. Review and expert survey of allocation methods used in life cycle assessment of milk and beef. Int. J. LCA 2022, 27, 191–204. [Google Scholar] [CrossRef]
  29. WHO; FAO; United Nations University. Protein and Amino acid Requirements in Human Nutrition; World Health Organisation technical report series 935; WHO Press: Geneva, Switzerland, 2007. [Google Scholar]
  30. Neumann, C.; Harris, D.M.; Rogers, L.M. Contribution of animal source foods in improving diet quality and function in children in the developing world. Nut. Res. 2002, 22, 193–220. [Google Scholar] [CrossRef]
  31. Ertl, P.; Knaus, W.; Zollitsch, W. An approach to including protein quality when assessing the net contribution of livestock to human food supply. Animal 2016, 10, 1883–1889. [Google Scholar] [CrossRef]
  32. Houx, J.H.; Wiebold, W.J.; Fritschi, F.B. Rotation and tillage affect soybean grain composition, yield, and nutrient removal. Field Crops Res. 2014, 164, 12–21. [Google Scholar] [CrossRef]
  33. Hulshof, T.G.; Bikker, P.; van der Poel, A.F.; Hendriks, W.H. Assessment of protein quality of soybean meal and 00-rapeseed meal toasted in the presence of lignosulfonate by amino acid digestibility in growing pigs and Maillard reaction products. J. Anim. Sci. 2016, 94, 1020–1030. [Google Scholar] [CrossRef]
  34. Herreman, L.; Nommensen, P.; Pennings, B.; Laus, M.C. Comprehensive overview of the quality of plant- and animal-sourced proteins based on the digestible indispensable amino acid score. Food Sci. Nutr. 2020, 8, 5379–5391. [Google Scholar] [CrossRef]
  35. FAO. Dietary Protein Quality Evaluation in Human Nutrition: Report of an FAO Expert Consultation; Food and Nutrition Paper 92; FAO: Rome, Italy, 2013; pp. 1–66. [Google Scholar]
  36. Philips, S.M. Current concepts and unresolved questions in dietary protein requirements and supplements in adults. Front. Nutr. 2017, 4, 1–10. [Google Scholar] [CrossRef]
  37. Adhikari, S.; Schop, M.; de Boer, I.J.M.; Huppertz, T. Protein Quality in Perspective: A Review of Protein Quality Metrics and Their Applications. Nutrients 2022, 14, 947. [Google Scholar] [CrossRef] [PubMed]
  38. European Commission. Available online: https://ec.europa.eu/clima/eu-action/eu-emissions-trading-system-eu-ets_en (accessed on 11 August 2022).
  39. Ember. Available online: https://ember-climate.org/data/data-tools/carbon-price-viewer/ (accessed on 11 August 2022).
  40. Singh-Povel, C.; Van Gool, M.; Gual Rojas, A.; Bragt, M.; Kleinnijenhuis, A.; Hettinga, K. Nutritional content, protein quantity, protein quality and carbon footprint of plant-based drinks and semi-skimmed milk in the Netherlands and Europe. Public Health Nutr. 2022, 25, 1416–1426. [Google Scholar] [CrossRef] [PubMed]
  41. FAO. Available online: https://www.fao.org/economic/the-statistics-division-ess/methodology/methodology-systems/crops-statistics-concepts-definitions-and-classifications/en/ (accessed on 14 November 2022).
  42. Fouts, J.Q.; Honan, M.C.; Roque, B.M.; Tricarico, J.M.; Kebreab, E. Enteric methane mitigation interventions. Transl. Anim. Sci. 2022, 6, txac041. [Google Scholar] [CrossRef] [PubMed]
  43. De Haas, Y.; Veerkamp, D.R.; de Jong, G.; Aldridge, M.N. Selective breeding as a mitigation tool for methane emissions from dairy cattle. Animal 2021, 15, 100294. [Google Scholar] [CrossRef] [PubMed]
  44. Voedingswaardetabel. Available online: https://www.voedingswaardetabel.nl (accessed on 9 August 2022).
  45. Oatly.com. Available online: https://www.oatly.com/nl-nl/stuff-we-make/ (accessed on 9 August 2022).
  46. Alpro.com. Available online: https://www.alpro.com/healthprofessional/benl/producten/drinks (accessed on 9 August 2022).
  47. Patil, U.; Benjakul, S. Coconut Milk and Coconut Oil: Their Manufacture Associated with Protein Functionality. J. Food Sci. 2018, 83, 2019–2027. [Google Scholar] [CrossRef] [PubMed]
  48. House, J.D.; Hill, K.; Neufeld, J.; Franczyk, A.; Nosworthy, M.G. Determination of the protein quality of almonds (Prunus dulcis L.) as assessed by in vitro and in vivo methodologies. Food Sci. Nutr. 2019, 7, 2932–2938. [Google Scholar] [CrossRef] [PubMed]
  49. Fulgoni, V.L.; Keast, D.R.; Auestad, N.; Quann, E.E. Nutrients from dairy foods are difficult to replace in diets of Americans: Food pattern modeling and an analyses of the national health and nutrition examination survey 2003-2006. Nutr. Res. 2011, 31, 759–765. [Google Scholar] [CrossRef] [PubMed]
  50. Miller, D.D. Calcium in the diet: Food sources, recommended intakes, and nutritional bioavailability. Adv. Food Nutr. Res. 1989, 33, 103–156. [Google Scholar] [CrossRef]
  51. Lambers, T.T.; Van Den Bosch, W.G.; De Jong, S. Fast and slow proteins: Modulation of the gastric behavior of whey and casein in vitro. Food Dig. 2013, 4, 1–6. [Google Scholar] [CrossRef]
  52. Adamaszwili, K. “Why a soy drink cannot be called milk” EU Court of Justice highlights the importance of protected dairy terms. Int. Dairy Mag. 2017, 6–7, 20–21. [Google Scholar]
  53. Lal, R. Feeding 11 billion on 0.5 billion hectare of area under cereal crops. Food Energy Secur. 2016, 5, 239–251. [Google Scholar] [CrossRef]
  54. Detzel, A.; Krüger, M.; Busch, M.; Blanco-Gutiérrez, I.; Varela, C.; Manners, R.; Bez, J.; Zannini, E. Life cycle assessment of animal-based foods and plant-based protein-rich alternatives: An environmental perspective. J. Sci. Food Agric. 2021, 102, 5098–5110. [Google Scholar] [CrossRef] [PubMed]
  55. Sevenster, M.; de Jong, F. A sustainable Dairy Sector: Global, Regional and Life Cycle Facts and Figures on Greenhouse-Gas Emissions; CE Delft: Delft, The Netherlands, 2008. [Google Scholar]
  56. Statista. Available online: https://www-statista-com.hvhl.idm.oclc.org/statistics/263926/soybean-production-in-selected-countries-since-1980/ (accessed on 29 August 2023).
  57. De Adelhart Toorop, R.; Yates, J.; Watkins, M.; Bernard, J.; de Groot Ruiz, A. Methodologies for true cost accounting in the food sector. Nat. Food 2021, 2, 655–663. [Google Scholar] [CrossRef] [PubMed]
Figure 1. Schematic representation of the so-called production chain approach where the footprint of a product or ingredient is related to valuable or essential (micro)nutrients absorbed to the body of consumers.
Sustainability 16 01919 g001
Figure 2. Carbon footprint of pasteurized semi-skimmed milk (SSM) and UHT-treated PBBs (without fortification) at factory gate. Carbon footprint of pasteurized semi-skimmed milk (SSM) and UHT-treated PBBs plant-based drinks (without fortification) at factory gate. Data of SSM include data from top 5% best farmers regarding low emissions in the Netherlands and the impact of any future measures (e.g., feed additives) on reduction of CH4 emission.
Sustainability 16 01919 g002
Figure 3. NRF scores of semi-skimmed milk (SSM, blue) and PBBs at factory gate, both fortified (purple) and non-fortified (green). Light colors are NRF scores without limiting ingredients. Asterix represents fortified products.
Sustainability 16 01919 g003
Figure 4. Carbon footprint when an NRF11 = 50 (similar to milk) needs to be obtained for SSM (blue), non-fortified PBBs (green) and fortified PBBs (purple). The value for rice (79) exceeds the maximum of the y-axis. Asterix represents fortified products.
Sustainability 16 01919 g004
Figure 5. Environmental costs and costs for consumers for both semi-skimmed milk (SSM) and PBBs to obtain an intake of nutrients similar to milk according to Equation (6). Price per ton CO2-eq emission is EUR 85. Prices products based on Albert Heijn prices (The Netherlands, www.ah.nl, accessed on 11 August 2022). Asterix represents fortified products.
Sustainability 16 01919 g005
Table 1. Corrected protein content and derived NRF scores for semi-skimmed milk and PBBs based on amount of IAAs compared to semi-skimmed milk as indicated by * (see also Section 2.3.2). Differences to non-corrected values are show between brackets [35,47,48].
ProductProtein (g/100 g)IAAs (mg/g Protein) N 100 g , protein * Corrected NRF Score (NRF11.3*) for Non-Fortified Products
HisIleLeuLysSAAAAAThrTrpVal
Semi-skimmed milk3.428649383521055114683.454.6
Oat beverage1.02134692336772810380.62 (38%)6.5 (9%)
Soy beverage3.02542776024884012472.31 (23%)27.9 (4%)
Almond beverage0.42029663045115299340.28 (30%)3.0 (7%)
Coconut beverage0.1184274475393250540.08 (20%)4.0 (1%)
Rice beverage0.12140773442943411540.08 (20%)0.5 (7%)
Disclaimer/Publisher’s Note: The statements, opinions and data contained in all publications are solely those of the individual author(s) and contributor(s) and not of MDPI and/or the editor(s). MDPI and/or the editor(s) disclaim responsibility for any injury to people or property resulting from any ideas, methods, instructions or products referred to in the content.

