Article

Research of the Impact of Hydrogen Metallurgy Technology on the Reduction of the Chinese Steel Industry’s Carbon Dioxide Emissions

College of Economics and Management, Taiyuan University of Technology, Taiyuan 030024, China
*
Author to whom correspondence should be addressed.
Sustainability 2024, 16(5), 1814; https://doi.org/10.3390/su16051814
Submission received: 20 January 2024 / Revised: 16 February 2024 / Accepted: 21 February 2024 / Published: 22 February 2024
(This article belongs to the Special Issue Renewable Energy and Sustainable Energy Systems)

Abstract

:
The steel industry, which relies heavily on primary energy, is one of the industries with the highest CO2 emissions in China. It is urgent for the industry to identify ways to embark on the path to “green steel”. Hydrogen metallurgy technology uses hydrogen as a reducing agent, and its use is an important way to reduce CO2 emissions from long-term steelmaking and ensure the green and sustainable development of the steel industry. Previous research has demonstrated the feasibility and emission reduction effects of hydrogen metallurgy technology; however, further research is needed to dynamically analyze the overall impact of the large-scale development of hydrogen metallurgy technology on future CO2 emissions from the steel industry. This article selects the integrated MARKAL-EFOM system (TIMES) model as its analysis model, constructs a China steel industry hydrogen metallurgy model (TIMES-CSHM), and analyzes the resulting impact of hydrogen metallurgy technology on CO2 emissions. The results indicate that in the business-as-usual scenario (BAU scenario), applying hydrogen metallurgy technology in the period from 2020 to 2050 is expected to reduce emissions by 203 million tons, and make an average 39.85% contribution to reducing the steel industry’s CO2 emissions. In the carbon emission reduction scenario, applying hydrogen metallurgy technology in the period from 2020 to 2050 is expected to reduce emissions by 353 million tons, contributing an average of 41.32% to steel industry CO2 reduction. This study provides an assessment of how hydrogen metallurgy can reduce CO2 emissions in the steel industry, and also provides a reference for the development of hydrogen metallurgy technology.

1. Introduction

The iron and steel industry is an important pillar of China’s national economy and provides an important foundation for modern industry in the country. The industry, which is currently dominated by long processes with high carbon emission intensity, is the manufacturing industry with the highest carbon emissions and has high output, high energy consumption, and high total carbon emissions [1]. Hydrogen energy metallurgy technology, however, provides a new mechanism for achieving the goal of decarburization. The core principle of hydrogen energy metallurgy is to replace the reducing agent coke in traditional ironmaking with hydrogen, to fundamentally eliminate CO2 emissions in iron and steel production. It is considered an effective emission reduction technology in the iron and steel industry [2].
China has issued many important programmatic documents to guide the development of hydrogen metallurgy. In 2021, the “Guiding Opinions on Promoting the High-quality Development of the Iron and Steel Industry” clarified that the current development of hydrogen energy metallurgy is a key technical route for the high-quality development of China’s iron and steel industry. In 2022, the implementation guide for energy saving and carbon reduction transformation and upgrading of the iron and steel industry clearly proposed the need to focus on low-carbon frontier technologies, such as direct reduction ironmaking of by-product coke oven gas or natural gas; oxygen-enriched or hydrogen-rich smelting of the blast furnace; smelting reduction and hydrogen smelting; and conducting pilot demonstrations of industrialization.
Previous studies have analyzed the factors influencing carbon emissions in China’s steel industry by using the logarithmic mean divisia index (LMDI) [3,4,5,6], production-theoretical decomposition analysis (PDA) [7,8,9], structural decomposition analysis (SDA) [10,11], and other methods. China’s proposed “double carbon” goal of both achieving peak carbon use and carbon neutrality has resulted in the low-carbon transformation path of the steel industry has become a research field that engages researchers from across the world. Scholars have proposed specific and implementable carbon emission reduction measures and programs that use multiple perspectives, and have evaluated the effectiveness of different paths toward carbon emission reduction in the steel industry [12,13,14]. Some scholars have applied a technical perspective to discuss a carbon emission reduction path for the industry [15,16,17]. Hydrogen metallurgy technology, in particular, has attracted significant research attention [18,19,20]. For example, Wang et al. found that the industrial by-product hydrogen–hydrogen-based shaft furnace–direct reduction technology may be a key transition technology in the short term. In the long term, if the green hydrogen-based direct reduction iron technology reaches 80% penetration across the industry, carbon emissions are expected to be reduced by 90–100% [21]. Those studies separately measured the emission reduction effect of hydrogen metallurgy technology by comparing it to ordinary blast furnace ironmaking technology. Studies have not yet dynamically projected the overall impact of the large-scale development of hydrogen metallurgy technology on the steel industry’s carbon dioxide emissions.
To address these topics, this study considers changes in the power supply structure and hydrogen production mode, constructing a carbon dioxide emission reduction measurement model based on hydrogen metallurgy technology use in the iron and steel industry. The study then establishes a business-as-usual (BAU) scenario and a carbon emission reduction scenario, and analyzes the changes in the development scale of hydrogen metallurgy technology in different scenarios, before assessing the resulting impact on carbon dioxide emissions in the iron and steel industry.
This study offers two key innovations. First, the study constructs a measurement model of CO2 emission reduction in this key industry, which is based on hydrogen metallurgy technology. Although existing research has reached a consensus on the impact of power structures and hydrogen production methods on the emission reduction effect of hydrogen metallurgy technology, it has not yet been included in the calculation of the overall CO2 emission reduction effect of hydrogen metallurgy technology. In drawing on the TIMES model to consider changes in power supply structure and hydrogen production technology, this study constructs a hydrogen metallurgy model for China’s steel industry.
Second, the study quantitatively evaluates the development scale of hydrogen metallurgy technology, and considers its effect on CO2 emission reduction in the iron and steel industry. Previous research has not dynamically analyzed the overall impact of the large-scale development of hydrogen metallurgy technology on the industry’s CO2 emissions. This paper uses a scenario analysis to evaluate the development scale of hydrogen metallurgy technology and quantitatively measures the impact of applying hydrogen metallurgy technology to contribute to emission reductions in different scenarios.
The rest of this paper is organized as follows. Section 2 provides an overview of the research. Section 3 describes the model framework, methodology, and scenarios. Section 4 discusses the results, and Section 5 presents the conclusions.

2. Literature Review

The three main hydrogen metallurgical technology paths currently include hydrogen-rich blast furnace technology, hydrogen-based shaft furnace–direct reduction technology, and hydrogen-based smelting reduction technology. Of these, hydrogen-rich blast furnace technology and hydrogen-based shaft furnace–direct reduction technology are considered to be two feasible hydrogen metallurgical technologies with significant potential to reduce emissions [22]. Ren et al. and Quader et al. developed a comprehensive method to analyze the carbon emission reduction path of the iron and steel industry in detail. These studies showed that long term effective solution paths include the development and deployment of carbon capture, utilization and storage (CCUS), hydrogen metallurgy, high temperature waste heat recovery, and other breakthrough technologies [18,19]. Weigel et al. also determined that hydrogen-based direct reduction ironmaking is a promising production route by using multi-standard analysis (including of the economy, safety, ecology, society, and politics) [23].
Many scholars have engaged in quantitative research of the emission reduction effect of hydrogen metallurgy technology, and many scholars have studied and quantified the emission reduction effect of hydrogen metallurgy. Mohsenzadeh et al. and Yilmaz et al. used Aspen Plus to simulate changes in energy structure and production parameters, and identified that the direct reduction (DR) process reduced energy consumption by 13.71% and carbon emissions by 9.55%. They showed that using hydrogen as an auxiliary reducing agent for blast furnaces can reduce carbon emissions by 21.4% [22,24]. Abhinav et al. created a Python-based material and energy flow model, finding that a short process of hydrogen-based direct reduction and electric arc furnaces can reduce carbon emissions from European Union (EU) steel manufacturing by more than 35% [25]. Li et al. found that, when compared to the blast furnace-alkaline oxygen furnace process, the hydrogen-rich shaft furnace–electric furnace process can save energy by 39.79% and reduce carbon emissions by 45.42% [26]. Chen et al. evaluated the direct reduction-iron-electric furnace by using CO2-CH4 dry reforming technology, concluding that the technology can, compared to the blast furnace-converter, achieve 136 kg CO2 reduction per ton of steel [27]. Li et al. used the life cycle analysis method to determine that the steel production of shaft furnace–electric furnace by using coal-to-gas technolocan which can, compared to a blast furnace-converter, reduce carbon emissions by 58.1% and energy consumption by 60.6% [28]. Katharina et al. found that using hydrogen as a reducing agent can, compared to natural gas, reduce direct carbon emissions by up to 91% [29].
In addition, indirect carbon dioxide emissions from the hydrogen production process also affect the emission reductions of hydrogen metallurgy technology. Although hydrogen energy is a clean energy, China currently mainly produces hydrogen from fossil energy and industrial by-products, which produces carbon emissions [16,30,31,32,33].
In summary, previous studies focused on the emission reduction effect of hydrogen metallurgy technology have only measured the emission reduction effect of hydrogen-rich blast furnace ironmaking technology separately, or have compared hydrogen-based shaft-furnace–direct reduction technology to ordinary blast furnace ironmaking technology. Studies have not dynamically analyzed the overall impact of the large-scale development of hydrogen metallurgy technology on the future carbon dioxide emissions of the iron and steel industry. Second, although existing studies have reached a consensus on the impact of hydrogen production methods on the emission reduction effect of hydrogen metallurgy technology, they have not included a calculation of the technology’s overall carbon dioxide emission reduction effect.
To address these current shortcomings, we use the TIMES model to simulate the development of the steel industry and the application of hydrogen metallurgy technology. This study considers changes in the power supply structure and the choice of hydrogen production technology. We first set the BAU scenario and carbon emission reduction scenario to analyze the technological path of iron and steel production, and assess the contribution of hydrogen metallurgy to carbon dioxide emission reductions in different scenarios. This study provides a more comprehensive assessment of how hydrogen metallurgy contributes to reductions of the steel industry’s carbon dioxide emissions, and provides a more effective and accurate reference for policy development.

3. Methodology and Scenario Development

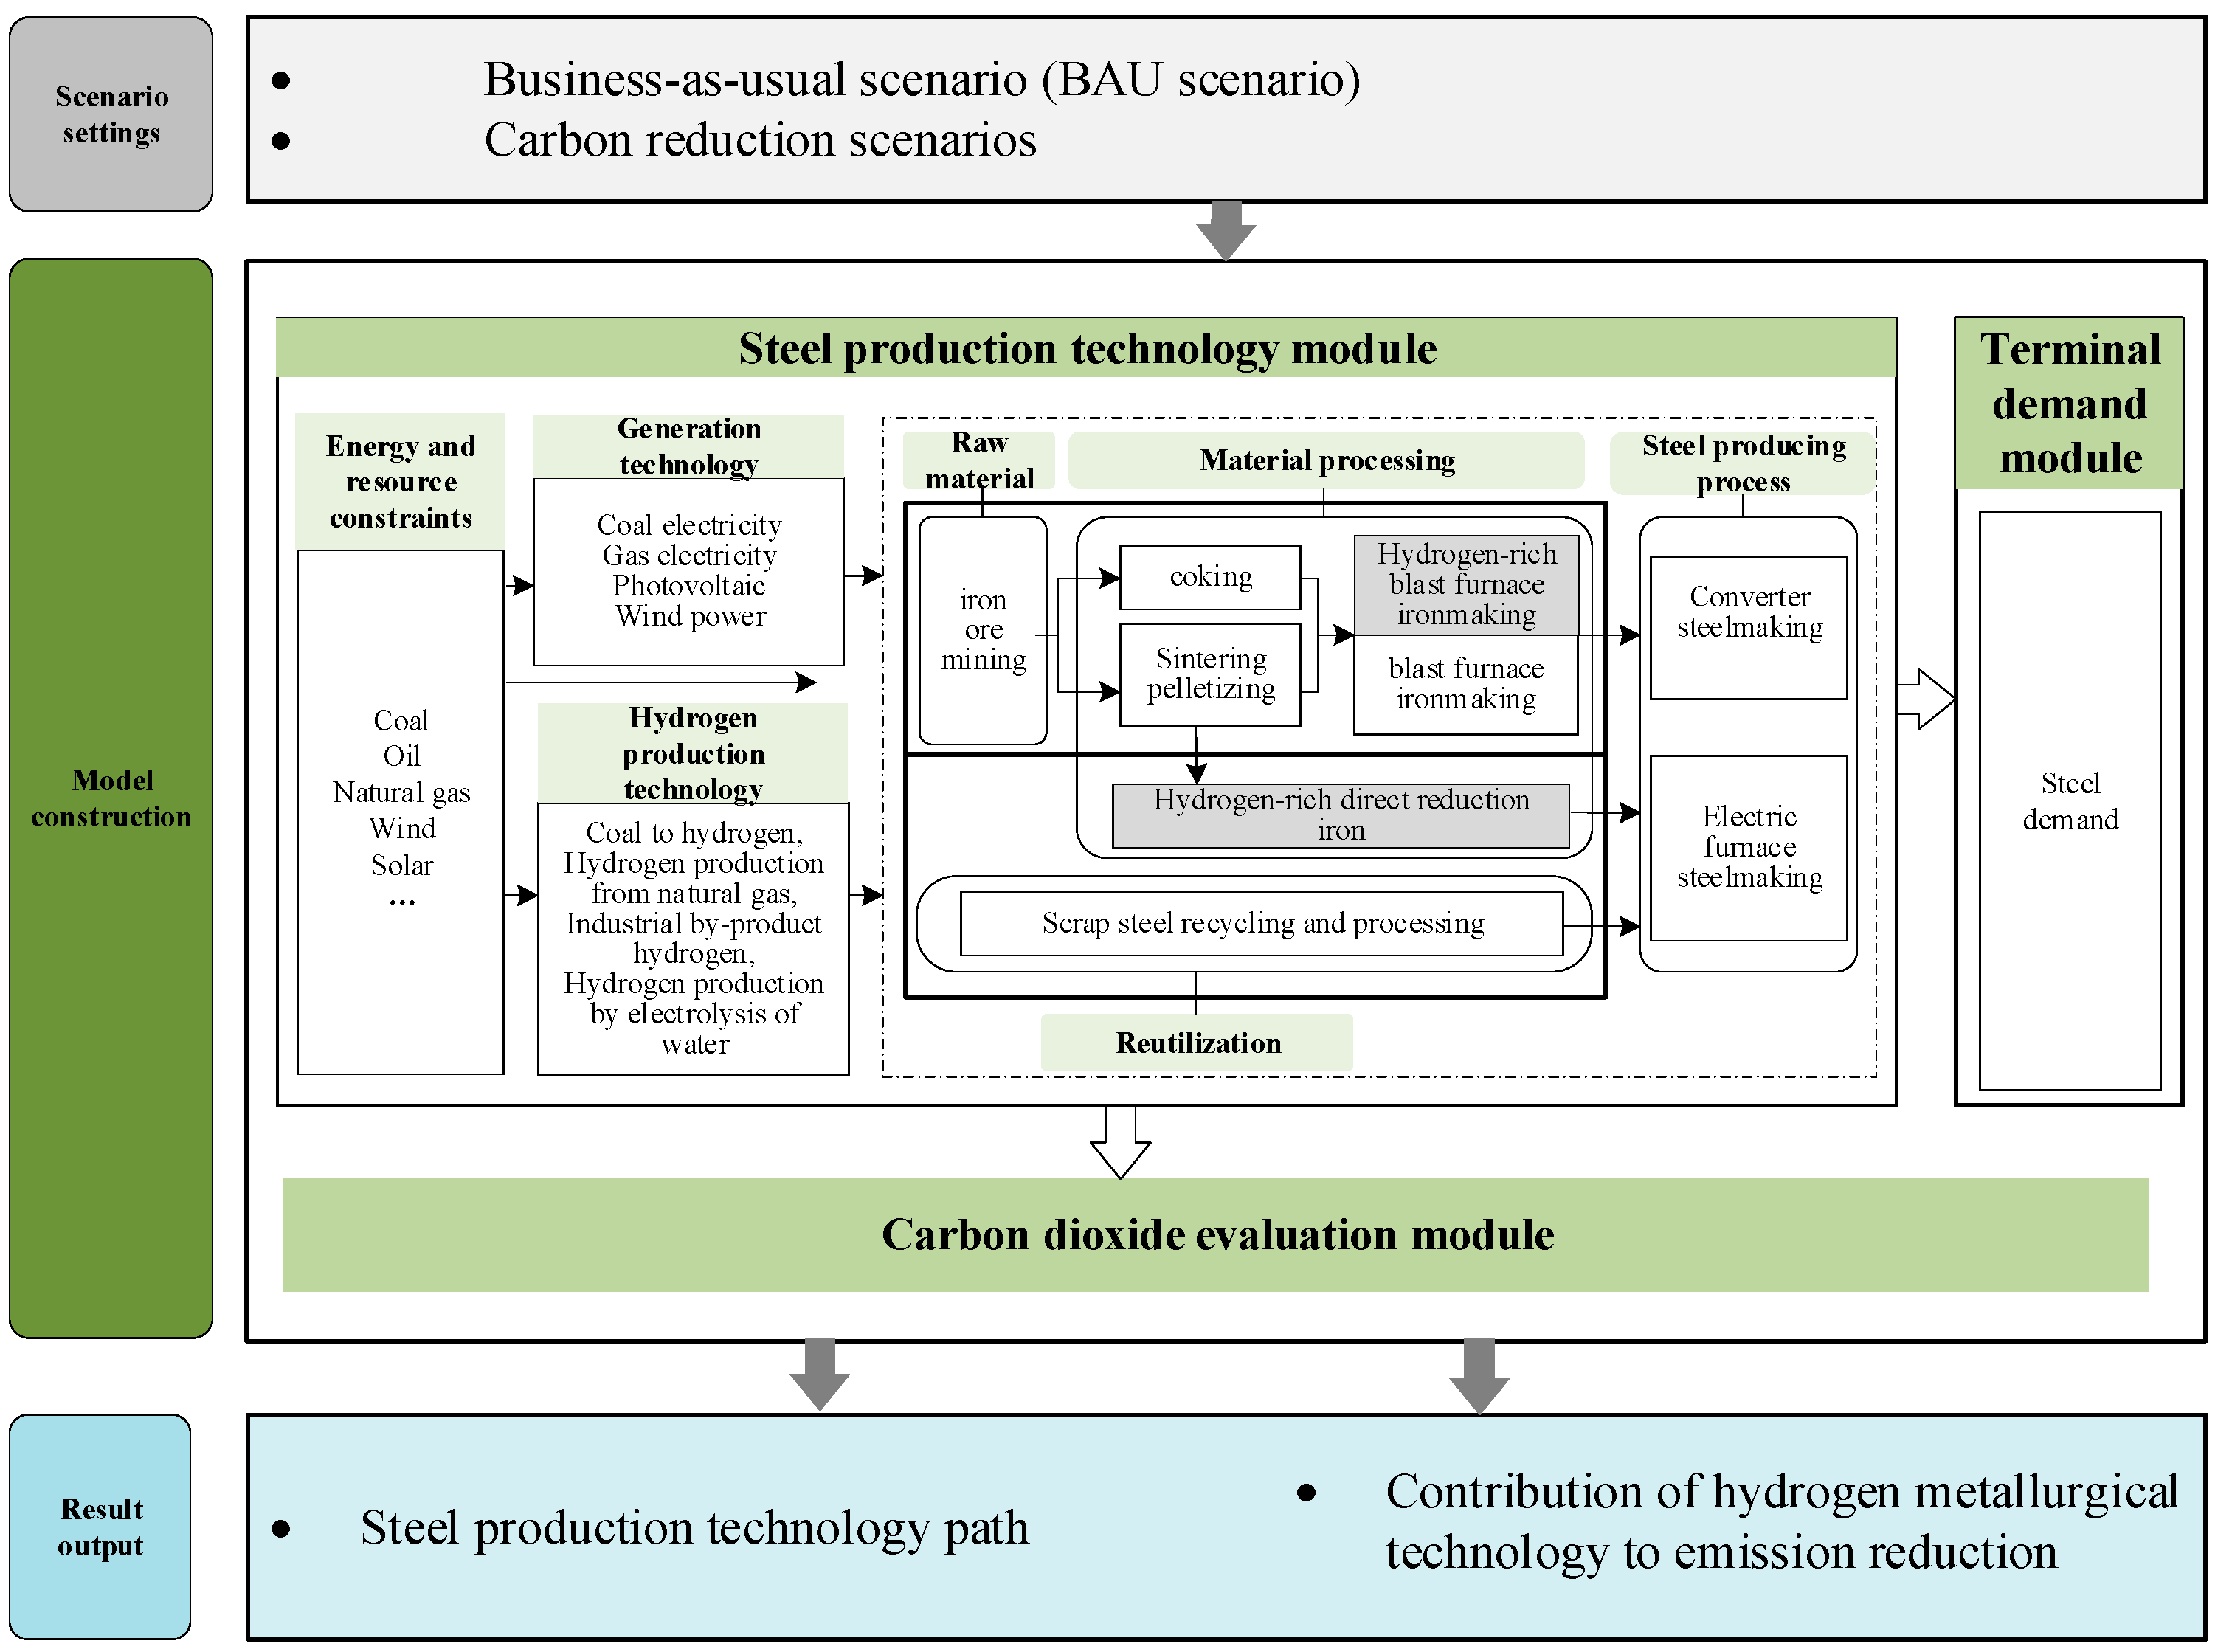
3.1. Constructing a Hydrogen Metallurgy Model for the Chinese Steel Industry

The TIMES model describes a real energy system by using the standard form of a linear programming problem. It is based on a reference energy system and provides detailed descriptions of different energy extraction, processing, conversion, and distribution links, as well as terminal energy consumption links in the energy system. A TIMES model includes many technologies in all sectors of the energy system (energy procurement, conversion, processing, transmission, and end uses). The model can simulate the energy flow of various energy carriers, namely the process that extends from primary energy supply to conversion systems, and then onto to meeting terminal demand. The TIMES model is demand driven and, as long as all terminal energy demands are met in each cycle, can enable a realistic and feasible solution to be obtained. The TIMES model essentially seeks the optimal energy supply and network structure for using terminal devices by meeting the terminal energy demand. In meeting the demand for terminal energy services, it selects the technology combination with the lowest cost, and provides optimized results of the energy system through general algebraic modeling systems (GAMS). This effectively describes the characteristics of the energy system’s complex internal connections and (many) external constraints. Using the TIMES model to analyze energy systems considers the lowest cost of the energy system, and supports investment and operational decisions. It has the advantage of simulating technological evolution [34], can be used for micro analyses of energy economy environment systems that integrate multiple technologies [35] and is widely used in the research of CO2 reduction [36,37].
This article applies the TIMES model and constructs a China steel industry hydrogen metallurgy model (TIMES-CSHM). It is based on data for 2020 and its planning period extends from 2020 to 2050. Its model optimization process has three parts: scenario setting, model construction, and result output. Scenario setting is an important constraint for model implementation, and setting scenarios based on the research domain of interest is an important prerequisite for model simulation. Model construction is the most important part of TIMES-CSHM analysis, and is the operational foundation of the TIMES model. This study’s model includes the terminal demand module, steel production technology module, and CO2 evaluation module. The model starts with China’s current steel demand, integrates scenario analysis and other constraints, and uses multi-period dynamic linear optimization to select the optimal energy and iron and steel production technology configuration for the planning period, which minimizes the whole system’s energy allocation cost. The basic framework of TIMES-CSHM is outlined in Figure 1.

3.2. Model Construction

In the TIMES model, the objective function is expressed as minimizing the discounted energy system cost while meeting the final use demand. The TIMES energy economy is made up of producers and consumers of commodities, such as energy carriers, materials, energy services, and emissions. By default, TIMES assumes competitive markets for all commodities, which results in a supply–demand equilibrium that maximizes the net total surplus. The objective function is the criterion that is minimized by the TIMES model, which represents the total discounted cost of the entire possible multi-regional system that stretches over the selected planning horizon, and is also equal to the negative of the discounted total surplus. In this study, the function is the minimum discounted value of the total cost of the steel industry meeting China’s steel demand in the period from 2020 to 2050, which is calculated using data from the base year 2020. The model simulates the technology combination with the minimum total cost in conditions of meeting China’s steel demand and environmental constraints. The function of the TIMES model in this paper is shown in Formula (1):
cos t = y y e a r s ( 1 + z ) 2015 Z × I n v cos t ( y ) + F i x cos t ( y ) + V a r cos t ( y ) S a l v a g e ( y )
In Formula (1), z denotes the discount rate and y denotes the year; I n v cos t , F i x cos t , V a r cos t represent the total investment cost, fixed operation and maintenance cost, and variable cost, respectively, of the different technologies described in TIMES-CSHM. Finally, S a l v a g e represents the residual value of the relevant technical equipment in the steel industry when it is eliminated.

3.2.1. Terminal Demand Module

The terminal demand is the starting point for the hydrogen metallurgy model in China’s iron and steel industry. The basic principle of the TIMES model is to determine a primary energy supply structure and energy-using technical structure that minimizes the cost of the energy system in the wider context of the given terminal energy demand and other constraints. The model constraint that the terminal demand satisfies is that the total supply of the steel industry shall not be less than the demand in any period. The constraint equation of the TIMES-CSHM model is:
Terminal supply and demand balance (terminal power supply shall be greater than, or equal to, the terminal power demand)
E i X i D E M
In Formula (2), X i represents the energy flow of each link from the supply of primary energy products to the terminal power demand; E i denotes the energy conversion efficiency matrix; and D E M denotes the terminal power demand vector.

3.2.2. Steel Production Technology Module

This study’s steel production technology module mainly includes primary energy supply, power generation, hydrogen production secondary energy conversion, and the steel production process. The primary energy supply mainly includes the supply of coal, oil, natural gas, wind, solar, and other energy resources. This process must meet the total constraint of providing a primary energy supply. The power generation process includes coal power, gas power, wind power, photovoltaic, hydropower, and other energy sources. There are four hydrogen production processes: coal hydrogen production, natural gas hydrogen production, industrial by-product hydrogen production, and electrolytic water hydrogen production. This process must meet the energy carrier balance of each technical link, the capacity limit, and the technology’s production operation limit. The iron and steel production process includes sintering, pelletizing, coking, ironmaking, steelmaking, and scrap recycling. Of these, the ironmaking process is divided into ordinary blast furnace ironmaking, hydrogen-rich blast furnace ironmaking, and hydrogen-rich shaft furnace–direct reduction iron technology. The steelmaking process is divided into converter steelmaking and electric-furnace-steelmaking technology. This process also must meet the energy carrier balance of each technical link, technical capacity limit, and production operation limit.
In this study, the power generation process, hydrogen production process, and steel production process are simultaneously included in the steel production technology module. In considering the influence of future power supply structure changes and hydrogen production structure changes in the CO2 emission of hydrogen metallurgy, the research boundary of hydrogen metallurgy is extended to include the raw material end, highlighting the emission reduction effect of hydrogen metallurgy.
The constraint equations of the steel production technology module of the TIMES-CSHM include:
Primary energy supply constraints: primary energy supply shall not be greater than the amount of primary energy resource exploitation;
X i S U P
The energy carrier balance of each technical link: the energy conversion of each technical link shall be greater than, or equal to, the energy consumption of the next link;
E i X i X i + 1 0
Technical capacity limits and production operation limits: energy production shall be conducted within the technical capacity or production operation limits.
E i X i C A P i
In Formulas (3)–(5), S U P represents the energy resource vector, and C A P i represents the process capacity vector.

3.2.3. CO2 Evaluation Module

The CO2 evaluation module evaluates the CO2 emissions of the steel industry technology path optimized in different scenarios by setting the CO2 emission coefficient of each technology in the steel production technology process. This mainly includes CO2 emissions from power generation technology, CO2 emissions from hydrogen production technology, and CO2 emissions from the steel production process.
The constraint equations of the CO2 evaluation module of TIMES-CSHM include the evaluation of total CO2 emissions. The sum of each link’s CO2 emissions is equal to the system’s total CO2 emissions.
E N V i X i = E N V
In Formula (6): E N V i represents each link’s CO2 emissions, and E N V represents the system’s total CO2 emissions.

3.3. Model Parameter Settings

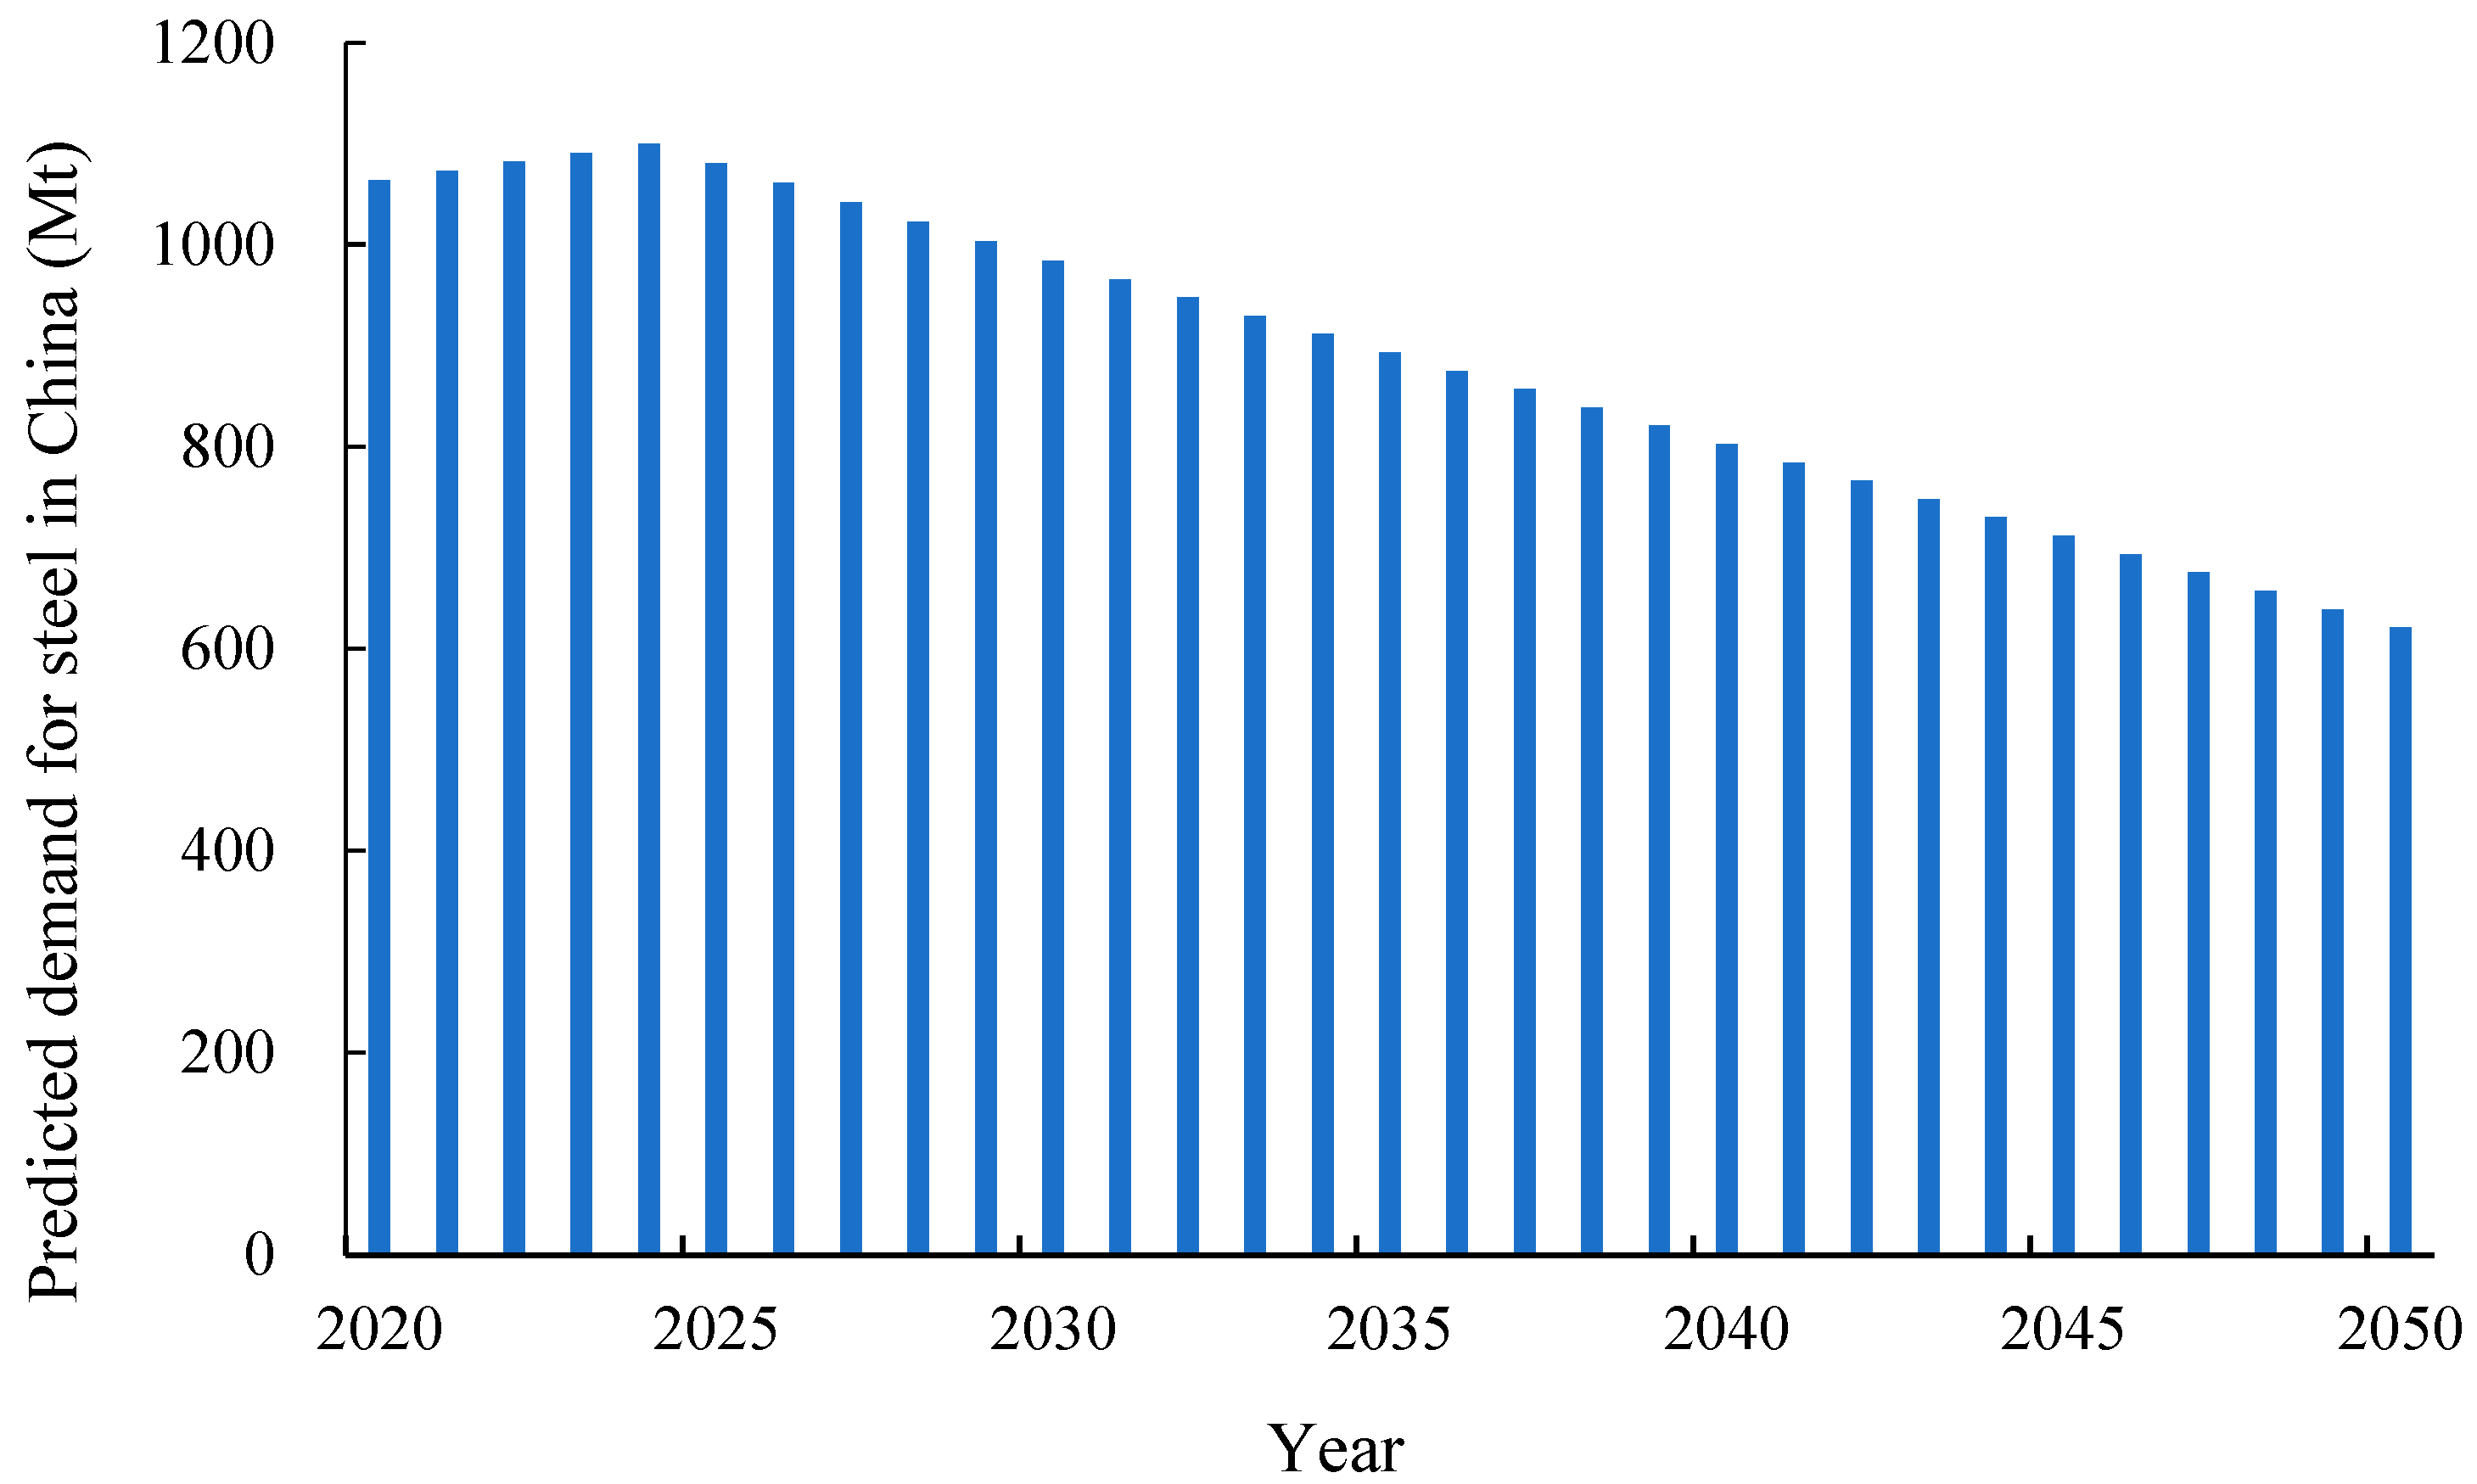
3.3.1. Terminal Requirements Module Parameter Settings

This study sets the demand for crude steel in China in the period 2020 to 2050, in accordance with the projections of the Rocky Mountain Institute, the Energy Transition Committee, and the China Metallurgical Industry Planning and Research Institute [38]. Figure 2 shows that China’s steel production is expected to peak at 1.1 billion tons in around 2024. In the medium to long term, China’s steel production is expected to continue to decline to a total production of 621 million tons in 2050.

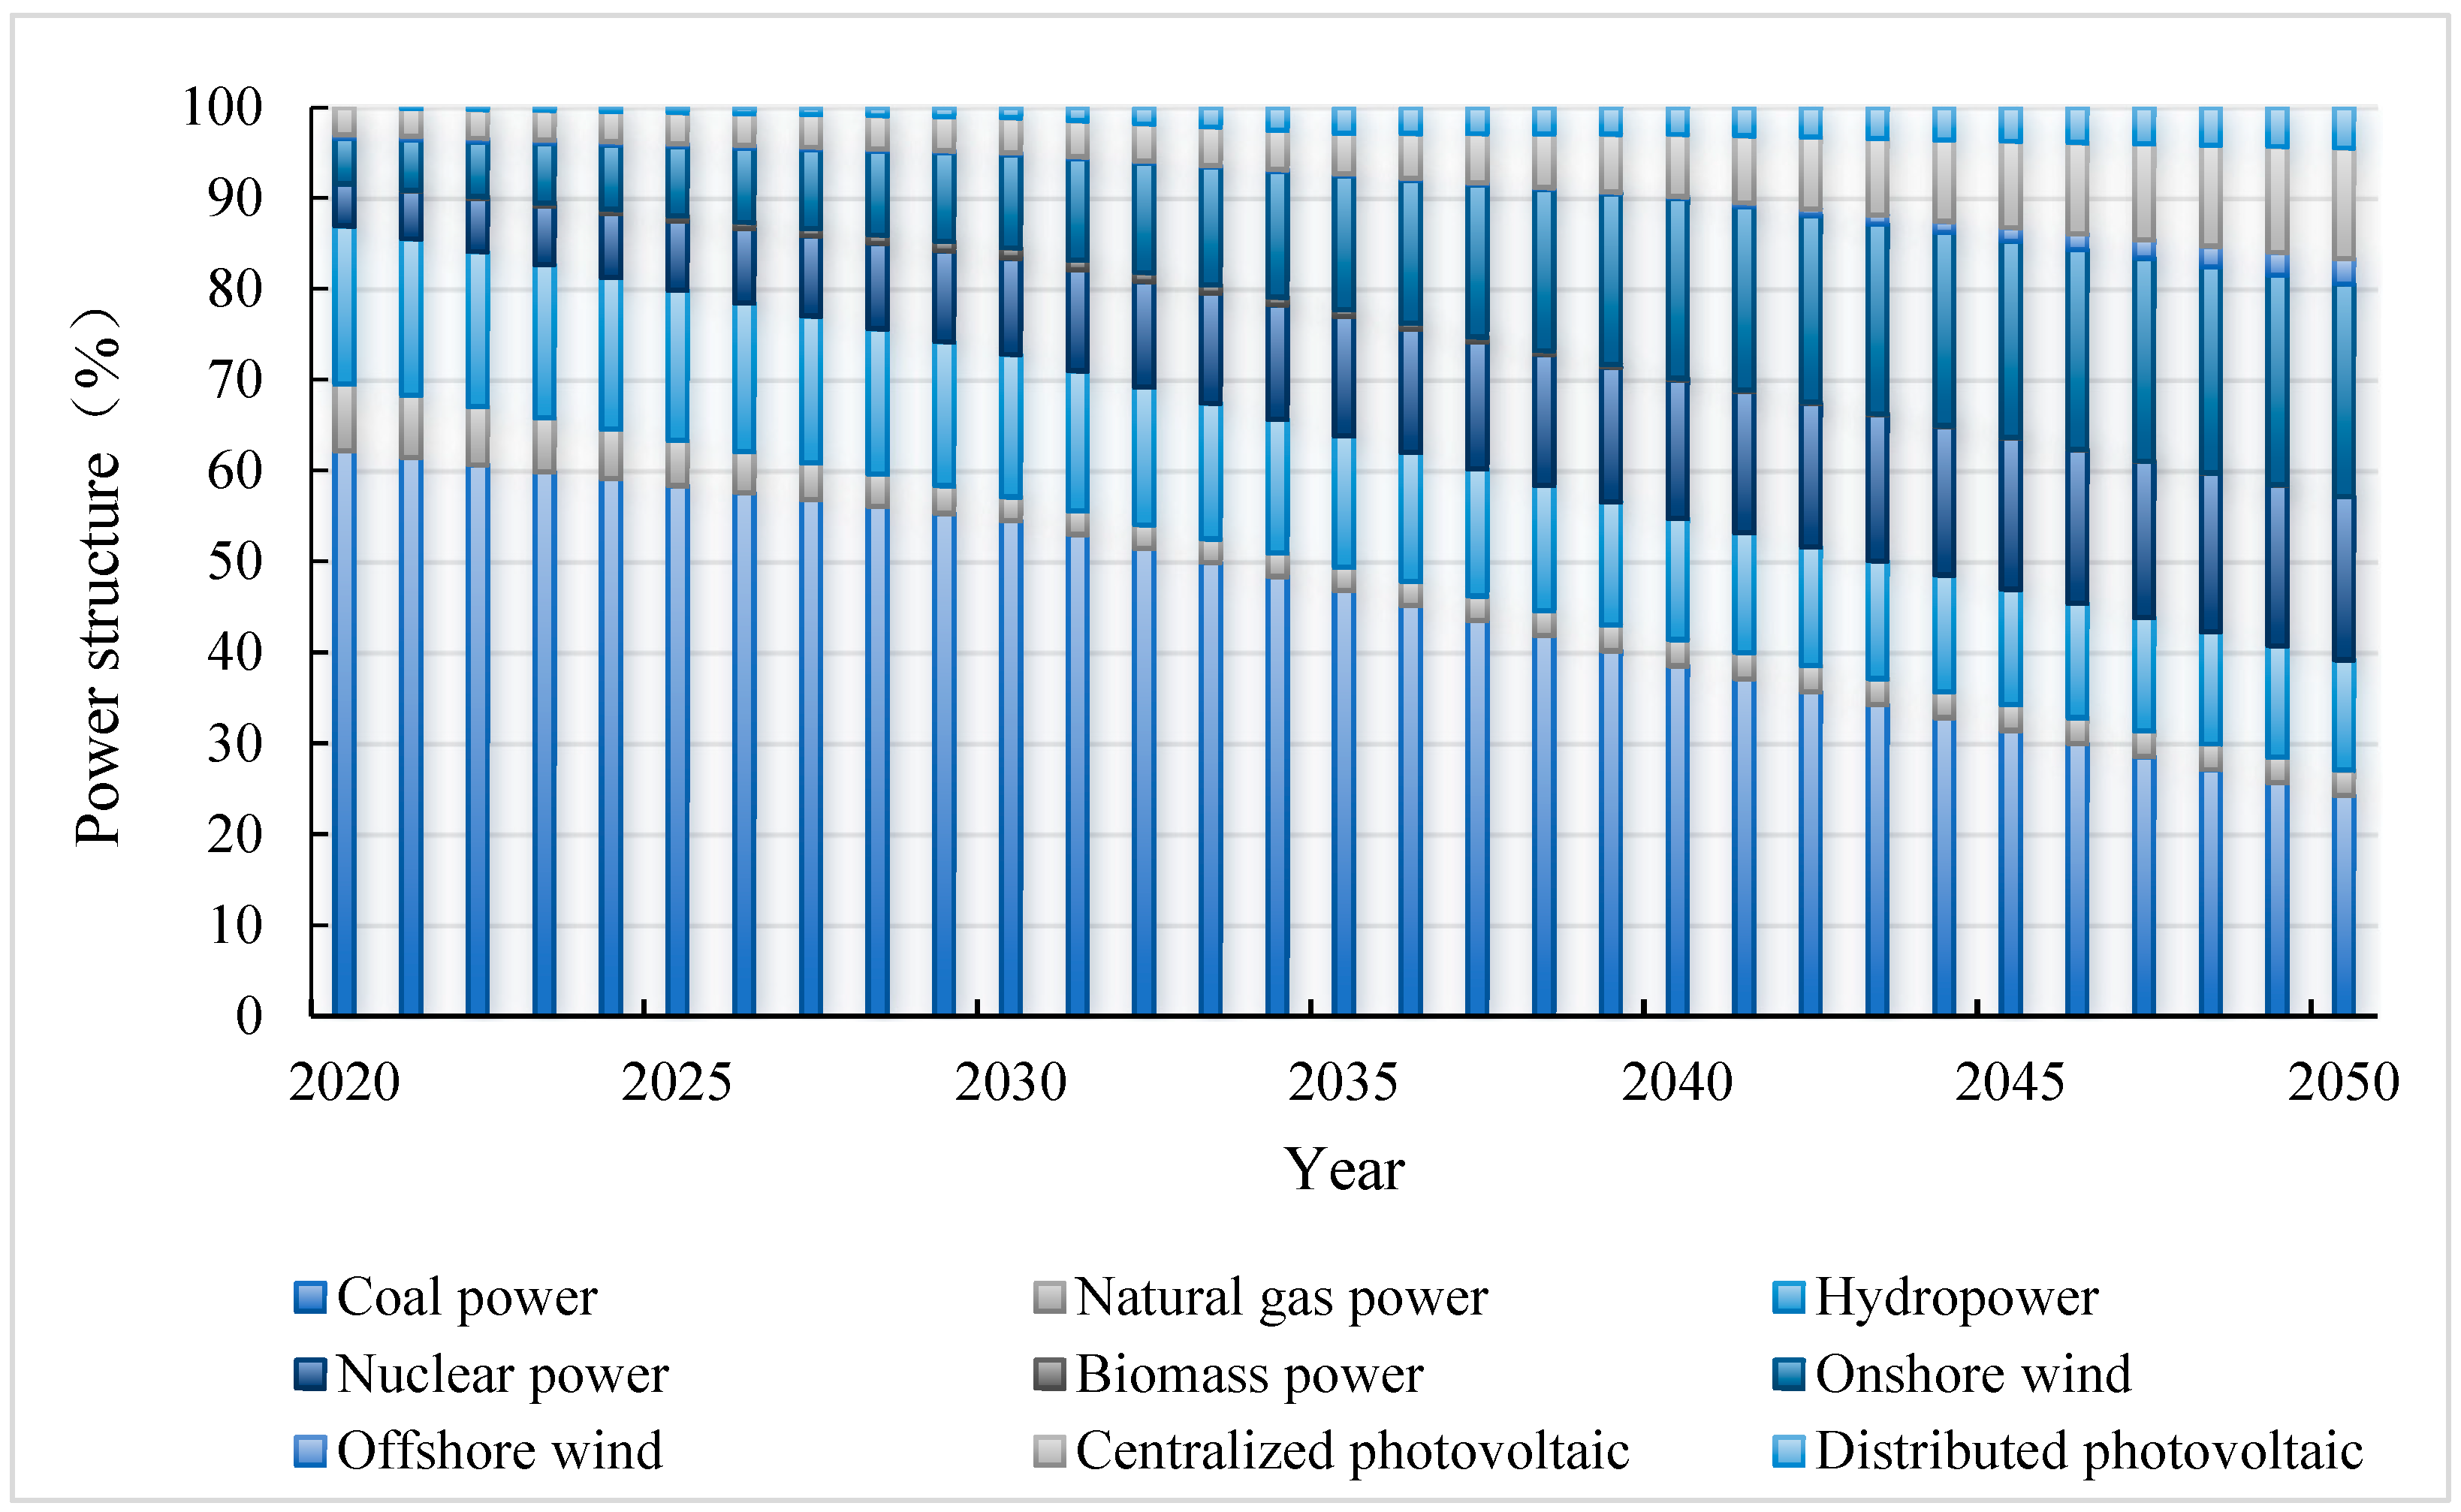
3.3.2. Parameter Settings for Steel Production Technology Modules

(1)
Steel production process
In drawing on existing research, this study focuses on the entire iron and steel production process, including primary production, secondary production, and the required pretreatment process, but not post-processing, such as finishing and fusion casting [39,40]. Table 1 presents the energy and raw material input required for each steel production process.
In iron and steel production, adjusting the burden structure of the blast furnace is key to achieving emission reductions in the blast furnace-converter process. Two main technical routes based on sinter and pellet have been established across the world. Sinter currently makes up 70–80% of China’s furnace burden structure, with pellets only accounting for approximately 15% [41]. Pellet production reduces process energy consumption more than sintering production. In recent years, research of pellet preparation technology adjusted to China’s burdened resource conditions has continuously developed, and research of blast furnace structure that uses a high proportion of pellets is generally mature. The blast furnace operation system of high proportion pellet smelting has gradually improved in China. Pursuing the best environmental benefits and other factors is expected to promote the rapid development of high proportion pellet use technology [42]. In the future, the proportion of pellet in blast furnace clinker is also expected to continue to increase. This paper therefore sets the change in the proportion of pellets as part of the blast furnace burden, as shown in Table 2.
(2)
Power generation process
On the basis of the current state of power generation technology in China, power production is divided into coal power generation, natural gas power generation, hydropower, nuclear power, wind power, and photovoltaic power generation. The parameter settings of specific power generation technologies are shown in Table 3.
In addition, this study uses predictions made by Tsinghua University’s Institute of Climate Change and Sustainable Development about China’s power supply structure [43]. The model considers the change of CO2 emissions that correspond to the change in the power supply structure, which enables an analysis of the influence of the change in hydrogen-metallurgy-front-end power supply structure on the reduction of hydrogen metallurgy emission. Figure 3 shows that by 2025, China’s total power generation is expected to be 9573.9 billion kWh, with non-fossil energy generation accounting for 42.2% of this figure. By 2035, the proportion of non-fossil energy generation is expected to rise to 78.2%. And by 2050, wind power and photovoltaic power generation are expected to gradually replace coal power as the main power source, and the proportion of non-fossil energy generation may reach 91.5%.
At the same time, the electricity price level affects the long- and short-term costs of steelmaking, which affects the competition pattern of different steel production routes. Electricity prices are expected to decline significantly in the next 30 years as China’s renewable energy production capacity grows. This study uses electricity prices forecasted in “China’s Steel Zero Carbon Road under the Carbon Neutralization Goal” [44], to set the electricity price at 0.35 yuan/kWh in 2030 and 0.2 yuan/kWh in 2050.
(3)
Hydrogen production process
On the basis of the market realities of the hydrogen production industry and the maturity of typical hydrogen production technology, this study divides hydrogen production technology into coal hydrogen production, natural gas hydrogen production, industrial by-product hydrogen production, and electrolytic water hydrogen production technology. The parameter settings for specific technologies are presented in Table 4.
The development path of hydrogen production technology is set according to previous research [45]. Figure 4 shows that electrolytic water hydrogen production technology is expected to become the main source of hydrogen production in China by 2050, contributing 76.27% of the total output.
In addition, the cost of hydrogen is the most important factor restricting hydrogen metallurgy development. The terminal supply price of hydrogen is expected to gradually decrease as technology develops, economies of scale emerge, and hydrogen production develops from the renewable energy electrolysis of water. The cost of future hydrogen production is set on the basis of the ‘China Hydrogen Energy Industry Development Report 2020’ and ‘China Hydrogen Energy and Fuel Cell Industry White Paper’ [46,47]. The average cost of hydrogen production is not set to exceed 20 yuan/kg by 2025, 15 yuan/kg by 2035, nor 10 yuan/kg by 2050. The specific parameter settings of hydrogen energy production cost are set out in Table 5.

3.3.3. CO2 Assessment Module Parameter Settings

(1)
CO2 emission parameter setting in the iron and steel production process
The CO2 emissions of the steel production process are generated by the consumption of fossil energy sources, such as coal, oil, and natural gas. Energy and main raw material inputs corresponding to each steel production process are used to set the parameters for the steel production technology module. This sets the CO2 emission coefficient of each process, as shown in Table 6.
(2)
CO2 emission parameter settings for hydrogen production and power generation processes
The CO2 emissions in the hydrogen production and power generation process are set according to the hydrogen production and power supply structures. These future structures are analyzed in the steel production technology module. On this basis, the CO2 emission coefficient of hydrogen production and power generation is calculated and set as a known parameter in the model, as shown in Table 7.

3.4. Scenario Setting

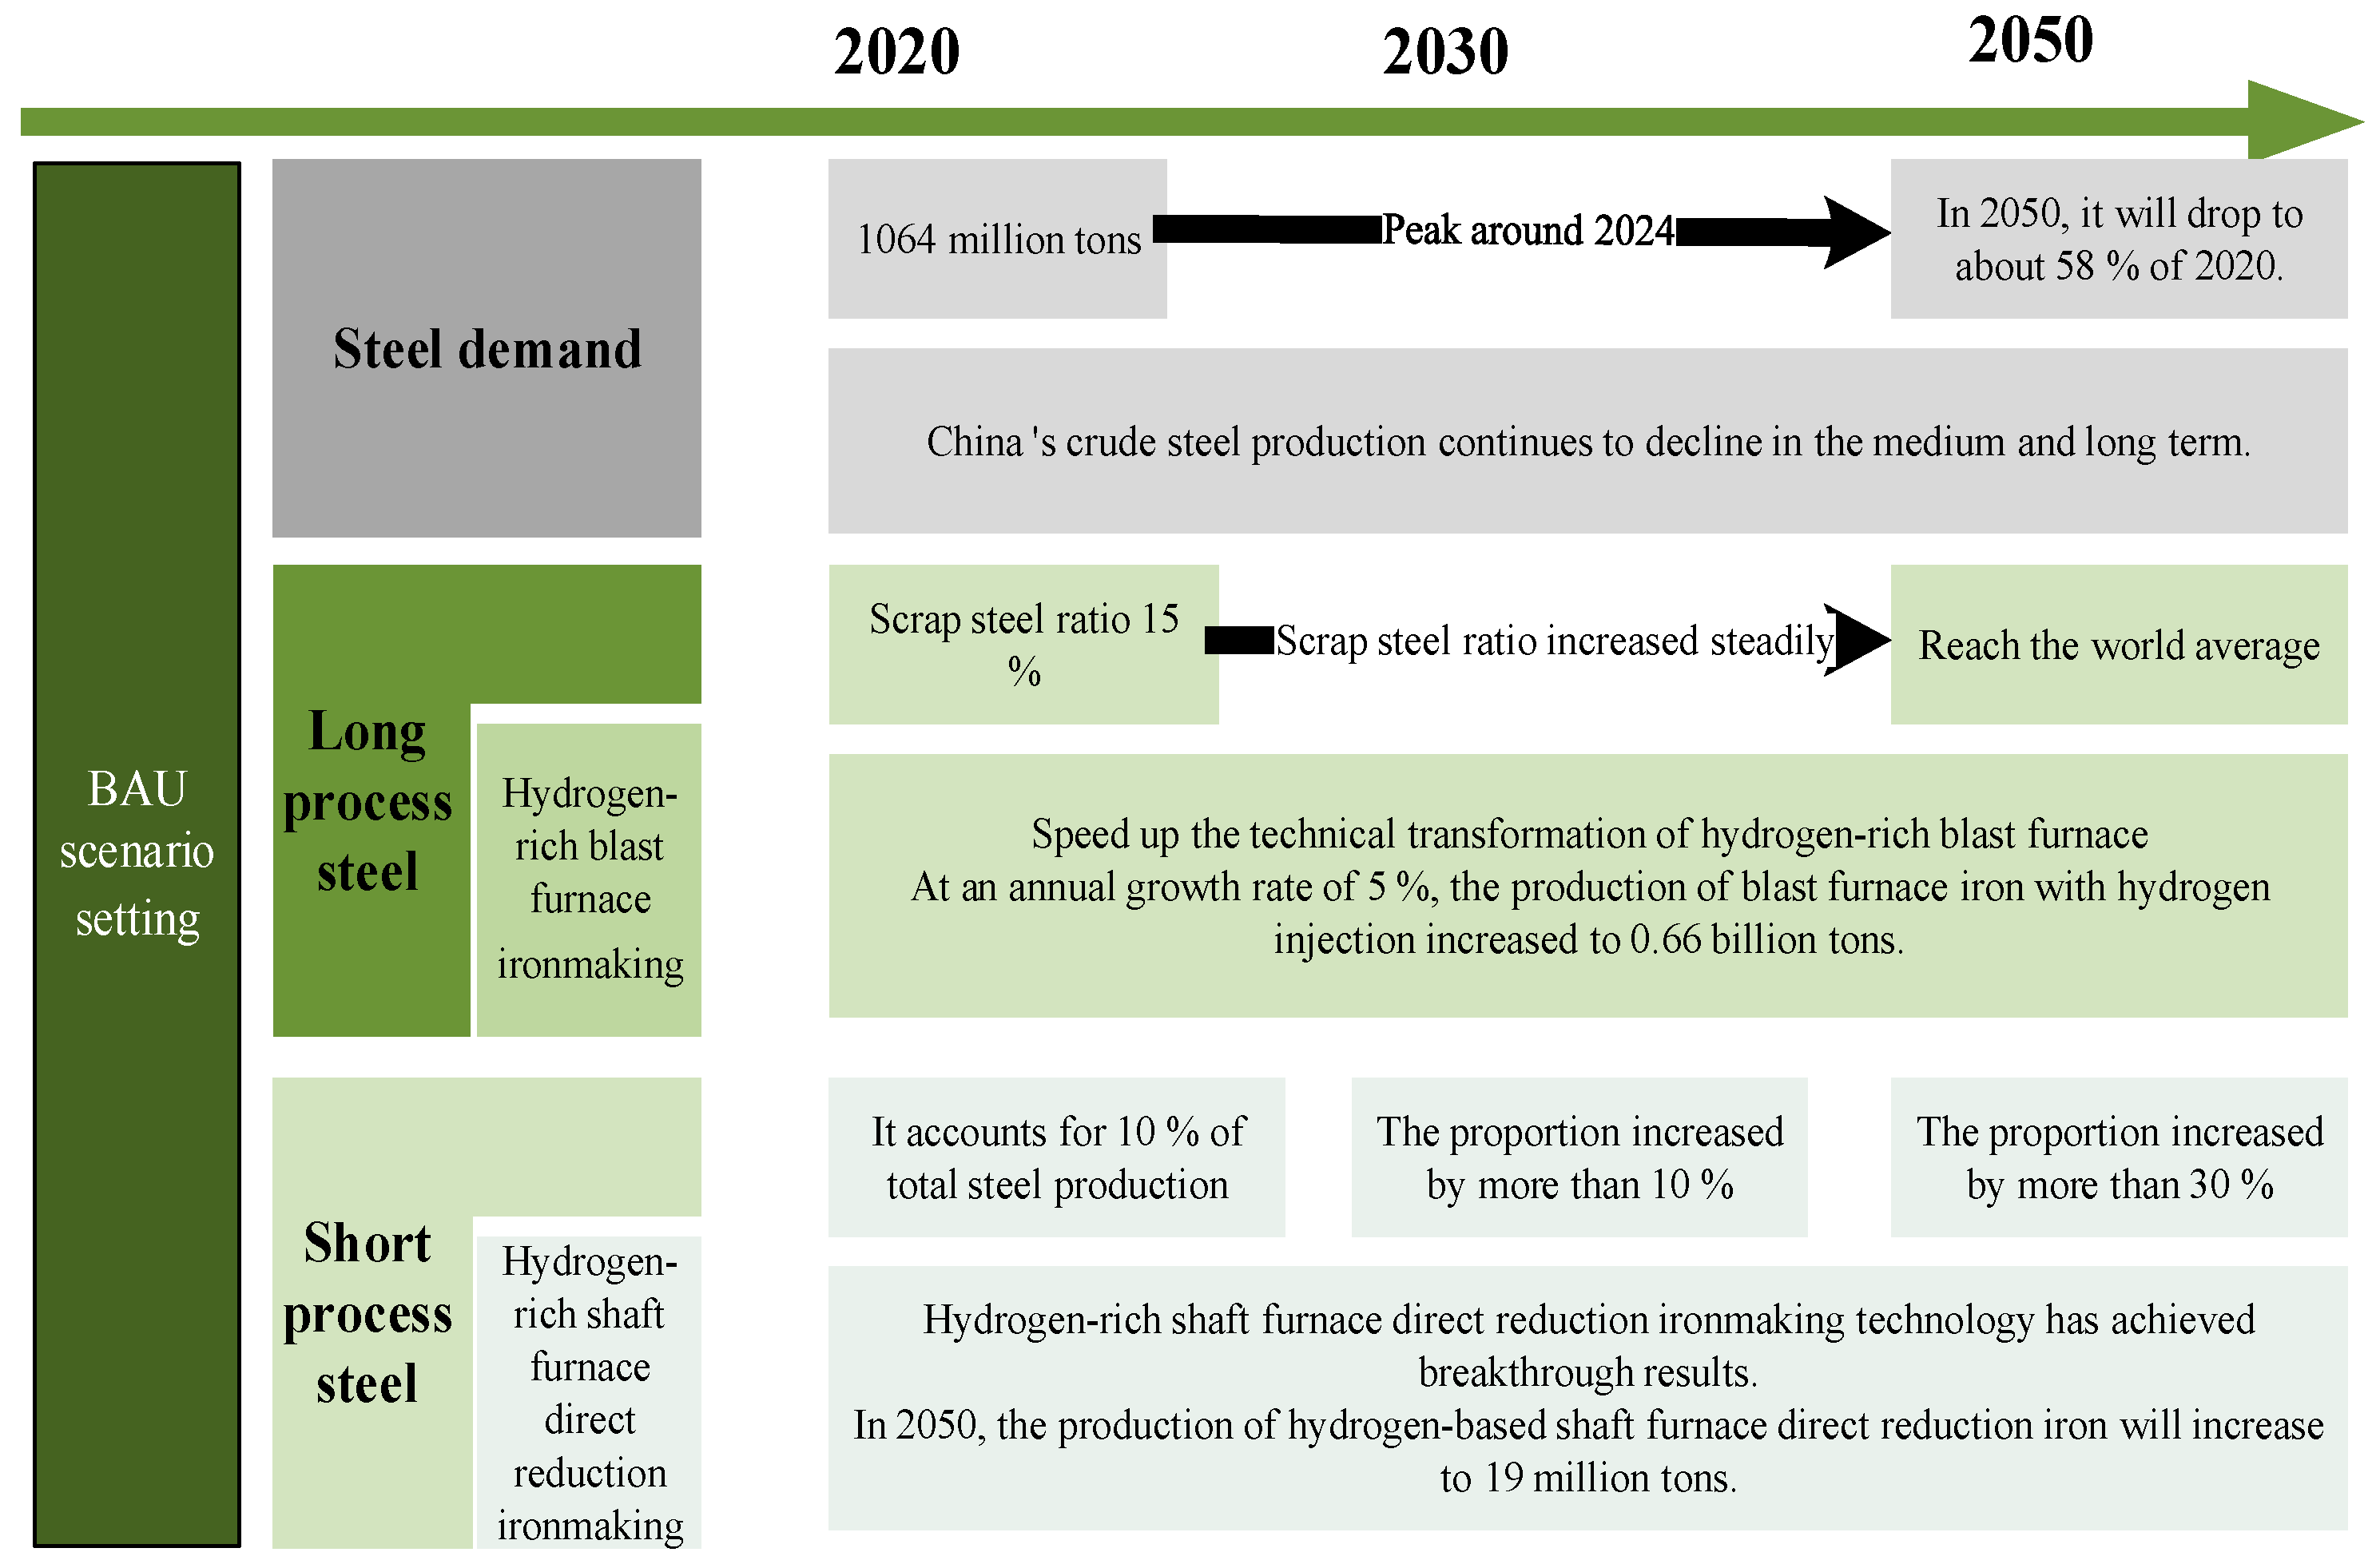
3.4.1. Business-as-Usual Scenario

The business-as-usual scenario (BAU scenario) uses existing policy planning and technology development trends to analyze the development path of China’s steel industry, the application of hydrogen metallurgy technology, and CO2 emissions. It serves as the reference scenario that other scenarios are assessed against. The BAU scenario is set by analyzing the scrap resource supply, hydrogen metallurgy technology, and steel industry CO2 emissions, as shown in Figure 5.

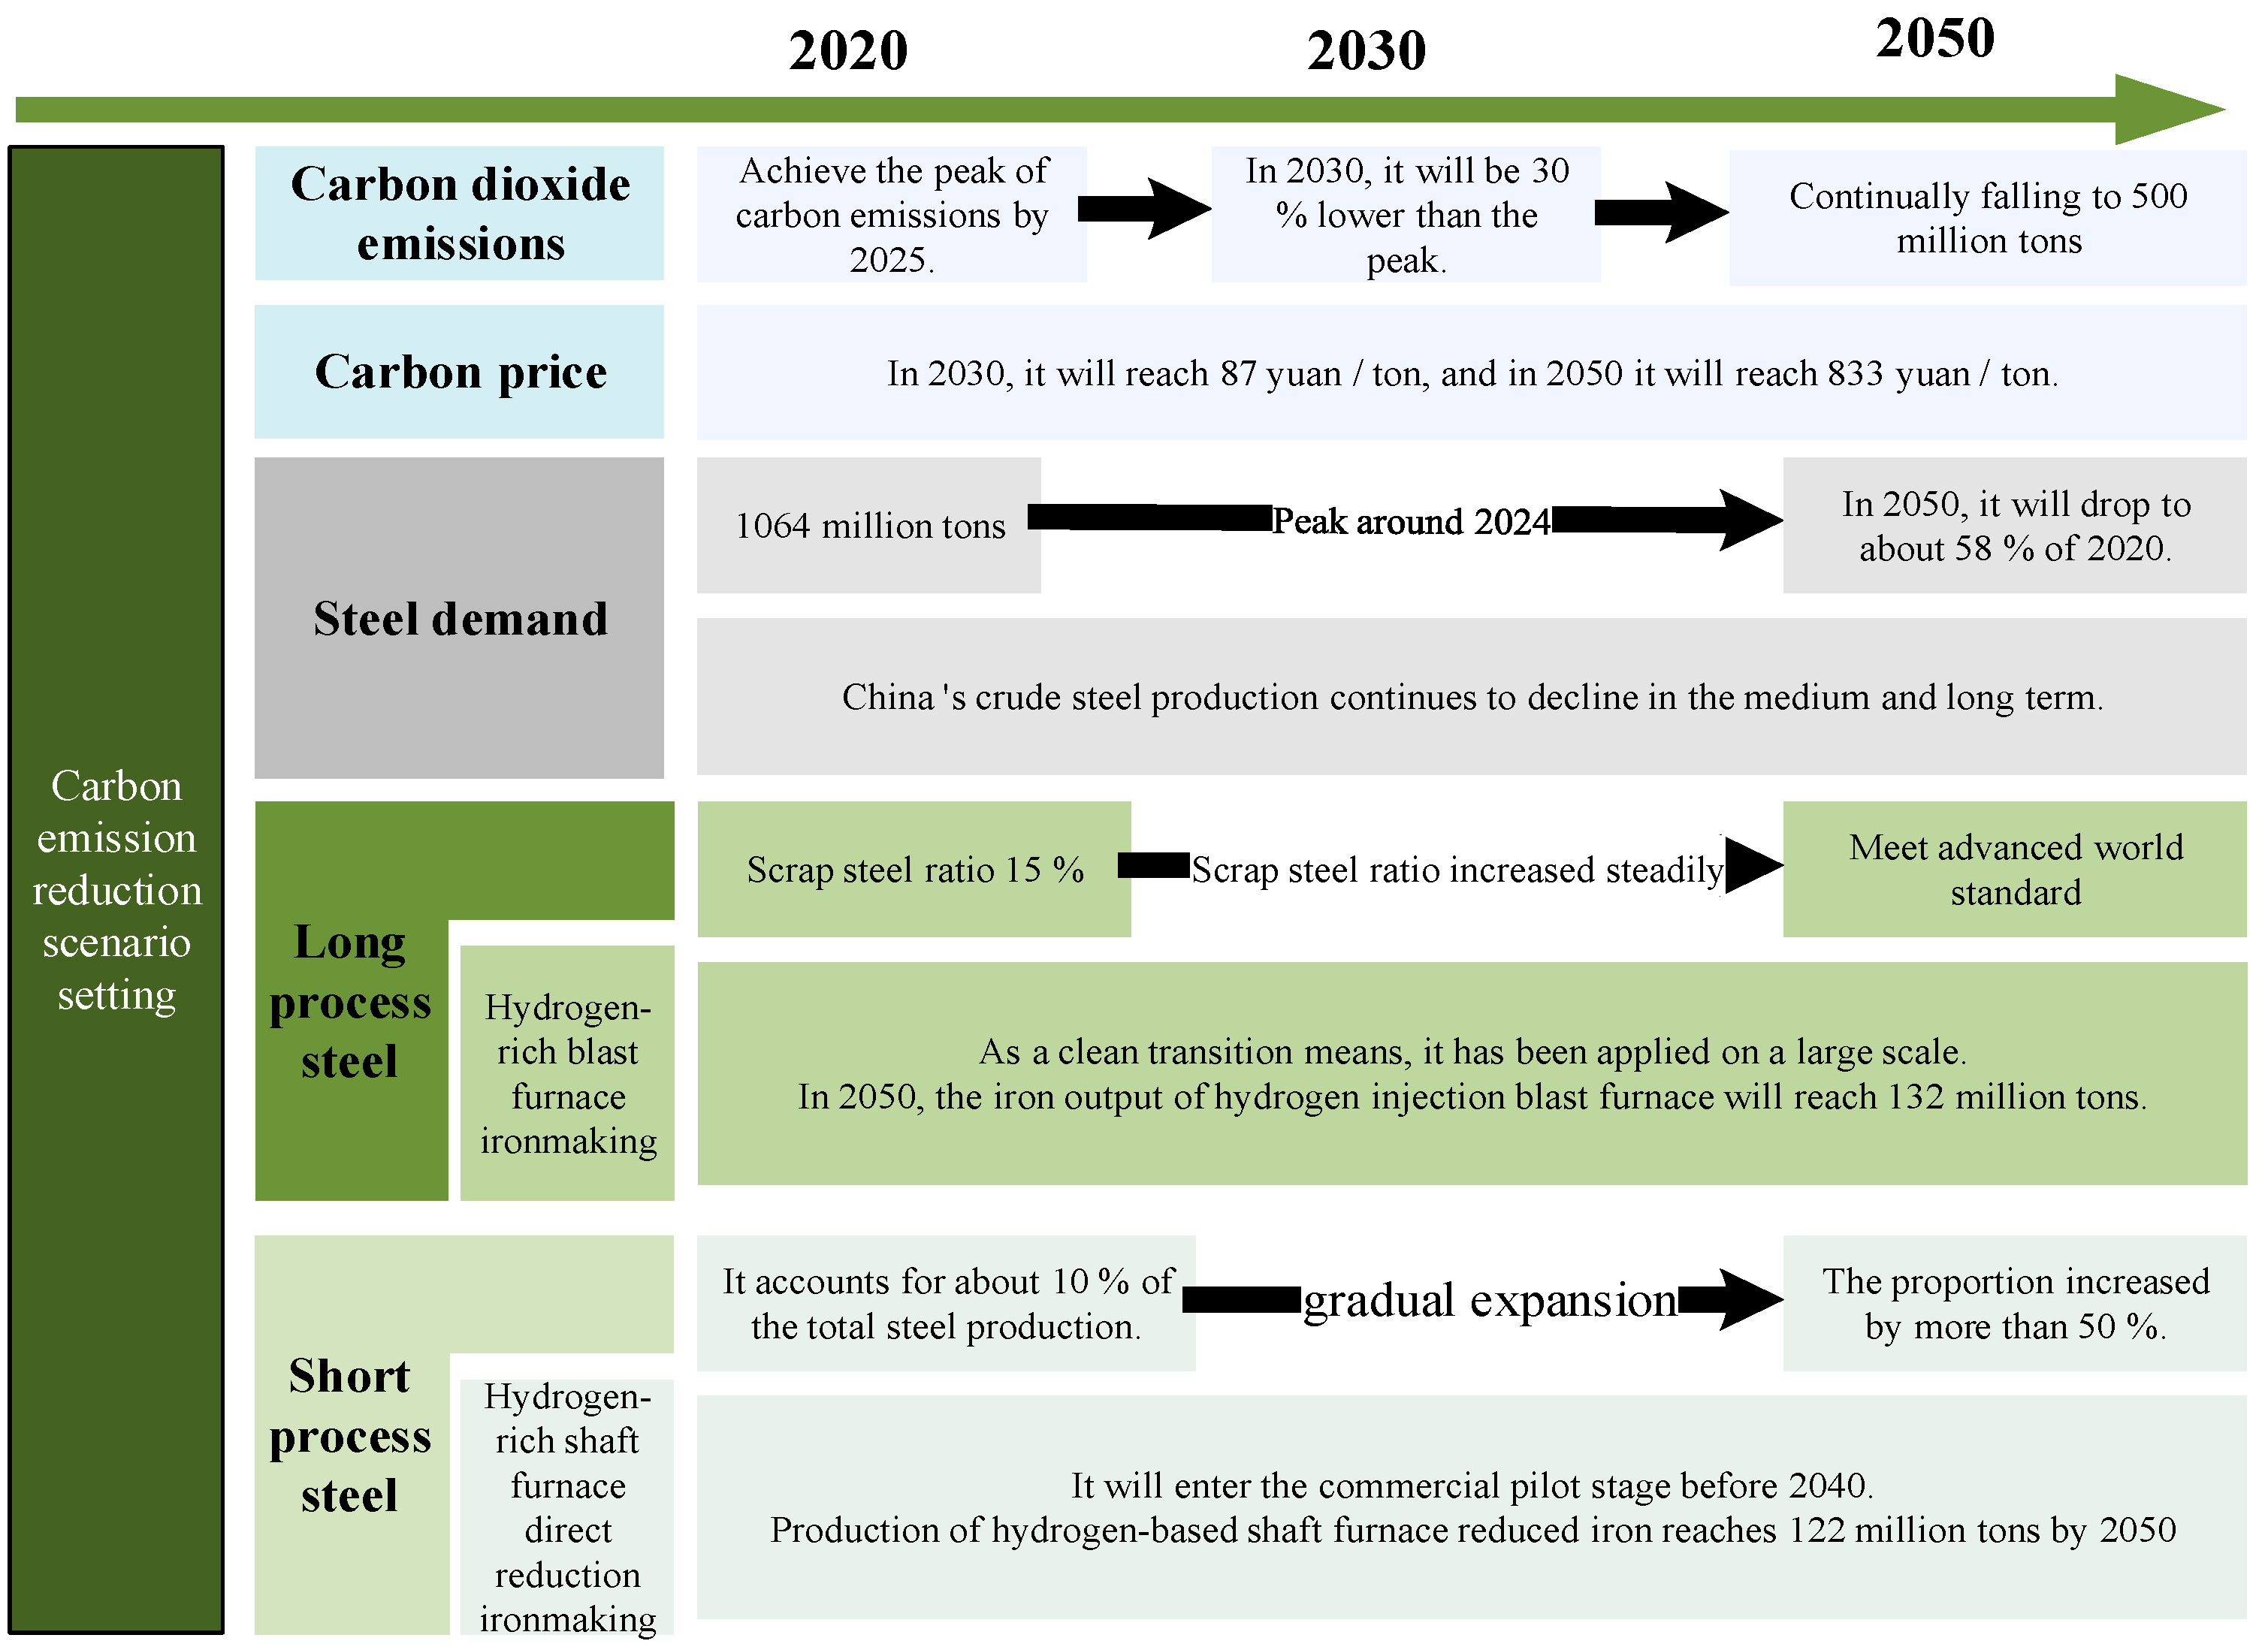
3.4.2. Carbon Emission Reduction Scenario

In contrast to the BAU scenario, the carbon emission reduction scenario increases carbon emission reduction constraints. The supply capacity of scrap steel resources is further strengthened, and hydrogen metallurgy technology develops rapidly. This scenario is constructed on the basis of policy requirements and research results for scrap steel resource supplies, hydrogen metallurgy technology development, and CO2 emissions. In contrast to the BAU scenario, the carbon emission reduction scenario considers the impact of carbon price. In the future, the carbon price is expected to continue to rise as carbon emission quotas continuously tighten. A higher carbon price gives hydrogen metallurgy a cost advantage. The specific settings of carbon emission reduction scenarios are presented in Figure 6.

4. Results and Discussion

4.1. BAU Scenario Results Analysis

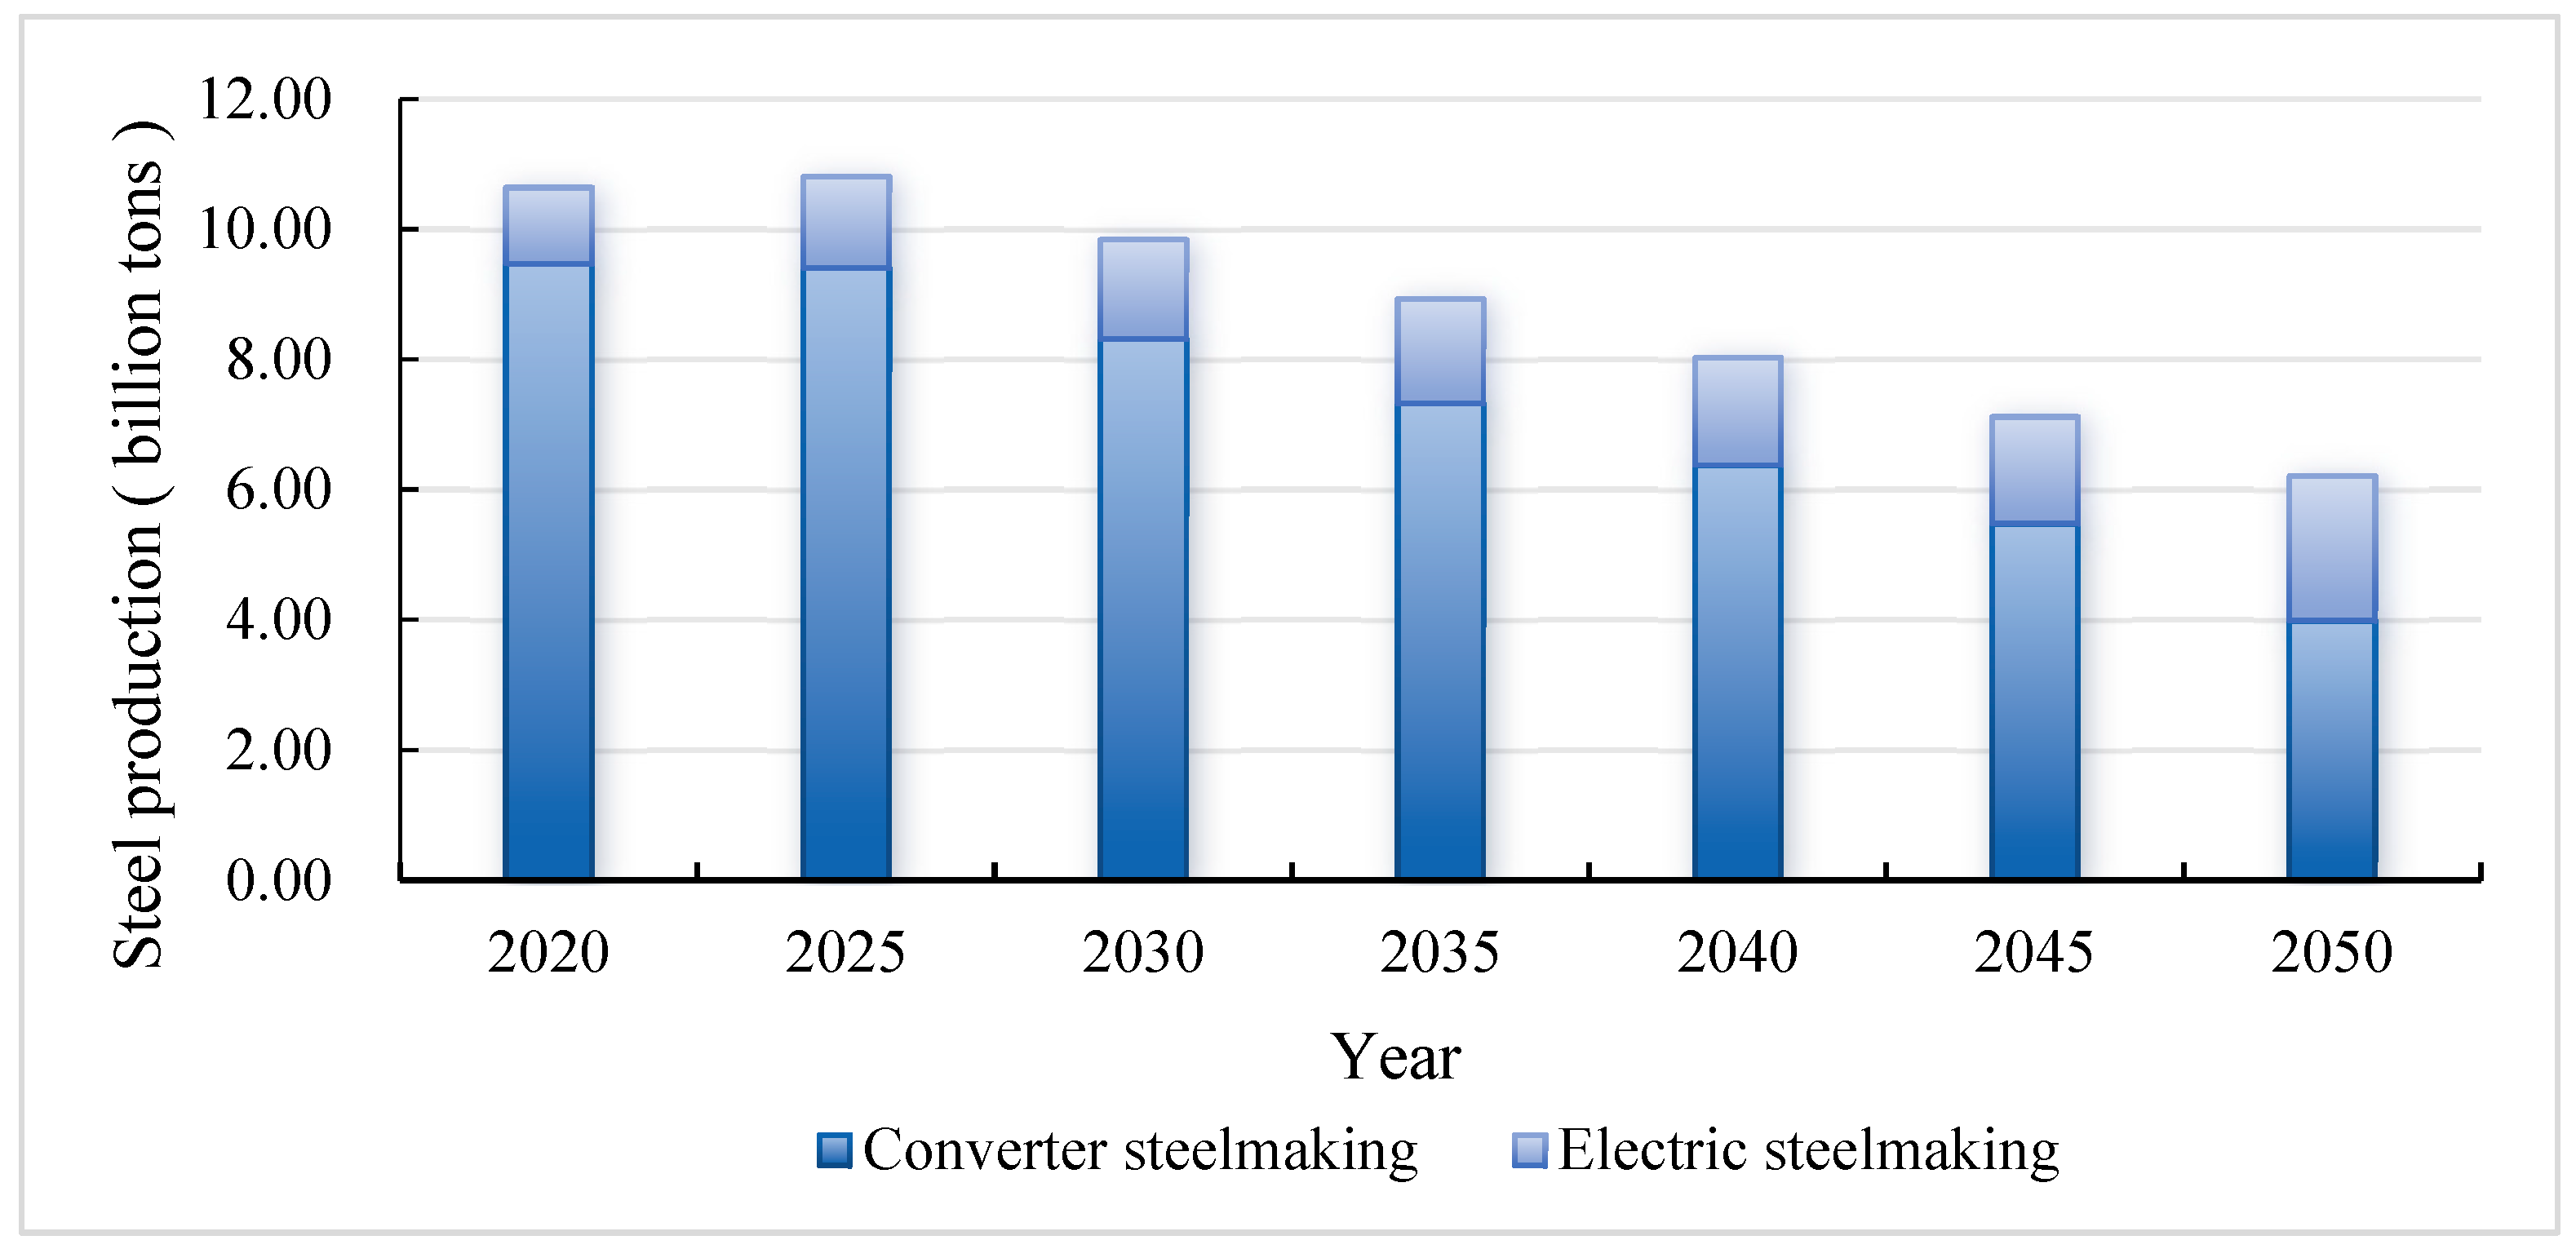
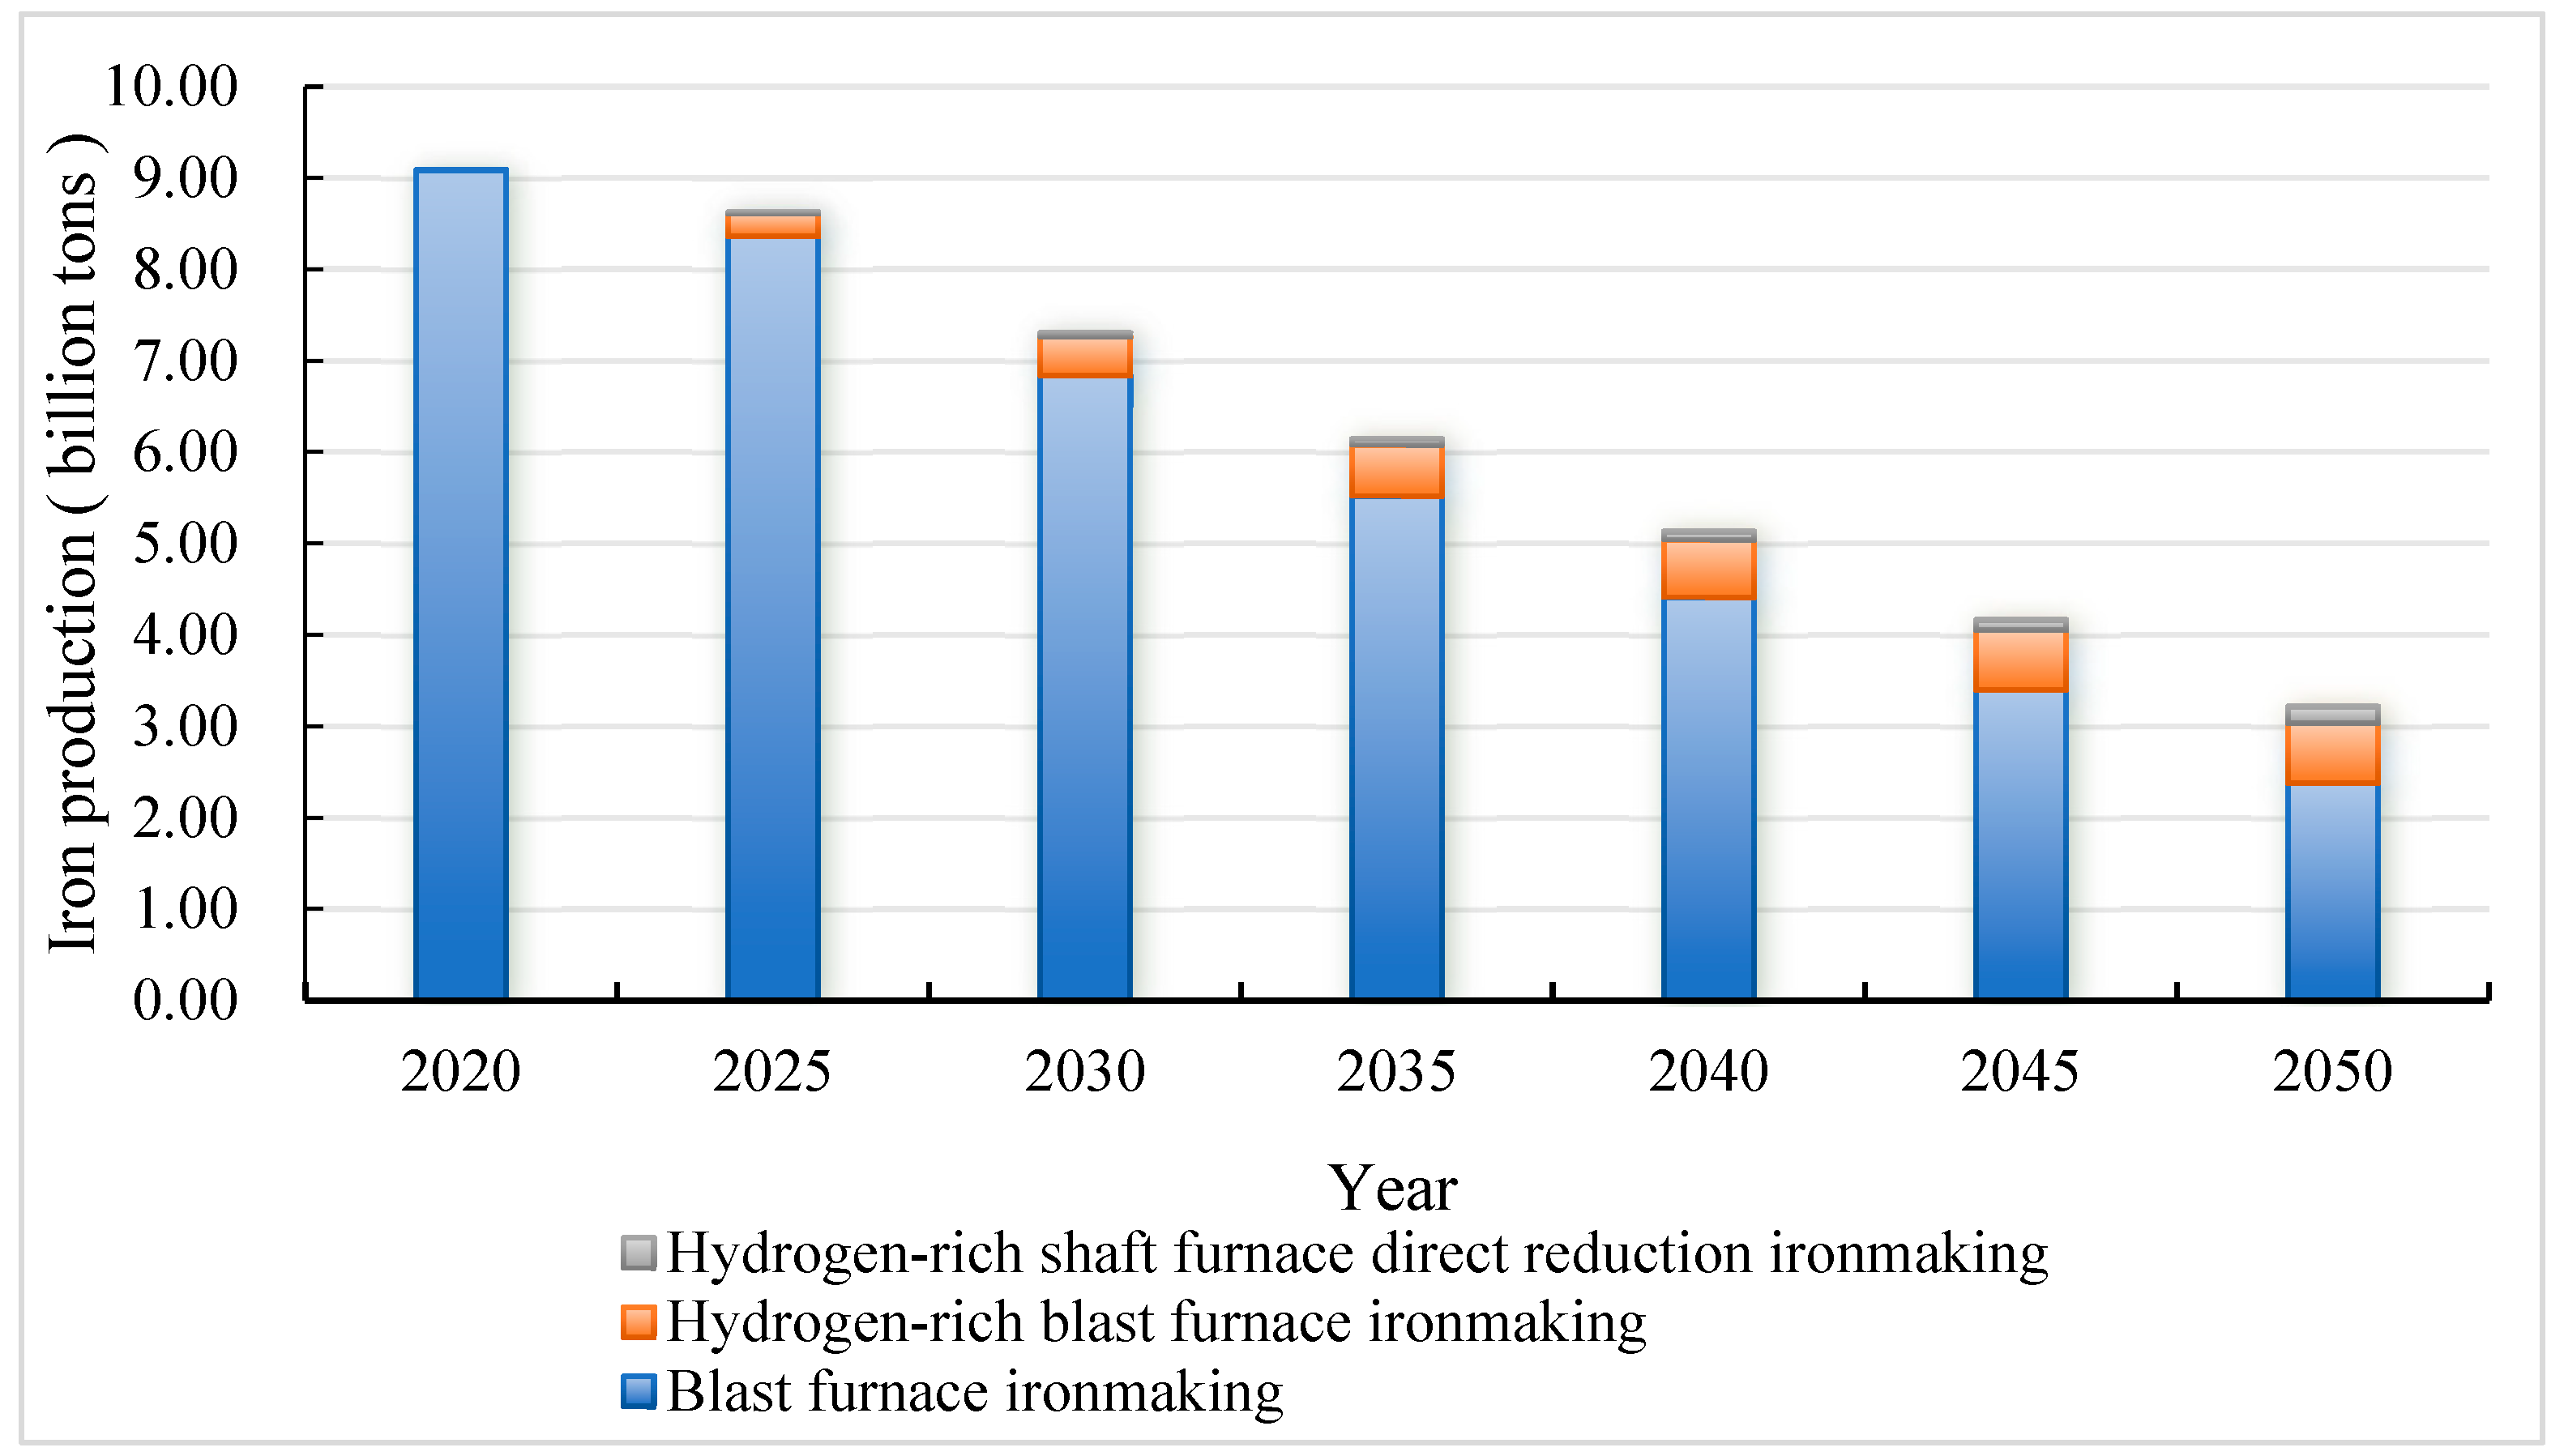
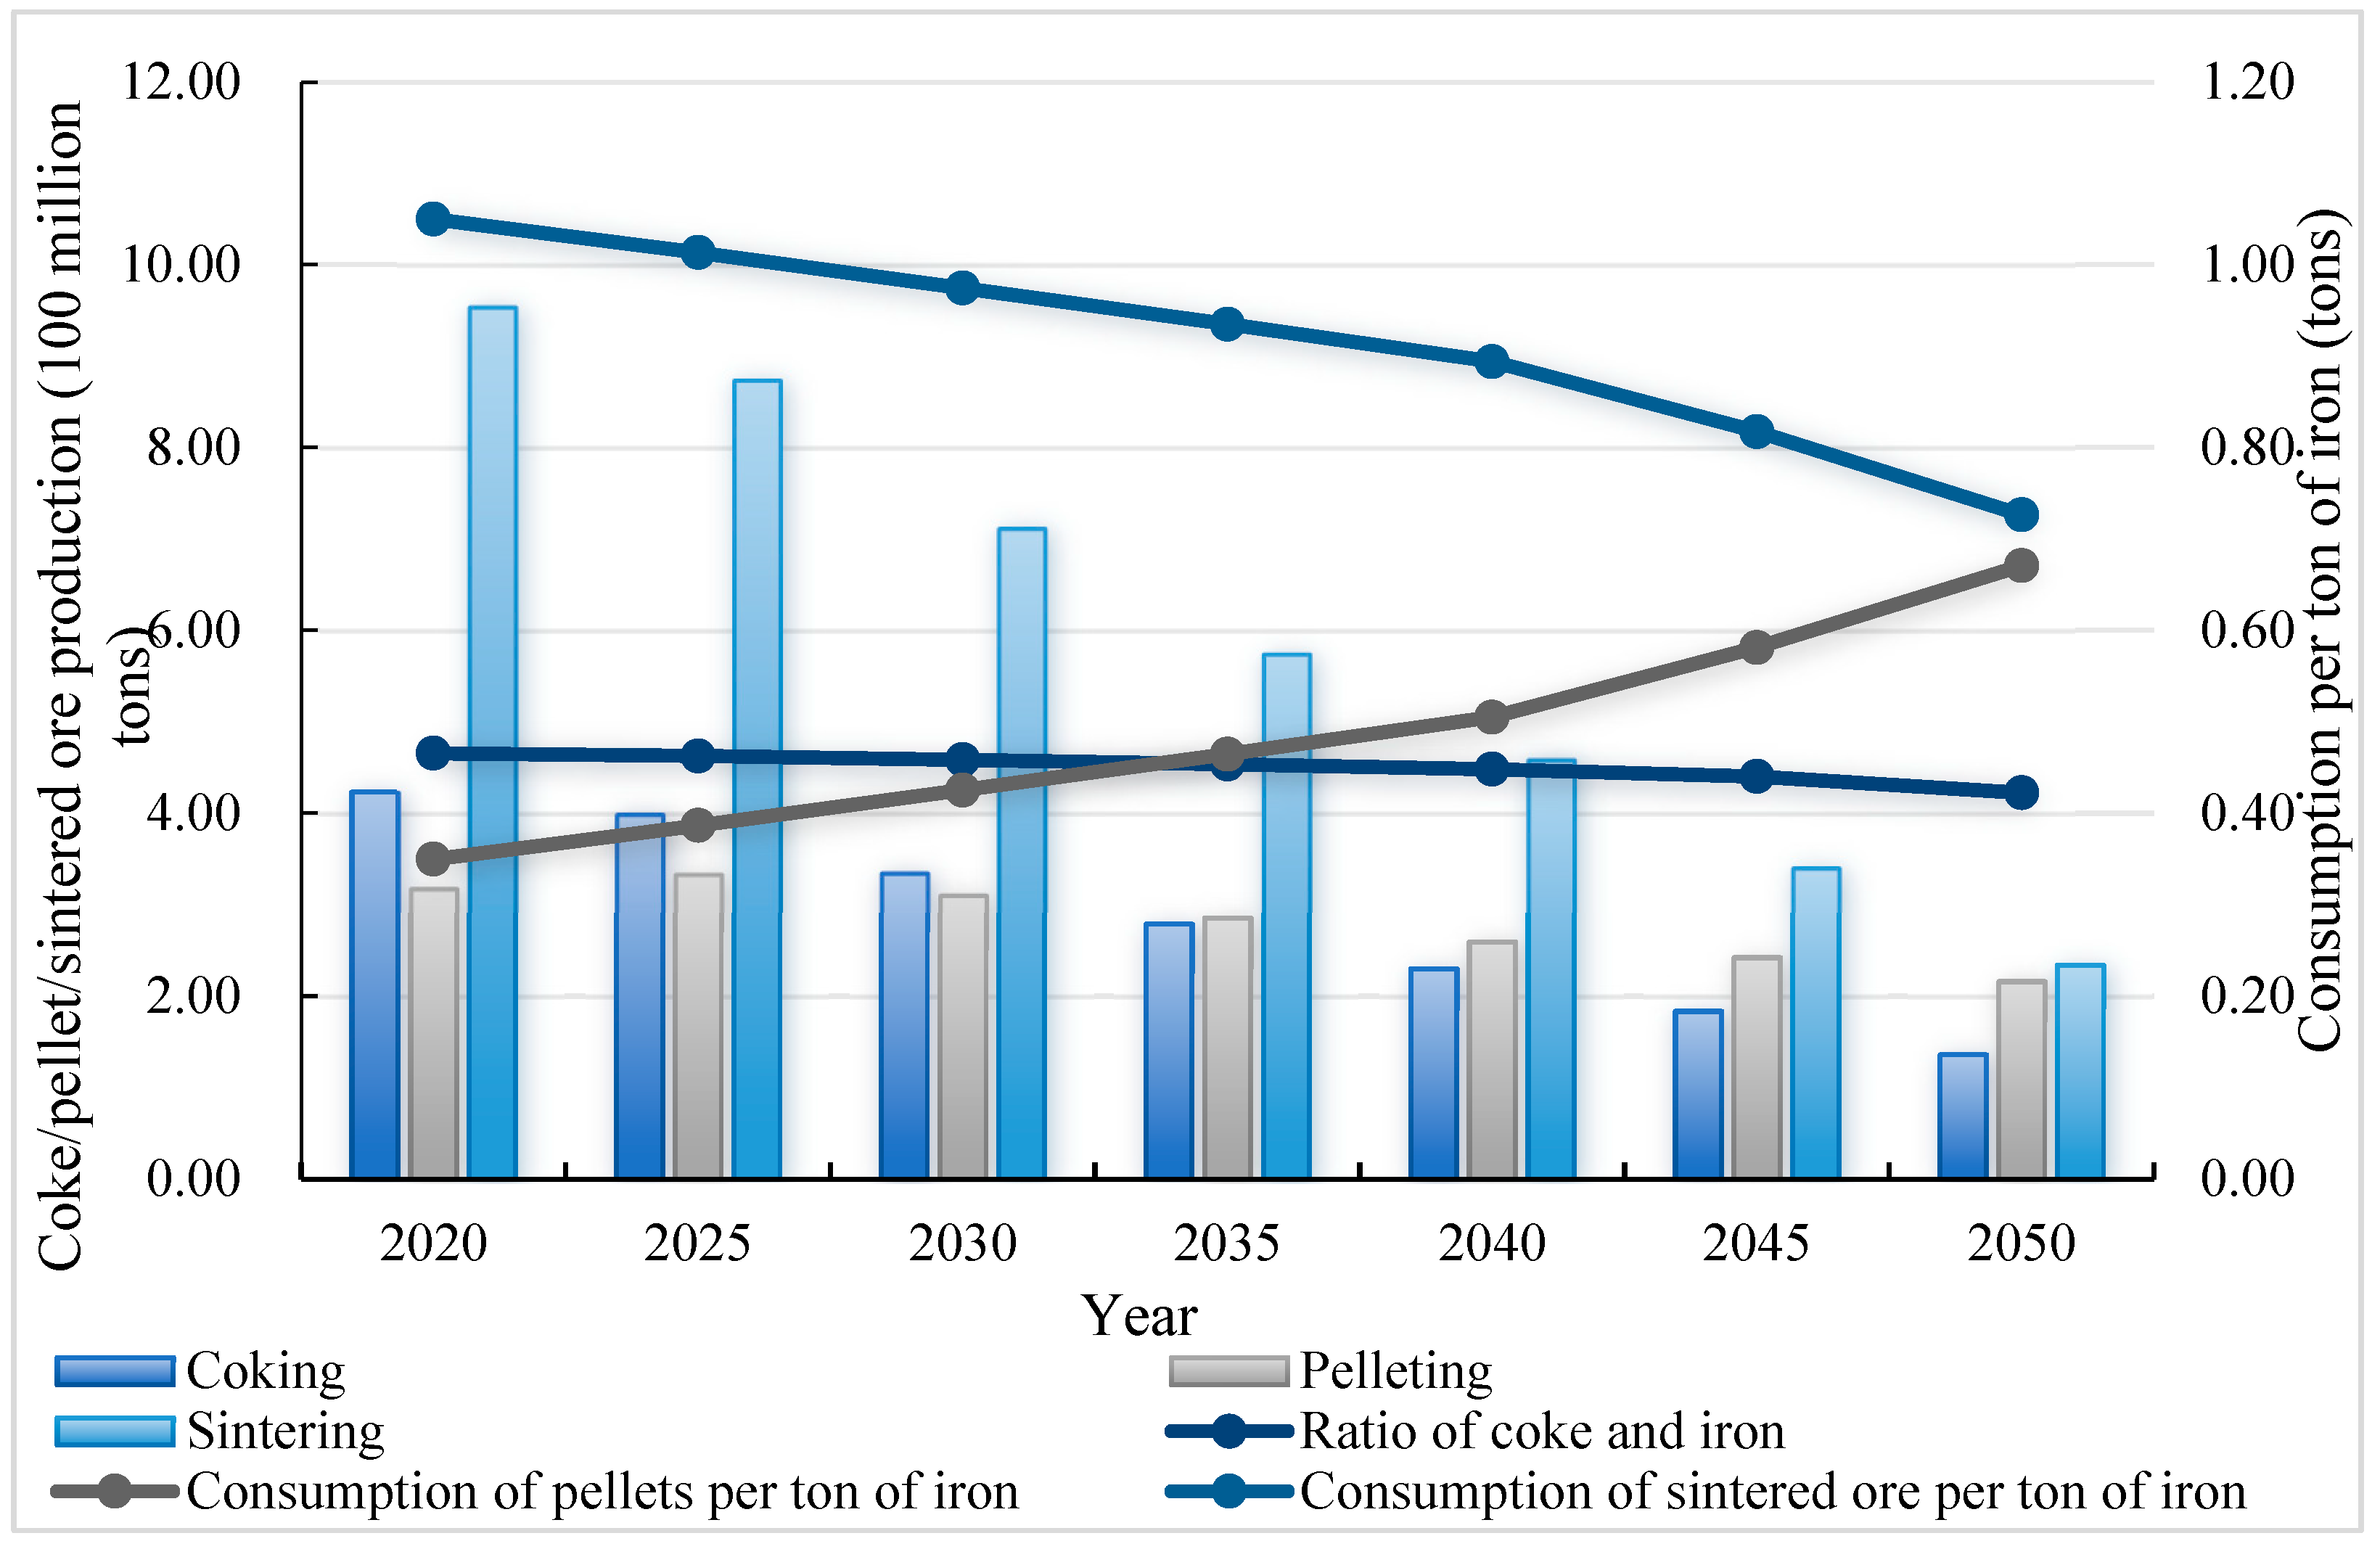
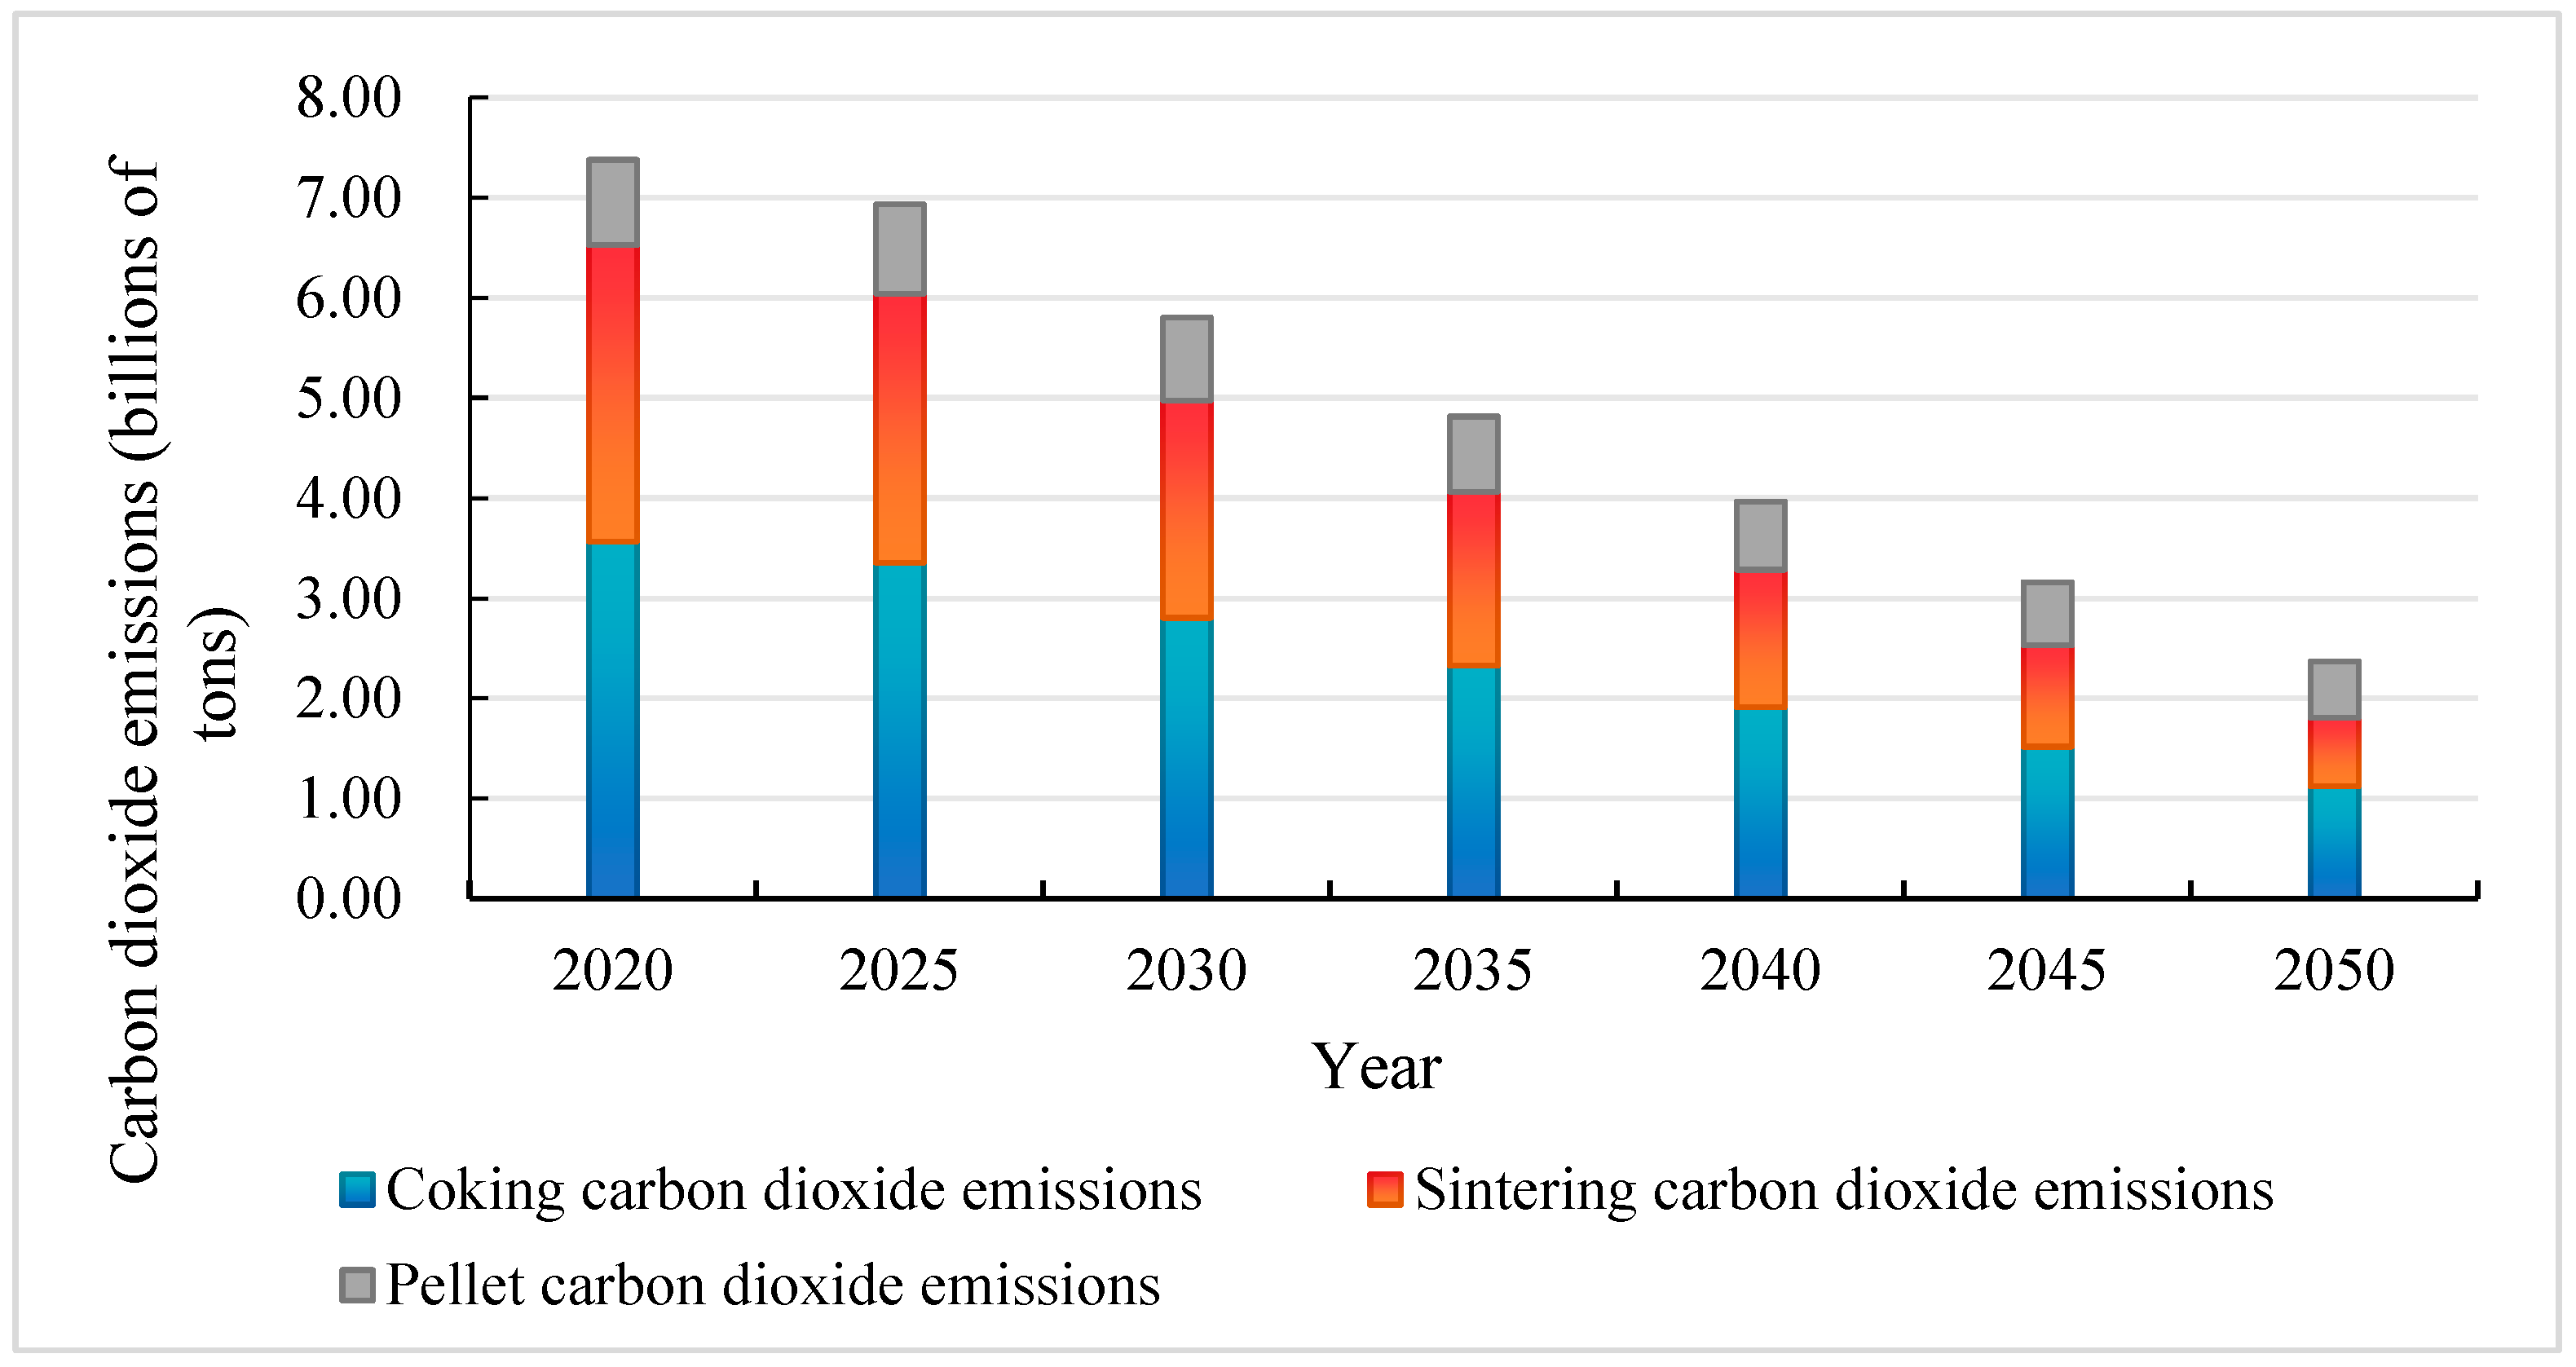
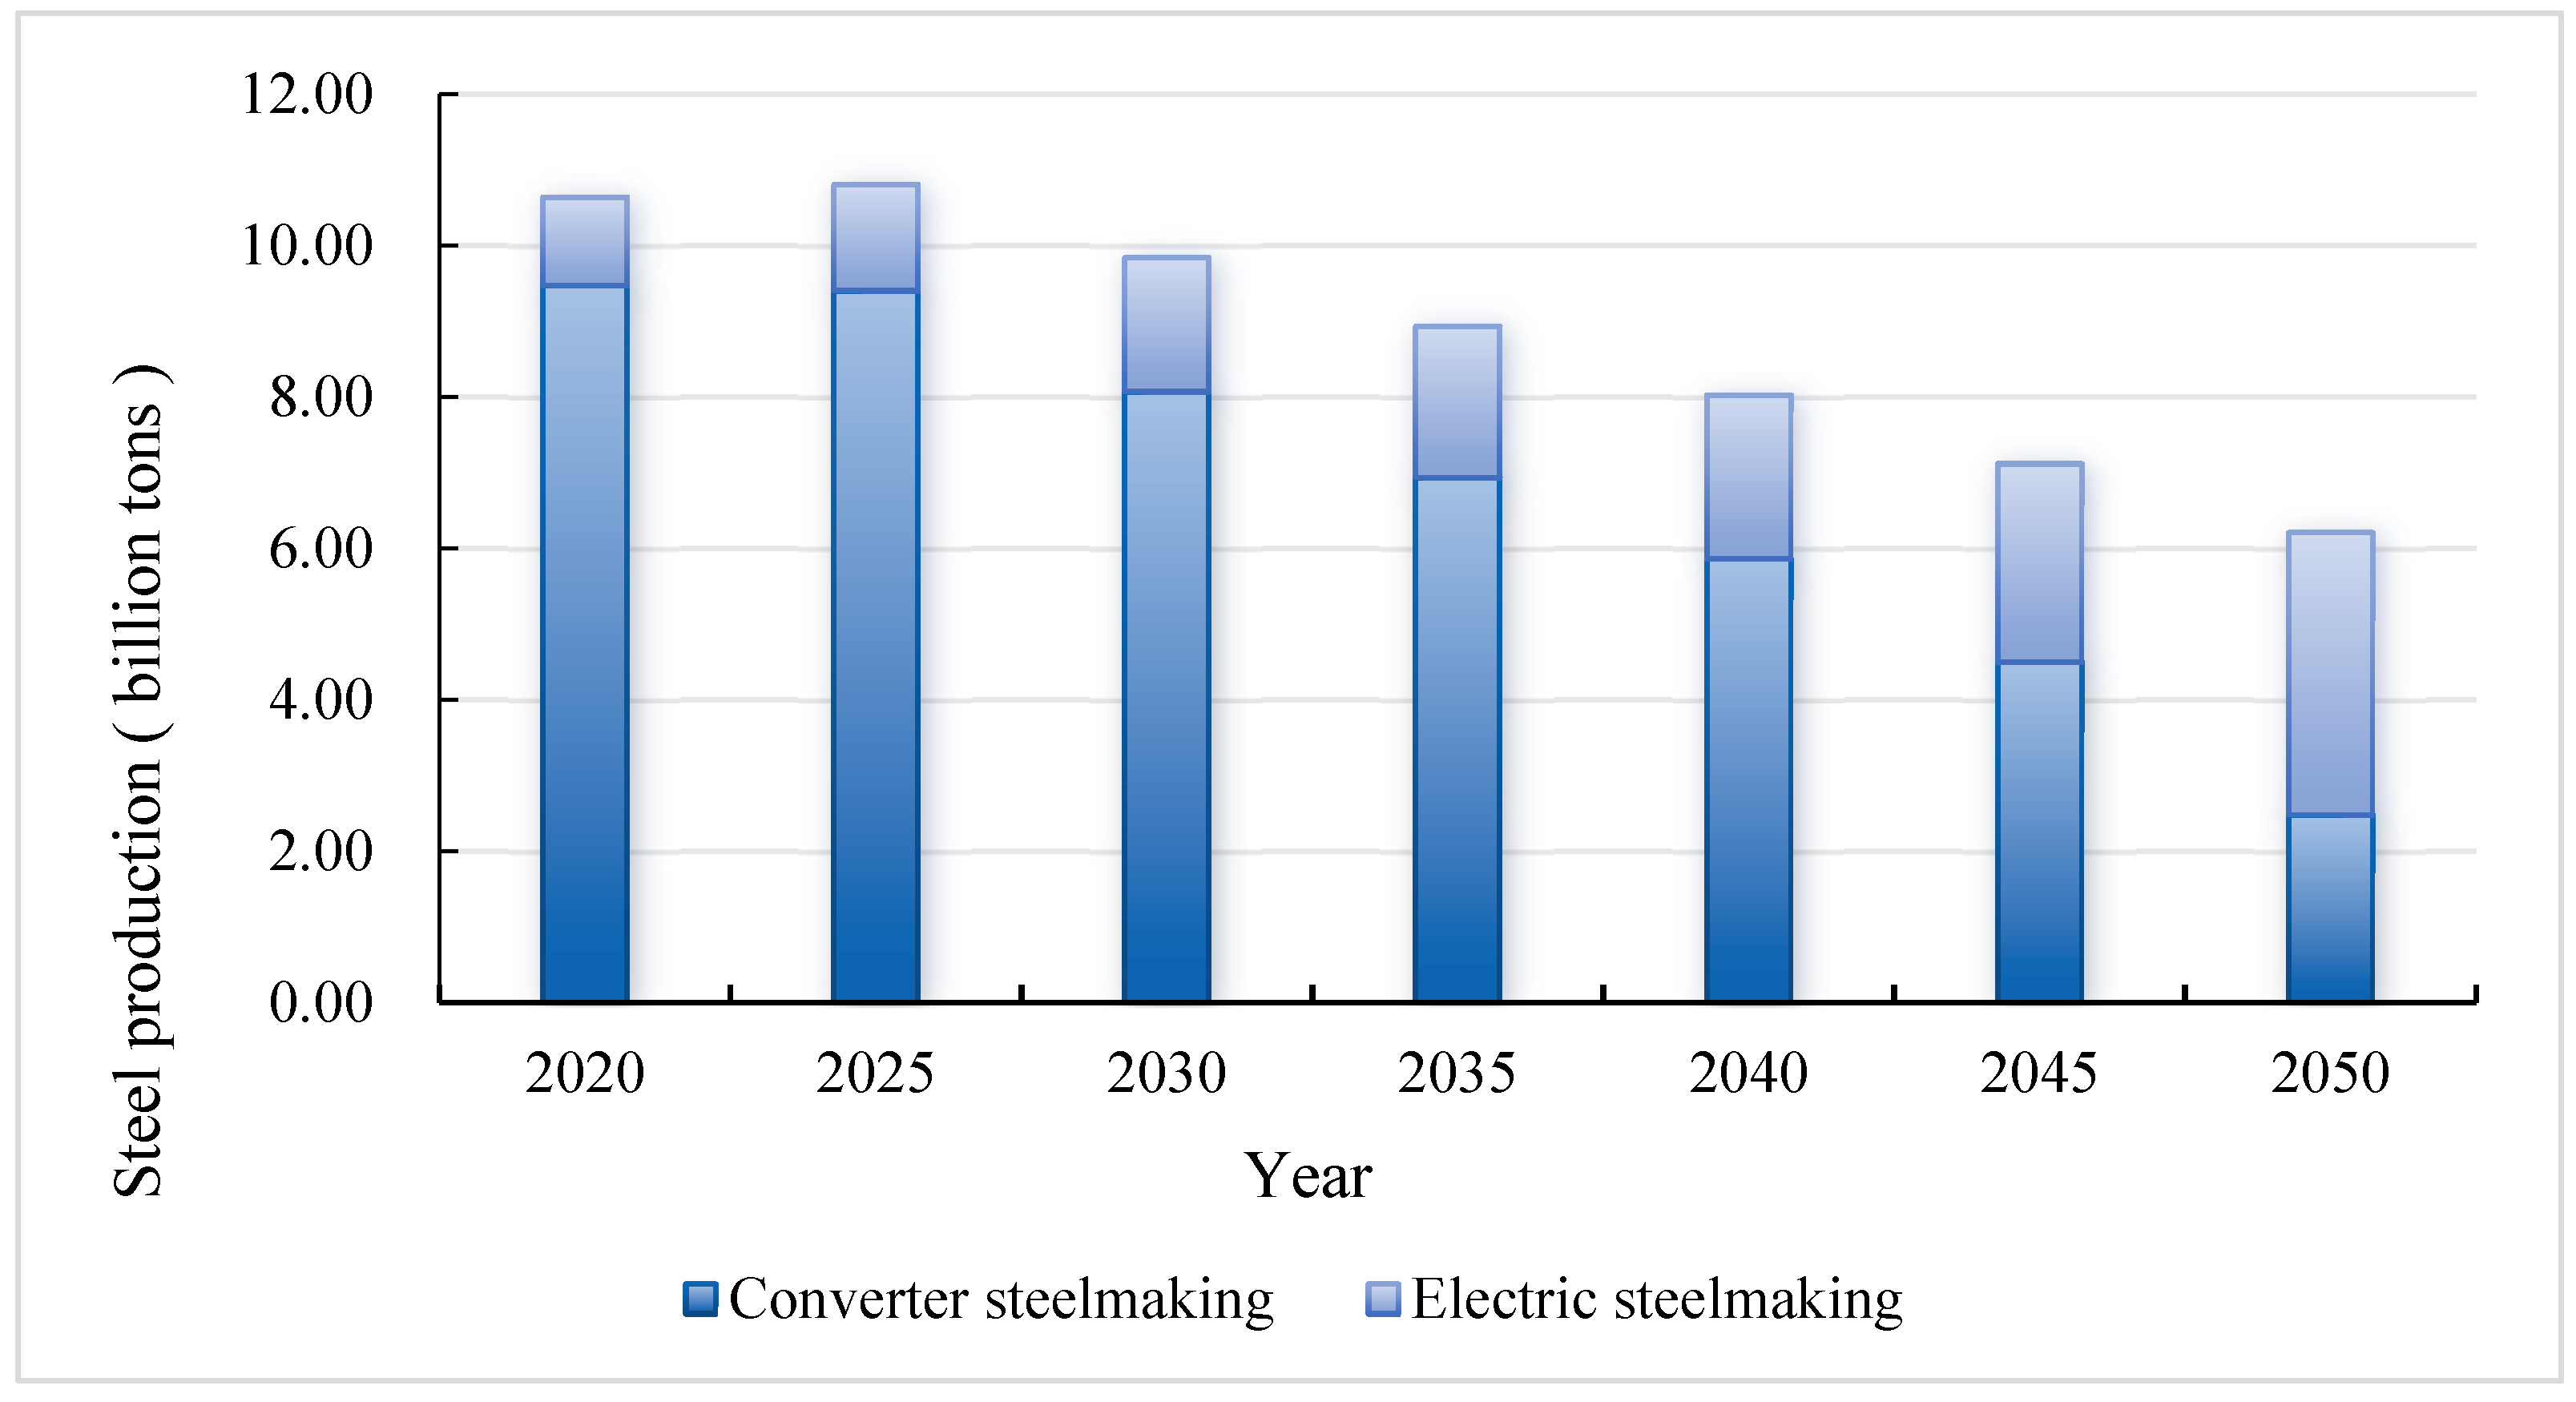
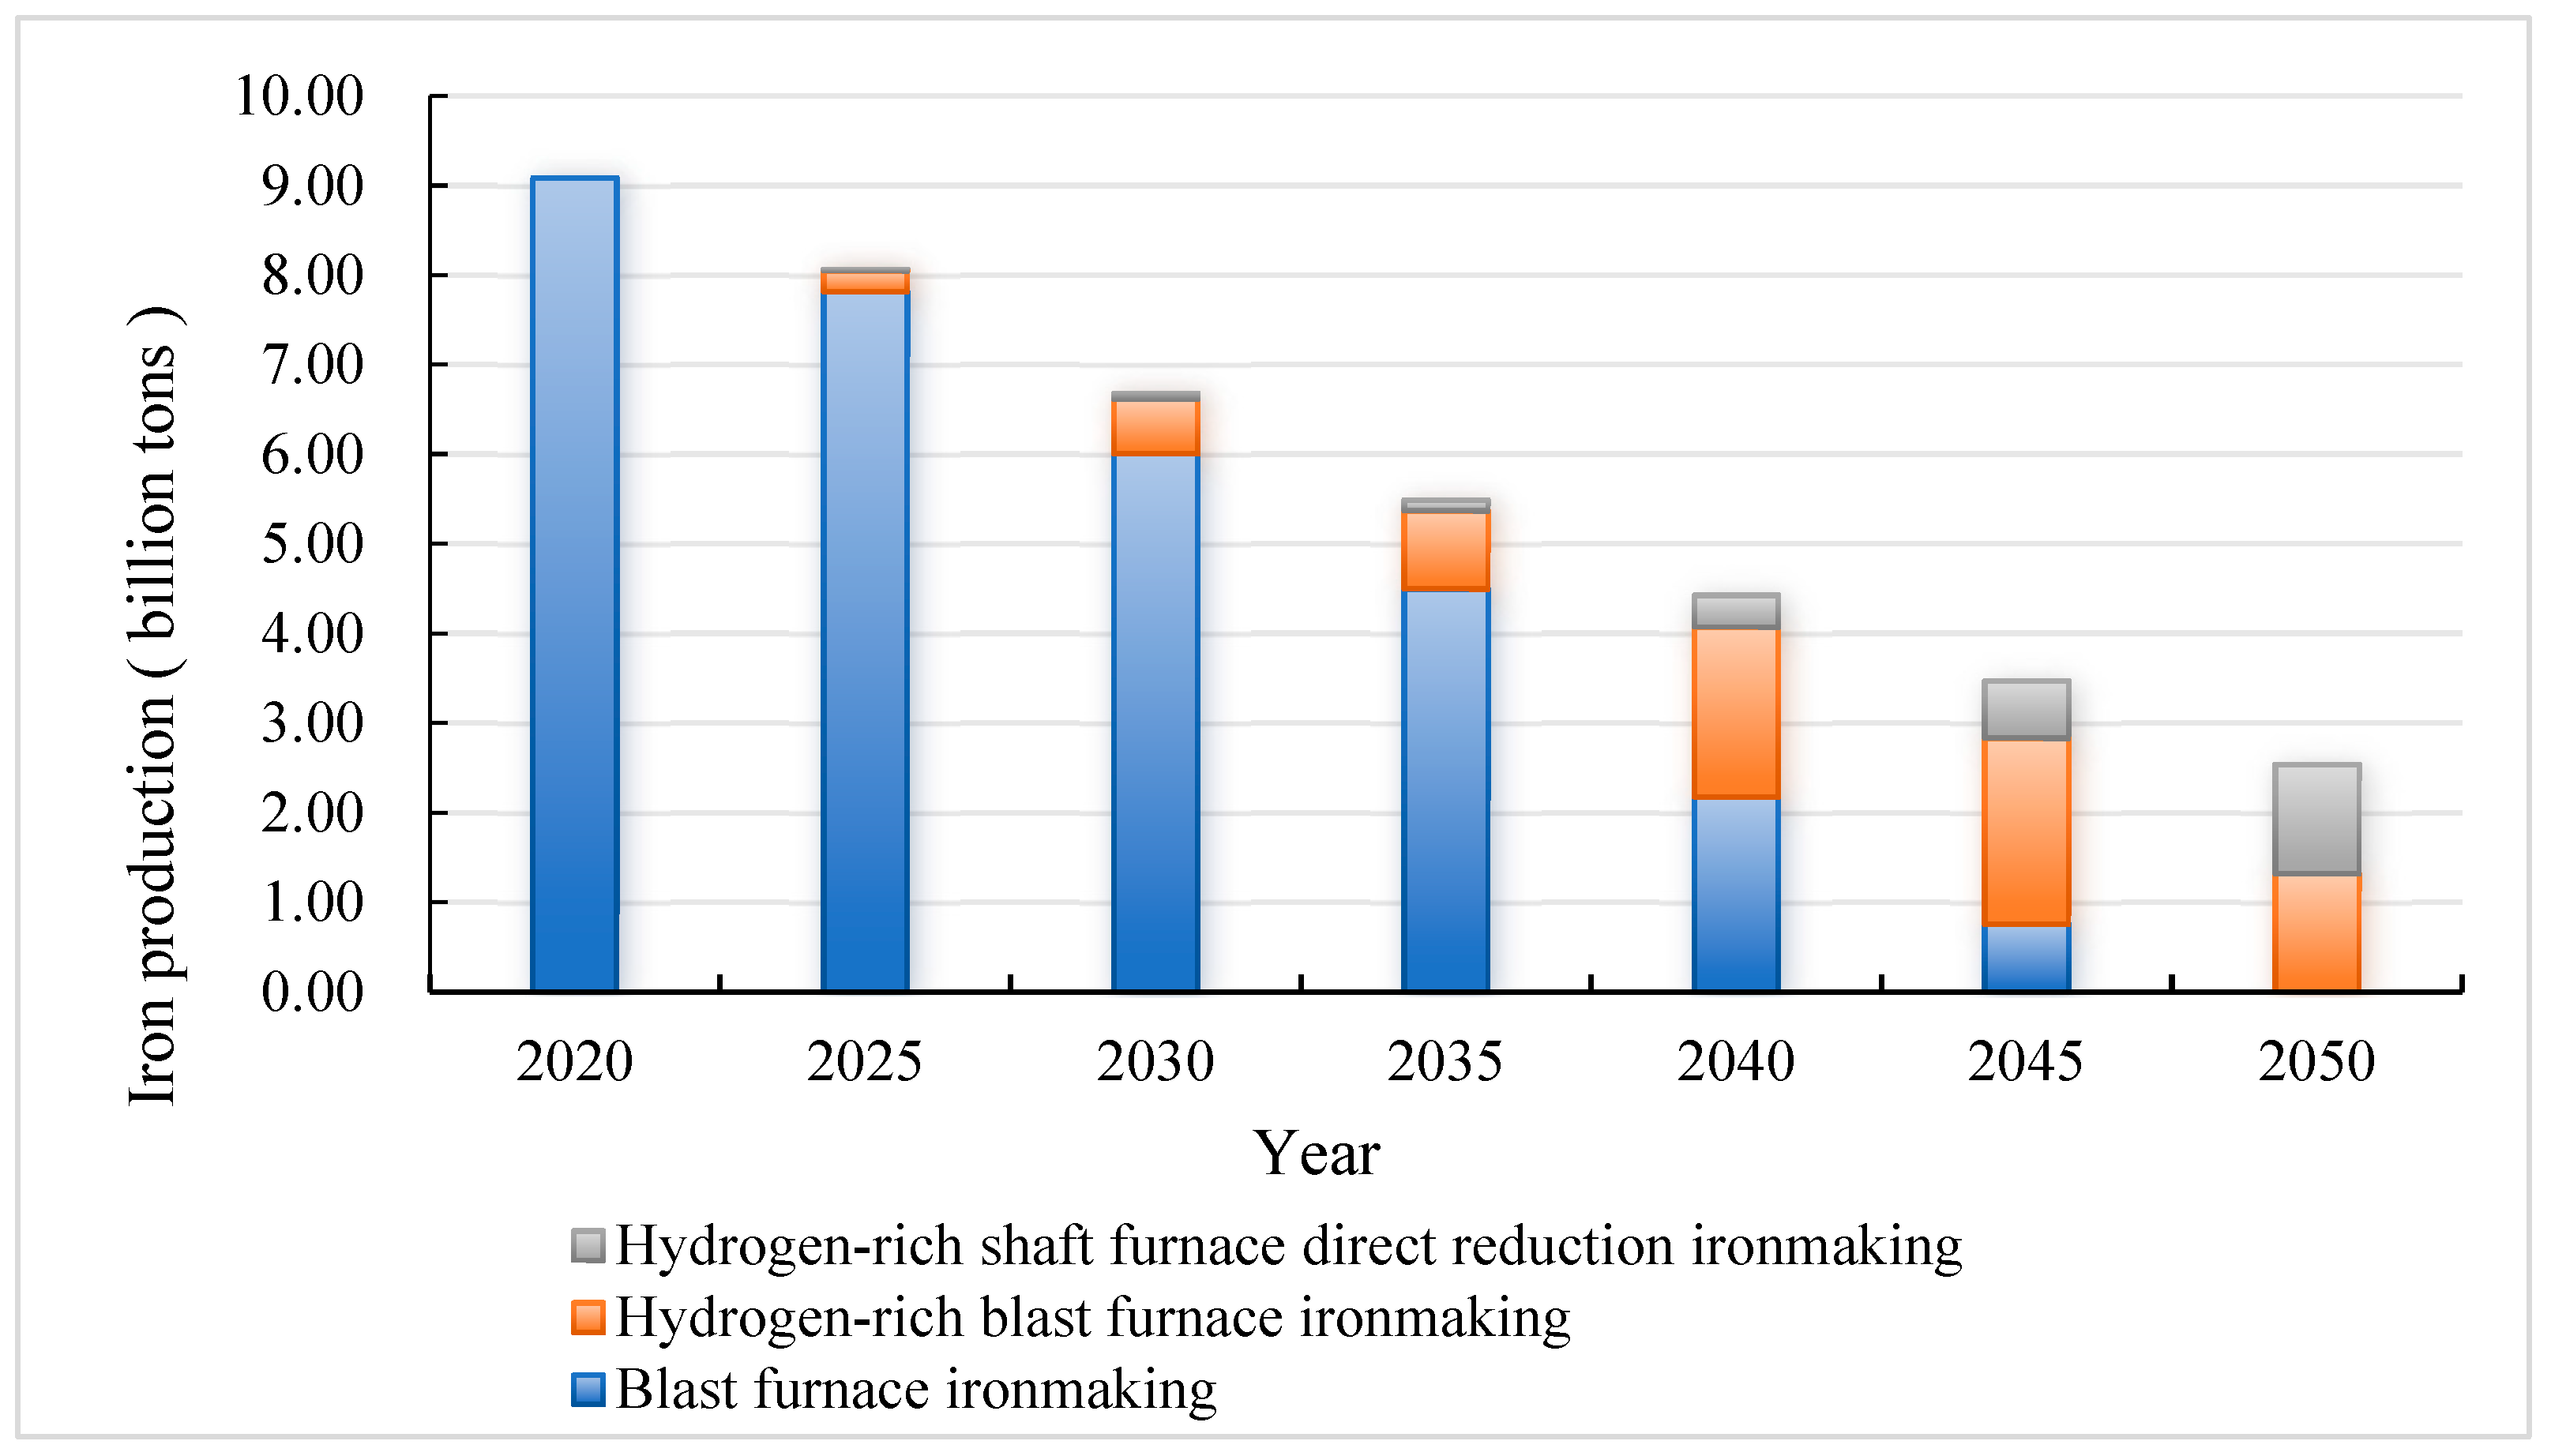
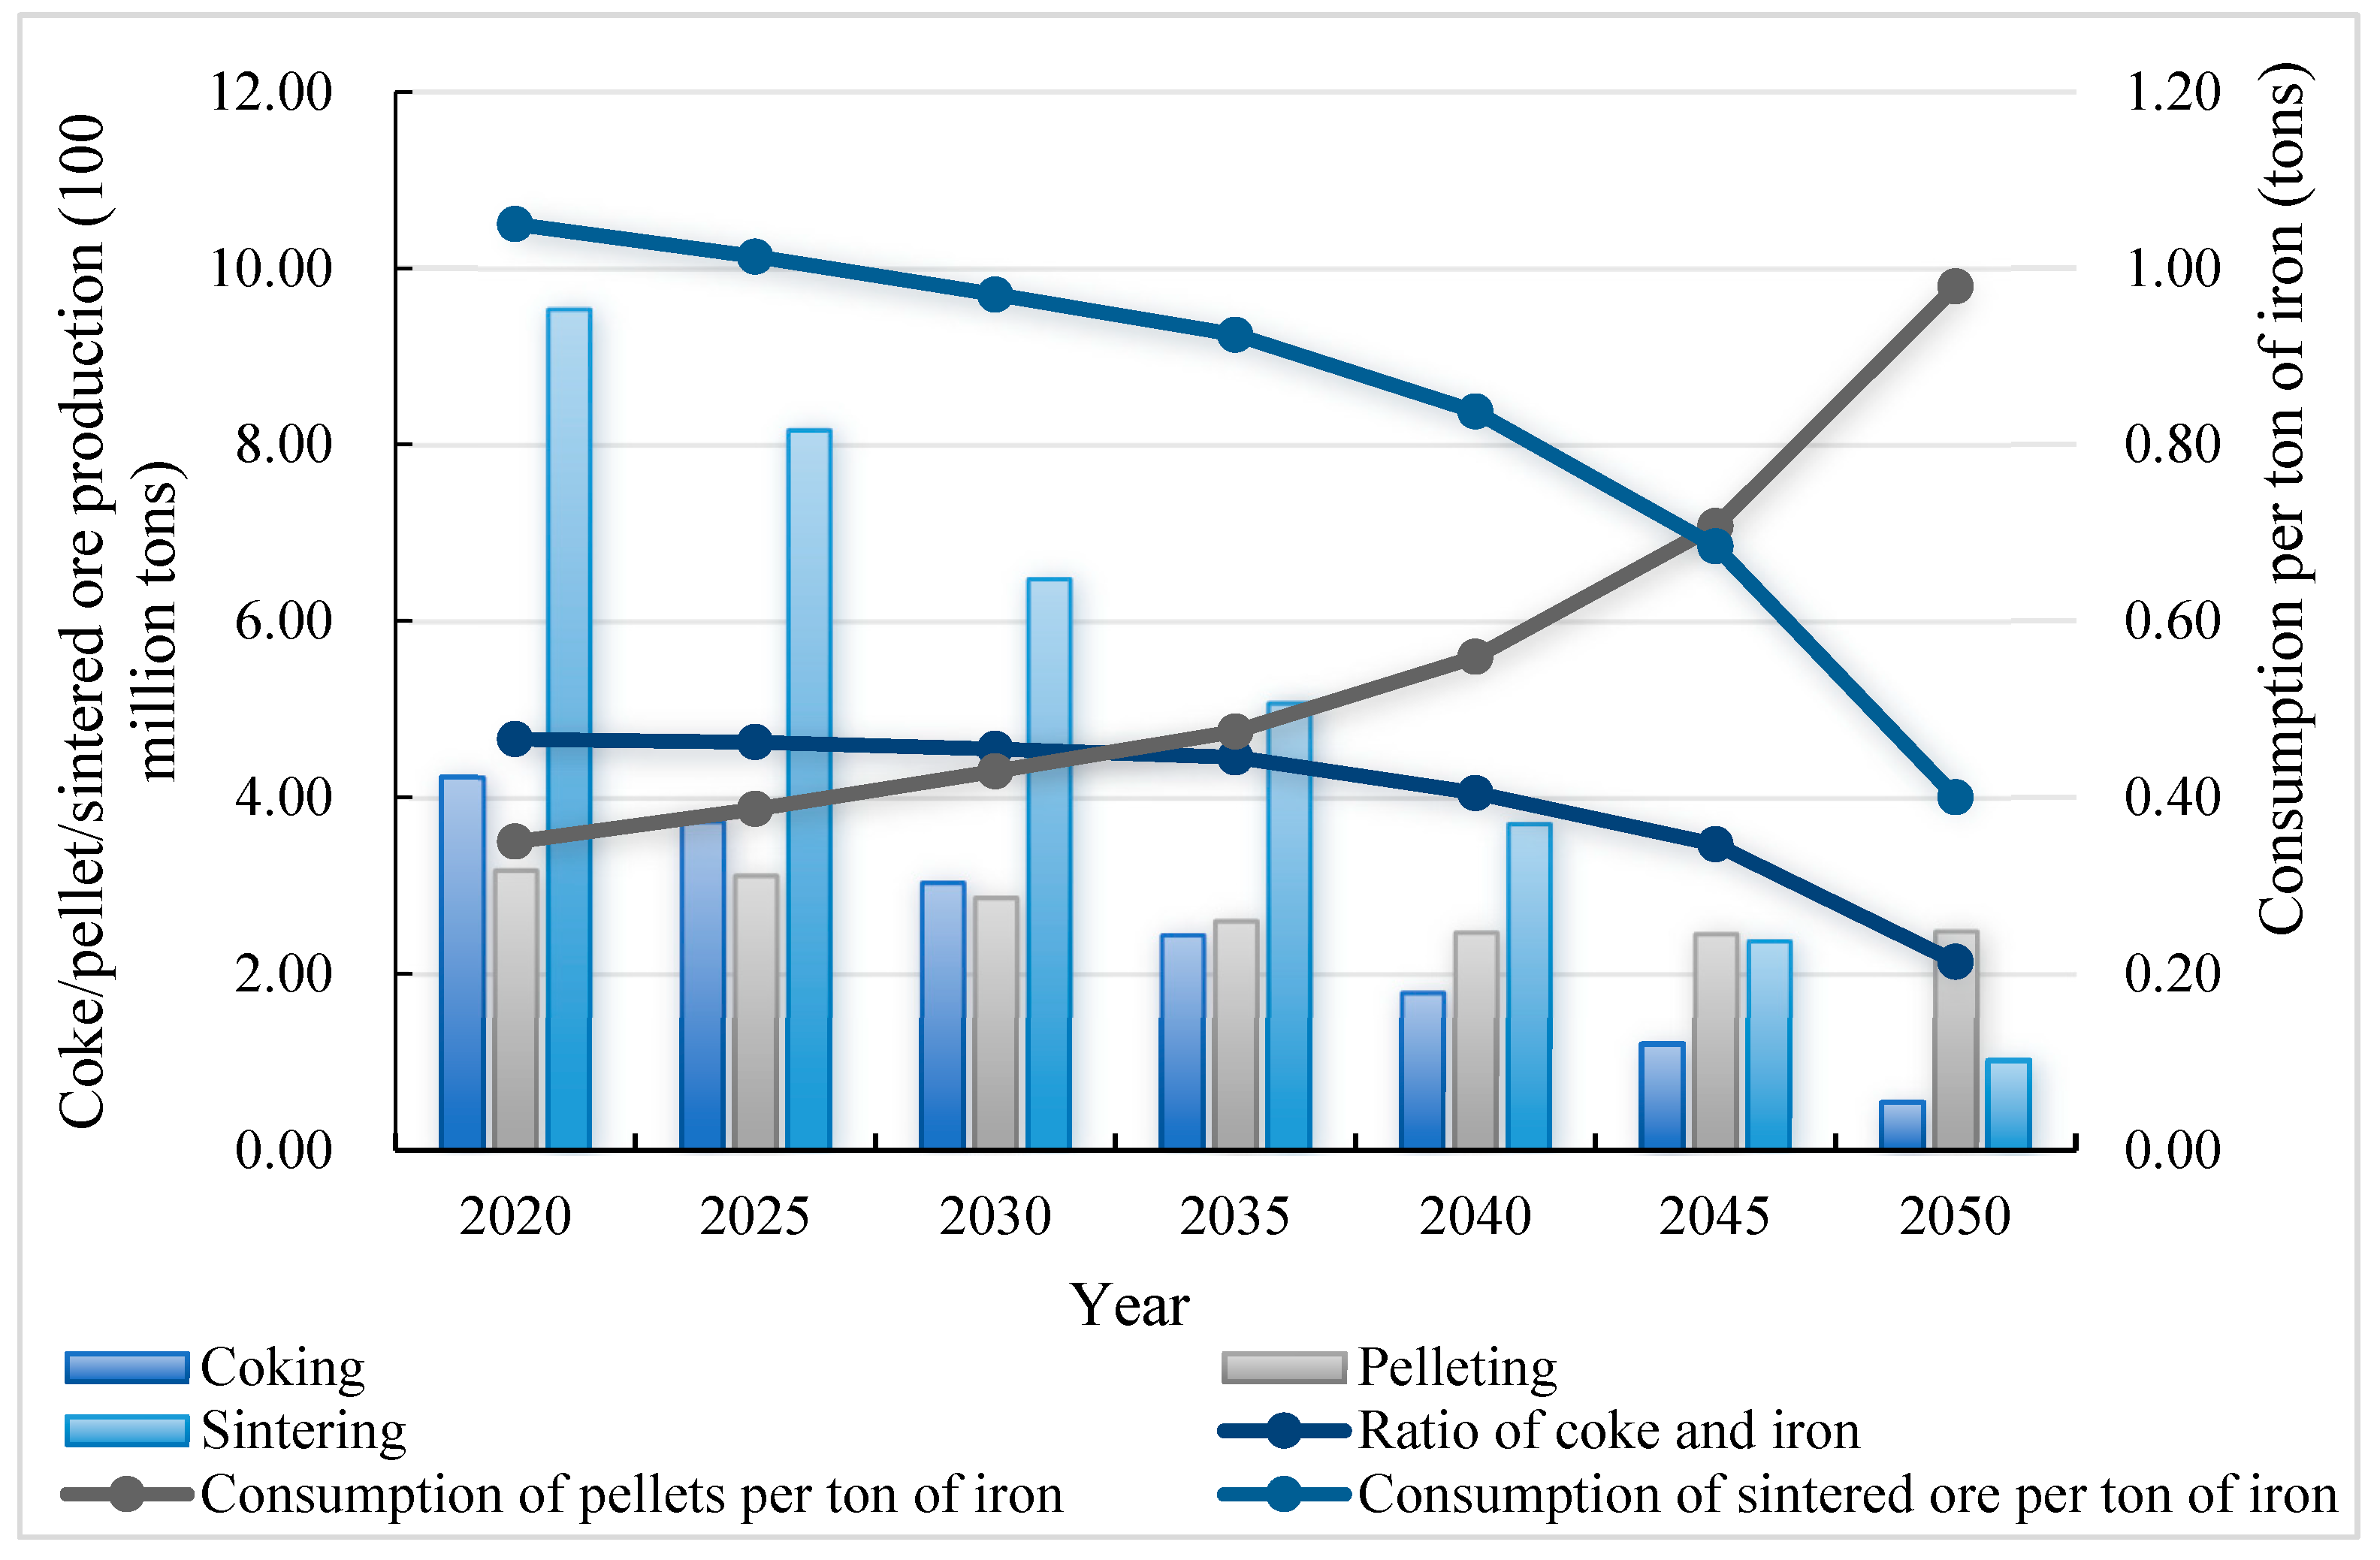
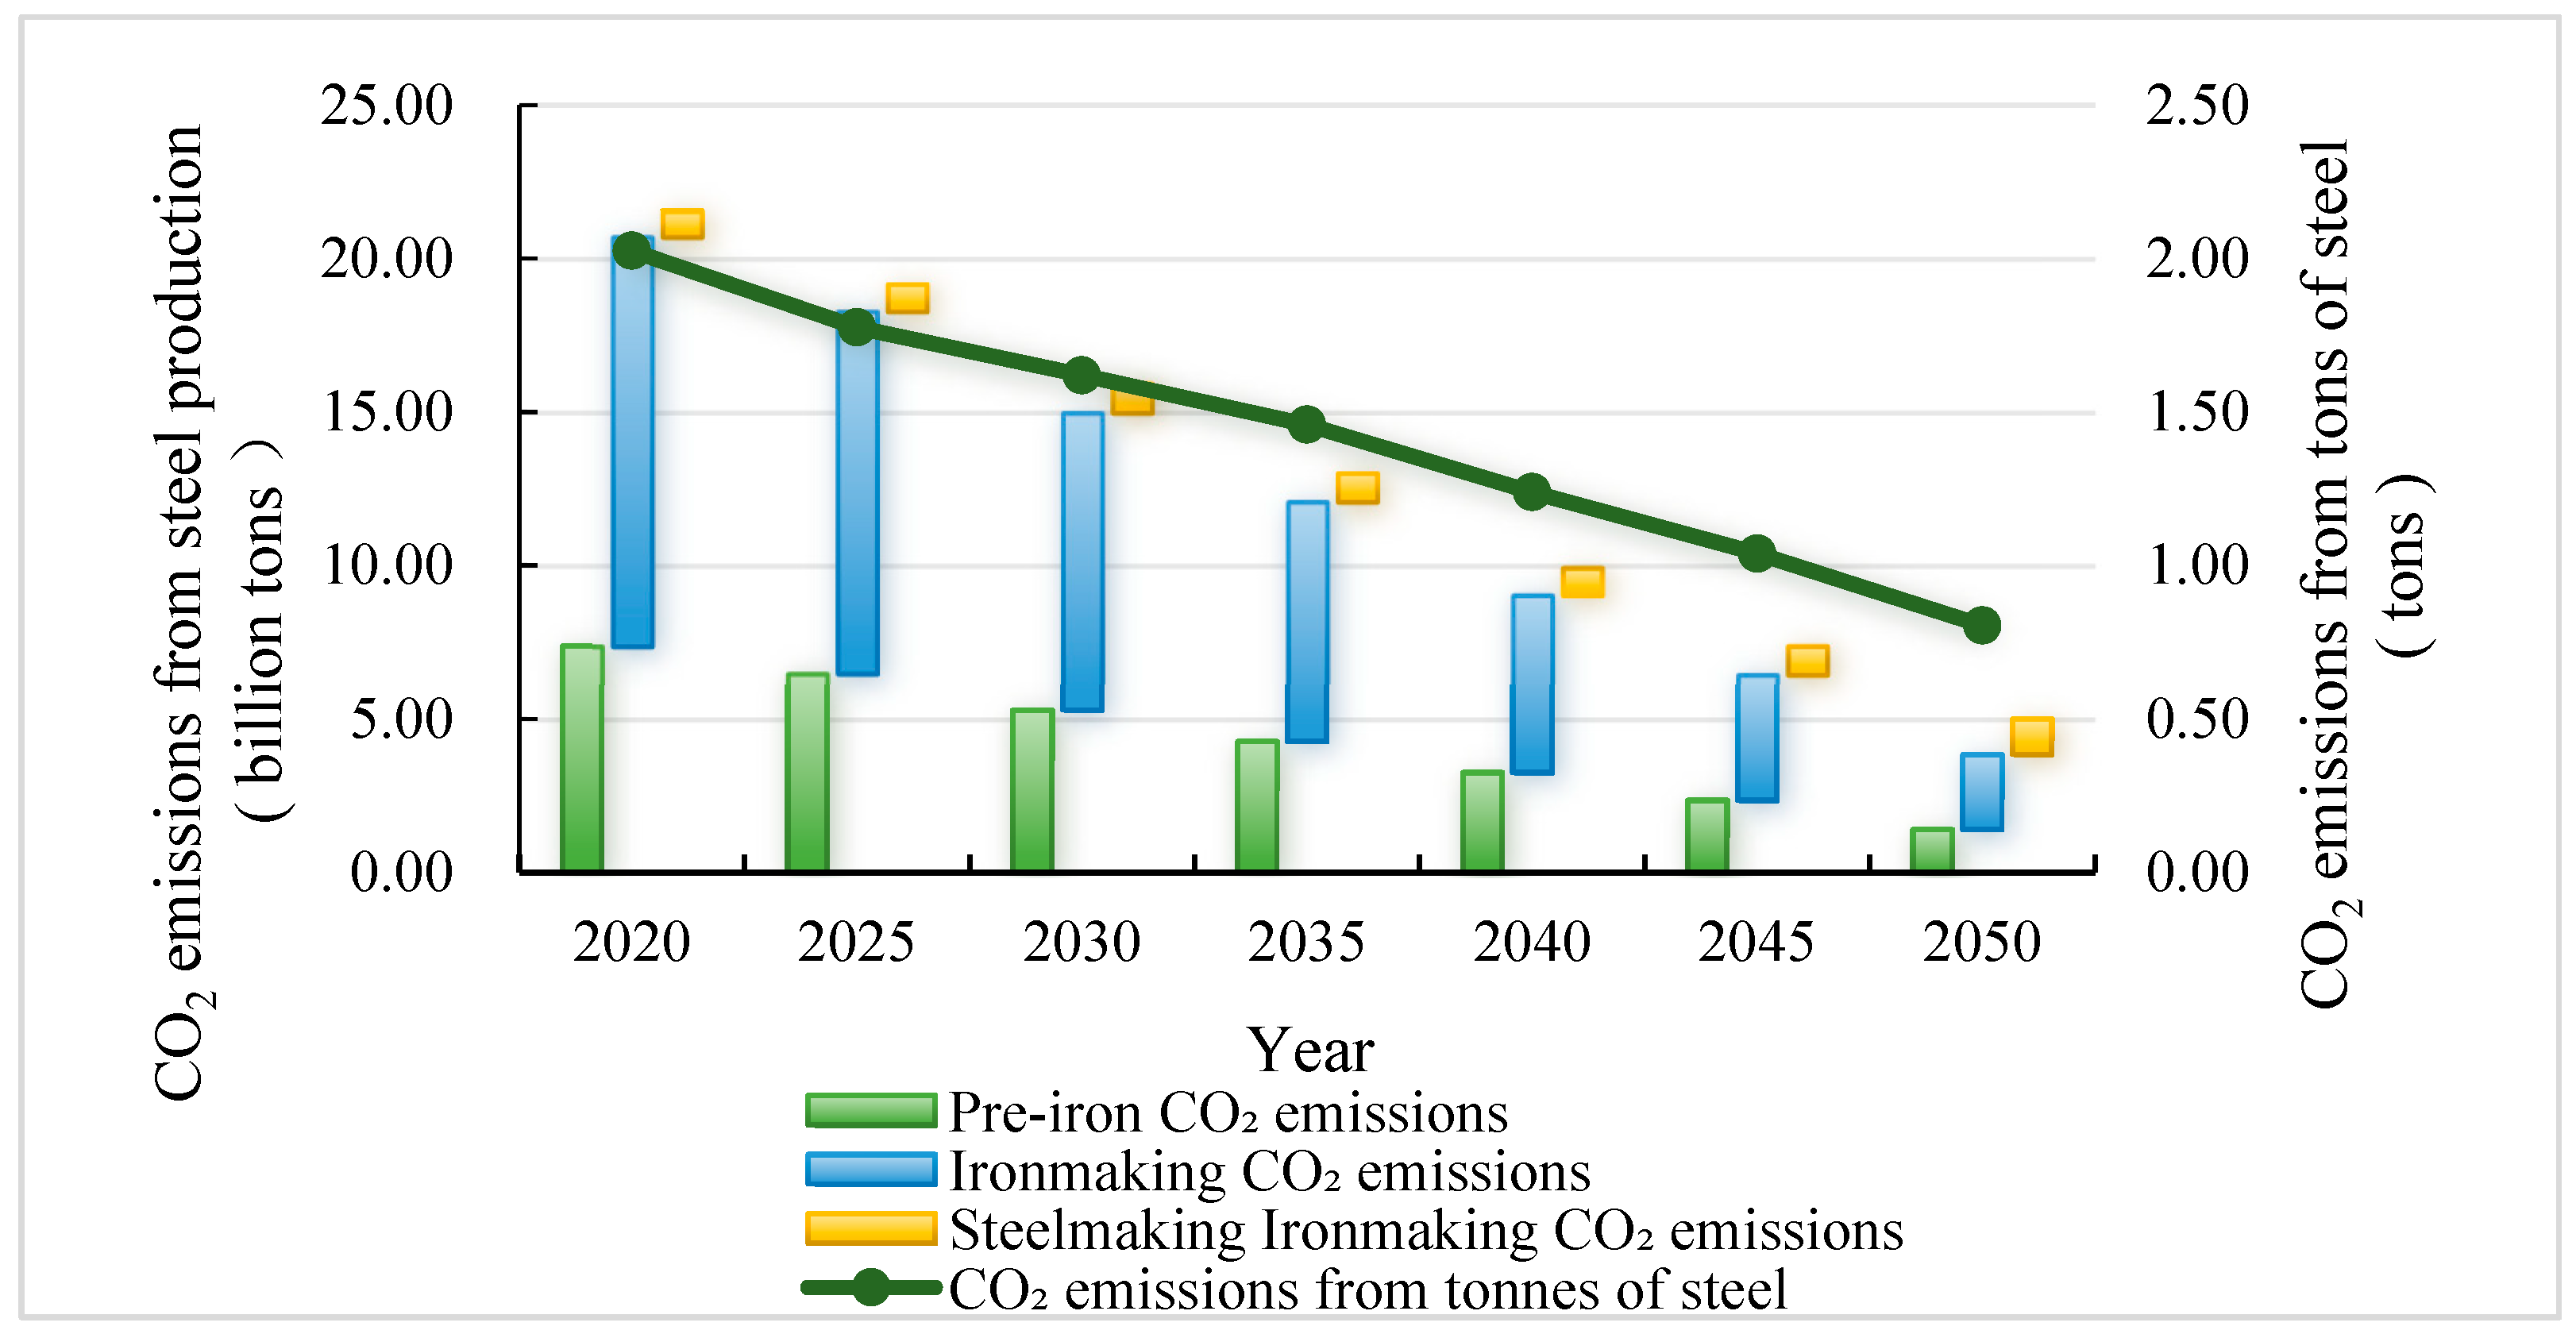
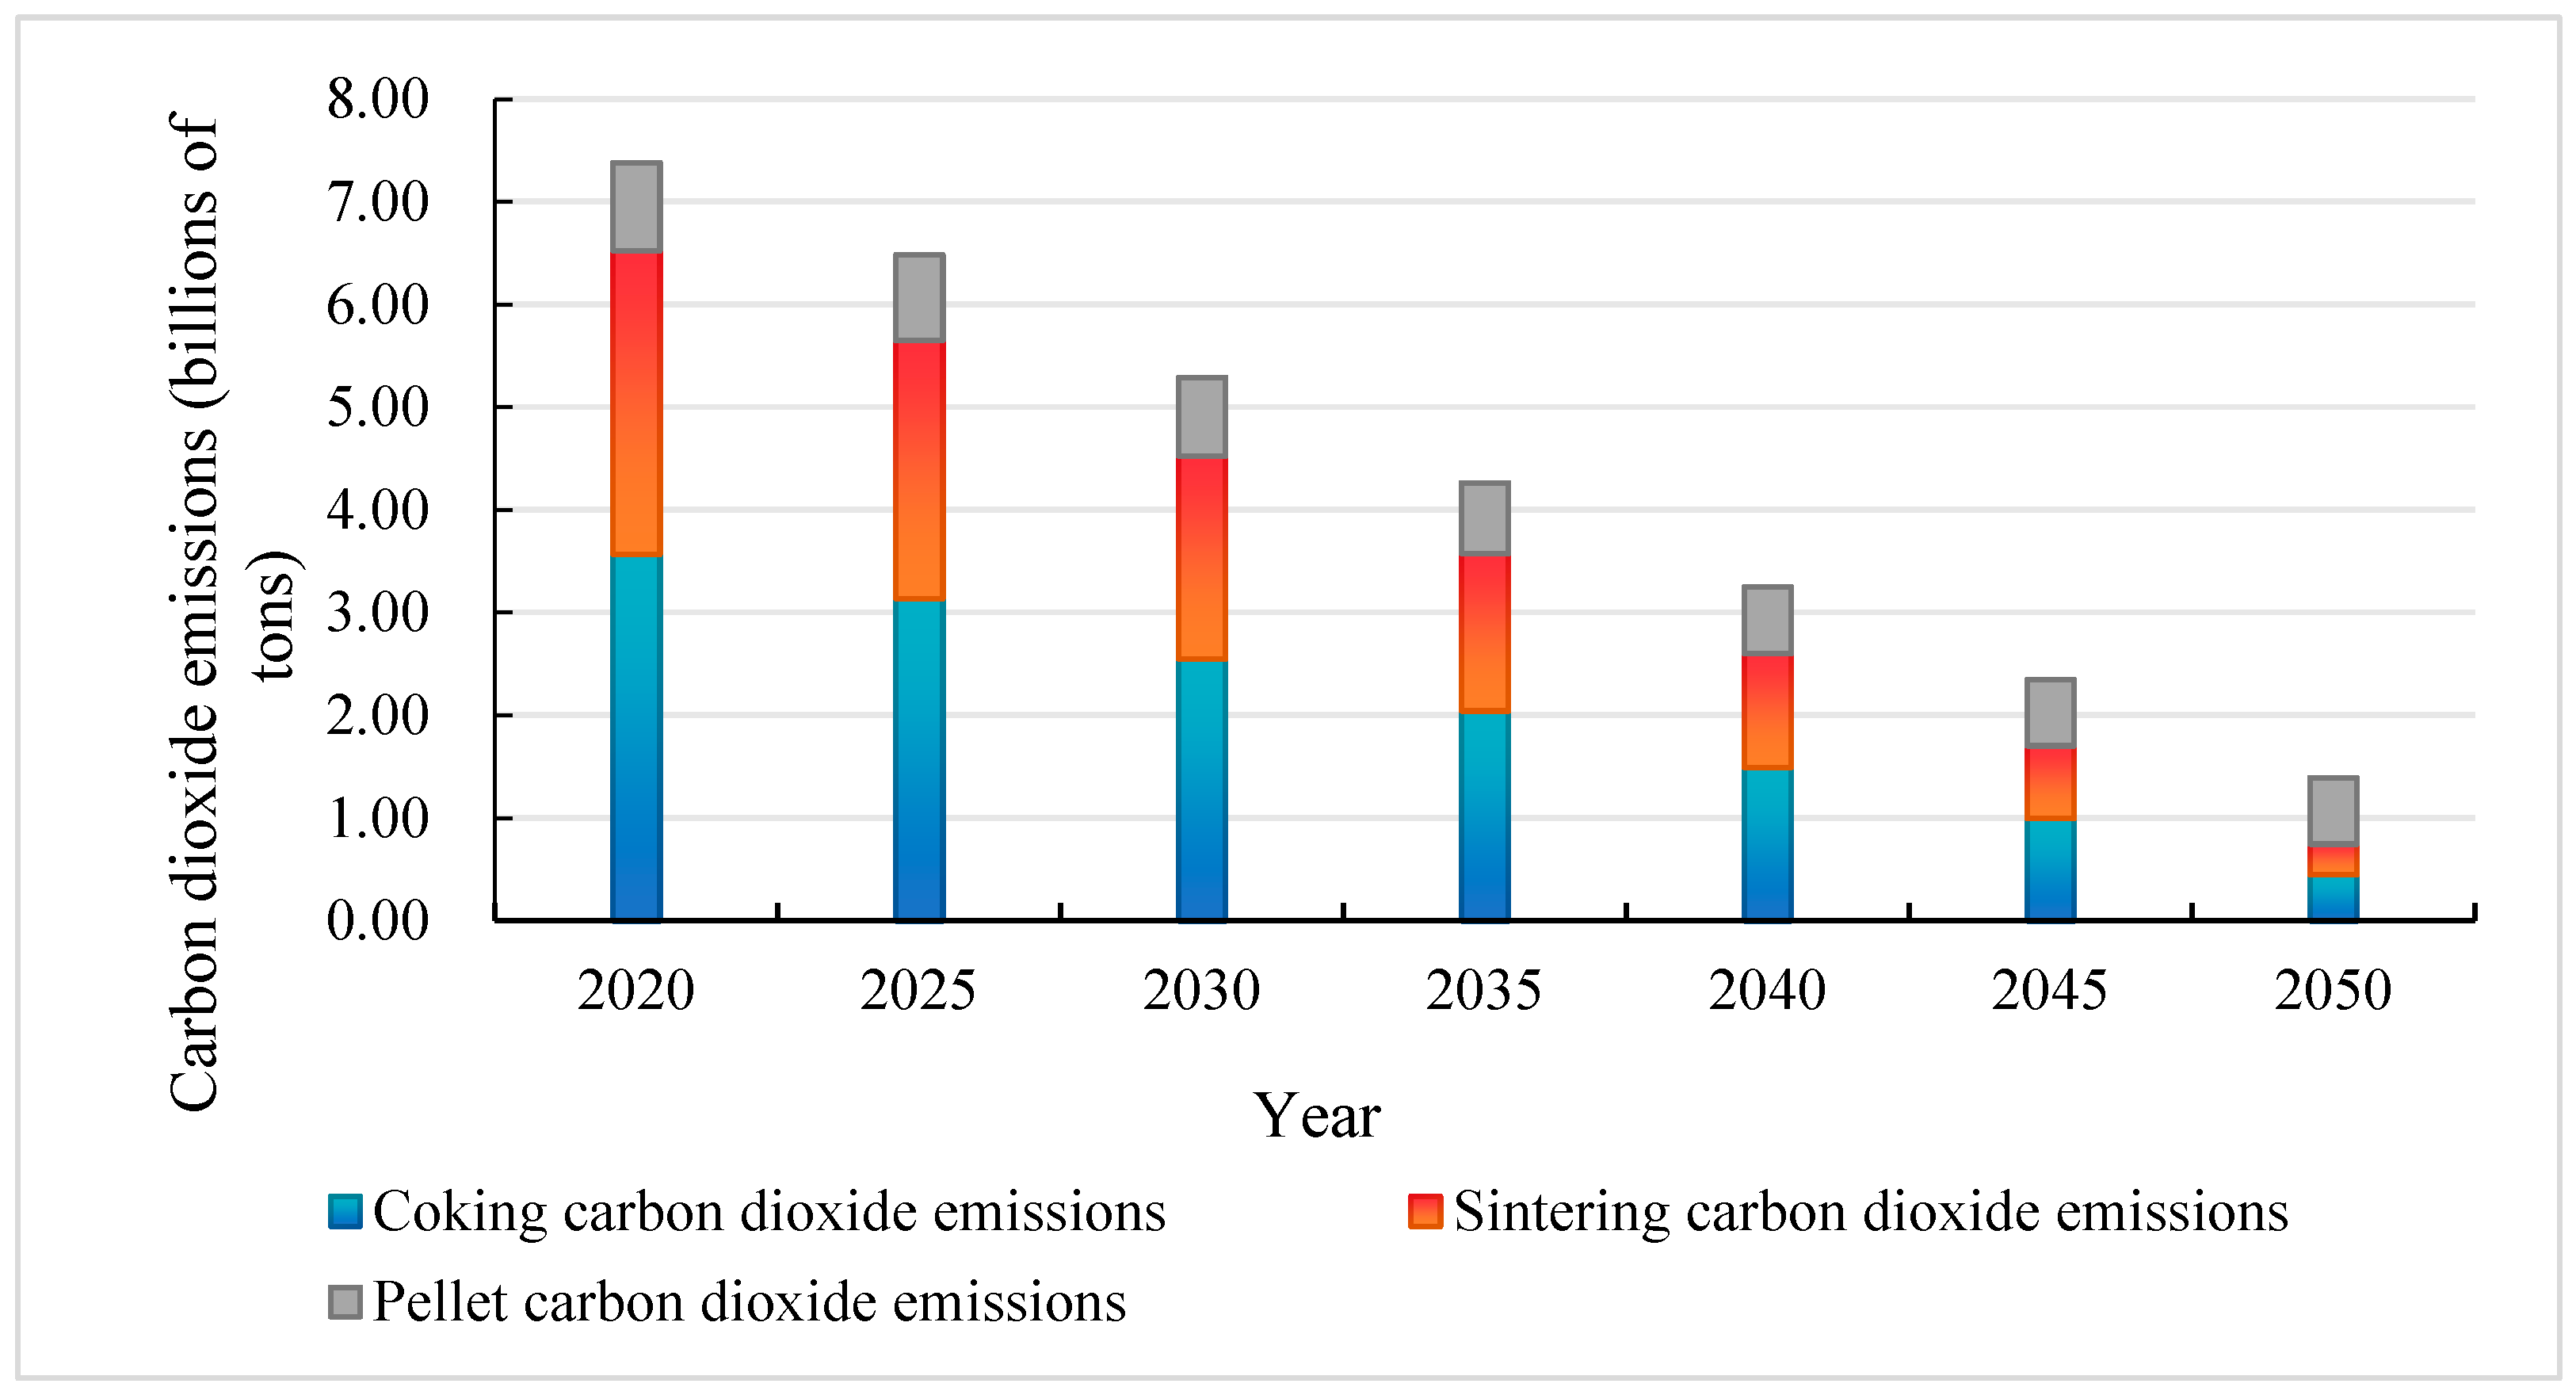
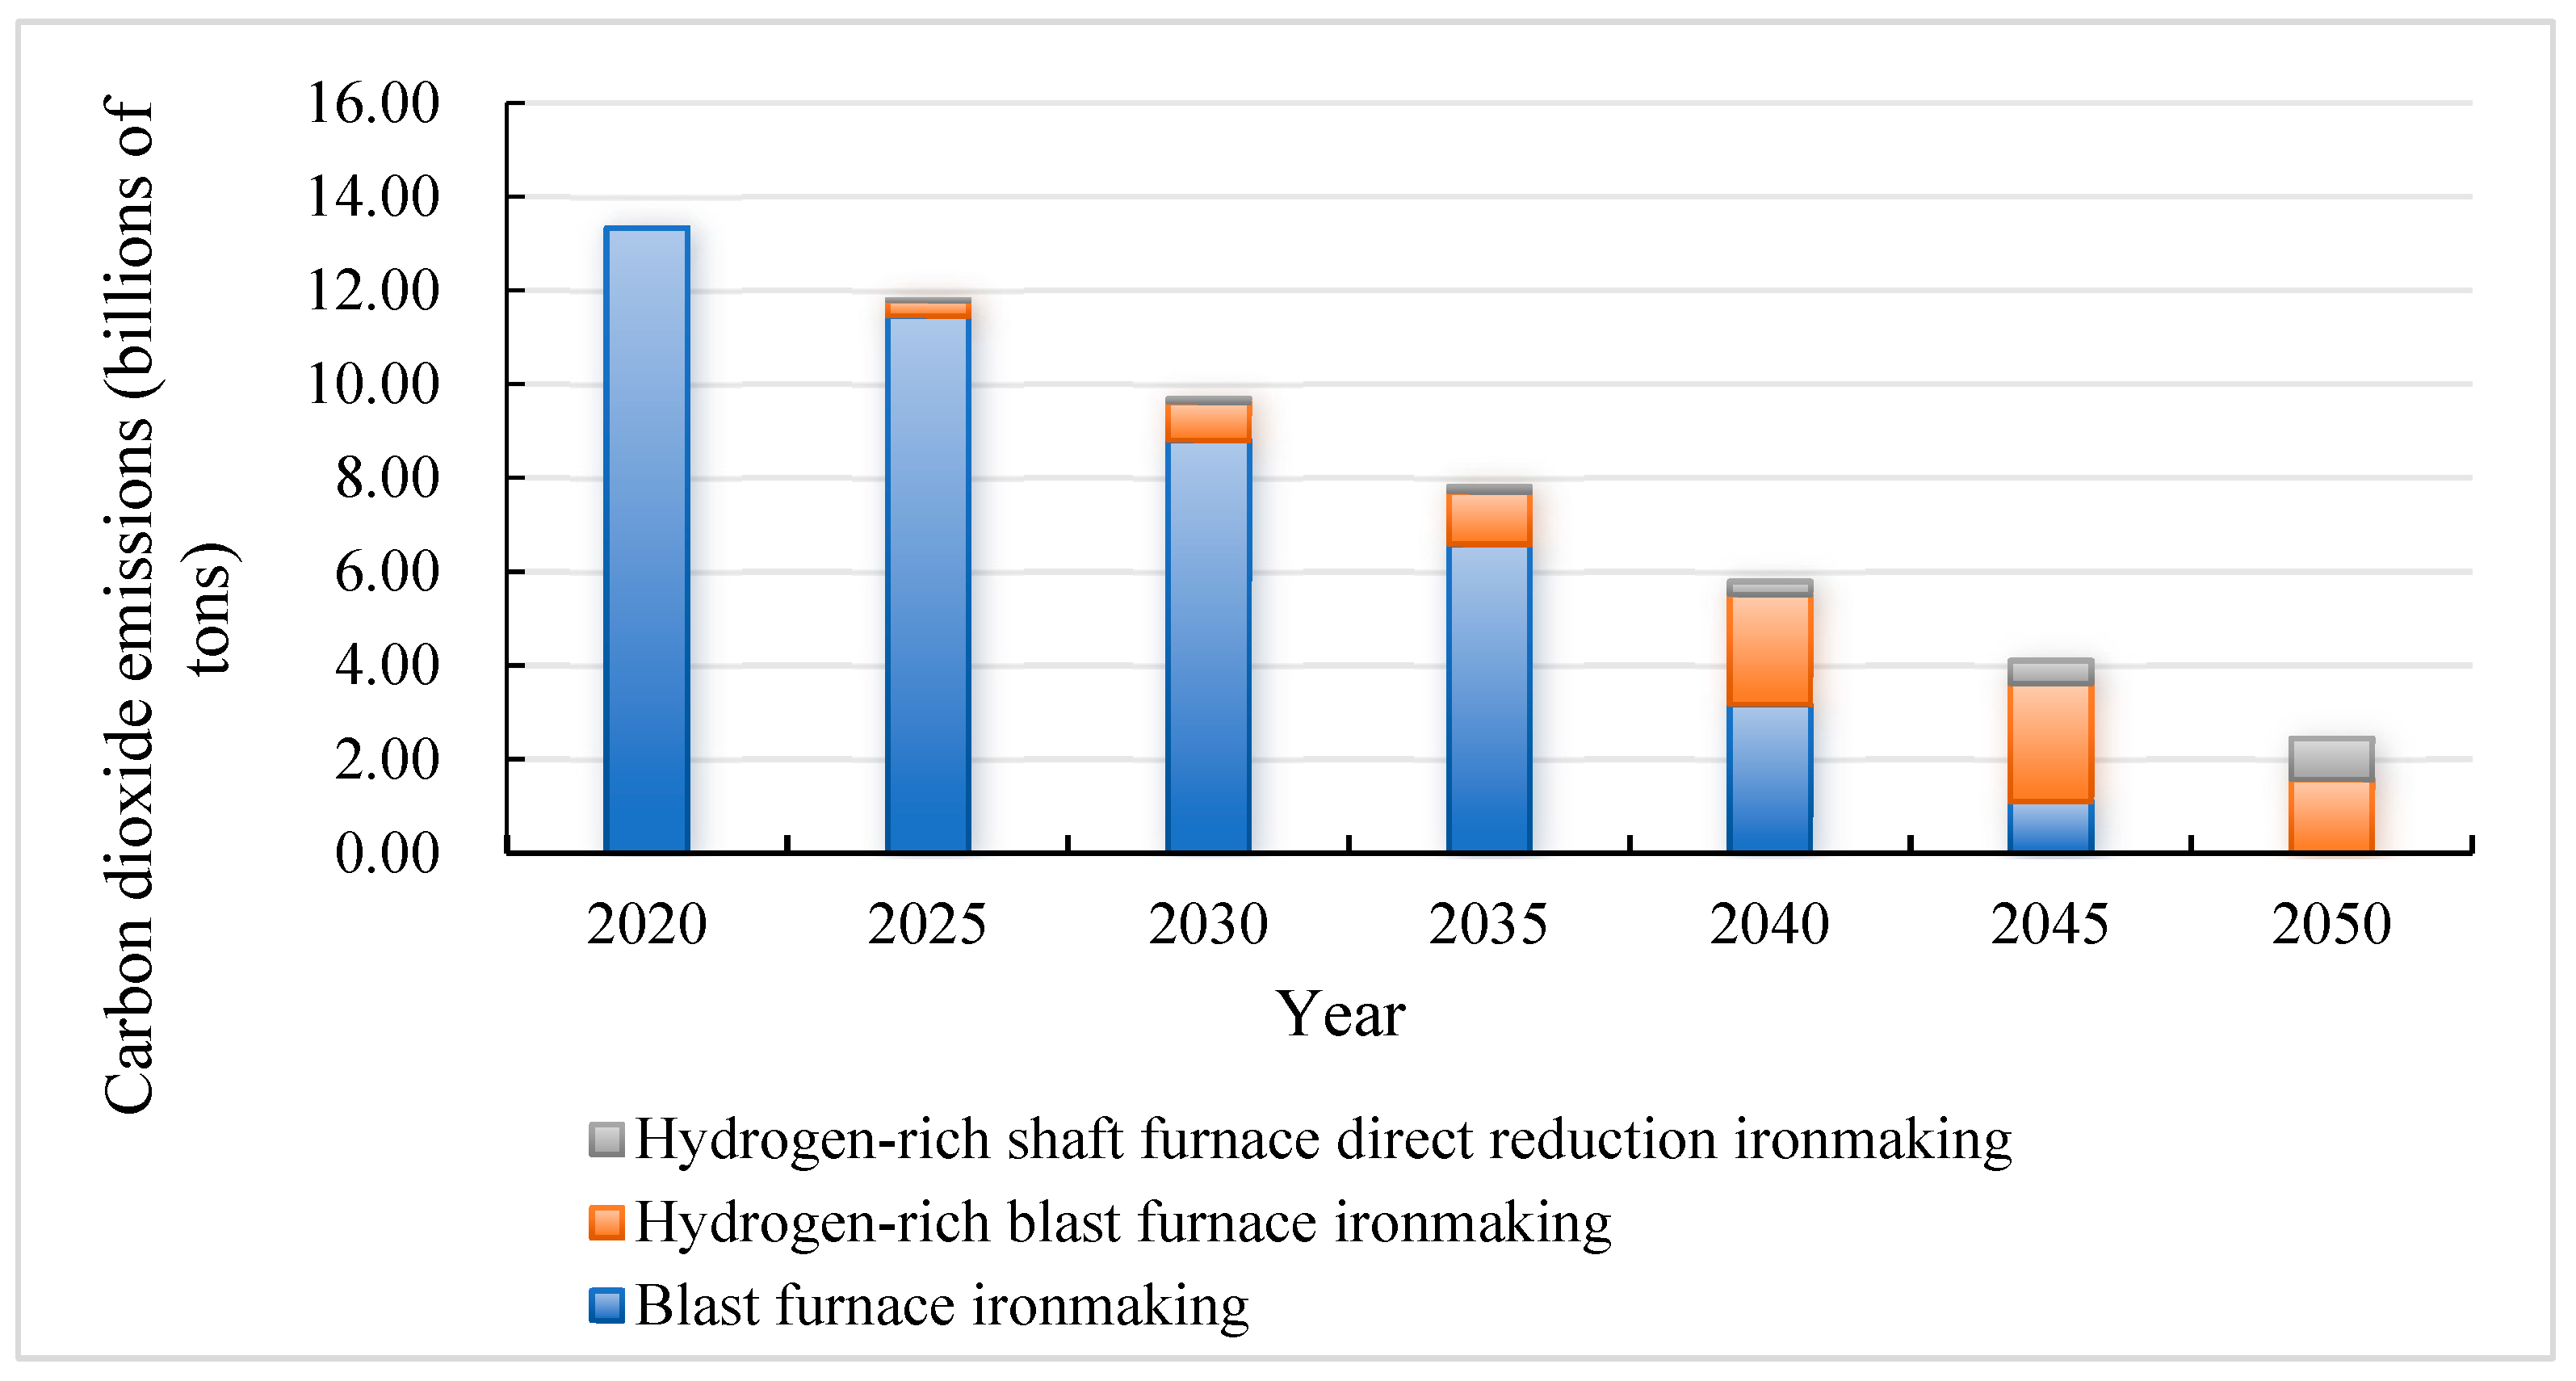
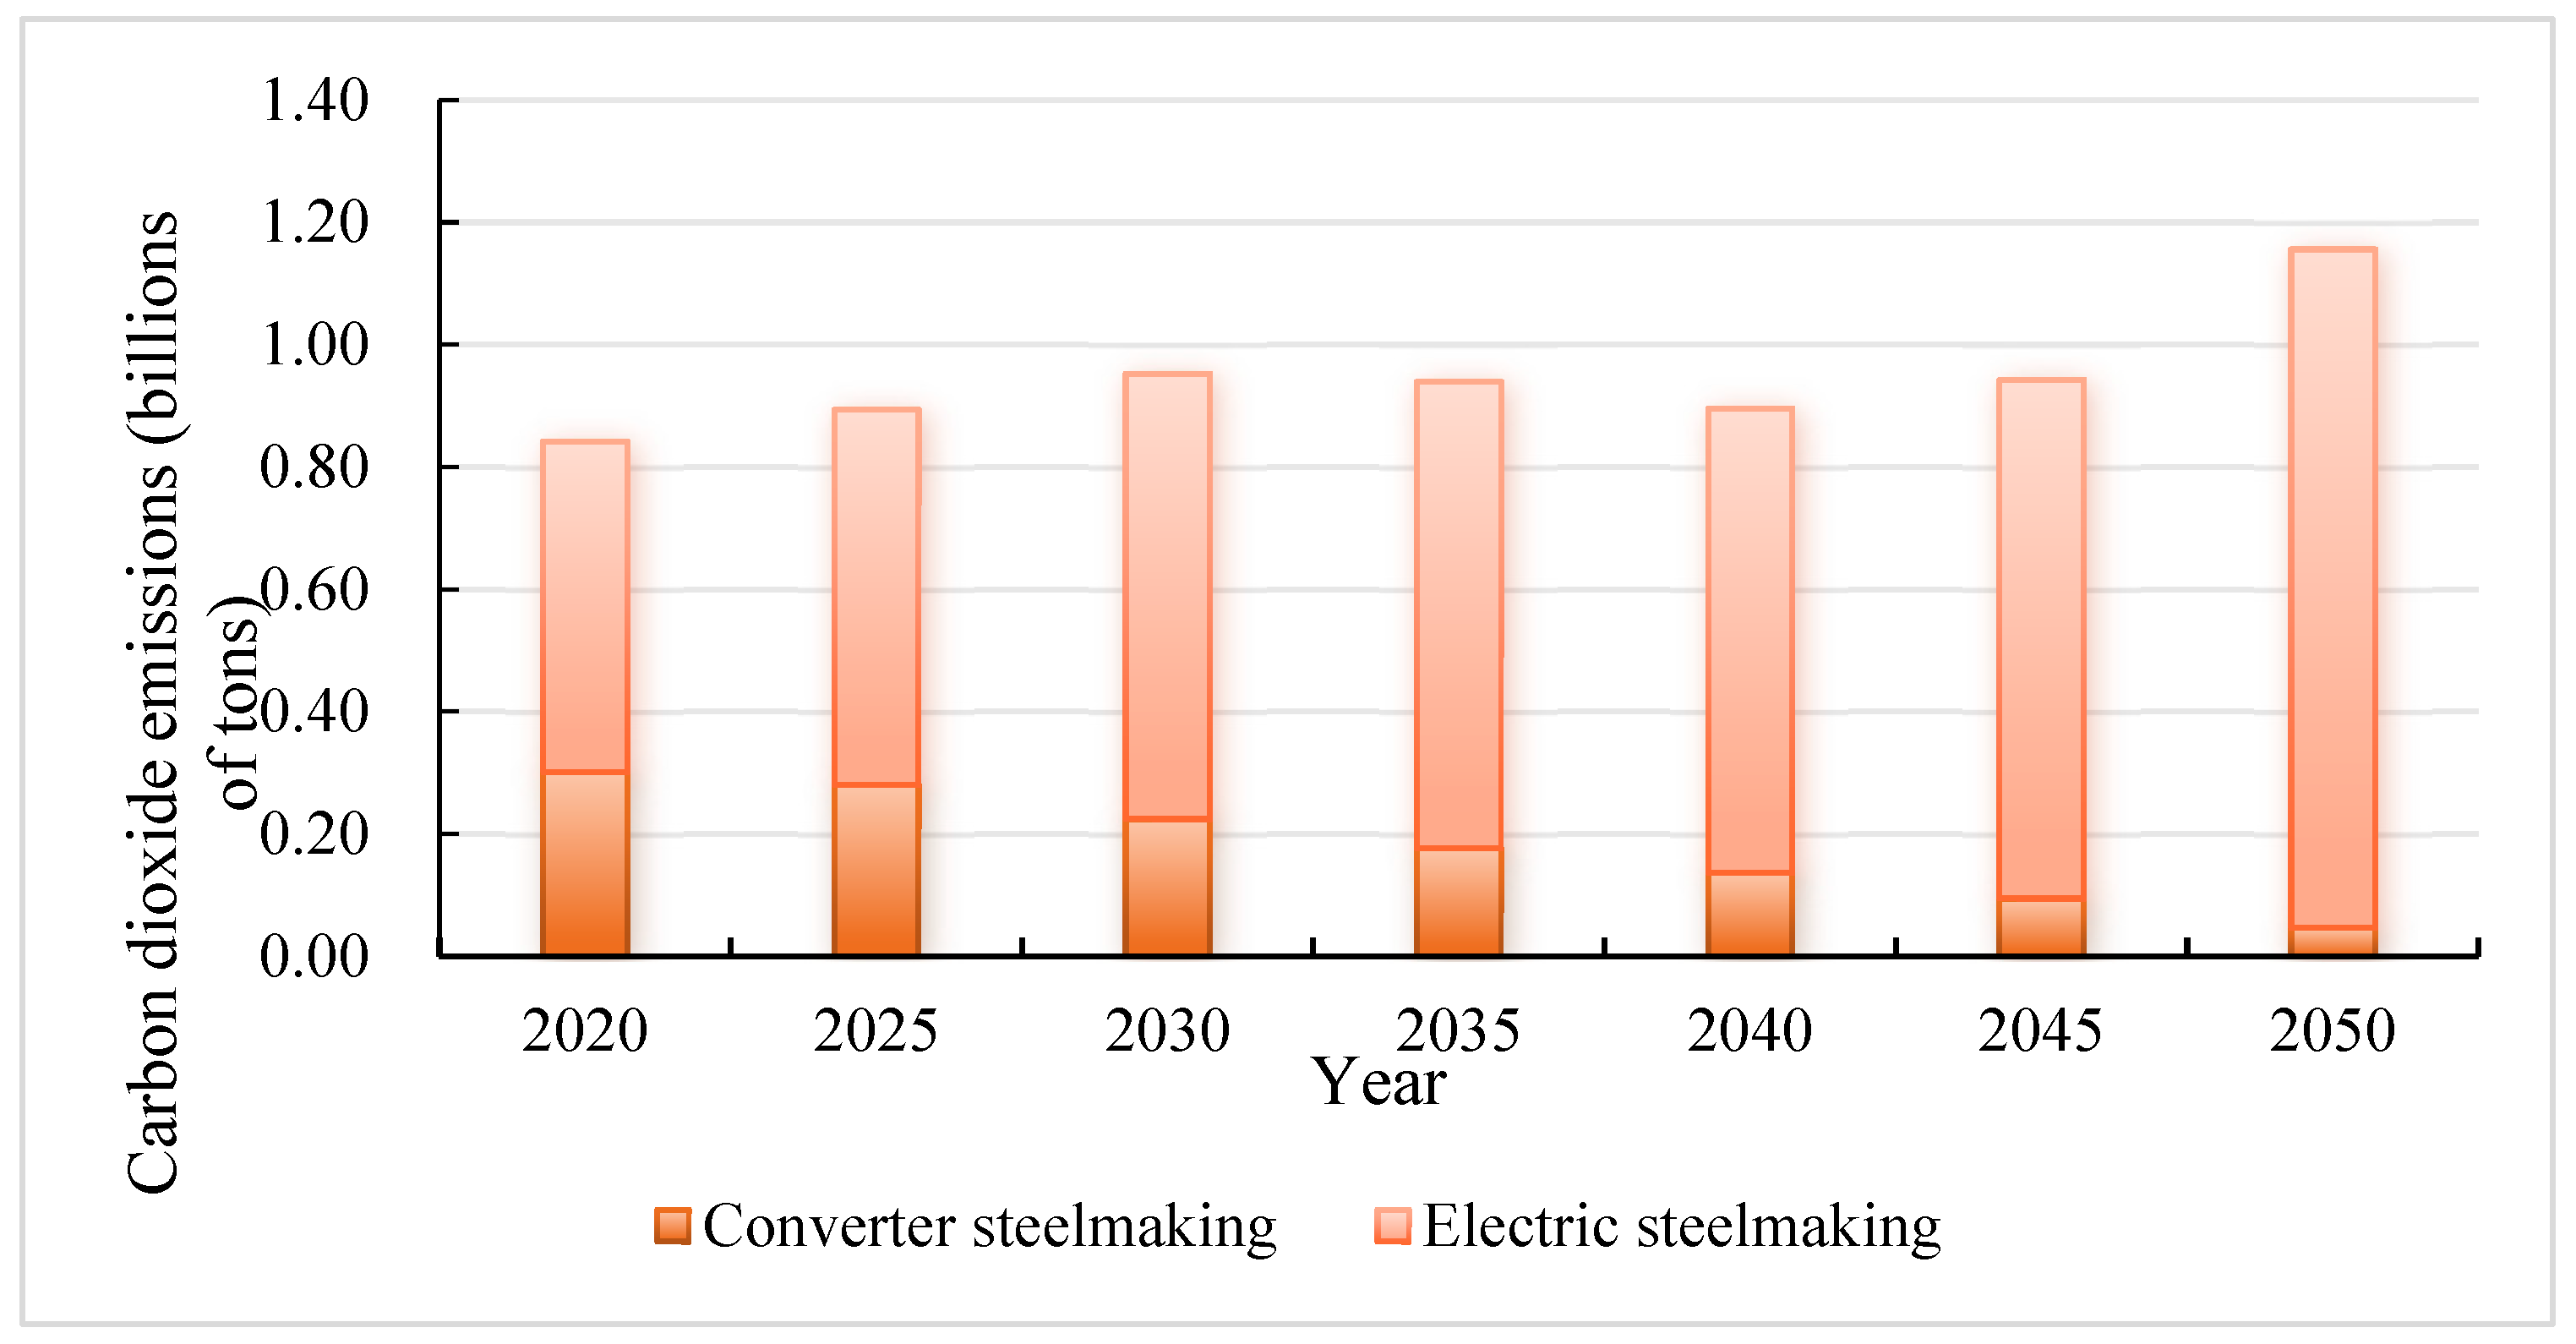
4.1.1. Analysis of Iron and Steel Production Technology Path

Figure 7 shows the steelmaking technology path in the BAU scenario. From 2020 to 2050, the modeled future steelmaking technology is dominated by the converter steelmaking process, supplemented by electric furnace steelmaking technology. The steel production of converter steelmaking decreases, and the production of electric furnace steelmaking steadily increases. The production of converter steelmaking drops from 947 to 399 million tons, a reduction of 57.86%. The production of electric furnace steelmaking increases from 117 to 222 million tons, an increase of 89.67%. When considering the modeled proportion of steel production in different steelmaking technologies, the proportion in converter steelmaking is seen to gradually decrease, and the proportion in electric furnace steelmaking to increase. The proportion in converter steelmaking decreases from 89% to 64.25%, and the proportion in electric furnace steelmaking increases from 11% to 35.75%.
The modeled ironmaking technology path in the BAU scenario is set out in Figure 8. From 2020 to 2050, the future ironmaking technology remains dominated by the ordinary blast furnace; the proportion from hydrogen-rich blast furnace ironmaking gradually increases, and the application of the hydrogen-rich shaft furnace–direct-reduction iron process is limited. Hydrogen metallurgy has great potential to reduce emissions, but it lacks technical maturity and its cost economy needs to be improved. Therefore, the ordinary blast furnace ironmaking remains dominant in the BAU scenario, and the hydrogen metallurgy technology is mainly based on the hydrogen-rich blast furnace ironmaking process. From 2020 to 2050, iron production is modeled to fall from 909 to 322 million tonnes, due to falling steel demand and increasing scrap resources. As the proportion in ordinary blast furnace decreases, the proportion in hydrogen-rich blast furnace ironmaking gradually increases, while the proportion in hydrogen-rich shaft furnace–direct reduction iron remains relatively small. The proportion in ordinary blast furnace iron production decreases to 73.88%, the proportion in hydrogen-rich blast furnace ironmaking increases to 20.48%, and the proportion in hydrogen-rich shaft-furnace–direct-reduction iron increases to 5.65%.
The modeled technical path of pre-iron production in the BAU scenario is set out in Figure 9. From 2020 to 2050, the coke, sinter, and pellets produced by coking, sintering, and pelletizing shows a downward trend in the BAU scenario. Coke production drops from 423 to 136 million tons, a 67.87% decrease; sintering production falls from 954 to 234 million tons, a decline of 75.49%; and pellet production drops from 318 to 216 million tons, down 32.09%. Of these, coke is the most important component in blast furnace ironmaking. However, as new ironmaking technologies, such as large-scale blast furnace and hydrogen metallurgy are developed and applied, the coke ratio may continue to decline, from 0.47 to 0.42 tons/ton, a decrease of 9.28%. In addition, due to the increase in the proportion of pellet and sinter in the blast furnace burden structure, the modeled consumption of sinter per ton of iron in China continues to decline, from 1.05 to 0.73 tons/ton, a decrease of 30.81%; iron pellet consumption continues to increase, from 0.35 to 0.67 tons/ton, an increase of 91.73%.

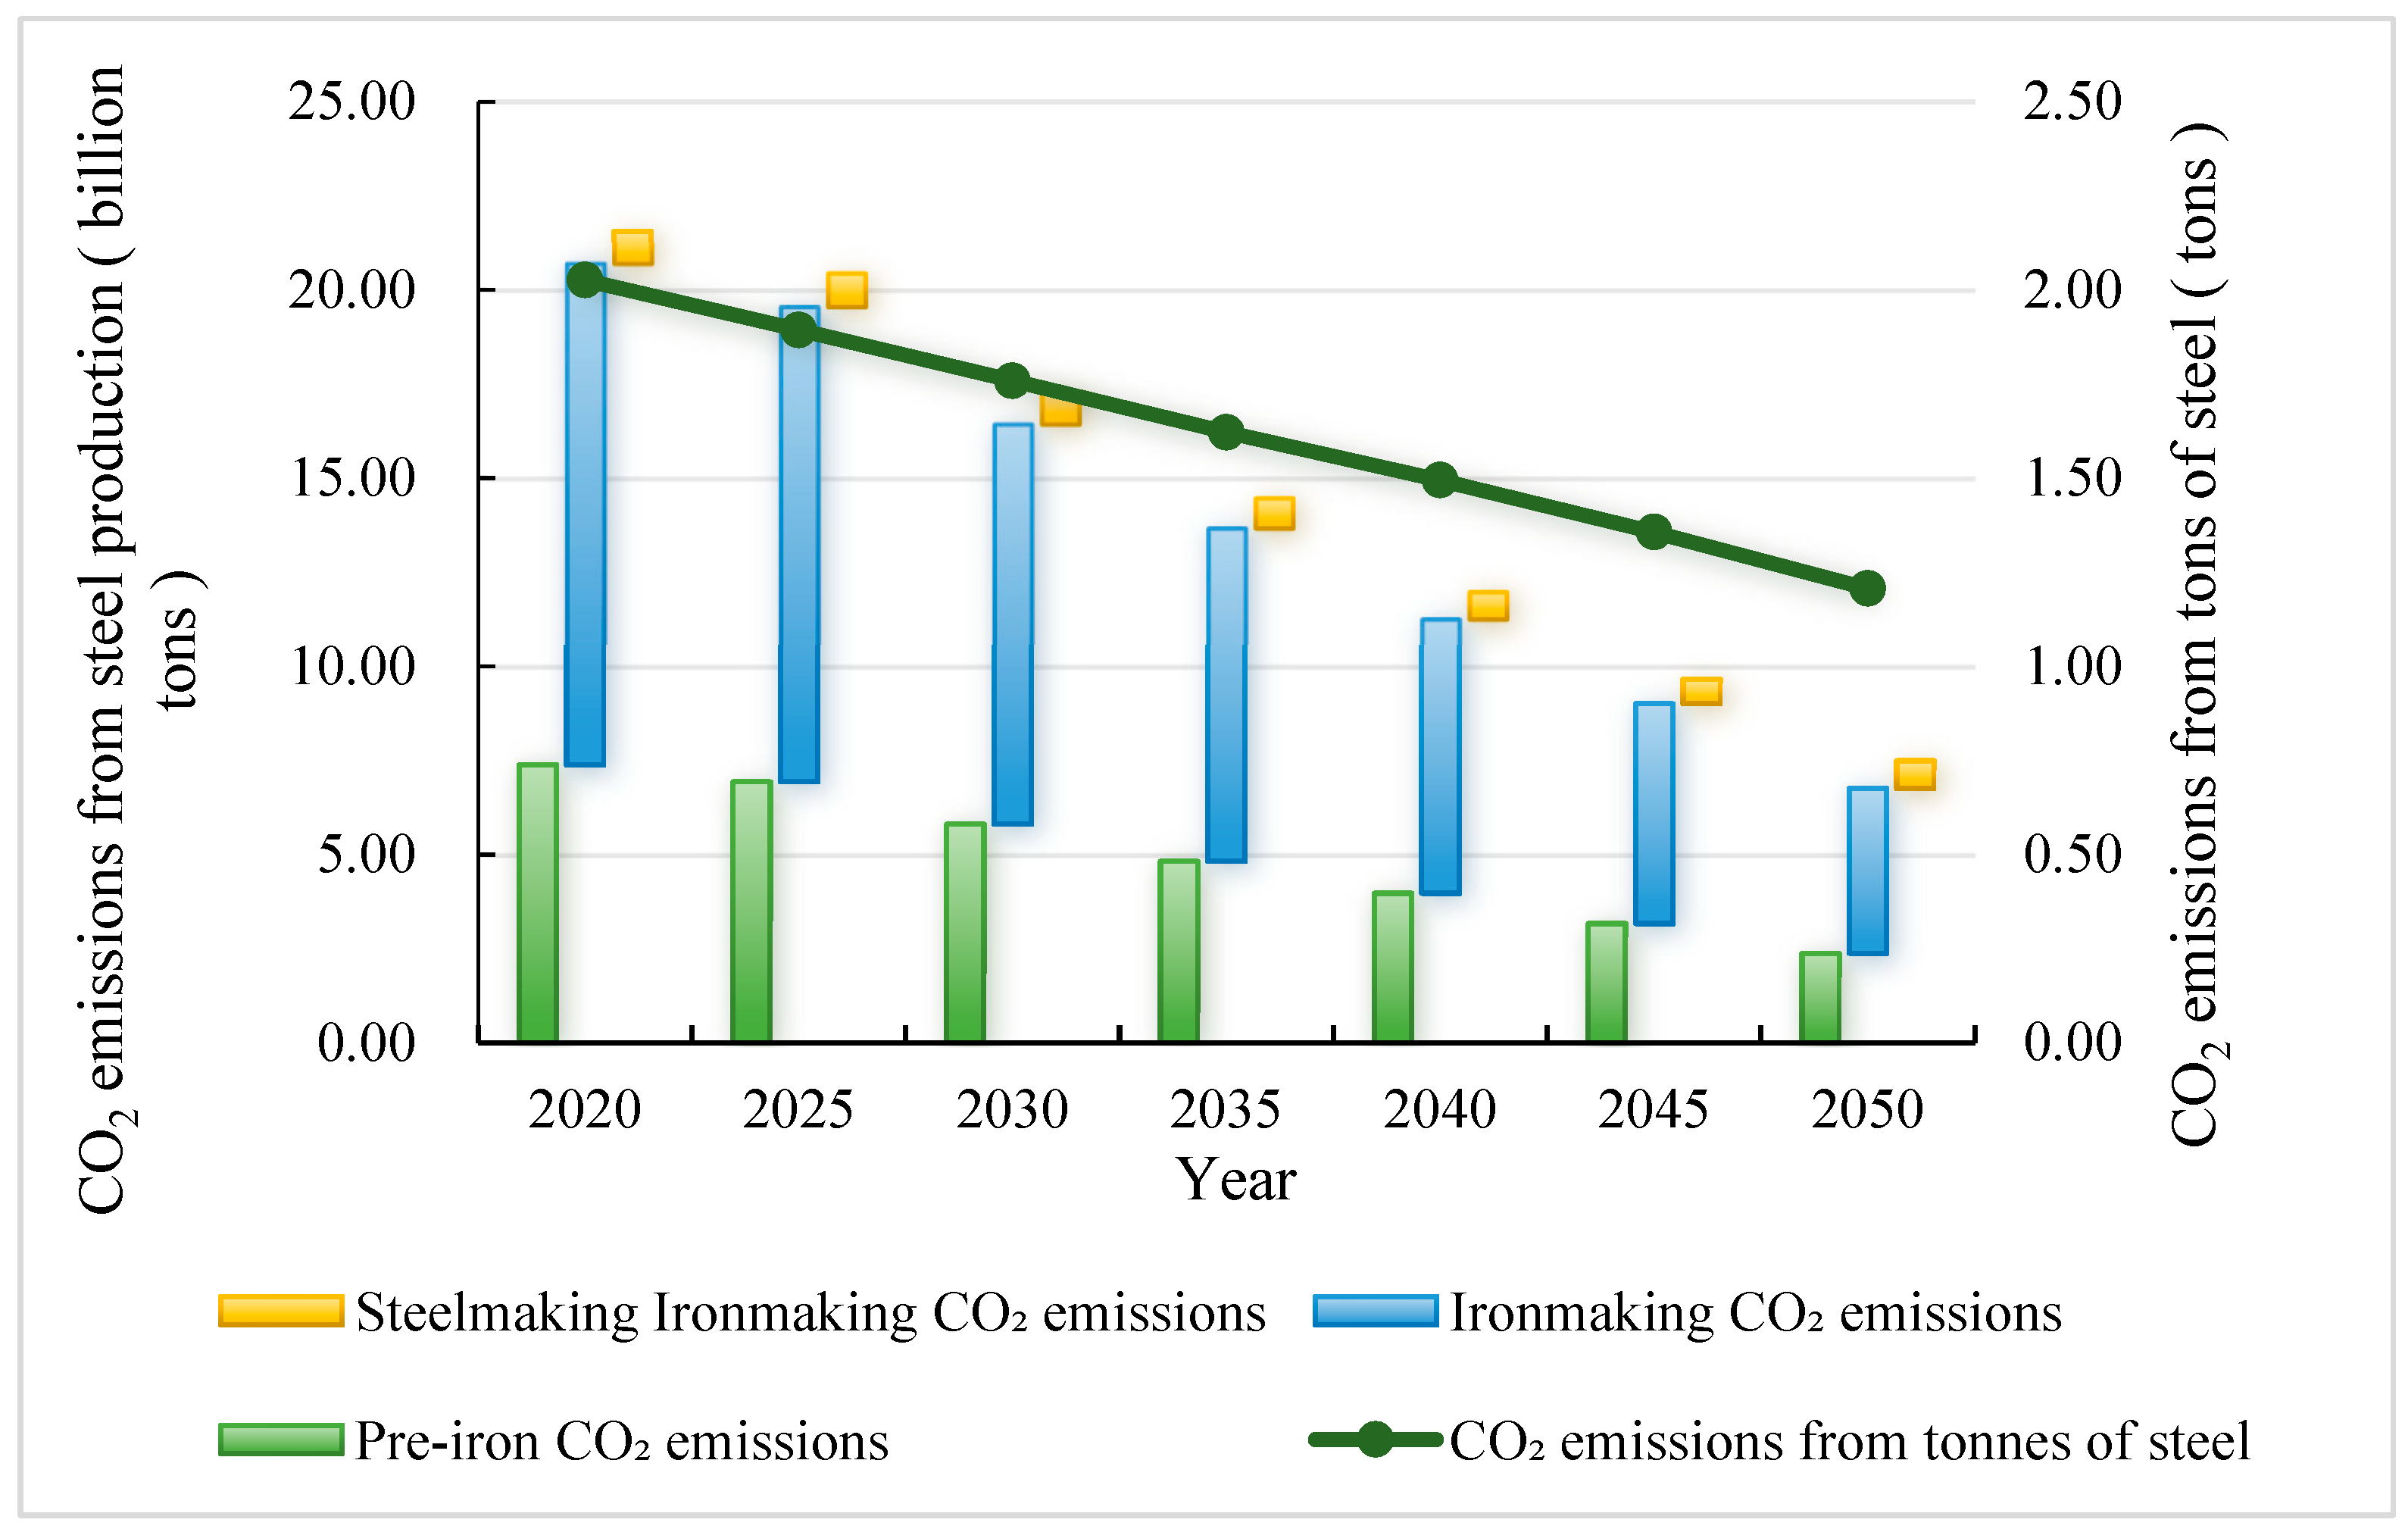
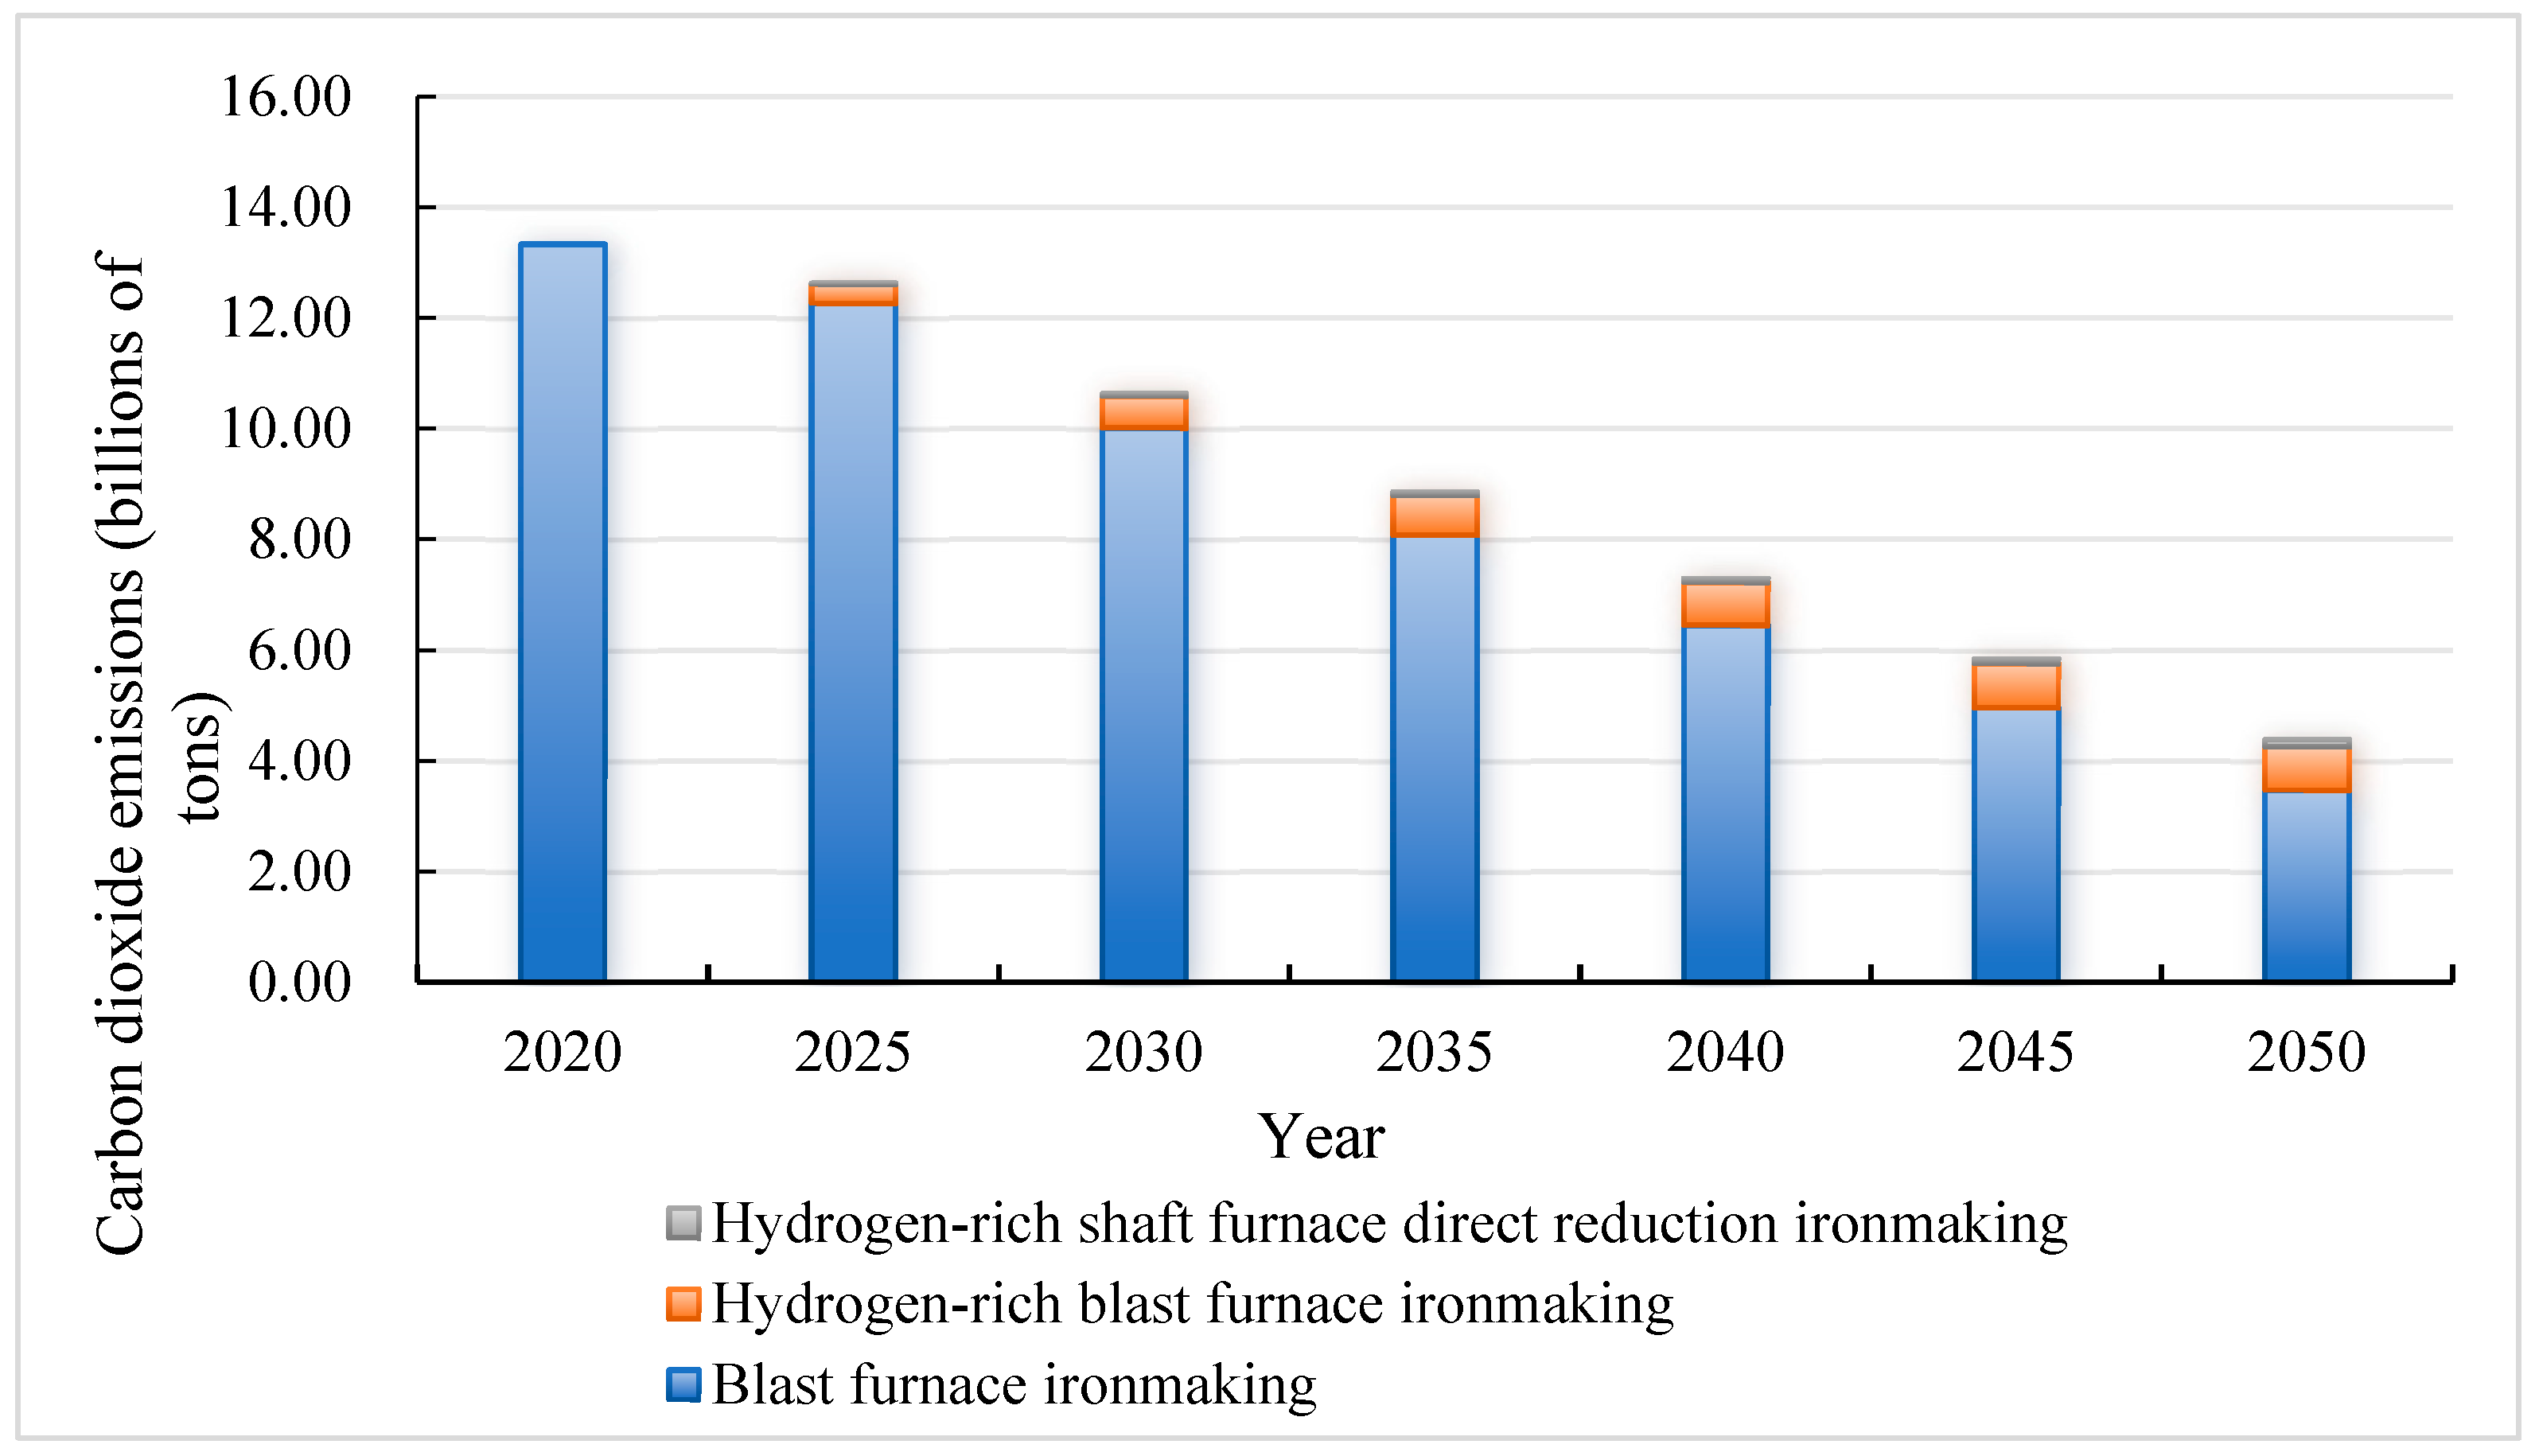
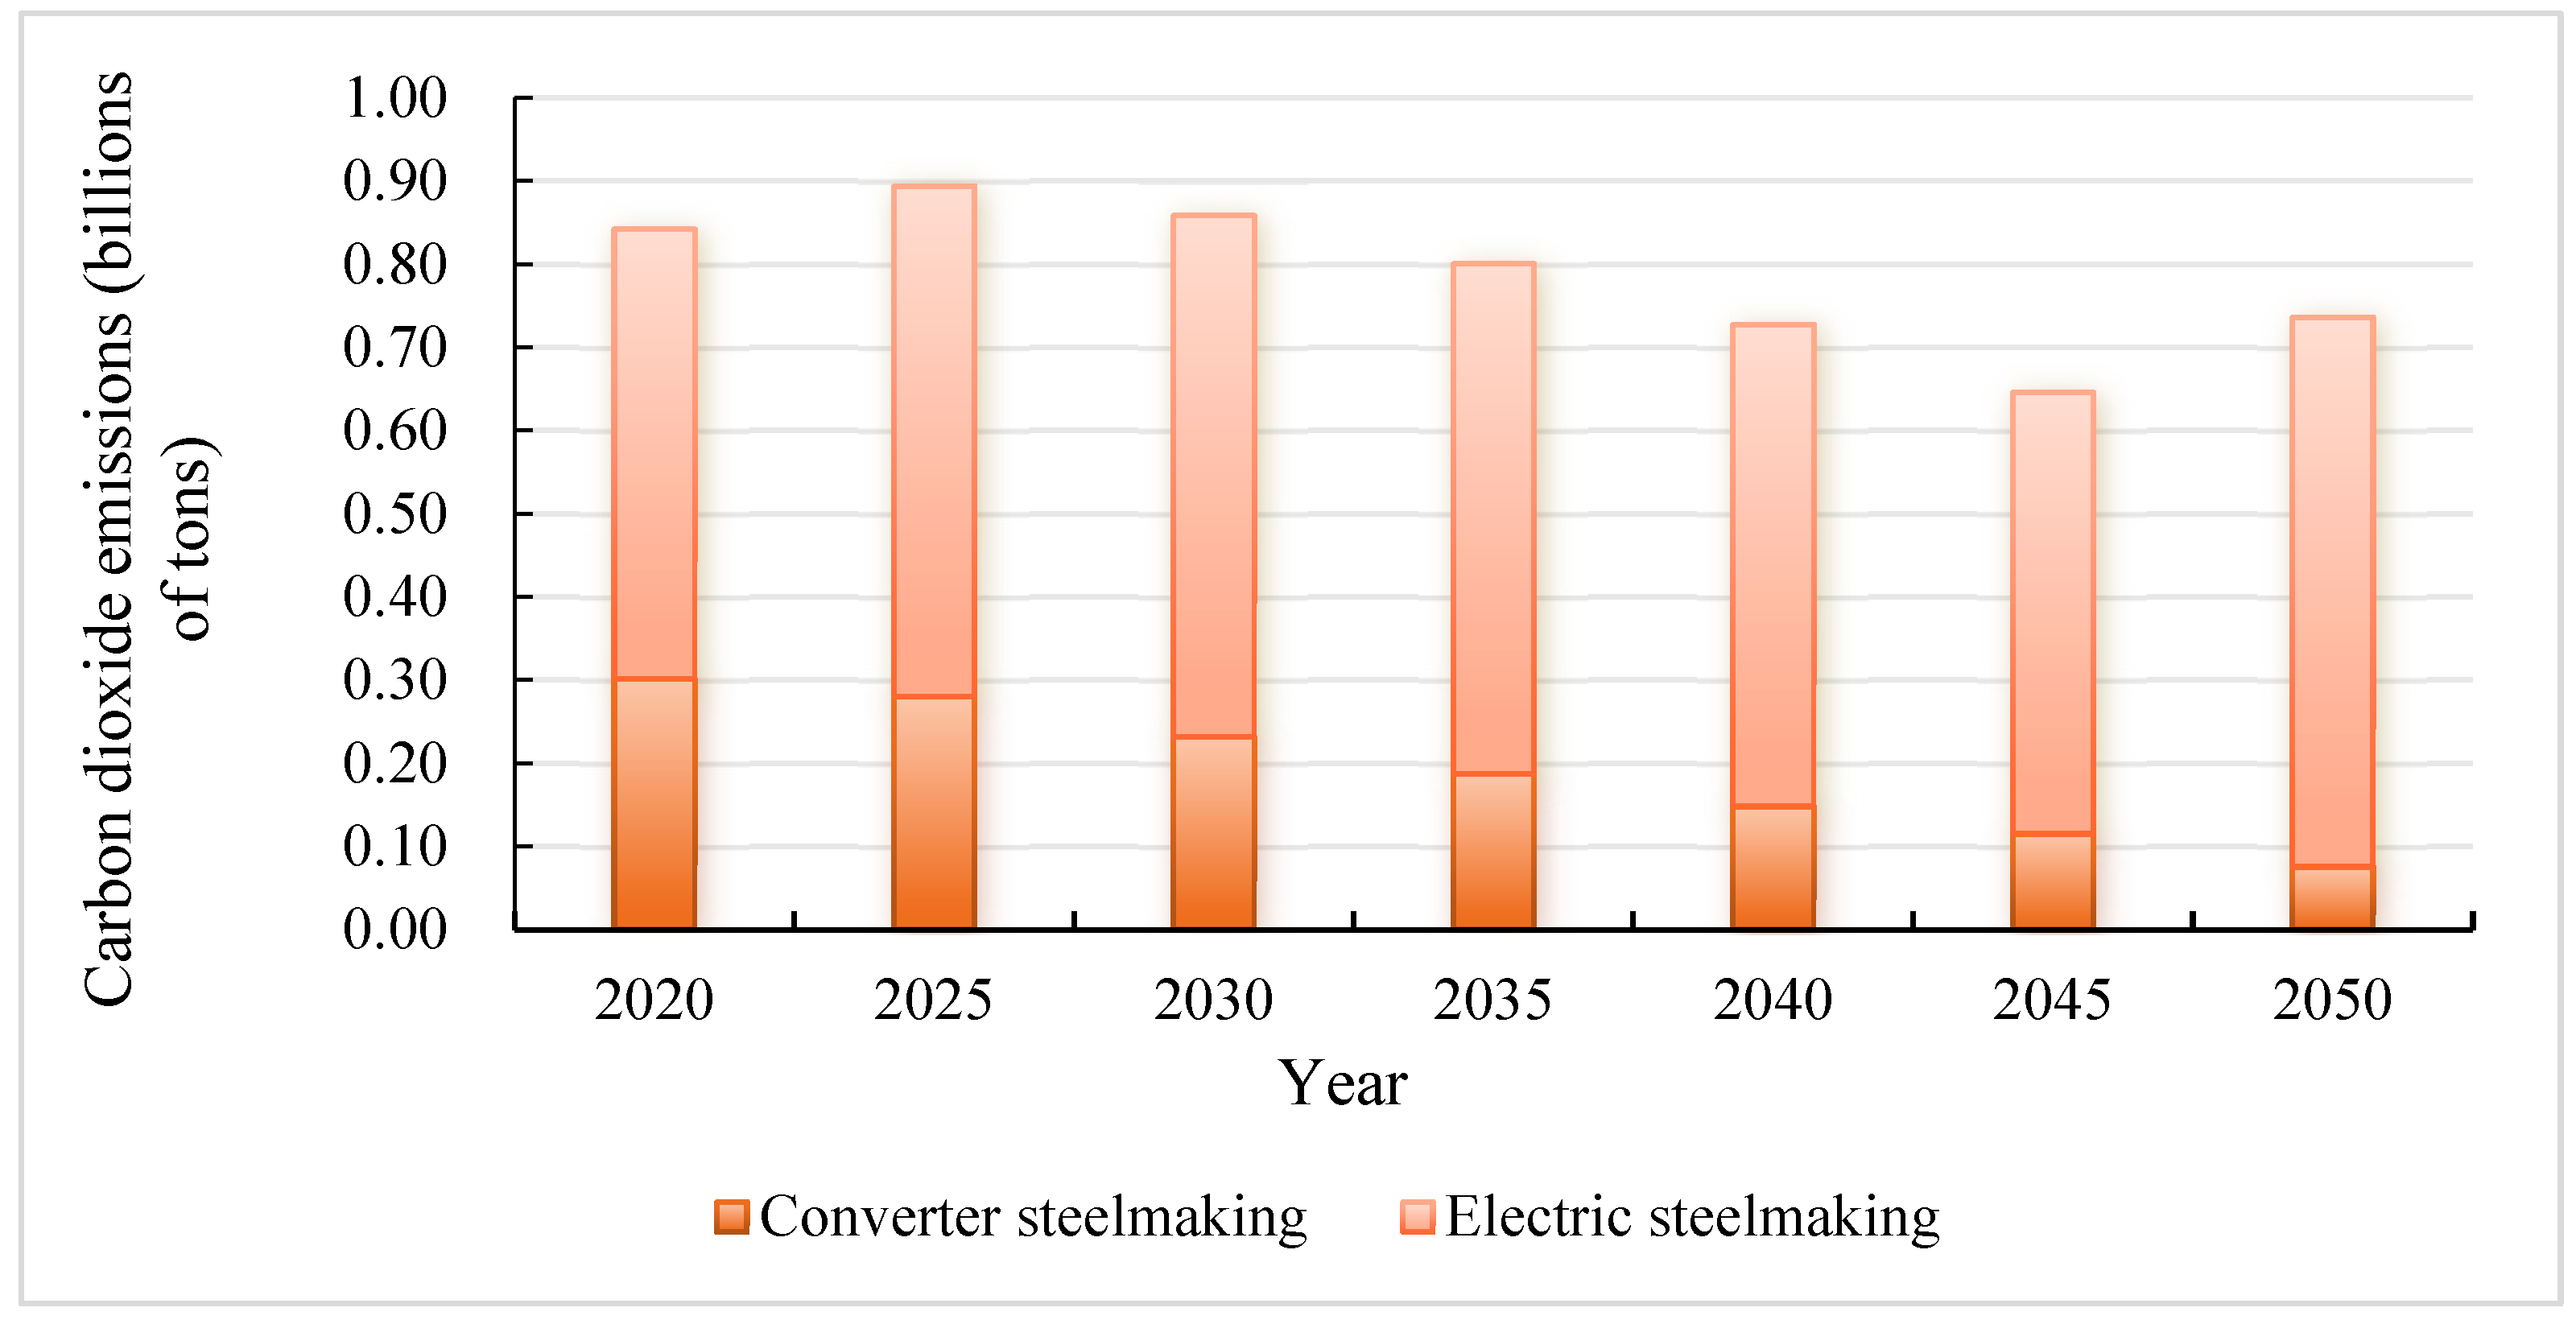
4.1.2. Contribution Analysis of CO2 Emission Reduction in Hydrogen Metallurgy

The modeled CO2 emissions for steel production in the BAU scenario are set out in Figure 10, which shows that the largest proportion of CO2 emissions is consistently produced by ironmaking in steel production. From 2020 to 2050, the modeled proportion of CO2 emissions in ironmaking decreases from 61.86% to 58.51%. Despite trending downward, it continues to account for more than half of the iron and steel production CO2 emissions. Pre-iron CO2 emissions are the second largest source of emissions in the steel production process, decreasing from 34.23% to 31.67%. The CO2 emissions are lowest, but the expected proportion increases slightly from 3.91% to 9.82%, due to the increase of electric furnace steel.
The modeled CO2 emissions of the pre-iron process in the BAU scenario are set out in Figure 11, which includes CO2 emissions from coking, sintering, and pelletizing. From 2020 to 2050, the total CO2 emissions in the pre-iron process trends downward, from 738 to 237 million tons, a 67.84% decrease. Of this decrease, the CO2 emissions in the sintering process decreased the most. The CO2 emissions in the coking process drop from 357 to 112 million tons, a decrease of 68.50%. The CO2 emissions in the sintering process drop from 296 to 96 million tons, a decrease of 76.74%. The CO2 emissions in the pellet process decline from 85 to 56 million tons, a decrease of 34.29%. From a proportion of CO2 emissions perspective, coking accounts for the largest proportion of CO2 emissions, but trends downward, falling from 48.39% to 47.40%, while the proportion of CO2 emissions from sintering decreases from 40.05% to 28.97%. The proportion of CO2 emissions from pellets increases from 11.57% to 23.64%, due to the increasing proportion of pellets in the blast furnace burden.
The modeled CO2 emissions in the ironmaking process in the BAU scenario are set out in Figure 12. In the BAU scenario, CO2 emissions from ordinary blast furnace ironmaking are the main source of CO2 emissions. From 2020 to 2050, the total CO2 emissions fall from 1.333 billion tons to 438 million tons, a 67.12% decrease. Of this decrease, the CO2 emissions of ordinary blast furnace ironmaking decrease from 1.333 billion tons to 347 million tons, a decrease of 73.98%. However, the proportion remains high, reaching 79.13% by 2050. Hydrogen-rich blast furnace ironmaking and hydrogen-rich shaft furnace–direct reduction iron technology are projected to be widely used, although their respective CO2 emissions are relatively low. By 2050, the CO2 emissions of the two reach 55 and 0.13 million tons, respectively. The proportion of CO2 emissions in the ironmaking process are 17.91% and 2.96%, respectively.
The CO2 emissions of the steelmaking process in the BAU scenario are set out in Figure 13. In the BAU scenario, CO2 emissions from steelmaking show a fluctuating downward trend from 2020 to 2050, falling from 0.84 billion tons in 2020 to 0.74 billion tons in 2050, a fluctuating decrease of 12.61%. Of this fall, the CO2 emissions of converter steelmaking decrease from 30 to 0.08 million tons, a decrease of 74.91%. Electric furnace steelmaking only directly produces small CO2 emission, but the indirect emission of electricity is the main reason for its high total CO2 emissions. From 2020 to 2050, the CO2 emissions from electric furnace steelmaking increase from 0.54 tons to 0.66 billion tons, a 22.12% increase, and the proportion of CO2 emissions from electric furnace steelmaking increase from 64.21% to 89.73%.
Figure 14 shows the modeled impact of steel production changes, scrap steel use, and hydrogen metallurgy technology application on CO2 emissions in the steel industry in the BAU scenario. From 2020 to 2050, the decline in steel demand leads to a decrease in CO2 emissions, which fall from 2.156 to 1.258 billion tons. The use of scrap steel and the application of hydrogen metallurgy technology may further reduce CO2 emissions, producing a total emission reduction of 509 million tons. Of these, scrap steel use reduces CO2 emissions to 952 million tons in 2050, while applying hydrogen metallurgy technology reduces steel industry CO2 emissions to 749 million tons in 2050. The modeled average contribution of scrap steel use to CO2 emission reduction in the steel industry is 60.15%, and the average contribution of hydrogen metallurgy technology application to CO2 emission reduction is 39.85%.

4.2. Carbon Emission Reduction Scenario Results Analysis

4.2.1. Analysis of the Iron and Steel Production Technology Path

Figure 15 shows the modeled steelmaking technology path in the carbon emission reduction scenario. From 2020 to 2050, the steel production of converter steelmaking decreases significantly, and the steel production of electric furnace steelmaking trends upward. The steel production of converter steelmaking is reduced from 947 to 248 million tons, a 74% decrease, while the production of electric furnace steelmaking increases from 117 to 373 million tons, a 2.2 times increase. From a proportion of steel production in different steelmaking technologies perspective, the advantages of electric furnace steelmaking are seen to be gradually reflected in the model. The proportion in converter steelmaking decreases significantly, while the proportion in electric furnace steelmaking increases steadily. The proportion in converter steelmaking decreases, from 89% to 40%, and the proportion in electric furnace steelmaking increases, from 11% to 60%.
Figure 16 shows the modeled ironmaking technology path in the carbon emission reduction scenario. From 2020 to 2050, hydrogen metallurgy technology is expected to achieve large-scale development and application, and fully replace ordinary blast furnace–long-process ironmaking. The iron output of ordinary blast furnace greatly decreases, while the iron output of hydrogen-rich blast furnace ironmaking and hydrogen-rich shaft furnace–direct reduction ironmaking significantly increases, as they substitute for ordinary blast furnace ironmaking. The iron production of the ordinary blast furnace may drop from 909 million tons to 0, and the ironmaking technology of the ordinary blast furnace may be gradually eliminated. At the same time, the proportion of hydrogen-rich blast furnace iron production and hydrogen-rich shaft furnace–direct-reduction production continues to increase. Hydrogen metallurgy technology is expected to become the default choice for the steel industry as it seeks to achieve ‘carbon neutrality’. By 2050, the proportion of hydrogen-rich blast furnace iron production increases to 52%, and the proportion of hydrogen-rich shaft-furnace–direct-reduction iron production increases to 48%.
Figure 17 shows the modeled technical path of pre-iron production in the carbon emission reduction scenario. From 2020 to 2050, coke, sinter, and pellet produced trend downward. Coke production falls from 423 to 54 million tons, down 87.18%. Sinter production drops from 954 to 102 million tons, down 89.34%. Pellet production drops from 318 to 249 million tons, down 21.76%. Of these, the consumption of per ton iron sinter decreases significantly, from 1.05 to 0.4 tons/ton, a 61.88% decrease. The consumption of tons of iron pellets increases significantly, from 0.35 to 0.98 tons/ton, a 179.77% increase.

4.2.2. Contribution Analysis of CO2 Emission Reduction in Hydrogen Metallurgy

Figure 18 shows the modeled CO2 emissions of steel production in the carbon emission reduction scenario. Similar to the BAU scenario, the proportion of CO2 emissions from ironmaking is the largest, but trends downward. From 2020 to 2050, the proportion of CO2 emissions from ironmaking decreases from 61.86% to 48.96%, while the proportion in the pre-iron process decreases from 34.23% to 27.90%. CO2 emissions from steelmaking are affected by the rapid development of electric furnace steelmaking, and increase significantly, from 3.91% to 23.14%.
Figure 19 shows the modeled CO2 emissions in the pre-iron process in the carbon emission reduction scenario. From 2020 to 2050, the total CO2 emissions from the pre-iron process decrease from 738 to 139 million tons, a decrease of 81.11%. Of this decrease, the CO2 emissions of coking, sintering and pelleting all decrease significantly, with coking and sintering showing the greatest decreases. The CO2 emissions in the coking process drop from 357 to 45 million tons, a decrease of 87.43%, and the CO2 emissions in the sintering process drop from 296 to 30 million tons, a decrease of 89.88%. The CO2 emissions in the pellet process drop from 85 to 65 million tons, a decrease of 24.30%. From a proportion of CO2 emissions perspective, the proportion of CO2 emissions generated by coking further decrease, from 48.39% to 32.20%, while CO2 emissions from sintering decrease, from 40.05% to 21.45%. The CO2 emissions generated by pellets are affected by the increasing proportion of pellets in the blast furnace burden structure, and are expected to increase in proportion, from 11.57% to 46.35%.
Figure 20 shows the modeled CO2 emissions of the ironmaking process in the carbon emission reduction scenario. From 2020 to 2050, hydrogen-rich blast furnace ironmaking and hydrogen-rich shaft furnace–direct reduction iron technology experience significant development, and fully replace ordinary blast furnace ironmaking. The CO2 emissions in the ironmaking process decrease from 1.333 billion tons to 245 million tons. Of these, the CO2 emissions of ordinary blast furnace ironmaking drop, falling from 1.333 billion tons to 0. By 2050, CO2 emissions from hydrogen-rich blast furnaces reach 157 million tons, accounting for 64.34% of the ironmaking process. And hydrogen-rich shaft furnace–direct reduction iron technology CO2 emissions reach 87 million tons, accounting for 35.66%.
Figure 21 shows the modeled CO2 emissions in the steelmaking process in the carbon emission reduction scenario. From 2020 to 2050, CO2 emissions of the steelmaking process fluctuate, and rise from 84 to 116 million tons, an increase of 37.20%. Of these, the CO2 emissions from converter steelmaking significantly decrease, from 30 million tons to 0.05 billion tons, a decrease of 84.38%. The CO2 emissions from electric furnace steelmaking increase, from 54 to 111 million tons, an increase of 104.97%. From a proportion of CO2 emissions perspective, the proportion of CO2 emissions from electric furnace steelmaking are seen to further increase, from 64.21% to 95.93%.
Figure 22 shows the modeled impact of steel production change, scrap steel use, and hydrogen metallurgy technology application on the steel industry’s CO2 emissions in the carbon emission reduction scenario. From 2020 to 2050, the decline in steel demand leads to a decrease in CO2 emissions, from 2.156 to 1.258 billion tons. Scrap steel use and applying hydrogen metallurgy technology further reduce emissions by a total of 759 million tons. The use of scrap steel reduces CO2 emissions to 853 million tons by 2050, and applying hydrogen metallurgy technology further reduces CO2 emissions to 500 million tons by 2050. Of these, the average contribution of scrap steel use to the steel industry’s CO2 emission reduction is 58.68%, and the average contribution of hydrogen metallurgy technology application to CO2 emission reduction is 41.32%.

5. Conclusions

This study applies a ‘bottom-up’ research perspective to construct a CO2 emission reduction measurement model based on hydrogen metallurgy technology, and further calculates the CO2 emission reduction effect of hydrogen metallurgy technology on the steel industry in different scenarios. The main conclusions of this paper are as follows:
(1)
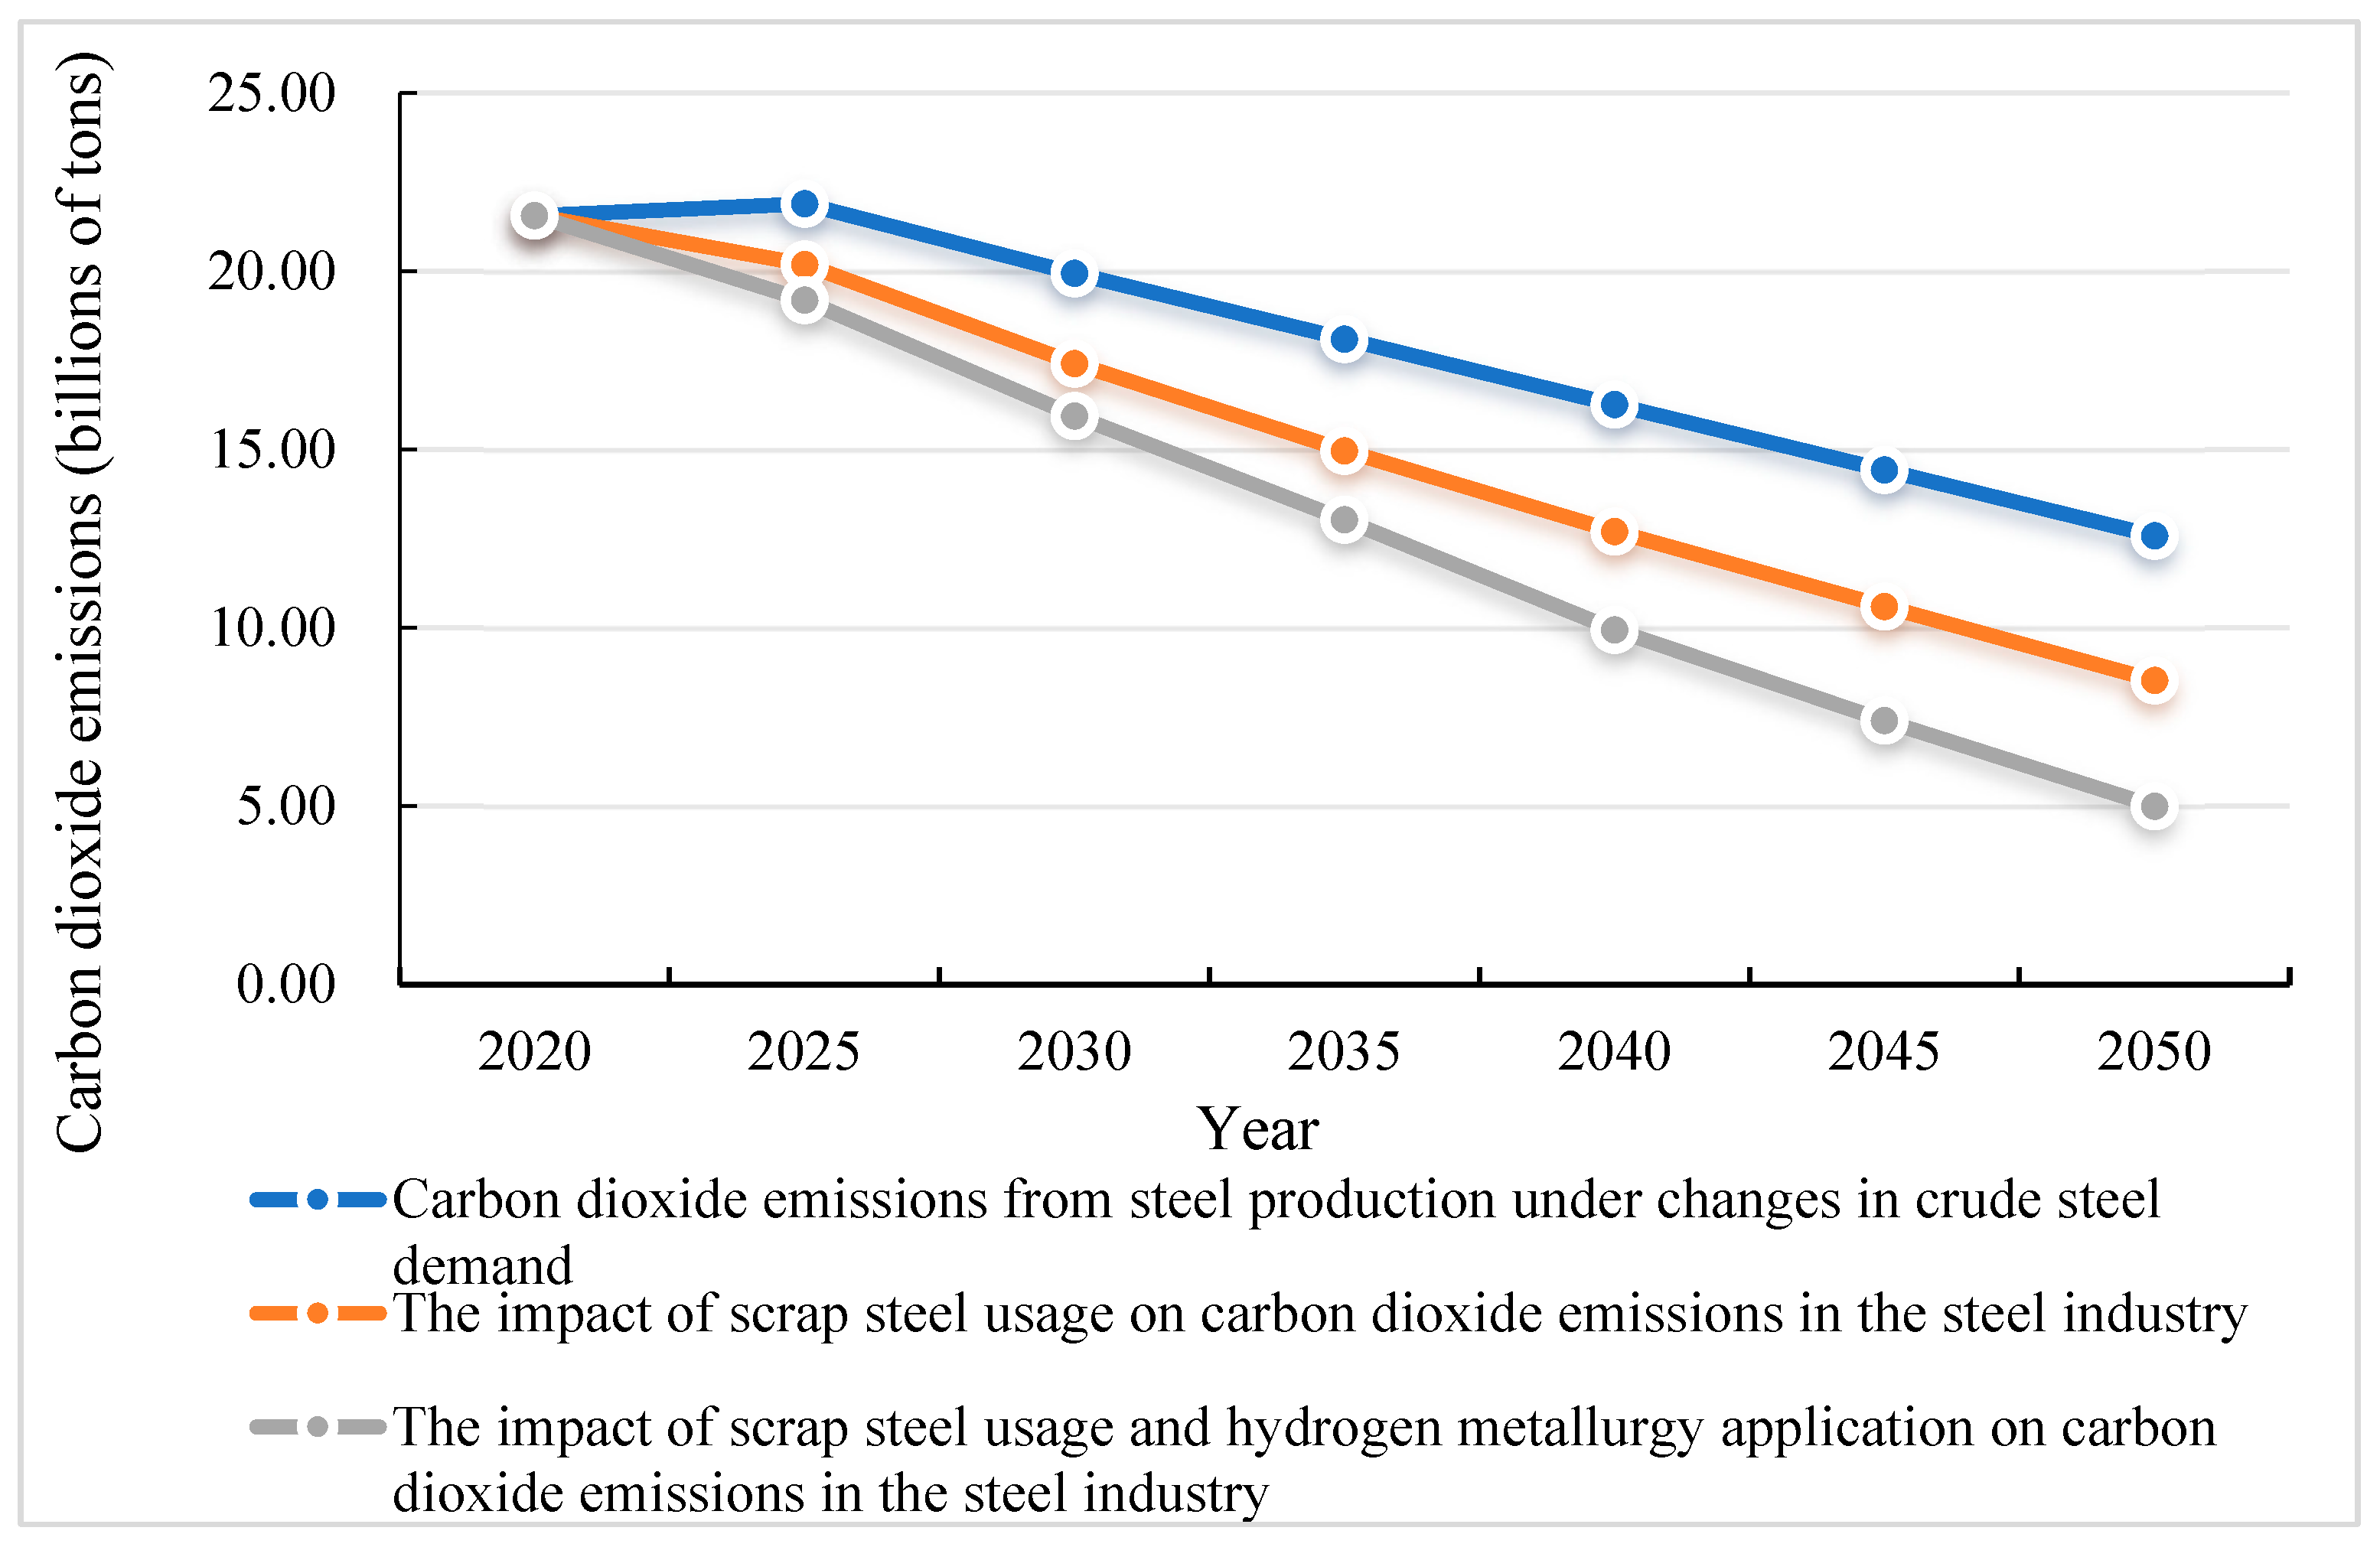
Reducing steel demand and using scrap steel cannot meet the steel industry’s carbon dioxide emission reduction requirements. The application of hydrogen metallurgy technology is however crucial in the future emission reduction process of the steel industry. In the BAU scenario, the CO2 emissions of the steel industry are reduced, from 2.156 billion tons to 749 million tons, in the period 2020 to 2050. The reduction of steel demand is expected to reduce the CO2 emissions of the steel industry to 1.26 billion tons. The use of scrap steel is expected to reduce emissions by 306 million tons, and the remaining 203 million tons of emission reductions will be achieved by applying hydrogen metallurgy technology. In the carbon emission reduction scenario, steel industry CO2 emissions are expected to be reduced from 2.156 billion tons to 500 million tons in the period 2020 to 2050. The reduction of steel demand is expected to reduce steel industry CO2 emissions to 1.258 billion tons, and the use of scrap steel is expected to, on this basis, reduce emissions by 405 million tons. The remaining 353 million tons of emission reductions will be achieved by applying hydrogen metallurgy technology.
(2)
The future application of hydrogen metallurgy technology will rapidly increase demand for hydrogen. In the BAU scenario, the steel industry’s total hydrogen consumption increases to 3.0507 million tons in 2050, and the hydrogen consumption per ton of steel to 491.25 kg/ton. In the carbon emission reduction scenario, the steel industry’s total hydrogen consumption is expected to reach 11.9371 million tons in 2050, and the hydrogen consumption per ton of steel is expected to be 1922.24 kg/ton. However, China’s hydrogen energy industry chain system is not yet complete, as the efficiency of clean energy hydrogen production is low and the cost is high, which highlights the need to increase support for the development of hydrogen energy.

Author Contributions

Conceptualization, X.Y. and J.L.; methodology, Y.H. and F.W.; software, Y.H. and F.W.; validation, X.Y. and J.L.; formal analysis, Y.H. and F.W.; investigation, F.W.; data curation, F.W.; writing—original draft preparation, Y.H. and F.W.; writing—review and editing, Y.H. and F.W.; supervision, X.Y. All authors have read and agreed to the published version of the manuscript.

Funding

This research received no external funding.

Institutional Review Board Statement

Not applicable.

Informed Consent Statement

Informed consent was obtained from all research subjects.

Data Availability Statement

The authors strongly encourage interested researchers to contact us, as we are more than willing to share the data upon request.

Conflicts of Interest

The authors declare no conflicts of interest.

References

  1. Wang, X.Y.; Yu, B.Y.; An, R.Y.; Sun, F.H.; Xu, S. An integrated analysis of China’s iron and steel industry towards carbon neutrality. Appl. Energy 2022, 322, 119453. [Google Scholar] [CrossRef]
  2. Hasanbeigi, A.; Jiang, Z.; Price, L. Retrospective and prospective analysis of the trends of energy use in Chinese iron and steel industry. J. Clean. Prod. 2014, 74, 105–118. [Google Scholar] [CrossRef]
  3. Shao, S.; Yang, L.L.; Gan, C.H.; Cao, J.H.; Geng, Y.; Guan, D.B. Using an extended LMDI model to explore techno-economic drivers of energy-related industrial CO2 emission changes: A case study for Shanghai (China). Renew. Sustain. Energy Rev. 2016, 55, 516–536. [Google Scholar] [CrossRef]
  4. Shao, S.; Liu, J.H.; Geng, Y.; Miao, Z.; Yang, Y.C. Uncovering driving factors of carbon emissions from China’s mining sector. Appl. Energy 2016, 166, 220–238. [Google Scholar] [CrossRef]
  5. Li, Z.G.; Zhu, Y.M.; Wu, X. GDIM-Based Research on Driving Factors of Carbon Emissions from Manufacturing Industry in Shandong Province. East China Econ. Manag. 2019, 33, 30–36. [Google Scholar]
  6. Tong, Y.L.; Wang, K.; Liu, J.Y.; Zhang, Y.; Gao, J.J.; Dan, M.; Yue, T.; Zuo, P.L.; Zhao, Z.Y. Refined assessment and decomposition analysis of carbon emissions in high-energy intensive industrial sectors in China. Sci. Total Environ. 2023, 872, 162161. [Google Scholar] [CrossRef] [PubMed]
  7. Zhou, P.; Ang, B.W. Decomposition of aggregate CO2 emissions: A production-theoretical approach. Energy Econ. 2008, 30, 1054–1067. [Google Scholar] [CrossRef]
  8. Wang, Z.H.; Yang, L. Delinking indicators on regional industry development and carbon emissions: Beijing–Tianjin–Hebei economic band case. Ecol. Indic. 2015, 48, 41–48. [Google Scholar] [CrossRef]
  9. Wang, J.F.; He, S.T.; Qiu, Y.; Liu, N.; Li, Y.J.; Dong, Z.F. Investigating driving forces of aggregate carbon intensity of electricity generation in China. Energy Policy 2018, 113, 249–257. [Google Scholar] [CrossRef]
  10. Feng, K.S.; Davis, S.J.; Sun, L.X.; Hubacek, K. Drivers of the US CO2 emissions 1997–2013. Nat. Commun. 2015, 6, 7714. [Google Scholar] [CrossRef]
  11. Wei, J.; Huang, K.; Shun, Y.S.; Li, Y.; Hu, T.; Zhang, Y. Driving forces analysis of energy-related carbon dioxide (CO2) emissions in Beijing: An input–output structural decomposition analysis. J. Clean. Prod. 2017, 163, 58–68. [Google Scholar] [CrossRef]
  12. Zhang, S.H.; Yi, B.W.; Guo, F.; Zhu, P.Y. Exploring selected pathways to low and zero CO2 emissions in China’s iron and steel industry and their impacts on resources and energy. J. Clean. Prod. 2022, 340, 130813. [Google Scholar] [CrossRef]
  13. An, R.Y.; Yu, B.Y.; Li, R.; Wei, Y.M. Potential of energy savings and CO2 emission reduction in China’s iron and steel industry. Appl. Energy 2018, 226, 862–880. [Google Scholar] [CrossRef]
  14. Juntueng, S.; Towprayoon, S.; Chiarakorn, S. Energy and carbon dioxide intensity of Thailand’s steel industry and greenhouse gas emission projection toward the year 2050. Resour. Conserv. Recycl. 2014, 87, 46–56. [Google Scholar] [CrossRef]
  15. United Nations Industrial Development Organization. Industrial Development Report. 2016. Available online: https://www.unido.org/resources-publications-flagship-publications-industrial-development-report-series/industrial-development-report-2016 (accessed on 1 August 2023).
  16. Tan, X.C.; Li, H.; Guo, J.X.; Gu, B.H.; Zeng, Y. Energy-saving and emission-reduction technology selection and CO2 emission reduction potential of China’s iron and steel industry under energy substitution policy. J. Clean. Prod. 2019, 222, 823–834. [Google Scholar] [CrossRef]
  17. Klimes, L.; Brezina, M.; Mauder, T.; Charvat, P.; Klemes, J.J.; Stetina, J. Dry cooling as a way toward minimisation of water consumption in the steel industry: A case study for continuous steel casting. J. Clean. Prod. 2020, 275, 123109. [Google Scholar] [CrossRef]
  18. Ren, M.; Lu, P.T.; Liu, X.R.; Hossain, M.S.; Fang, Y.R.; Hanaoka, T.; O’Gallachoir, B.; Glynn, J.; Dai, H.C. Decarbonizing China’s iron and steel industry from the supply and demand sides for carbon neutrality. Appl. Energy 2021, 298, 117209. [Google Scholar] [CrossRef]
  19. Quader, M.A.; Ahmed, S.; Ghazilla, R.A.R.; Ahmed, S.; Dahari, M. A comprehensive review on energy efficient CO2 breakthrough technologies for sustainable green iron and steel manufacturing. Renew. Sustain. Energy Rev. 2015, 50, 594–614. [Google Scholar] [CrossRef]
  20. Liu, X.B.; Gao, X. A survey analysis of low carbon technology diffusion in China’s iron & steel industry. J. Clean. Prod. 2016, 129, 88–101. [Google Scholar]
  21. Wang, R.R.; Zhao, Y.Q.; Babich, A.; Senk, D.; Fan, X.Y. Hydrogen direct reduction (H-DR) in steel industry—An overview of challenges and opportunities. J. Clean. Prod. 2021, 329, 129797. [Google Scholar] [CrossRef]
  22. Yilmaz, C.; Wendelstorf, J.; Turek, T. Modeling and simulation of hydrogen injection into a blast furnace to reduce carbon dioxide emissions. J. Clean. Prod. 2017, 154, 488–501. [Google Scholar] [CrossRef]
  23. Weigel, M.; Fischedick, M.; Marzinkowski, J.; Winzer, P. Multicriteria analysis of primary steelmaking technologies. J. Clean. Prod. 2016, 112, 1064–1076. [Google Scholar] [CrossRef]
  24. Mohsenzadeh, F.M.; Payab, H.; Abedi, Z.; Abdoli, M.A. Reduction of CO2 emissions and energy consumption by improving equipment in direct reduction ironmaking plant. Clean Technol. Environ. Policy 2019, 21, 847–860. [Google Scholar] [CrossRef]
  25. Bhaskar, A.; Assadi, M.; Somehsaraei, H.N. Decarbonization of the iron and steel industry with direct reduction of iron ore with green hydrogen. Energies 2020, 13, 758. [Google Scholar] [CrossRef]
  26. Li, F.; Chu, M.S.; Tang, J.; Liu, Z.G.; Zhao, Z.C.; Liu, P.J.; Yan, R.J. Quantifying the energy saving potential and environmental benefit of hydrogen-based steelmaking process: Status and future prospect. Appl. Therm. Eng. 2022, 211, 118489. [Google Scholar] [CrossRef]
  27. Chen, Q.Q.; Gu, Y.; Tang, Z.Y.; Wei, W.; Sun, Y. Assessment of low-carbon iron and steel production with CO2 recycling and utilization technologies: A case study in China. Appl. Energy 2018, 220, 192–207. [Google Scholar] [CrossRef]
  28. Li, F.; Chu, M.; Tang, J.; Liu, Z.; Wang, J.; Li, S. Life-cycle assessment of the coal gasification-shaft furnace-electric furnace steel production process. J. Clean. Prod. 2021, 287, 125075. [Google Scholar] [CrossRef]
  29. Rechberger, K.; Spanlang, A.; Conde, A.S.; Wolfmeir, H.; Harris, C. Green Hydrogen-Based Direct Reduction for Low-Carbon Steelmaking. Steel Res. Int. 2020, 91, 2000110. [Google Scholar] [CrossRef]
  30. Wen, Z.G.; Wang, Y.H.; Li, H.F.; Tao, Y.; De Clercq, D. Quantitative analysis of the precise energy conservation and emission reduction path in China’s iron and steel industry. J. Environ. Manag. 2019, 246, 717–729. [Google Scholar] [CrossRef]
  31. Yan, J.J. Progress and future of ultra-low CO2 steel making program. China Metall. 2017, 27, 6–11. (In Chinese) [Google Scholar]
  32. Zhang, P.; Wang, L.; Chen, S.; Xu, J. Progress of nuclear hydrogen production through the iodine-sulfur process in China. Renew. Sustain. Energy Rev. 2018, 81, 1802–1812. [Google Scholar]
  33. Chang, Y.F.; Wan, F.; Yao, X.L.; Wang, J.X.; Han, Y.F.; Li, H. Influence of hydrogen production on the CO2 emissions reduction of hydrogen metallurgy transformation in iron and steel industry. Energy Rep. 2023, 9, 3057–3071. [Google Scholar] [CrossRef]
  34. Hugues, P.; Assoumou, E.; Maizi, N. Assessing GHG mitigation and associated cost of French biofuel sector: Insights from a TIMES model. Energy 2016, 113, 288–300. [Google Scholar] [CrossRef]
  35. Postic, S.; Selosse, S.; Maïzi, N. Energy contribution to Latin American INDCs: Analyzing sub-regional trends with a TIMES model. Energy Policy 2017, 101, 170–184. [Google Scholar] [CrossRef]
  36. Lu, L.W.; Preckel, P.V.; Gotham, D.; Liu, A.L. An assessment of alternative carbon mitigation policies for achieving the emissions reduction of the Clean Power Plan: Case study for the state of Indiana. Energy Policy 2016, 96, 661–672. [Google Scholar] [CrossRef]
  37. Aitken, M.L.; Loughlin, D.H.; Dodder, R.S.; Yelverton, W.H. Economic and environmental evaluation of coal-and-biomass-to-liquids-and-electricity plants equipped with carbon capture and storage. Clean Technol. Environ. Policy 2016, 18, 573–581. [Google Scholar] [CrossRef]
  38. Rocky Mountain Institute. Pursuing Zero-Carbon Steel in China. 2021. Available online: https://rmi.org/insight/pursuing-zero-carbon-steel-in-china/ (accessed on 23 August 2023).
  39. Chang, Y.F.; Wan, F.; Li, J.R.; Liu, N.; Yao, X. The impact of cautious coal power phase-out on decarbonization of China’s iron and steel industry. J. Clean. Prod. 2023, 397, 136447. [Google Scholar] [CrossRef]
  40. Fan, Z.Y.; Friedmann, S.J. Low-carbon production of iron and steel: Technology options, economic assessment, and policy. Joule 2021, 5, 829–862. [Google Scholar] [CrossRef]
  41. Wang, X.D.; Li, J.X.; Hu, Q.C. Application practice of source and process sulfur-nitrate reduction technology based on optimization of blast furnace charge structure. Iron Steel 2019, 54, 104–110. [Google Scholar]
  42. Wang, X.D.; Jin, Y.L. Prospect on high ratio pellet utilized in blast furnace under the backgroundof carbon peaking and carbon neutrality. Chin. J. Process Eng. 2022, 22, 1379–1389. [Google Scholar]
  43. Institute of Climate Change and Sustainable Development Tsinghua University. Understanding Carbon Neutrality: China’s 2020–2050 Low-Carbon Development Action Road Map; China Citic Press: Beijing, China, 2021. (In Chinese) [Google Scholar]
  44. Rocky Mountain Institute. The Zero Carbon Path of Chinese Steel under the Goal of Carbon Neutrality; Rocky Mountain Institute: Beijing, China, 2021. (In Chinese) [Google Scholar]
  45. DNV. Hydrogen Forecast to 2050. 2022. Available online: https://www.dnv.com/focus-areas/hydrogen/forecast-to-2050.html (accessed on 28 August 2023).
  46. China Hydrogen Alliance. White Paper on China’s Hydrogen Energy and Fuel Cell Industry; China Hydrogen Alliance: Beijing, China, 2019. (In Chinese) [Google Scholar]
  47. China Electric Vehicle Hundred People Association. China Hydrogen Industry Development Report 2020; China Electric Vehicle Hundred People Association: Beijing, China, 2020. (In Chinese) [Google Scholar]
Figure 1. Analytical framework of TIMES-CSHM.
Sustainability 16 01814 g001
Figure 2. Predicted demand for steel in China.
Sustainability 16 01814 g002
Figure 3. Parameter Setting of Chinese Power Supply Structure.
Sustainability 16 01814 g003
Figure 4. Parameter settings for the hydrogen energy supply structure.
Sustainability 16 01814 g004
Figure 5. BAU scenario setting.
Sustainability 16 01814 g005
Figure 6. Carbon emission reduction scenario setting.
Sustainability 16 01814 g006
Figure 7. Steel making technology path in BAU scenario.
Sustainability 16 01814 g007
Figure 8. Iron making technology path in BAU scenario.
Sustainability 16 01814 g008
Figure 9. Technical path for iron production in BAU scenarios.
Sustainability 16 01814 g009
Figure 10. Total CO2 emissions from steel production in BAU scenarios. Note: This part of the CO2 analysis includes CO2 produced by using electricity and hydrogen.
Sustainability 16 01814 g010
Figure 11. CO2 emissions from the pre iron process in BAU scenario. Note that this section of the CO2 analysis includes CO2 from electricity use.
Sustainability 16 01814 g011
Figure 12. CO2 emissions from ironmaking processes in BAU scenario. Note: CO2 from the ironmaking process is only calculated for the CO2 occurring during the process, and does not include CO2 generated by front-end coking use. CO2 from electricity and hydrogen use is however included.
Sustainability 16 01814 g012
Figure 13. CO2 emissions from steelmaking processes in BAU scenario. Note: CO2 analysis includes CO2 from electricity use.
Sustainability 16 01814 g013
Figure 14. Analysis of steel industry emission reduction, in the BAU scenario.
Sustainability 16 01814 g014
Figure 15. Steel making technology path in the carbon emission reduction scenario.
Sustainability 16 01814 g015
Figure 16. Iron making technology path in the carbon emission reduction scenario.
Sustainability 16 01814 g016
Figure 17. Technological path of pre-production iron in the carbon emission reduction scenario.
Sustainability 16 01814 g017
Figure 18. Total CO2 emissions from steel production under the carbon emission reduction scenario.
Sustainability 16 01814 g018
Figure 19. CO2 emissions from the pre iron process in the carbon emission reduction scenario.
Sustainability 16 01814 g019
Figure 20. CO2 emissions from ironmaking processes under the carbon emission reduction scenario.
Sustainability 16 01814 g020
Figure 21. CO2 emissions from steelmaking processes in the carbon emission reduction scenario.
Sustainability 16 01814 g021
Figure 22. Analysis of steel industry emissions reduction in the carbon emission reduction scenario.
Sustainability 16 01814 g022
Table 1. Steel production process parameter settings.
TechnologyThe Main Energy and Raw Materials Input per Unit Product
SinteringAnthracite coal
(tce/t sinter)
Iron ore (t/t sinter)Electricity (kWh/t sinter)Coke crumbs (tce/t sinter)Limestone (t/t sinter)
0.0300.88245.0400.0270.140
PelletizingRaw coal
(tce/t pellet)
Iron ore
(t/t pellet)
Electricity
(kWh/t pellet)
Diesel
(tce/t pellet)
Gasoline
(tce/t pellet)
Fuel oil
(tce/t pellet)
0.0221.04224.8630.0020.00040.002
CokingWashed coal (tce/t coke)Electricity (kWh/t coke)
1.01747.326
Reduction of gas preparation and heatingH2
(m3/m3 reducing gas)
Natural Gas
(m3/m3 reducing gas)
Electricity
(kWh/m3 reducing gas)
0.5700.1420.007
Ironmaking:
Blast furnace ironmakingCoal and fuel injection
(tce/t molten iron)
Coke
(t/t molten iron)
Electricity
(kwh/t molten iron)
Pellet
(t/t molten iron)
Sinter
(t/t molten iron)
0.1340.43723.6480.3601.040
Hydrogen-rich blast furnace ironmakingH2 (m3/t molten iron)Coke (t/t molten iron)Electricity (kwh/t molten iron)Pellet (t/t molten iron)Sinter (t/t molten iron)
305.9110.39023.6480.3601.040
Hydrogen-rich shaft furnace–direct reduction ironmakingHeated reducing gas
(m3/t DRI)
Natural Gas
(m3/t DRI)
Electricity
(kWh/t DRI)
Pellet
(t/t DRI)
1326.32141.4219.2111.357
Steelmaking:
Electric steelmakingmolten iron (t/t Crude steel)Scrap (t/t Crude steel)Electricity (kWh/t Crude steel)Limestone (t/t Crude steel)
0.9650.13036.8300.049
Converter steelmakingDRI (t/t Crude steel)Scrap (t/t Crude steel)Electricity (kWh/t Crude steel)
0.3060.714470.6
Table 2. Proportion of pellets in the blast furnace burden.
202520302035204020452050
Proportion of pellets in blast furnace burden28–30%30–35%33–40%35–45%40–55%45–60%
Table 3. Power generation technical parameters.
TechnologyEfficiency (%)Power Structure for 2020 (%)
Supercritical coal power generation41.0063.38
Supercritical coal power generation + CCS41.00
Combined gas-steam cycle power generation60.002.57
Hydropower18.11
Third generation nuclear power generation38.005.41
Biomass power generation28.001.08
Onshore wind5.68
Offshore wind0.27
Distributed photovoltaic0.68
Centralized photovoltaic2.84
Table 4. Technical parameter settings for hydrogen production.
TechnologyEfficiency (%)Hydrogen Energy Supply Structure (%)
Coal gasification63.0062.00
Coal gasification with CCS58.00
Methane reforming71.0019.00
Methane reforming with CCS74.00
Industrial by-products18.00
ElectrolysisGrid connected electrolysis4.70
Kwh/m3
1.00
Dedicated solar electrolysis
Dedicated wind electrolysis
Dedicated nuclear electrolysis
Table 5. Setting of cost parameters for hydrogen energy production.
20202020–20252026–20352036–2050
The cost of hydrogen energy productionCoal to hydrogen
Without CCUS: 6–12 yuan/kg
With CCUS: 25.8–32.1 yuan/kg
Develop hydrogen production routes according to local conditions; actively use industrial by-product hydrogen; and vigorously develop renewable energy electrolytic water hydrogen production demonstration. The average cost of hydrogen production is not more than 20 yuan/kg.Actively develop large-scale renewable energy electrolysis of water to produce hydrogen and coal to produce hydrogen centralized hydrogen supply; the average cost of hydrogen production is not higher than 15 yuan/kg.Sustainable use of renewable energy electrolysis of water to produce hydrogen; vigorously develop biological hydrogen production, solar water splitting to produce hydrogen, and ‘green’ coal to produce hydrogen technology. The average cost of hydrogen production is not more than 10 yuan/kg.
Hydrogen production from natural gas
7.5–24.3 yuan/kg (without CCUS)
Industrial by-product hydrogen
14.6–26.9 yuan/kg
Hydrogen production by electrolysis of water
Alkaline electrolysis: 9.2–40 yuan/kg
PEM electrolysis: 20.5–48.5 yuan/kg
(Electricity price 0.1–0.6 yuan/kWh)
Table 6. Setting of CO2 emission coefficient (per unit product) in the steel production process.
Technical NameCarbon Dioxide Emission Coefficient per Unit Product
(kg CO2/t)
Sintering284.02
Pelleting254.21
Coking816.38
Preparation and heating of reducing gas0.29
Scrap returns2.97
Ironmaking
Blast furnace ironmaking1454.01
Hydrogen-rich blast furnace ironmaking1061.73
Hydrogen-rich shaft furnace–direct reduction ironmaking21.96
Steel making
Converter steelmaking10.80
Electric steelmaking193.34
Note: CO2 from this part of the steel production process does not include CO2 from electricity and hydrogen use. CO2 from electricity and hydrogen use are set separately (see below).
Table 7. Setting of CO2 emission factors for power generation and hydrogen production.
20202025203020402050
Carbon emission coefficient of power generation (kg/kwh)0.5710.5170.4630.3380.221
Carbon emission coefficient of hydrogen production (kg/m3)1.1941.0530.9030.5160.407
Disclaimer/Publisher’s Note: The statements, opinions and data contained in all publications are solely those of the individual author(s) and contributor(s) and not of MDPI and/or the editor(s). MDPI and/or the editor(s) disclaim responsibility for any injury to people or property resulting from any ideas, methods, instructions or products referred to in the content.

