Article

Building Sustainable and Connected Communities by Addressing Public Transportation’s First-Mile Problem: Insights from a Stated Preference Survey in El Paso, Texas

1
Department of Landscape Architecture and Urban Planning, School of Architecture, Texas A&M University, 3137 TAMU, College Station, TX 77843, USA
2
School of Global Health Management & Informatics, University of Central Florida, Orlando, FL 32801, USA
3
Disability, Aging & Technology Cluster, University of Central Florida, Orlando, FL 32816, USA
4
School of Planning, University of Cincinnati, Cincinnati, OH 45221, USA
5
Department of Environmental and Occupational Health, School of Public Health, Texas A&M University, College Station, TX 77843, USA
*
Author to whom correspondence should be addressed.
Sustainability 2024, 16(5), 1783; https://doi.org/10.3390/su16051783
Submission received: 30 December 2023 / Revised: 3 February 2024 / Accepted: 11 February 2024 / Published: 21 February 2024

Abstract

:
Public transportation is an essential component of building sustainable communities. However, its ridership remains low in most cities in the United States. Among the major barriers is the long distance to the bus stops, called the first-mile problem. Using a stated preference survey among 1056 residents of El Paso, Texas, this study addresses this problem by estimating additional transit trips that can be expected from the implementation of hypothetical, free shuttles between one’s home and the closest bus stops. Participants reported 7.73 additional transit trips per week (469% increase from the current baseline), including 3.03 additional trips for work, 1.94 for daily errands, 1.64 for leisure or social, and 0.93 for exercise or sports. The percentage of transit non-users dropped from 77.6% (baseline) to 38.2%. With the free shuttle service, respondents would favor bus rapid transit more than regular buses (4.72 vs. 3.00 additional trips). Residents identifying as an existing transit user, being Hispanic/Latino, owning at least one automobile, living within 1 mile of a transit stop, and feeling safe while riding the bus would make significantly more transit trips due to the service. This study suggests that programs to address/reduce the first-mile problem could increase transit demand and, therefore, contribute to creating sustainable and more connected communities.

1. Introduction and Literature Review

1.1. Struggling Public Transportation Despite Its Multi-Faceted Benefits

Public transportation systems play a vital role in reducing traffic congestion, curbing environmental pollution, and enhancing overall urban livability [1,2,3]. Public transit, such as buses and rails, have higher passenger capacities compared to private vehicles, efficiently utilizing roads and parking spaces. Numerous studies demonstrate that public transportation decreases the number of vehicles on the road, thereby helping to mitigate traffic congestion and related costs [4,5,6,7]. Public transportation stands out for its environmental friendliness compared to private vehicles. By moving passengers efficiently, public transit burns less fossil fuel, emits fewer greenhouse gases, and contributes to improved air quality [8,9]. Many public transportation systems are actively incorporating electricity and natural gas as alternative fuels to lower their carbon footprint further [10]. Moreover, public transportation provides affordable and independent mobility, providing access to essential services such as employment, education, healthcare, and recreational opportunities. This is particularly important for residents in low-income neighborhoods, individuals with limited access to private vehicles, and those facing physical barriers to driving [11,12,13]. Using public transit also contributes to increased physical activity and encourages more social interactions among riders, positively impacting individual and public health and well-being. Studies highlight that transit use promotes an active lifestyle, helps combat obesity and other diseases, and fosters a sense of community [2,14,15,16]. Furthermore, empirical studies consistently report that public transit infrastructure attracts businesses and increases commercial and residential property values by improving accessibility and reducing transportation expenses [17,18,19].
Given that this study takes place in a city in the United States (US), we focus the remainder of this literature review on the US context. US cities are often characterized by sprawling suburban development, which creates considerable distances between residential areas and public transit hubs. This sprawl is unlike the more compact urban structures commonly found in many European and Asian cities, where public transit stops are typically more integrated within residential areas. While there are many documented benefits of public transit, the US transportation system has struggled to maintain its ridership even before the COVID-19 pandemic.
The United States Census Bureau [20] reported that only 5 percent of workers commuted by public transportation. According to the American Public Transportation Association [21], despite the nation’s population growth, transit passenger miles traveled dropped to 56.1 billion in 2019, a 5.9 percent decline from its peak of 59.6 billion in 2014. Mirroring this trend, transit ridership dipped by 7.3 percent, from 10.75 billion unlinked passenger trips in 2014 to 9.97 billion in 2019. Bus ridership continued its decline to 4.66 billion trips in 2019, marking a 14 percent decrease from 2007. Furthermore, transit ridership in the US has witnessed a sharp decline since COVID-19. The fear of infection and perceived risks drove passengers away from public transit to other modes [22,23]. The American Public Transportation Association [10] and the Federal Transit Administration [24] noted that in 2020, a total of 5.97 billion unlinked passenger trips were taken, falling 40 percent from 2019. The pandemic dramatically altered the distribution of bus and rail trips, with rail trips declining more than bus trips. Compared to rural areas, urban areas experienced a more pronounced plummet. Ahangari, et al. [25] investigated Baltimore and nine other similar US cities and found that in April 2020, transit ridership was 62–87% less than the same month in 2019. In Washington, D.C., bus ridership decreased by a maximum of 75%, and Metrorail ridership fell by up to 90% [26]. Gao, et al. [27] compared transit ridership between 2020 and 2019 in New York City, and found that the Metro North Railroad ridership experienced a decline of 94%. Moreover, transit ridership reductions vary disproportionately among different sociodemographic groups. Neighborhoods with a higher median household income, a higher percentage of the population with a Bachelor’s degree or higher, and a higher employment rate were more likely to experience greater reductions in transit ridership during the pandemic [28]. The erosion of trust in public transportation systems may persist, continuing to disrupt transit ridership and services in the several years after the COVID-19 pandemic [29,30].
The main factors contributing to the drop in public transportation ridership include the growth of ride-sharing or ride-hailing services (e.g., Uber, Lyft), increased car ownership, teleworking, low gas prices, increased transit fares, safety concerns regarding crime and contagious diseases (e.g., COVID-19), unreliable schedules and services, and inefficient facilities exacerbating pedestrian inaccessibility [31,32]. Specific barriers to accessible public transportation encompass a lack of sidewalks/crosswalks and insufficient transit stops near origins or destinations [33,34]. The first-mile problem in public transportation refers to the spatial accessibility to transit stops from the trip origin (e.g., home), which is increasingly recognized as one of the most important factors affecting whether individuals will use public transportation [35,36]. Most individuals prefer private automobiles or door-to-door transport services as more convenient and reliable modes of transportation, especially when transit stops are difficult or unsafe to access and located beyond a half mile from their homes [36]. To address this access barrier, an increasing number of public transit agencies are developing innovative strategies to promote the first-mile connection. These strategies focus on introducing new mobility services, such as autonomous vehicles, ride-sharing services, electric scooters, and dockless bicycles to connect homes and bus stops, and the evaluation of these strategies likely needs to involve emerging analytical methods [37,38,39,40,41,42,43,44].

1.2. Pilot Programs to Address the First-Mile Problem

Empirical evidence suggests the significant role of first-mile infrastructure and services in promoting public transportation ridership. Specifically, Liu et al. [45] conducted a study in Maryland and demonstrated significantly positive associations between feeder bus connections and transit ridership. One study in the San Francisco Bay Area suggested that bus and shuttle services were positively correlated with rail ridership [46]. Another study in Hamilton County, Ohio, investigated commuting transit use among workers and indicated that the first-and-last-mile connection (e.g., pedestrian and bike networks) is important for promoting transit ridership [47]. Studies in Washington, D.C. also showed that shared bikes were important for filling the first-mile gap and increasing transit ridership [48,49].
Table 1 summarizes pilot projects over the past decade addressing the first-mile problem in US cities from 2015 to 2023, some of which also address the last-mile problem. Transit agencies in Pinellas County and Hillsborough County, Florida, provided ridesharing services such as subsidized Uber and Lyft rides to and from main stations or locations. Three Texas cities (i.e., Fort Worth, Austin, and Dallas) introduced on-demand services that provided rides to and from transit stations and other destinations. California cities or regions implemented multiple strategies, which included shuttle services to main transit stations in Cupertino and Los Angeles, priority parking for carpool serving transit users at transit stations in San Francisco, charging bays for e-bikes at transit stations in Sacramento, and Uber rides vouchers for trips to/from transit stations in Marin County. We also found additional cities with pilot first-mile strategies, such as shuttle services in Salem, Oregon; free Lyft Line (carpooling) rides in Centennial, Colorado; subsidized rides to and from transit stops in Phoenix, Arizona; shared bikes and scooters in Dayton, Ohio; and free pick ups and drop offs within a quarter mile in Kansas, Missouri. These pilot studies showed promising results in boosting public transit use.
Although existing first-mile studies with innovative connectivity-enhancing strategies indicated the importance of improving the first-mile connection to boost transit riders, these studies were mostly conducted in one single US city/region/state with limited generalizability. More studies in additional communities are needed to further investigate the full extent of the first-mile problem and corresponding solutions while considering specific socio-cultural, demographic, and environmental factors. Future planning efforts should emphasize equitable access to public transportation by incorporating the best arrangement of land-use patterns and additional first-mile infrastructure and services to support the smart and sustainable growth of public transportation in US cities with varying characteristics.
In addition, despite a growing interest in solving the first-mile problem, empirical studies investigating the impacts of the first-mile connection on transit ridership are limited. To the best of our knowledge, no studies are available to identify how or under what circumstances specific first-mile programs (e.g., free shuttle services from an individual’s home to the nearest bus stop) may impact the use of bus rapid transit (BRT) vs. regular buses in underserved racial and ethnic minority communities along the US-Mexico border, and within the timeline of the current study. Furthermore, research is also limited in exploring how various first-mile programs may have differential impacts on at-risk populations (e.g., older adults) and commuters with diverse trip purposes.
Our study, conducted in El Paso, Texas, aims to highlight the significant potential of addressing public transit’s first-mile problem. As such, it contributes to the understanding of transportation dynamics in racial and ethnic minority communities. El Paso’s unique demographic and cultural landscape provides valuable insights into the transportation needs and preferences of minority communities, often underrepresented in transportation research. We investigate the potential increases in the utilization of both BRT and regular bus services across various trip purposes after incorporating a hypothetical free shuttle service to connect homes and transit stops. In the following section, we introduce our study methodology, present the study results, discuss relevant policy implications, and provide concluding remarks.

2. Methodology

2.1. Study Community and Current Transit Options
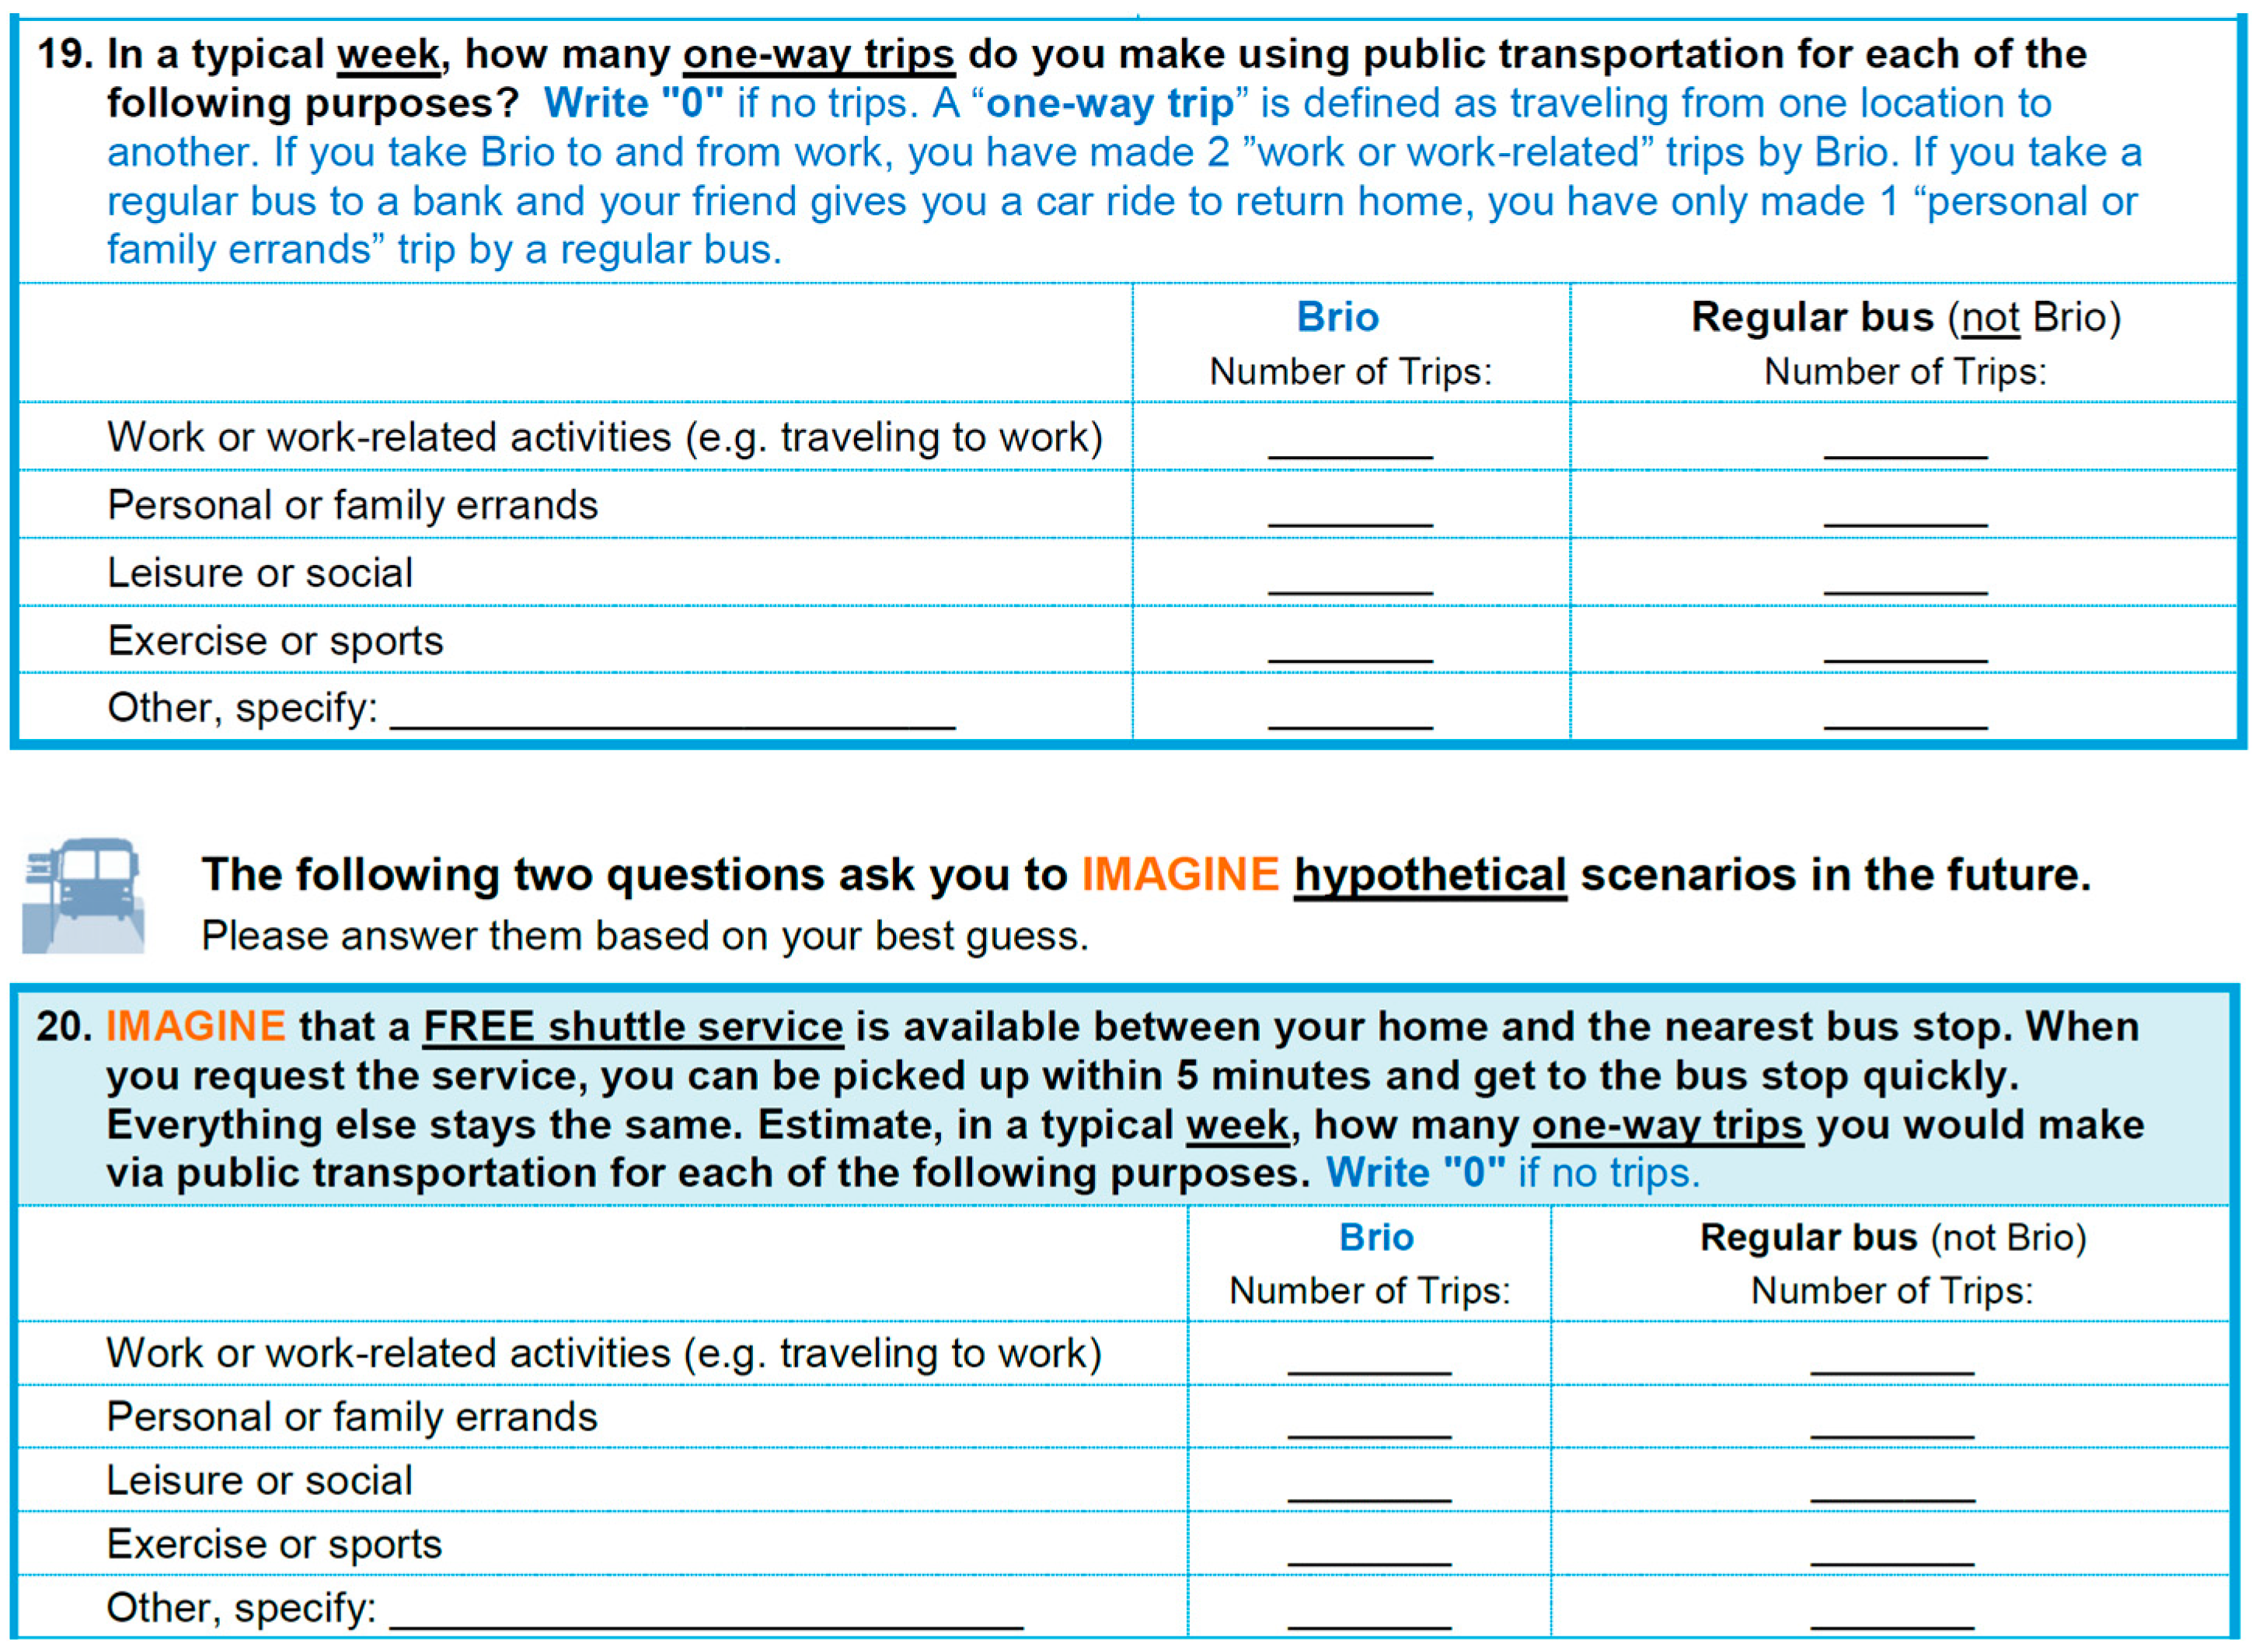
According to the American Community Survey 5-year estimates from 2014 to 2018 [60], El Paso had a total population of 680,354 with a population density of 4.10 persons/acre. About 7.57% of its residents lived in a household without a car; 12.45% of its population were aged 65 or older; 43.84% had an education level of high school graduation or lower; its median household income was USD 45,656; and 80.94% were Hispanic/Latino. El Paso currently has two types of transit services, including BRT, called Brio, and the regular bus. BRT systems are a form of bus transportation that often features a limited selection of enhanced stations, priority at traffic signals, and dedicated lanes. In El Paso, Brio is characterized by unique branding, standout stations, and signal prioritization, which extends green lights to minimize delays. BRT systems are particularly well-suited for less densely populated cities in the US, as they blend the efficiency, speed, and dependability of rail transit with the adaptability and lower costs of traditional bus systems. BRT in El Paso, at the time of the survey, connected the Downtown Transit Center to the West Side Transit Center along the Mesa Corridor. This corridor was 8.6 miles long and included 22 Brio stations.

2.2. Survey Design

The survey included questions on a hypothetical first-mile intervention (i.e., free shuttle service between home and the nearest bus stop), which were designed following the guidance on the stated preference methods [61]. Such methods emerged in transportation studies in the 1970s, when researchers realized the possibility of evaluating how individuals react to various combinations of transport attributes could not always be directly observed in reality [62,63,64]. Since then, these methods have been extensively employed in travel behavior studies to uncover responses to various travel choice scenarios that are not available or are difficult to intervene in under real-world conditions. They allow transportation researchers to have more control of the defined conditions and examine a wide range of variables. In addition, they are more cost-effective than revealed preference methods, as each participant can provide multiple data points on different variables of interest to the researcher.
In this study, we started by defining the factors of interests and their levels to be evaluated, following Kroes and Sheldon’s recommended utility function [65]:
U = f = 1 n w f x f
where U is the total utility of an individual, x f is the value of factor f, and w f is the weight of factor f. We have options for defining a series of factors about the shuttle service, such as pricing, wait time, booking, scheduling, route planning, and safety measures. However, we share the same concerns with many researchers that choice set complexity may influence the consistency of choices and, therefore, skew the estimates [66]. Consequently, we decided to simplify our experiment and allow participants to focus on the comparison between the baseline (current transit use behaviors “in a typical week”) and one well-defined hypothetical scenario, the provision of free shuttle service between home and the nearest transit stop. Our experiment consists of two survey questions consecutively presented to the participants (Figure 1).
In our stated preference experiment, we separated BRT from the regular bus service, given its unique characteristics described previously. We focus on four primary trip purposes: (1) work or work-related activities, which include commuting trips between home and work locations, as well as trips undertaken for purposes directly related to one’s employment and professional responsibilities; (2) personal or family errands, which are made to fulfill various needs and responsibilities associated with one’s personal life and family commitments such as grocery shopping and healthcare appointments; (3) leisure or social activities, such as visiting friends and attending cultural events, which are unlike work- or errand-related trips and driven by the motivation for personal enjoyment and enrichment of life experiences; and (4) exercise or sports, such as gym and fitness center visits, which are to engage in physical, sports, and fitness-related activities. These are common classifications used in transportation mode choice and modeling studies [67].
The survey also included specific questions about participants’ characteristics, such as sex, race, ethnicity, educational background, marital status, household makeup, car ownership, income, attitudes, social influences, and overall self-rated health, including the type and number of co-morbidities. Additionally, the survey collected perceived evaluations of various dependent and independent factors, including travel behavior, choice of transportation modes, incentives and obstacles for using transit, and environmental aspects around residences and BRT stations. The English version of the survey was prepared first, followed by the creation of the Spanish version through a forward–backward translation process, ensuring the equivalency of both versions. The whole survey required about 40 min to complete by participants.
The survey content represented the transdisciplinary nature of the research team (e.g., transportation, urban planning, landscape architecture, public health) to address salient issues across multiple fields of inquiry. We closely engaged local key informants who were attuned to the cultural customs of our study community. Throughout the design phase of the study, they offered crucial insights into the phrasing and translation of our survey questions. We also pilot-tested the survey questions among a sub-sample of the study population during our project’s open-house events.

2.3. Data Collection/Measures

The surveys were administered in 2018 and 2019, prior to the COVID-19 pandemic, as part of our project to investigate the public health impacts of new public transit infrastructure [16]. We distributed the surveys to strategically selected neighborhoods throughout the City of El Paso, defined as census block groups. First, we selected a total of 50 neighborhoods located within 0.5 miles of new BRT stations. We then matched them with 35 neighborhoods located at least one mile away from these new BRT stations, using a propensity score matching method based on socio-demographic variables such as population density, poverty rate, car ownership, ethnicity, and education attainment.
In the context of our study, which predominantly involved individuals identifying as Latino/Hispanic located along the US–Mexico border, we deployed a range of culturally sensitive recruitment strategies to effectively engage participants. During our pilot phase, we experimented with various approaches to find the most effective recruitment strategies. Our most successful strategy emerged through the US Postal Service Every Door Direct Mail service. This approach allowed for precise, spatially targeted outreach, proving to be fruitful in reaching our target population. It resulted in recruiting approximately two-thirds of the participants. Additionally, setting up recruitment booths in public locations, as advised by our local collaborators, proved to be an essential culturally sensitive method. This strategy aligned well with the community norms and preferences, contributing to enrolling about one-third of our study participants.

2.4. Analytical Methods

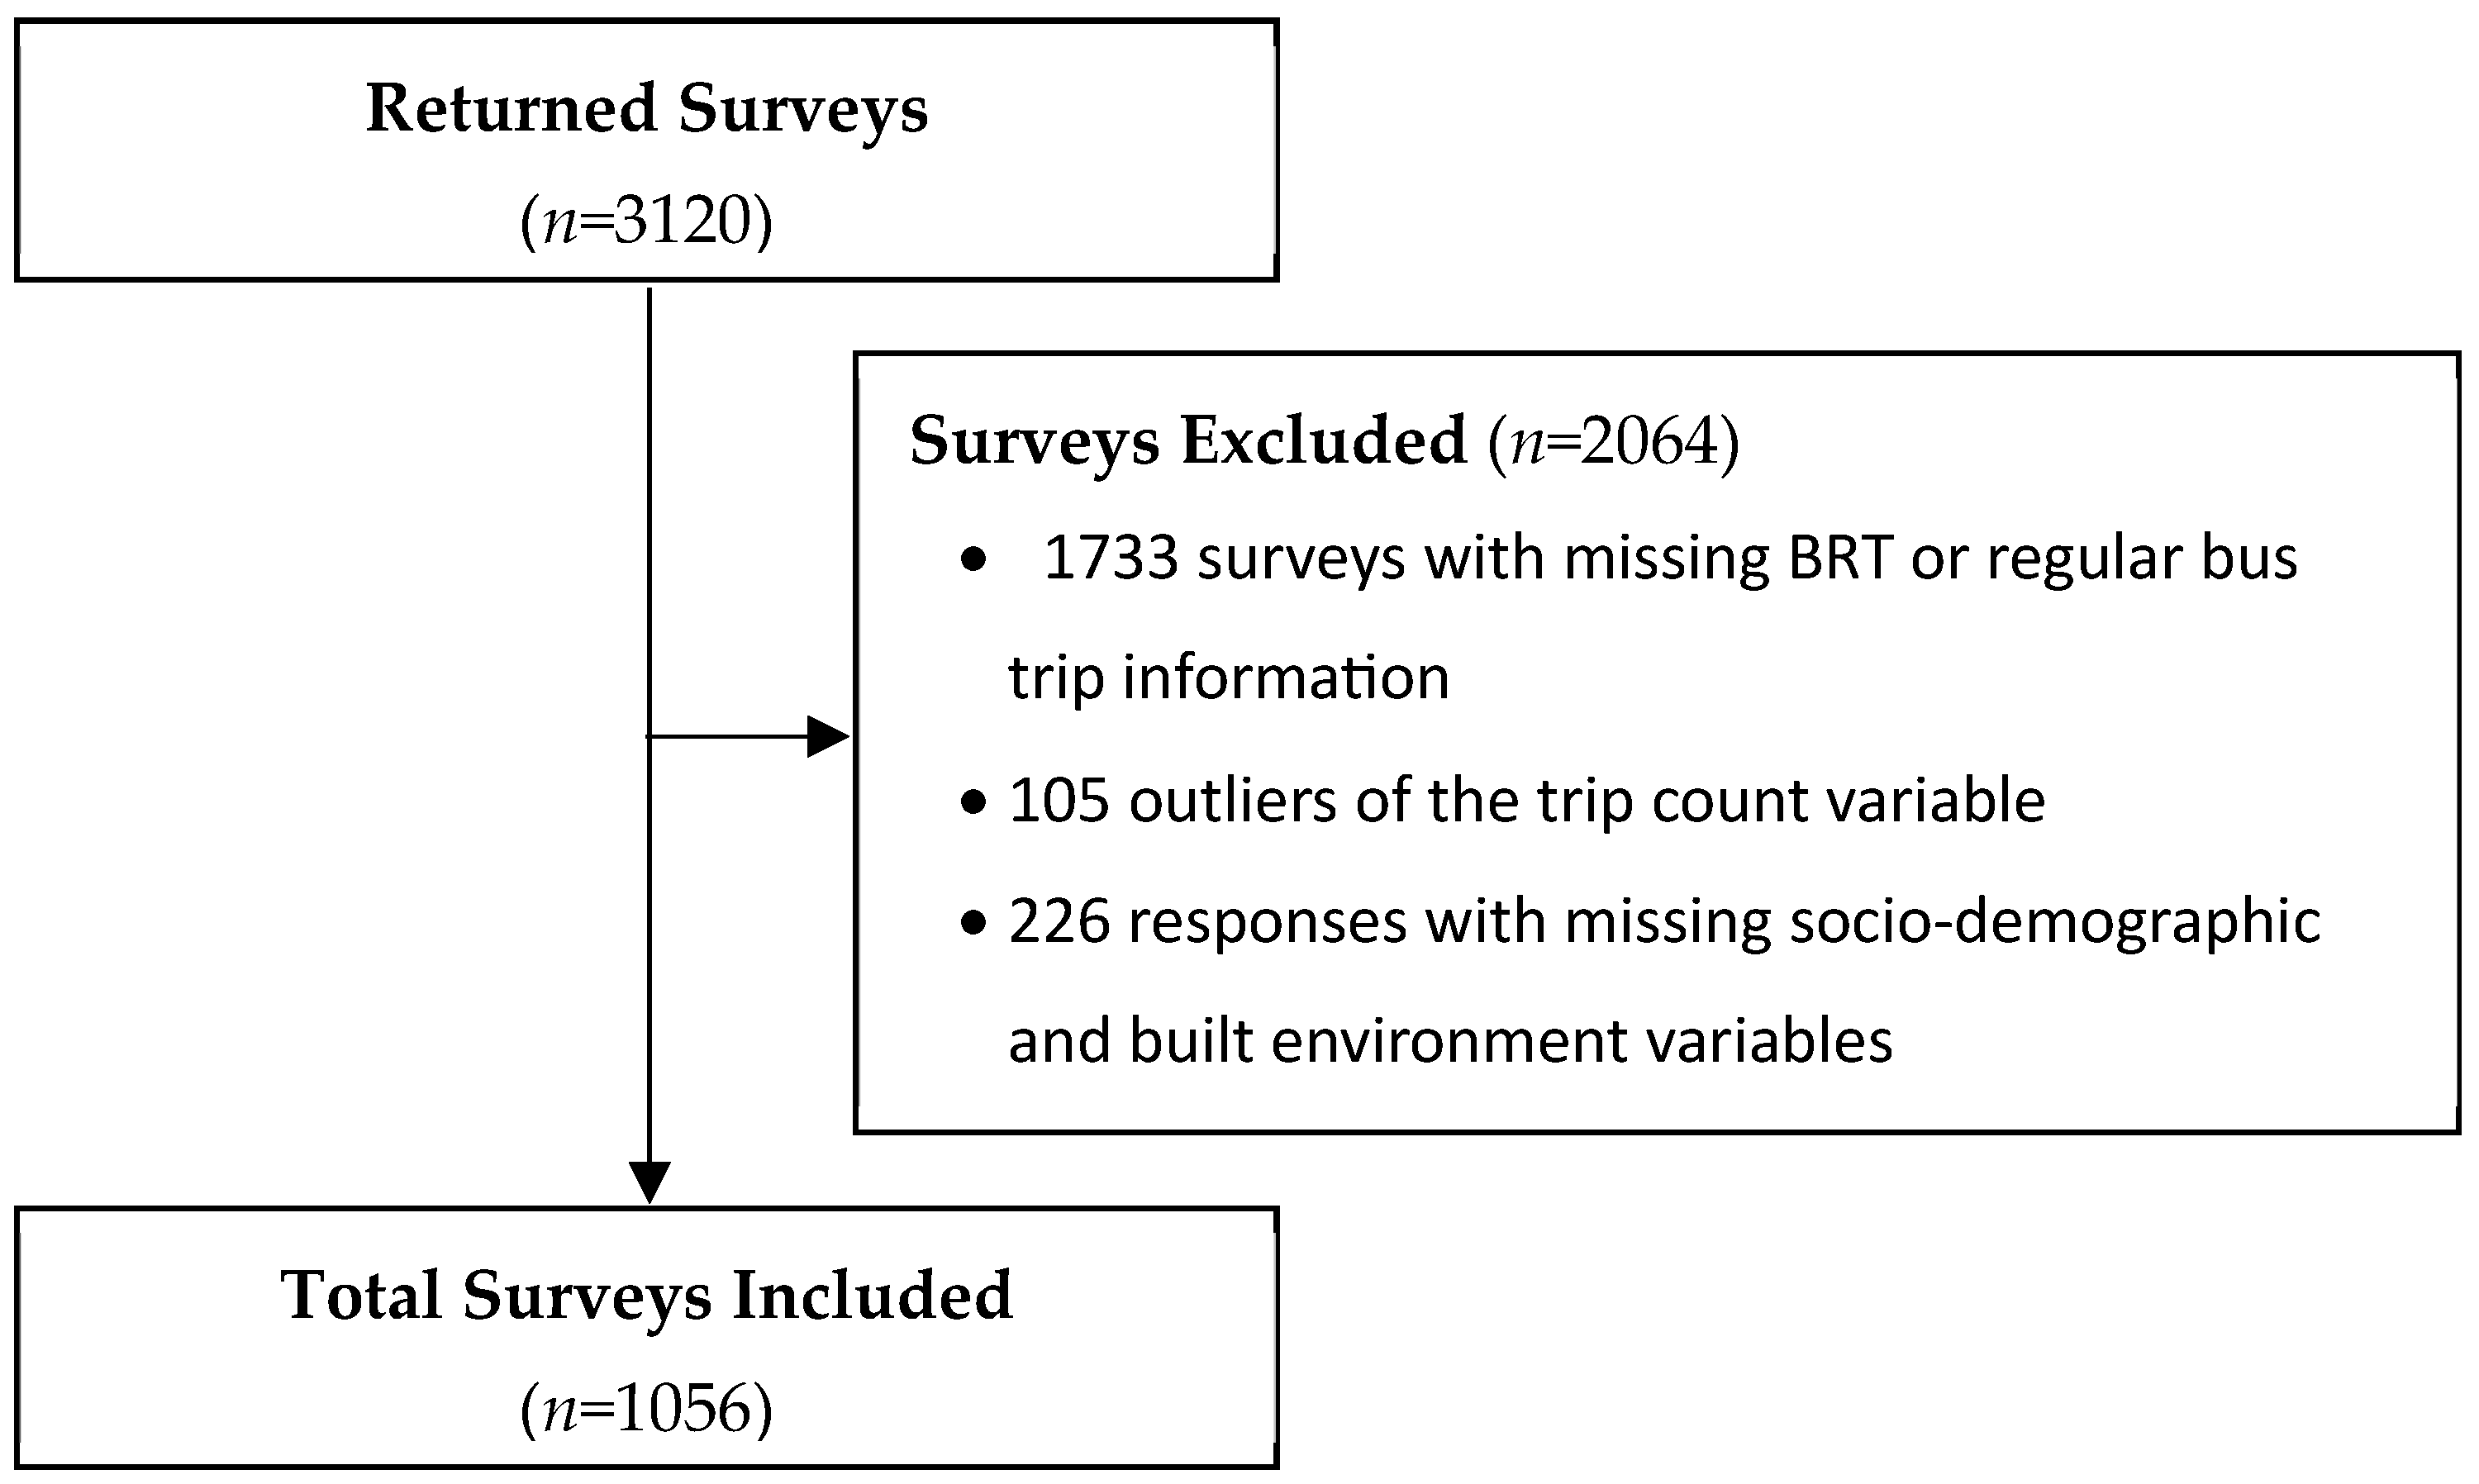
2.4.1. Survey Responses and Data Cleaning

At the conclusion of our data collection, 3120 participants returned the survey with at least some responses. Many participants failed to report the number of trips for every trip purpose and transit type. For example, participants reported missing values of baseline BRT trips for work (n = 725), errands (n = 835), leisure activities (n = 882), and exercise-related trips (n = 906), respectively; similarly, 794, 891, 972, and 986 participants reported missing values of baseline regular bus trips for these trip purposes, respectively. As a result, we had to exclude 1733 responses who reported a missing value for any type of trip purpose fulfilled by BRT or regular buses. We also examined each baseline trip count variable and excluded responses belonging to the top or bottom 1% for that variable, resulting in an exclusion of 105 additional responses. We chose to do this to reduce the outliers’ impact, make our trip measures more representative of our data, and draw our policy recommendations focusing on the typical experiences of transit users. Then, we examined each socio-demographic and built-environment variable and further removed 226 additional observations due to missing values. After eliminating missing data, our final sample size was 1056 (see Appendix A for a flow chart of our processing work).

2.4.2. Variables and Summary Statistics

Table 2 presents the summary statistics of variables that may influence participants’ changes in public transit usage due to the hypothetical shuttle service. Our data analysis work strives to reveal how various socio-economic and built-environment variables influence an individual’s stated preference toward using public transportation. We have chosen the specific socio-economic variables to examine in this study by closely following insights from the published literature. For example, the conventional wisdom from published work reveals how socio-demographic variables may influence individuals’ use of public transportation. Whether or not an individual is an existing transit user may reveal information about their familiarity with the system, established habits, and perceived values and satisfaction. Individuals with a lower income and those whose households do not own a private automobile may have limited access to private vehicles and are more likely to be price-sensitive, making them more inclined to use public transit [68,69,70,71]. Employment status strongly influences commuting patterns [19,72]. Employed individuals may often use public transit for work-related commute trips, and a free shuttle can enhance this option. Education level has nuanced impacts on transit use. On one hand, higher education levels may be associated with a greater awareness of transportation options and environmental concerns associated with driving [73], potentially leading to pro-transit choices. On the other hand, those with lower education levels may be more dependent on public transit due to the limited availability of other viable options [74]. Our sample is similar to that of the whole city of El Paso in terms of some socio-demographic characteristics, such as the employment rate, automobile ownership, and ethnicity (Table 2). However, the survey sample had a higher proportion of transit users, those from low-income households and those living in households with children.
Our choice of built-environment variables was also based on previous research relevant to public transportation. Neighborhood walkability, as reflected in the density of activity opportunities, street connectivity, and availability of sidewalks, might have a direct effect on residents’ decision to walk to the nearby transit stops. We use the walk score [75], a widely used index, to measure neighborhood walkability [75,76], which is unique to each participant’s residential neighborhood. Similarly, we used the bike score [77] and transit score [78] as approximate quality indices of infrastructure that supports bicycle and transit use. The average walk score, bike score [77], and transit score [79] were 46 (somewhat walkable), 42 (some biking infrastructure), and 31 (limited public transportation), respectively.
A quarter of a mile and half a mile from a transit station are both commonly used thresholds to define a transit catchment area [80,81,82]. We, therefore, generated three binary variables that represent a participant’s proximity to the nearest transit stop with <0.25 mile as the benchmark: 0.25–0.50 mile, 0.50–1 mile, and beyond 1 mile of the nearest stop. They captured 22.90%, 3.31%, and 1.52% of the sample, respectively. In addition, we included fine-grained details on two crucial built-environment variables along each participant’s presumable walking route to transit: sidewalk coverage and tree canopy coverage. Sidewalks provide a safe, designated space for pedestrians, making it easier and safer to walk to the transit stop [83]. El Paso has scorching weather in summer with numerous days of triple-digit Fahrenheit temperatures (e.g., 33 days of triple-digit temperatures in 2022 [84]); tree shade has been shown to influence walking behaviors, especially in warm/hot climate regions [85]. We calculated the shortest route from each participant’s home location to the nearest transit stop and then calculated the proportion of the route served by a sidewalk. Then, we added a buffer area of 50 feet to each side of the route and calculated the percentage of tree canopy cover in the area. On average, 79% of participants’ walking routes to transit had sidewalks, and 3.23% of such routes were covered by tree canopy.

2.4.3. Modeling Considerations

We use T i , j , k to denote the change in transit trip frequencies:
T i , j , k = T i , j , k a T i , j , k b
where
  • i is a participant identification number;
  • j 1,2 , 3,4 , 5,6 represents the trip purpose: work, errand, leisure, exercise, other, and overall;
  • k 1,2 , 3 represents the type of transit: all transit ( k = 1 ) , BRT ( k = 2 ) , and regular bus ( k = 3 );
  • T i , j , k b is the participant’s baseline number of transit trips;
  • T i , j , k a is the participant’s number of transit trips after the free shuttle service is introduced.
Our model to estimate the impacts of various factors on the change in transit trips can be written as follows:
T i , j , k = α 0 + α X i + β Y i + ε i j , k
where
  • X i represents a 10 × 1 vector of socio-demographic variables for participant i;
  • Y i represents a 8 × 1 vector of built-environment variables for participant i;
  • α a n d   β are vectors of coefficients to be estimated;
  • α 0 is the constant term;
  • ε i is the error term.
For each of the regression models specified in Equation (3), we carried out the Breusch–Pagan test to detect heteroskedasticity. All tests returned strong evidence for the potential heteroskedasticity problem. Therefore, we estimated robust standard errors for all models. We also calculated the variance inflation factor (VIF) for each independent variable to detect potential multicollinearity. The VIF scores ranged from 1.07 to 2.45, with a mean of 1.33, indicating the minimal threat of such an issue.

3. Results

3.1. Baseline Transit Trips

At baseline, for the regular bus trips, the average number of all-purpose trips was 1.25 per week, with a maximum of 60 trips (Table 3). About 79.6% of the participants did not use the bus at all (non-users) at baseline. Work-related trips had an average of 0.46 per week, followed closely by errands at 0.45. In contrast, BRT trips were notably lower than regular bus trips, likely because of their relatively limited service areas/routes. The average all-purpose BRT trip was 0.40 per week. BRT uses for specific purposes such as work (0.14), errands (0.11), and leisure (0.08) were considerably lower than the same purposes for the regular buses. When considering the combined data of BRT and regular bus trips, the average number of trips for all purposes was 1.65 per week. On average, a participant would make 0.61 transit trips for commuting, 0.57 for errands, and 0.31 for leisure per week. Participants would make less than 0.10 trips for sports or other purposes.

3.2. Changes in Transit Trips Due to a “Hypothetical” Shuttle Service between Homes and Transit Stops

Table 4 summarizes the impact of the hypothetical shuttle service aimed at solving the first-mile problem of transit trips. It shows a substantial increase in the number of trips across various purposes for both BRT trips and regular bus trips. The percentage of non-users dropped from 819 (77.6%) at baseline to 403 (38.2%) under the hypothesized scenario.
For combined BRT and regular bus trips, the mean number of all-purpose trips increased to 7.73 per week, a 469% increase from the baseline. This substantial rise was even more pronounced in specific categories like work-related trips (500% increase) and leisure trips (533% increase). The most significant jump was observed in exercise-related trips, soaring by 1084%.
The mean number of all-purpose trips increased by 1179%, with work-related trips climbing to 1295%. The percentage increases for leisure, sport, and errands were all in the four-figure percentage range, highlighting a distinct preference for BRT over regular buses when the first-mile issue is resolved (hypothetically).
In contrast, while there was also a notable increase in the use of regular buses, the percentage changes were less dramatic compared to BRT. The all-purpose trips increased by 241%, with exercise-related trips seeing a 658% increase. Trips for work, errands, and leisure purposes experienced increases of 252%, 168%, and 295%, respectively.

3.3. Factors That Influence the Changes

Based on Equation (3) ( k = 1 ) , Table 5 presents insights into factors influencing changes in transit trips across various purposes: work, errands, leisure, and exercise. Being an existing transit user was a primary factor in increasing overall transit trips, with a particularly strong influence on work-related and leisure trips. Surprisingly, higher household income did not significantly affect the change in transit trips. Being employed for wages was positively correlated with an increase in work-related transit trips.
Some household characteristics are associated with changes in transit use patterns. Households owning at least one automobile showed an unexpected inclination toward using transit more often with the introduction of a free shuttle service, particularly for the purpose of leisure activities. Households with at least one child under 18 years old would use transit more to fulfill errands. Older adults were less likely to report increased transit trips for work, leisure, and sport. Additionally, feeling safe while riding the bus significantly boosted the likelihood of increasing transit use, particularly for leisure and sports activity purposes, underlining the importance of perceived safety in public transit usage.
Ethnicity also played a significant role in stated travel preferences. Individuals who reported being Hispanic/Latino showed a higher likelihood of increasing total transit use for all purposes, particularly for work and sports-related trips. Environmental factors did not play a considerable role. The walk score, bike score, and transit score, in general, had small and insignificant influences on the overall change in transit trips, as did factors of tree canopy cover and sidewalk completeness. Compared to the benchmark of residing within 0.25 mile from a transit stop, those who live 0.25–0.5 mile or 0.5–1 mile from a transit stop did not have a considerably different travel pattern. However, those who lived beyond 1 mile from a transit stop would be significantly less likely to increase transit use for errands or sports activities.
Based on Equation (3), Table 6 ( k = 2 ) and Table 7 ( k = 3 ) report the regression results for changes in BRT and regular bus trips, respectively. There were similarities between the two modes in terms of the significance and magnitude of certain demographic factors. Hispanic/Latino ethnicity consistently emerged as a significant predictor for increased usage in both BRT and regular bus services, with comparable magnitudes. Socio-demographic factors such as being an older adult, having at least one automobile, and having at least one child under 18 years old generally had the same effect on the changes in BRT and regular bus services.
However, there are notable differences in some other factors between BRT and regular bus usage. In both BRT and regular bus scenarios, being an existing transit user was a predictor of increased transit usage. However, such a variable played a much more significant role for BRT than for the regular bus. Car ownership also differed significantly between BRT and regular bus users. In the BRT scenario, households with at least one automobile showed a higher propensity to use BRT. Furthermore, BRT services seemed to have had a larger catchment area than the regular bus: when the free shuttle service is introduced, individuals living beyond 0.5 mile of a transit stop would see a change in the regular bus significantly less than the <0.25 mile benchmark; such a threshold is 1 mile for BRT.

4. Discussion

4.1. Tremendous Latent Demand for Transit

The first-mile problem in the US persists due to limited access and connectivity between residential areas and public transportation hubs. To tackle this issue, we proposed innovative shuttle programs aimed at eliminating this initial hurdle for passengers and sought participants’ responses to this hypothetical scenario. Our results strongly suggest that addressing the first-mile challenge through free shuttle services has the potential to dramatically enhance the attractiveness of transit services, encouraging people to opt for public transport for a broad range of activities. Our study illuminates the untapped potential of users who might choose public transit if initial access barriers are removed. Such a preference extends beyond just habitual transit users to those who might otherwise choose private vehicles or other modes of transport. This increased attractiveness of public transit could lead to broader societal benefits, such as reduced traffic congestion and lower emissions, aligning with sustainable urban development goals.
This finding aligns with prior studies emphasizing the substantial ridership boost achievable through enhanced first-mile access [86]. Xie et al. [87] highlighted the effectiveness of Beijing’s local shuttle buses in eradicating inefficient connections between public transportation stops and origins or destinations. Similarly, Gelbal et al. [88] proposed leveraging automated on-demand shuttles to resolve the first-mile service challenge in downtown Columbus, Ohio, further emphasizing the potential of innovative shuttle systems in enhancing transit accessibility.
The latent demand may consist of both induced demand and that from the modal shift. On one hand, our study suggests that those already accustomed to using transit are more adaptable to the system being enhanced by the first-mile shuttle service. The fact that a higher household income does not significantly affect the change in transit trips suggests that the decision to use transit may be less about financial capability and more about factors such as convenience. On the other hand, the latent demand may also stem from the reliance on transit for commuting among the working population. This finding is pivotal in supporting the idea that a substantial portion of the increase in transit use following the introduction of first-mile shuttle services is likely to result from a modal shift from automobiles to buses rather than being purely an induced demand for new travel.
Households with at least one automobile show an inclination toward transit, reflecting a desire to avoid negative experiences such as parking hassles and getting stuck in traffic. This inclination indicates a potential shift in modal preference, where individuals with access to private vehicles choose public transit as a more convenient and less stressful alternative. In essence, while the improvement in first-mile accessibility is likely to induce some new travel demand, a major impact of this enhancement is the redirection of existing travel patterns. People who would typically drive are now provided with a compelling reason to switch to public transit. Such a modal shift is particularly significant, as it suggests a reduction in automobile dependency, aligning with broader goals of reducing traffic congestion and emissions in urban areas.

4.2. BRT vs. Regular Bus

4.2.1. Much Higher Demand for BRT

Using the hypothetical shuttle service to overcome first-mile issues in public transportation was found to be more effective in the case of the BRT system than with the regular bus system. Several key factors lead to the difference. BRT systems often feature dedicated lanes to reduce delays caused by mixed traffic, predictable schedules, and short waiting times. They aim for efficiency and comfort, targeting daily commuters who seek faster services. When this efficiency is combined with improved first-mile accessibility through shuttle services, the overall attractiveness of BRT increases significantly. This is particularly true for commuters seeking reliability and time-saving options in their daily commute. Commuters are more likely to use BRT if they can easily access stations, especially in sprawling urban areas where the distance to transit stops can be a major barrier. The service can effectively reduce the total travel time and make BRT a more viable option for daily commuting than regular buses.
The introduction of shuttle services for regular buses is beneficial, but its impact is often compromised by factors such as the density of the bus network, the frequency of service, and the specific urban layout. While regular buses cover broader areas and provide an extensive reach, this extensive coverage can sometimes lead to compromised speed and efficiency. In urban areas with distinctive major corridors and linear urban settlements, such as El Paso, Texas, the convenience offered by shuttle-serviced BRT systems is particularly evident. These areas often feature clear paths to key destinations like city centers and workplaces where integrating shuttle services with BRT can significantly streamline the commute.
One notable finding from this study is that residents who are already transit users would be more likely to increase their total transit trips and BRT trips for all purposes but not regular bus trips in total or for any specific purpose, given the hypothetical shuttle service for the first mile of transit use. This trend is likely attributed to the more pronounced first-mile problem for BRT trips, given that BRT stops are generally more spaced out and further from residents’ homes than regular bus stops. Considering BRT’s other positive attributes, such as faster service and increased ridership, transit agencies might find it beneficial to prioritize first-mile interventions for BRT services, if applicable. On the other hand, it also implies that more multi-faceted interventions beyond the first-mile service will be needed to encourage non-transit users to take on transit use as a regular travel mode.

4.2.2. Feeling Safe Matters More for the Regular Bus Than for BRT

Feeling safe while riding the bus significantly boosted the likelihood of increased transit use in our hypothetical scenario. This effect was more notable for those using the regular bus. This might be due to BRT systems already having safety features as perceived by passengers. First, from the physical design perspective, BRT systems often have well-lit, visible stations, whereas regular bus stops might be less visible and not as well-lit, influencing the perception of safety; BRT stations are often more structured, resembling train stations with raised platforms, shelter, and sometimes, fare pre-collection, enhancing the sense of security compared to open and less structured regular bus stops [89]. Second, from the operational perspective, BRT systems typically offer more frequent services than regular bus lines, reducing wait times and the period passengers spend at stations or stops, potentially decreasing exposure to safety risks; regular buses might experience more crowding than BRTs due to the less frequent service or smaller capacity, impacting passengers’ comfort and perception of safety; BRT stations and vehicles often have a higher level of surveillance and security measures, such as cameras and security personnel, compared to regular bus services.
Our findings are consistent with previous work that indicated that one’s subjective well-being may vary by comparing the regular bus service with various types of BRT systems with certain key characteristics [90]. More research is needed to identify the influence of safety perceptions by transit type on projected transit use.

4.2.3. Shuttle Catchment Area for BRT and Regular Bus

This study suggests that BRT has a broader effective catchment area. The regular bus system shows a notable decline in usage beyond a 0.5-mile threshold, while for BRT, this threshold extends to 1 mile. This finding has important implications for optimizing the deployment of shuttle services. To maximize the effectiveness and efficiency of these shuttle services, a tailored approach should be adopted based on the type of transit service they are complementing. The broader catchment area for BRT reflects its perceived value as a faster, more reliable transit option, encouraging users to travel slightly further to access these services. Given the 1-mile effective catchment area of BRT, shuttle services should prioritize areas that are within 1 mile of BRT stops. This approach ensures that the shuttle service effectively extends the reach of the BRT, making it accessible to a larger population. Such a strategy can significantly enhance the appeal and utility of BRT. For regular bus services, the shuttle service should focus on areas within a 0.5-mile radius of bus stops. Beyond this distance, there is a noticeable drop in regular bus usage. The distinct catchment areas for BRT and regular buses necessitate an integrated approach to transit planning. This involves coordinating shuttle services with existing transit routes and schedules to create a seamless system. For example, shuttle services could cover residential areas located within a 1-mile radius of BRT stations; for regular buses, shuttle services could focus on the 0.5-mile radius and provide a more frequent service. A real-time tracking system should be integrated to allow passengers to view shuttle and bus schedules simultaneously in the same transit app [91,92].

4.3. Various Socio-Demographic Factors Matter for Transit Trip Making

In addition, results from different models showed an overall pattern that residents who were current transit users, of Hispanic origin, employed for wages, or who felt safe about riding buses would be more likely to increase their transit use with the free shuttle service between their homes and transit stops. Two theories, including the theory of planned behavior and the transtheoretical model with a stage of change perspective, could offer some insight into this pattern. Low and decreasing rates of transit use can be traced back to various reasons/barriers in multiple domains [31,32], and the first-mile problem is one such barrier [35,36].
Based on the theory of planned behavior [93], the main driver for behavior, the intention, is affected by personal attitude toward the behavior, the subjective norm, as well as perceived behavior control [94]. In the case of transit use, those who were already transit users, employed for wages, of Hispanic origin, or who felt safe about riding buses likely had a stronger intention at the baseline, and the hypothetical free shuttle services between homes and transit stops were, therefore, more effective in improving their perceived behavioral control, thus leading to more increases in their intention, and eventually transit use. For individuals of Hispanic origin, cultural and community factors might play a significant role. They might have stronger community-oriented values and practices, which include using public transit as a common mode of transportation within their communities. Additionally, economic factors, such as lower car ownership rates in some communities with a high proportion of individuals identifying as Hispanic, might make public transit more necessary and, thus, a more accepted mode of travel. Employment status, particularly being employed for wages, suggests a structured daily routine, often necessitating regular commuting. For wage-employed individuals, public transit, augmented by first-mile services, can offer a cost-effective and reliable alternative to driving, especially in urban areas where parking is expensive and traffic congestion is common. The feeling of safety while using transit is another crucial factor. Individuals who perceived public transit as safe were more likely to use it. Safety concerns can be particularly prominent among regular bus users due to factors such as crime rates, the condition of buses and transit stations, and the level of crowdedness. Enhancements in transit services, including the integration of shuttle services, can address some of these safety concerns by providing well-maintained, reliable, and less crowded transit options.
On the other hand, the transtheoretical model and corresponding stages in the order of precontemplation, contemplation, preparation, action, and maintenance could help to interpret this pattern of findings [95]. Those who were current transit users, of Hispanic origin, employed for wages, or who felt safe about riding buses were likely in the later stages of this continuum and, therefore, more likely to be affected by the single intervention of the first-mile service. Furthermore, those owning an automobile were more likely to increase their transit use with the first-mile service, likely because those without automobiles had to rely on transit for daily trips already.

4.4. Family Errands

Family errands—including grocery shopping, discretionary purchases, childcare transportation, and mailing services—are routine tasks necessary for household maintenance. Aligning with past research [96], our analysis indicated residents with children were more likely to increase their use of both BRT and regular buses for errands when free first-mile shuttle services were introduced. As previous studies have shown, individuals prefer to choose nearby, familiar locations for these errands since there is little differentiation between options [97,98]. Closer destinations enable trip time predictability, which mitigates the perception of lengthy and cramped travel on the bus to fulfill needs. Consequently, parents can readily plan bus trips in advance rather than requiring flexible mobility with cars. Thus, they may be more willing to navigate bus schedules for these short trips. For those traveling with children and bulky gear (e.g., strollers), the seating and storage capacity buses offer also provide advantages over modes like biking. Moreover, past studies highlight public transit’s capacity to facilitate family bonding and activity [99]. Given various benefits ranging from affordability to accessibility, these incentives expand bus ridership’s appeal for parents’ non-work travels.

4.5. Limitations

We acknowledge the following limitations of our study. First, we had to exclude a substantial portion of the sample where missing values were present. This exclusion could potentially lead to biases in our results, as the remaining sample may not accurately represent the full spectrum of public transit users or the general population. The excluded responses might include additional insights into transit users’ preferences and behavior choices. Therefore, while our results offer valuable perspectives on the first-mile problem, they must be interpreted with caution, considering the impact of the missing data on the findings. Second, while a stated preference survey provides a useful glimpse into behavioral intentions regarding the use of public transit and shuttle services, it is important to note that these hypothetical responses may not reflect true behaviors. There might be a discrepancy between what people say they would do and what they would actually do in the real world due to social desirability bias among other factors [100,101]. Third, to simplify our study design, we exclusively focused on the first-mile problem. While this is a critical aspect of enhancing the transit system, it is only part of a more comprehensive solution, which also considers the “last mile”—the distance between the transit stop and the final destination. Addressing both first-mile and last-mile challenges is a crucial approach to enhancing the transit system holistically. Fourth, our survey was conducted before the COVID-19 pandemic. While we believe this might give a better approximation of transit attitudes and behaviors under pre-COVID-19-pandemic circumstances, we recommend additional studies be conducted in the post-COVID-19-pandemic era. Finally, our study and implications are US-centric, albeit El Paso, as a US-Mexico border city does provide some additional insight in this regard. We recommend similar studies from a more global perspective to understand the worldwide sustainability impacts of different transit options.

5. Conclusions

In conclusion, our study reveals the significant potential in addressing public transit’s first-mile problem. The incorporation of a shuttle service to bridge the gap between homes and the nearest transit stops could result in a remarkable increase in the utilization of both BRT and regular bus services, with usage surging by 406~1736% for BRT and 123~658% for regular buses, across various trip purposes. Our results uncover a strong latent demand for efficient and accessible public transit systems, a potentially compelling alternative to private automobiles as a major contributor to congestion, pollution, and greenhouse gas emissions.
It is notable that the increase is more pronounced for BRT (an overall increase of 1179%) than for regular buses (an overall increase of 241%). The varying catchment areas for BRT (extending to 1 mile) and regular buses (notable decline beyond 0.5 mile) suggest that the shuttle service deployment should explore tailored solutions in nuanced urban contexts. Instead of adopting a one-size-fits-all approach, it is critical to consider factors such as population density, land use, and existing infrastructure.
In addition, our research provides the following insights for policymakers to rethink and reshape public transit systems. First, the study highlights the critical role of first-mile shuttle services in boosting public transit use. The large increase in transit utilization, particularly for BRT systems, underscores the need for targeted policy interventions. Cities and transit agencies should consider implementing free shuttle services (or similar first-mile services) as a strategic initiative to enhance the overall attractiveness and use of public transit. Such services break the accessibility barrier and add the convenience factor, which is an often overlooked aspect of transit planning. Second, our results suggest that decisions to use transit are driven more by factors such as convenience rather than financial necessity. This insight is crucial for transit authorities, as it points towards a broader demographic reach than traditionally assumed. Third, the safety perception in transit use was more pronounced for regular bus users, which signals the need for enhancing safety. Transit authorities should focus not only on the operational aspects but also on the public transit riding experience, including safety and comfort, to encourage wider adoption. Fourth, the increased likelihood of transit use among households with children when first-mile services are available suggests features accommodating the unique needs of families, such as space for strollers and a comfortable environment for children.
Despite the aforementioned limitations, the study, based on our stated preference survey with a novel first-mile intervention, contributes significantly to the discussions on sustainable urban mobility, emphasizing the critical role of addressing accessibility challenges to enhance public transit usage and more connected communities. Our focus on the context of areas with a high proportion of individuals identifying as Hispanic allows us to offer insights into the transportation needs of this population. Our work highlights the distinct barriers to accessing efficient public transportation that this population often faces. As travel behaviors and preferences evolve, it is imperative that future research utilizes our results as a benchmark. Future efforts should be directed toward an in-depth examination of how integrative mobility solutions involving public transit can affect individual travel patterns. Forthcoming studies and policy formulations may consider using the natural-experiment research approach to evaluating such solutions.

Author Contributions

Conceptualization, W.L.; methodology, W.L.; formal analysis, W.L.; investigation, W.L., C.L., J.B., H.L. and M.G.O.; data curation, W.L., C.L., S.D.T.J., S.Z., J.B., H.L. and M.G.O.; project administration, W.L., C.L., S.D.T.J., S.Z. and M.G.O.; funding acquisition, W.L., C.L., S.D.T.J., S.L., X.Z. and M.G.O. All authors have contributed to original draft preparation, review, and editing, and have read and agreed to the published version of the manuscript.

Funding

This research was funded by the National Institutes of Health (Award#: 1R01CA228921–01).

Institutional Review Board Statement

All procedures involving human participants in this study were conducted ethically, adhering to the standards reviewed and approved by the Institutional Review Board (IRB#: 2017-0804D) at Texas A&M University.

Informed Consent Statement

Informed consent was obtained from all subjects involved in the study.

Data Availability Statement

Data supporting reported results are available upon request to interested researchers.

Conflicts of Interest

The authors declare no conflict of interest.

Appendix A

Figure A1. Data Process Work.
Sustainability 16 01783 g0a1

References

  1. Miller, P.; de Barros, A.G.; Kattan, L.; Wirasinghe, S.C. Public transportation and sustainability: A review. KSCE J. Civ. Eng. 2016, 20, 1076–1083. [Google Scholar] [CrossRef]
  2. Brown, B.B.; Werner, C.M. Before and After a New Light Rail Stop: Resident Attitudes, Travel Behavior, and Obesity. J. Am. Plan. Assoc. 2008, 75, 5–12. [Google Scholar] [CrossRef]
  3. Li, W.; Zhong, H.; Boarnet, M.G. Effects of new transit lines on commuting: Evidence from restricted-use Census Bureau microdata. Appl. Geogr. 2024, 164, 103202. [Google Scholar] [CrossRef]
  4. Beaudoin, J.; Farzin, Y.H.; Lin Lawell, C.Y.C. Public transit investment and sustainable transportation: A review of studies of transit’s impact on traffic congestion and air quality. Sustain. Transp. 2015, 52, 15–22. [Google Scholar] [CrossRef]
  5. Anderson, M.L. Subways, strikes, and slowdowns: The impacts of public transit on traffic congestion. Am. Econ. Rev. 2014, 104, 2763–2796. [Google Scholar] [CrossRef]
  6. Winston, C.; Maheshri, V. On the social desirability of urban rail transit systems. J. Urban Econ. 2007, 62, 362–382. [Google Scholar] [CrossRef]
  7. Nguyen-Phuoc, D.Q.; Young, W.; Currie, G.; De Gruyter, C. Traffic congestion relief associated with public transport: State-of-the-art. Public Transp. 2020, 12, 455–481. [Google Scholar] [CrossRef]
  8. Bikis, A.; Pandey, D. Air Quality at Public Transportation Stations/Stops: Contribution of Light Rail Transit to Reduce Air Pollution. Aerosol Sci. Eng. 2022, 6, 1–16. [Google Scholar] [CrossRef]
  9. Lalive, R.; Luechinger, S.; Schmutzler, A. Does Supporting Passenger Railways Reduce Road Traffic Externalities? Center for Economic and Policy Research: Washington, DC, USA, 2013. [Google Scholar]
  10. American Public Transportation Association. 2022 Public Transportation Fact Book; American Public Transportation Association: Washington, DC, USA, 2022. [Google Scholar]
  11. Bastiaanssen, J.; Johnson, D.; Lucas, K. Does better job accessibility help people gain employment? The role of public transport in Great Britain. Urban Stud. 2022, 59, 301–322. [Google Scholar] [CrossRef]
  12. Boarnet, M.G.; Giuliano, G.; Hou, Y.; Shin, E.J. First/last mile transit access as an equity planning issue. Transp. Res. Part A Policy Pract. 2017, 103, 296–310. [Google Scholar] [CrossRef]
  13. Foth, N.; Manaugh, K.; El-Geneidy, A.M. Towards equitable transit: Examining transit accessibility and social need in Toronto, Canada, 1996–2006. J. Transp. Geogr. 2013, 29, 1–10. [Google Scholar] [CrossRef]
  14. Erica, R.; Emilie, C.; Frank, J.v.L.; Mauricio, A. Public transport policy, social engagement and mental health in older age: A quasi-experimental evaluation of free bus passes in England. J. Epidemiol. Community Health 2018, 72, 361. [Google Scholar] [CrossRef]
  15. Hybel, J.; Mulalic, I. Transportation and quality of life: Evidence from Denmark. Transp. Res. Part A Policy Pract. 2022, 157, 107–125. [Google Scholar] [CrossRef]
  16. Li, W.; Lee, C.; Zhong, S.; Xu, M.; Towne Jr, S.D.; Zhu, X.; Lee, S.; Wang, S.; Aldrete, R.; Garcia, E.B. Examining the impacts of public transit on healthy aging through a natural experiment: Study protocols and lessons learned from the Active El Paso project. Front. Public Health 2023, 11, 1132190. [Google Scholar] [CrossRef]
  17. Zhang, B.; Li, W.; Lownes, N.; Zhang, C. Estimating the Impacts of Proximity to Public Transportation on Residential Property Values: An Empirical Analysis for Hartford and Stamford Areas, Connecticut. ISPRS Int. J. Geo-Inf. 2021, 10, 44. [Google Scholar] [CrossRef]
  18. Siripanich, A.; Rashidi, T.H.; Moylan, E. Interaction of Public Transport Accessibility and Residential Property Values Using Smart Card Data. Sustainability 2019, 11, 2709. [Google Scholar] [CrossRef]
  19. Baum-Snow, N.; Kahn, M.E. The effects of new public projects to expand urban rail transit. J. Public Econ. 2000, 77, 241–263. [Google Scholar] [CrossRef]
  20. United States Census Bureau. United States Census Bureau QuickFacts; United States Census Bureau: Suitland-Silver Hill, MD, USA, 2021. [Google Scholar]
  21. American Public Transportation Association. 2021 Public Transportation Fact Book. Available online: https://www.apta.com/wp-content/uploads/APTA-2021-Fact-Book.pdf (accessed on 20 December 2023).
  22. Abdullah, M.; Ali, N.; Dias, C.; Campisi, T.; Javid, M.A. Exploring the Traveler’s Intentions to Use Public Transport during the COVID-19 Pandemic While Complying with Precautionary Measures. Appl. Sci. 2021, 11, 3630. [Google Scholar] [CrossRef]
  23. Bian, J.; Zhong, S.; Towne, S.D.; Lee, C.; Ory, M.G.; Li, W. Perceived risks of transit use during COVID-19: Correlates and strategies from a case study in El Paso, Texas. J. Transp. Health 2022, 27, 101491. [Google Scholar] [CrossRef]
  24. Federal Transit Administration. The National Transit Database; Federal Transit Administration: Washington, DC, USA, 2023. [Google Scholar]
  25. Ahangari, S.; Chavis, C.; Jeihani, M. Public transit ridership analysis during the COVID-19 pandemic. medRxiv 2020. [Google Scholar] [CrossRef]
  26. Washington Metropolitan Area Transit Authority. Metro and COVID-19: Steps We’ve Taken; Washington Metropolitan Area Transit Authority: Washington, DC, USA, 2020. [Google Scholar]
  27. Gao, J.; Bernardes, S.D.; Bian, Z.; Ozbay, K.; Iyer, S. Initial impacts of COVID-19 on transportation systems: A case study of the US epicenter, the New York metropolitan area. arXiv 2020, arXiv:2010.01168. [Google Scholar]
  28. Qi, Y.; Liu, J.; Tao, T.; Zhao, Q. Impacts of COVID-19 on public transit ridership. Int. J. Transp. Sci. Technol. 2023, 12, 34–45. [Google Scholar] [CrossRef]
  29. Basu, R.; Ferreira, J. Sustainable mobility in auto-dominated Metro Boston: Challenges and opportunities post-COVID-19. Transp. Policy 2021, 103, 197–210. [Google Scholar] [CrossRef]
  30. Tirachini, A.; Cats, O. COVID-19 and Public Transportation: Current Assessment, Prospects, and Research Needs. J. Public Transp. 2020, 22, 1–21. [Google Scholar] [CrossRef]
  31. Erhardt, G.D.; Hoque, J.M.; Goyal, V.; Berrebi, S.; Brakewood, C.; Watkins, K.E. Why has public transit ridership declined in the United States? Transp. Res. Part A Policy Pract. 2022, 161, 68–87. [Google Scholar] [CrossRef]
  32. Lee, Y.; Lee, B. What’s eating public transit in the United States? Reasons for declining transit ridership in the 2010s. Transp. Res. Part A Policy Pract. 2022, 157, 126–143. [Google Scholar] [CrossRef]
  33. Olsson, L.E.; Friman, M.; Lättman, K. Accessibility barriers and perceived accessibility: Implications for public transport. Urban Sci. 2021, 5, 63. [Google Scholar] [CrossRef]
  34. Tiznado-Aitken, I.; Lucas, K.; Muñoz, J.C.; Hurtubia, R. Understanding accessibility through public transport users’ experiences: A mixed methods approach. J. Transp. Geogr. 2020, 88, 102857. [Google Scholar] [CrossRef]
  35. Kåresdotter, E.; Page, J.; Mörtberg, U.; Näsström, H.; Kalantari, Z. First mile/last mile problems in smart and sustainable cities: A case study in Stockholm County. J. Urban Technol. 2022, 29, 115–137. [Google Scholar] [CrossRef]
  36. Lesh, M.C. Innovative concepts in first-last mile connections to public transportation. In Urban Public Transportation Systems 2013; ASCE: Reston, VA, USA, 2013; pp. 63–74. [Google Scholar]
  37. Chen, S.; Wang, H.; Meng, Q. Solving the first-mile ridesharing problem using autonomous vehicles. Comput.-Aided Civ. Infrastruct. Eng. 2020, 35, 45–60. [Google Scholar] [CrossRef]
  38. Mohiuddin, H. Planning for the first and last mile: A review of practices at selected transit agencies in the United States. Sustainability 2021, 13, 2222. [Google Scholar] [CrossRef]
  39. Shen, Y.; Zhang, H.; Zhao, J. Integrating shared autonomous vehicle in public transportation system: A supply-side simulation of the first-mile service in Singapore. Transp. Res. Part A Policy Pract. 2018, 113, 125–136. [Google Scholar] [CrossRef]
  40. Zuo, T.; Wei, H.; Chen, N.; Zhang, C. First-and-last mile solution via bicycling to improving transit accessibility and advancing transportation equity. Cities 2020, 99, 102614. [Google Scholar] [CrossRef]
  41. Xiao, G.; Chen, L.; Chen, X.; Jiang, C.; Ni, A.; Zhang, C.; Zong, F. A hybrid visualization model for knowledge mapping: Scientometrics, SAOM, and SAO. IEEE Trans. Intell. Transp. Syst. 2023. early access. [Google Scholar] [CrossRef]
  42. Chen, X.; Wang, Z.; Hua, Q.; Shang, W.-L.; Luo, Q.; Yu, K. AI-empowered speed extraction via port-like videos for vehicular trajectory analysis. IEEE Trans. Intell. Transp. Syst. 2022, 24, 4541–4552. [Google Scholar] [CrossRef]
  43. Usman, M.; Li, W.; Bian, J.; Chen, A.; Ye, X.; Li, X.; Dadashova, B.; Lee, C.; Lee, K.; Rathinam, S. Small and rural towns’ perception of autonomous vehicles: Insights from a survey in Texas. Transp. Plan. Technol. 2023, 47, 200–225. [Google Scholar] [CrossRef]
  44. Zhong, H.; Li, W.; Boarnet, M.G. A two-dimensional propensity score matching method for longitudinal quasi-experimental studies: A focus on travel behavior and the built environment. Environ. Plan. B Urban Anal. City Sci. 2021, 48, 2110–2122. [Google Scholar] [CrossRef]
  45. Liu, C.; Erdogan, S.; Ma, T.; Ducca, F.W. How to increase rail ridership in Maryland: Direct ridership models for policy guidance. J. Urban Plan. Dev. 2016, 142, 04016017. [Google Scholar] [CrossRef]
  46. Salter, B.; Alexander, S. Getting There: The Effect of First and Last Mile Infrastructure and Services on Rail Ridership. Transp. Res. Rec. 2022, 2676, 402–412. [Google Scholar] [CrossRef]
  47. Zuo, T.; Wei, H.; Chen, N. Promote transit via hardening first-and-last-mile accessibility: Learned from modeling commuters’ transit use. Transp. Res. Part D Transp. Environ. 2020, 86, 102446. [Google Scholar] [CrossRef]
  48. Ma, T.; Liu, C.; Erdoğan, S. Bicycle sharing and public transit: Does capital bikeshare affect metrorail ridership in Washington, DC? Transp. Res. Rec. 2015, 2534, 1–9. [Google Scholar] [CrossRef]
  49. Ma, T.; Knaap, G.-J. Estimating the impacts of capital bikeshare on metrorail ridership in the Washington metropolitan area. Transp. Res. Rec. 2019, 2673, 371–379. [Google Scholar] [CrossRef]
  50. American Public Transportation Association. First Last/Mile Solutions. Available online: https://www.apta.com/research-technical-resources/mobility-innovation-hub/first-last-mile-solutions/ (accessed on 20 December 2023).
  51. Marshall, A. Transit Agencies Turn to Uber for the Last Mile. WIRED 2019-06-29 2019. Available online: https://www.wired.com/story/transit-agencies-turn-uber-last-mile/ (accessed on 20 December 2023).
  52. Bay Area Rapid Transit. Carpool to Dublin/Pleasanton BART with Scoop and Get Guaranteed Parking | Bay Area Rapid Transit. Available online: https://www.bart.gov/news/articles/2017/news20170117 (accessed on 20 December 2023).
  53. Said, C. On-Demand Shuttles to Serve Apple Hometown’S ‘Transit Desert’. San Francisco Chronicle 2019-10-07 2019. Available online: https://www.sfchronicle.com/business/article/On-demand-shuttles-to-serve-Apple-hometown-s-14494083.php (accessed on 20 December 2023).
  54. Hymon, S. Metro Launches Partnership with Via for On-Demand Rides at Three Stations. LA Metro 2019-01-28 2019. Available online: https://thesource.metro.net/2019/01/28/metro-launches-partnership-with-via-for-on-demand-rides-at-three-stations/ (accessed on 20 December 2023).
  55. Dilks, S.-J. King County Metro Chooses via as TransitTech Provider for Greater Seattle’s Future of Interconnected On-Demand Public Transit. Available online: https://ridewithvia.com/news/king-county-metro-chooses-via-as-transittech-provider-for-greater-seattles-future-of-interconnected-on-demand-public-transit (accessed on 20 December 2023).
  56. King, S. New Cap Metro Pickup Service Offers Rides For Austin Residents Who Aren’t On Bus Lines. Available online: https://www.kut.org/transportation/2019-08-20/new-cap-metro-pickup-service-offers-rides-for-austin-residents-who-arent-on-bus-lines (accessed on 20 December 2023).
  57. Musulin, K. Uber Enters First SaaS Partnership in Marin County, CA. Available online: https://www.smartcitiesdive.com/news/uber-enters-first-saas-partnership-in-marin-county-ca/580102/ (accessed on 20 December 2023).
  58. MassTransitMag. New DART GoLink Zones Begin Service. Available online: https://www.masstransitmag.com/alt-mobility/shared-mobility/car-sharing/press-release/21249097/dallas-area-rapid-transit-dart-new-dart-golink-zones-begin-service (accessed on 20 December 2023).
  59. RideKC. IRIS: On-Demand Transit in KCMO | Rider Guide | RideKC. Available online: https://ridekc.org/rider-guide/iris (accessed on 20 December 2023).
  60. US Census Bureau. 2014–2018 ACS 5-Year Estimates. Available online: https://www.census.gov/programs-surveys/acs/technical-documentation/table-and-geography-changes/2018/5-year.html (accessed on 1 December 2023).
  61. Johnston, R.J.; Boyle, K.J.; Adamowicz, W.; Bennett, J.; Brouwer, R.; Cameron, T.A.; Hanemann, W.M.; Hanley, N.; Ryan, M.; Scarpa, R. Contemporary guidance for stated preference studies. J. Assoc. Environ. Resour. Econ. 2017, 4, 319–405. [Google Scholar] [CrossRef]
  62. Davidson, J. Forecasting traffic on STOL. J. Oper. Res. Soc. 1973, 24, 561–569. [Google Scholar] [CrossRef]
  63. Louviere, J.; Beavers, L.; Norman, K.; Stetzer, F. Theory, Methodology, and Findings in Mode Choice Behavior; National Academy of Sciences: Washington, DC, USA, 1973. [Google Scholar]
  64. Hensher, D.A. Stated preference analysis of travel choices: The state of practice. Transportation 1994, 21, 107–133. [Google Scholar] [CrossRef]
  65. Kroes, E.P.; Sheldon, R.J. Stated preference methods: An introduction. J. Transp. Econ. Policy 1988, 22, 11–25. [Google Scholar]
  66. DeShazo, J.; Fermo, G. Designing choice sets for stated preference methods: The effects of complexity on choice consistency. J. Environ. Econ. Manag. 2002, 44, 123–143. [Google Scholar] [CrossRef]
  67. Collia, D.V.; Sharp, J.; Giesbrecht, L. The 2001 National Household Travel Survey: A look into the travel patterns of older Americans. J. Saf. Res. 2003, 34, 461–470. [Google Scholar] [CrossRef]
  68. Potoglou, D.; Kanaroglou, P.S. Household demand and willingness to pay for clean vehicles. Transp. Res. Part D Transp. Environ. 2007, 12, 264–274. [Google Scholar] [CrossRef]
  69. Spears, S.; Houston, D.; Boarnet, M.G. Illuminating the unseen in transit use: A framework for examining the effect of attitudes and perceptions on travel behavior. Transp. Res. Part A Policy Pract. 2013, 58, 40–53. [Google Scholar] [CrossRef]
  70. Mattson, J.W. Travel Behavior and Mobility of Transportation-Disadvantaged Populations: Evidence from the National Household Travel Survey; Upper Great Plains Transportation Institute: Fargo, ND, USA, 2012. [Google Scholar]
  71. Pinjari, A.R.; Pendyala, R.M.; Bhat, C.R.; Waddell, P.A. Modeling the choice continuum: An integrated model of residential location, auto ownership, bicycle ownership, and commute tour mode choice decisions. Transportation 2011, 38, 933–958. [Google Scholar] [CrossRef]
  72. Li, W.; Rosenheim, N.P.; Dong, H.; Boarnet, M.; Zhong, H. Rail Transit and Economic Growth: Documenting Evidences from a Panel Data Analysis of Eighteen Metropolitan Areas in the United States; National Academy of Sciences: Washington, DC, USA, 2017. [Google Scholar]
  73. Bai, L.; Sze, N.; Liu, P.; Haggart, A.G. Effect of environmental awareness on electric bicycle users’ mode choices. Transp. Res. Part D Transp. Environ. 2020, 82, 102320. [Google Scholar] [CrossRef]
  74. Rosenbloom, S. Transit Markets of the Future: The Challenge of Change; Transportation Research Board: Washington, DC, USA, 1998; Volume 28. [Google Scholar]
  75. Carr, L.J.; Dunsiger, S.I.; Marcus, B.H. Walk score™ as a global estimate of neighborhood walkability. Am. J. Prev. Med. 2010, 39, 460–463. [Google Scholar] [CrossRef]
  76. Hall, C.M.; Ram, Y. Walk score® and its potential contribution to the study of active transport and walkability: A critical and systematic review. Transp. Res. Part D Transp. Environ. 2018, 61, 310–324. [Google Scholar] [CrossRef]
  77. Winters, M.; Teschke, K.; Brauer, M.; Fuller, D. Bike Score®: Associations between urban bikeability and cycling behavior in 24 cities. Int. J. Behav. Nutr. Phys. Act. 2016, 13, 18. [Google Scholar] [CrossRef] [PubMed]
  78. Duncan, D.T.; Aldstadt, J.; Whalen, J.; Melly, S.J. Validation of Walk Scores and Transit Scores for estimating neighborhood walkability and transit availability: A small-area analysis. GeoJournal 2013, 78, 407–416. [Google Scholar] [CrossRef]
  79. Li, W.; Joh, K. Exploring the synergistic economic benefit of enhancing neighbourhood bikeability and public transit accessibility based on real estate sale transactions. Urban Stud. 2017, 54, 3480–3499. [Google Scholar] [CrossRef]
  80. Kuby, M.; Barranda, A.; Upchurch, C. Factors influencing light-rail station boardings in the United States. Transp. Res. Part A Policy Pract. 2004, 38, 223–247. [Google Scholar] [CrossRef]
  81. Gutiérrez, J.; Cardozo, O.D.; García-Palomares, J.C. Transit ridership forecasting at station level: An approach based on distance-decay weighted regression. J. Transp. Geogr. 2011, 19, 1081–1092. [Google Scholar] [CrossRef]
  82. Nagel, C.L.; Carlson, N.E.; Bosworth, M.; Michael, Y.L. The relation between neighborhood built environment and walking activity among older adults. Am. J. Epidemiol. 2008, 168, 461–468. [Google Scholar] [CrossRef]
  83. Hess, P.M.; Moudon, A.V.; Matlick, J.M. Pedestrian safety and transit corridors. J. Public Transp. 2004, 7, 73–93. [Google Scholar] [CrossRef]
  84. National Weather Service. El Paso’s 100 Degree Days FAQ. Available online: https://www.weather.gov/epz/elpaso_100_degree_page#:~:text=From%201887%20through%20December%2031,or%20Triple%20Digits%20Per%20Year (accessed on 20 December 2023).
  85. Alawadi, K.; Hernandez Striedinger, V.; Maghelal, P.; Khanal, A. Assessing walkability in hot arid regions: The case of downtown Abu Dhabi. Urban Des. Int. 2021, 27, 211–231. [Google Scholar] [CrossRef]
  86. Park, K.; Farb, A.; Chen, S. First-/last-mile experience matters: The influence of the built environment on satisfaction and loyalty among public transit riders. Transp. Policy 2021, 112, 32–42. [Google Scholar] [CrossRef]
  87. Xie, C.; Gong, H.; Wang, F. A solution for the last mile problem of the Beijing rapid transit network: Local shuttle bus system. In Proceedings of the 2010 18th International Conference on Geoinformatics, Beijing, China, 18–20 June 2010; pp. 1–6. [Google Scholar]
  88. Gelbal, S.Y.; Aksun-Guvenc, B.; Guvenc, L. Smartshuttle: Model based design and evaluation of automated on-demand shuttles for solving the first-mile and last-mile problem in a smart city. arXiv 2020, arXiv:2012.12431. [Google Scholar]
  89. Jarzab, J.T.; Lightbody, J.; Maeda, E. Characteristics of bus rapid transit projects: An overview. J. Public Transp. 2002, 5, 31–46. [Google Scholar] [CrossRef]
  90. Navarrete-Hernandez, P.; Zegras, P.C. Mind the perception gap: The impact of bus rapid transit infrastructure on travelers’ perceptions of affective subjective well-being. Transp. Res. Part A Policy Pract. 2023, 172, 103670. [Google Scholar] [CrossRef]
  91. Bian, J.; Li, W.; Lee, C. Current practices and emerging trends of transit apps for fixed-route bus services in the US. J. Public Transp. 2023, 25, 100052. [Google Scholar] [CrossRef]
  92. Bian, J.; Li, W.; Zhong, S.; Lee, C.; Foster, M.; Ye, X. The end-user benefits of smartphone transit apps: A systematic literature review. Transp. Rev. 2022, 42, 82–101. [Google Scholar] [CrossRef]
  93. Ajzen, I. The theory of planned behavior. In Handbook of Theories of Social Psychology; Lange, P., Kruglanski, A., Higgins, E.T., Eds.; Sage: London, UK, 2012; pp. 438–459. [Google Scholar]
  94. Steinmetz, H.; Knappstein, M.; Ajzen, I.; Schmidt, P.; Kabst, R. How effective are behavior change interventions based on the theory of planned behavior? Z. Psychol. 2016, 224, 216–233. [Google Scholar] [CrossRef]
  95. Friman, M.; Huck, J.; Olsson, L.E. Transtheoretical model of change during travel behavior interventions: An integrative review. Int. J. Environ. Res. Public Health 2017, 14, 581. [Google Scholar] [CrossRef]
  96. Hamed, M.M.; Olaywah, H.H. Travel-related decisions by bus, servis taxi, and private car commuters in the city of Amman, Jordan. Cities 2000, 17, 63–71. [Google Scholar] [CrossRef]
  97. Anto, E.O.; Owiredu, W.; Adua, E.; Obirikorang, C.; Fondjo, L.A.; Annani-Akollor, M.E.; Acheampong, E.; Asamoah, E.A.; Roberts, P.; Wang, W. Prevalence and lifestyle-related risk factors of obesity and unrecognized hypertension among bus drivers in Ghana. Heliyon 2020, 6, e03147. [Google Scholar] [CrossRef] [PubMed]
  98. Song, Y.; Lee, S.; Park, A.H.; Lee, C. COVID-19 impacts on non-work travel patterns: A place-based investigation using smartphone mobility data. Environ. Plan. B Urban Anal. City Sci. 2023, 50, 642–659. [Google Scholar] [CrossRef]
  99. Grengs, J. The abandoned social goals of public transit in the neoliberal city of the USA. City 2005, 9, 51–66. [Google Scholar] [CrossRef]
  100. De Corte, K.; Cairns, J.; Grieve, R. Stated versus revealed preferences: An approach to reduce bias. Health Econ. 2021, 30, 1095–1123. [Google Scholar] [CrossRef]
  101. Clark, M.D.; Determann, D.; Petrou, S.; Moro, D.; de Bekker-Grob, E.W. Discrete choice experiments in health economics: A review of the literature. Pharmacoeconomics 2014, 32, 883–902. [Google Scholar] [CrossRef]
Figure 1. Stated preference experiment. Note: Our team asked participants to answer questions in two hypothetical scenarios. This study focuses on one scenario (Question 20) only.
Sustainability 16 01783 g001
Table 1. Recent pilot projects addressing the first-mile problem.
Year of LaunchCity or Region ServedMain Partners InvolvedDescription of Service
2015Salem, ORCherriots, Salem-Keizer TransitShuttles connect riders to regular fixed routes or deliver them to their destinations within a zone [50].
2016Pinellas County, FLPSTA, Uber, Lyft, United TaxiDirect Connect provides subsidized Uber and Lyft rides for passengers traveling to and from 800 feet of several locations [51].
2016Hillsborough County, FLHART, TransdevUsers can travel up to 3 miles to or from some major bus stations [50].
2016Centennial, COCity of Centennial, CH2M, DSTMA, etc.Public-private partnership to offer a free Lyft Line (carpooling) ride to and from an LRT station [50].
2017San Francisco, CABART, SCOOPCarpooling BART users receive priority parking at BART stations [52].
2018Phoenix, AZValley Metro, WaymoFirst-and-last-mile connections to transit stops, centers, and park-and-rides [50].
2019Dayton, OHGreater Dayton RTA, SpinIntegrated shared bikes and scooters with public transit [50].
2019Fort Worth, TXTrinity Metro, ViaIntroduced ZIPZONE, an on-demand rideshare to connect to transit stations [50].
2019Cupertino, CACity of Cupertino, ViaShuttle service connecting users to the CalTrain station [53].
2019Los Angeles, CALA Metro, ViaShared shuttle service to and from three Metro stations [54].
2019Seattle, WAKing County Metro, ViaService connects users to buses and trains or community hubs [55].
2019Sacramento, CASacRT, JUMPCharging bays inside LRT stations allow commuters to park and charge e-bikes [50].
2019Austin, TXCapMetro, ViaThe new service called Pickup offered a first-and-last-mile service across certain zones [56].
2020Marin County, CAMarin Transit, TAM, UberUsers receive Uber ride vouchers for trips to/from certain major bus stops, rail stations, and ferry terminals [57].
2021Dallas, TXDARTOn-demand trips to/from bus/train stations and other destinations [58].
2023Kansas City, MOCity of KC, zTrip, KCATAUsers can request pick-ups and drop-offs in locations within one-quarter mile of their request [59].
Table 2. Summary statistics of explanatory variables (N = 1056).
DomainVariable DefinitionStudy SampleEl Paso Population (2018–2019)
Mean/CountSt. Dev./%MinMaxMean/%
Socio-DemographicBinary: 1 = Existing transit user23722.4%011.7%
Binary: 1 = Household income ≥ USD 50,00028827.3%0146.0%
Binary: 1 = Employed for wages61458.1%0158.0%
Binary: 1 = Household has at least one automobile97992.7%0192.4%
Binary: 1 = Has a bachelor’s degree34833.0%0124.7%
Binary: 1 = Has at least one child under 1855352.4%0138.4%
Binary: 1 = 65 years or older827.8%0112.4%
Binary: 1 = Male39637.5%0148.9%
Binary: 1 = Hispanic/Latino84379.8%0180.9%
Binary: 1 = Feeling safe while riding the bus73069.1%01N/A
Built-EnvironmentWalk score (0–100)45.620.009640
Transit score (0–100)31.47.905928
Bike score (0–100)4210.717542
Walking route to nearest transit stop: Percentage of sidewalk (0–100)79.126.10100N/A
Walking route to nearest transit stop: Percentage of tree canopy cover (0–100)3.23034N/A
Binary: 1 = Network distance to nearest transit stop [0.25, 0.5) mile24222.9%01N/A
Binary: 1 = Network distance to nearest transit stop [0.5, 1) mile353.31%01N/A
Binary: 1 = Network distance to nearest transit stop ≥ 1 mile161.52%01N/A
N/A: Not available.
Table 3. Summary statistics of baseline transit trips.
Trip TypeTrip PurposeMeanSt. Dev.MinMax
BRT + Regular Bus TripsAll purpose1.6495.2280 (N = 819, 77.6%)75
Work0.6052.2920 (N = 931, 88.2%)30
Errands0.5651.8700 (N = 890, 84.3%)30
Leisure0.3081.4690 (N = 950, 90.0%)30
Sport0.0860.6510 (N = 1020, 96.6%)15
Other purpose0.0840.7880 (N = 1033, 97.8%)15
BRT Trips OnlyAll purpose0.4012.6920 (N = 963, 91.2%)70
Work0.1440.9000 (N = 1008, 95.5%)14
Errands0.1120.6770 (N = 1001, 94.8%)14
Leisure0.0810.6250 (N = 1016, 96.2%)14
Sport0.0340.4700 (N = 1040, 98.5%)14
Other purpose0.0300.4900 (N = 1047, 99.2%)14
Regular Bus Trips OnlyAll purpose1.2483.8960 (N = 841, 79.6%)60
Work0.4611.8970 (N = 945, 89.5%)30
Errands0.4541.6070 (N = 903, 85.5%)30
Leisure0.2271.1590 (N = 961, 91.0%)28
Sport0.0520.3820 (N = 1027, 97.3%)7
Other purpose0.0540.4890 (N = 1033, 97.8%)8
Table 4. Summary statistics of pre-post changes in transit trips due to the hypothetical free shuttle service.
Trip TypeTrip PurposeMeanSt. Dev.% Change
Change in BRT + Regular Bus TripsAll purpose7.727311.0665469%
Work3.02565.6364500%
Errands1.93843.5341343%
Leisure1.63923.0648533%
Sport0.93472.34281084%
Other purpose0.18941.0341225%
Change in BRT Trips OnlyAll Purpose4.72256.92121179%
Work1.86363.48921295%
Errands1.17522.14471052%
Leisure0.96881.86161203%
Sport0.59191.56471736%
Other purpose0.12310.7194406%
Change in Regular Bus Trips OnlyAll purpose3.00475.794241%
Work1.16193.0019252%
Errands0.76331.9600168%
Leisure0.67051.5942295%
Sport0.34281.1270658%
Other purpose0.06630.4763123%
Table 5. Regression models predicting changes in all transit trips (Equation (3) when k = 1).
Exp. Var.All PurposeWorkErrandLeisureSport
Binary: 1 = Existing transit user3.8810 ***1.0710 *0.9633 **1.1760 ***0.4491 *
(1.0763)(0.4872)(0.3705)(0.3415)(0.2209)
Binary: 1 = Household income ≥ USD 50,000−0.23270.1160−0.3515−0.00670.0330
(0.8543)(0.4507)(0.2513)(0.2559)(0.1965)
Binary: 1 = Employed for wages1.7247 *2.1549 ***−0.1919−0.0733−0.1870
(0.7248)(0.3601)(0.2372)(0.2111)(0.1628)
Binary: 1 = Household has at least one automobile3.4468 *1.20680.71721.2013 **0.3465
(1.4481)(0.6308)(0.5269)(0.4037)(0.3389)
Binary: 1 = Has a bachelor’s degree0.42140.17090.01730.07890.2032
(0.7580)(0.3902)(0.2332)(0.2212)(0.1788)
Binary: 1 = Has at least one child < 180.9018−0.09840.6914 **0.09450.0685
(0.7376)(0.3770)(0.2312)(0.2005)(0.1547)
Binary: 1 = 65 years or older−2.0977 *−0.9615 *0.0007−0.7544 **−0.4249 *
(0.9189)(0.4499)(0.4233)(0.2464)(0.2118)
Binary: 1 = Male−0.1308−0.0412−0.2827−0.07090.1742
(0.7333)(0.3794)(0.2281)(0.1972)(0.1616)
Binary: 1 = Hispanic/Latino2.6403 ***1.3174 ***0.38900.31070.5916 ***
(0.6930)(0.3575)(0.2476)(0.2155)(0.1411)
Binary: 1 = Feeling safe while riding the bus1.41760.36090.38110.4252 *0.3251 *
(0.7440)(0.3843)(0.2329)(0.2000)(0.1424)
Walk score (0–100)0.02690.0015−0.00040.00770.0124 *
(0.0251)(0.0138)(0.0084)(0.0071)(0.0049)
Transit score (0–100)0.0065−0.00180.0140−0.00240.0035
(0.0546)(0.0289)(0.0164)(0.0144)(0.0132)
Bike score (0–100)−0.01010.0393−0.0143−0.0130−0.0178 *
(0.0416)(0.0253)(0.0135)(0.0112)(0.0074)
Percentage of sidewalk (0–100) in walking route to transit −0.0092−0.0095−0.00280.00180.0015
(0.0133)(0.0065)(0.0047)(0.0034)(0.0029)
Percentage of tree cover (0–100) in walking route to transit0.12040.05300.00400.02020.0276
(0.1348)(0.0706)(0.0453)(0.0318)(0.0310)
Binary: 1 = Distance to nearest transit [0.25, 0.5) mile0.56550.5506−0.23260.03730.1831
(0.8835)(0.4625)(0.2635)(0.2442)(0.1854)
Binary: 1 = Distance to nearest transit [0.5, 1) mile1.02700.9028−0.78270.30980.4315
(1.9505)(0.8930)(0.5677)(0.5293)(0.3966)
Binary: 1 = Distance to nearest transit ≥ 1 mile −2.21050.0899−1.2315 **−0.4873−0.5306 *
(1.5499)(1.0200)(0.4361)(0.5238)(0.2535)
Constant−1.5606−2.07510.9213−0.1760−0.4043
(2.6186)(1.2889)(0.8954)(0.7159)(0.5130)
Note: Numbers without parentheses are coefficients estimated from Equation (3). Numbers inside parentheses are robust standard errors. Significance levels: * for 0.01 ≤ p < 0.05, ** for 0.001 ≤ p < 0.01, and *** for p < 0.001.
Table 6. Regression models predicting changes in BRT trips (Equation (3) when k = 2).
Exp. Var.All PurposeWorkErrandLeisureSport
Binary: 1 = Existing transit user3.2471 ***1.0831 **0.8289 ***0.8283 ***0.3550 *
(0.7036)(0.3287)(0.2242)(0.2133)(0.1553)
Binary: 1 = Household income ≥ USD 50,000−0.4909−0.1166−0.2459−0.0022−0.1093
(0.5309)(0.2813)(0.1555)(0.1690)(0.1216)
Binary: 1 = Employed for wages0.9534 *1.1522 ***−0.1542−0.0049−0.0726
(0.4648)(0.2294)(0.1516)(0.1308)(0.1051)
Binary: 1 = Household has at least one automobile2.5975 **1.1819 **0.47040.7359 **0.2741
(0.9205)(0.3918)(0.3129)(0.2602)(0.2165)
Binary: 1 = Has a bachelor’s degree0.70460.35300.10510.06950.2256
(0.4954)(0.2539)(0.1478)(0.1411)(0.1244)
Binary: 1 = Has at least one child < 180.3648−0.13950.3709 **0.02910.0244
(0.4419)(0.2298)(0.1381)(0.1208)(0.1018)
Binary: 1 = 65 years or older−1.6277 **−0.7479 *−0.1908−0.4068 *−0.2939
(0.5999)(0.2941)(0.2272)(0.1610)(0.1515)
Binary: 1 = Male−0.1896−0.1956−0.1464−0.00270.1107
(0.4540)(0.2270)(0.1371)(0.1260)(0.1058)
Binary: 1 = Hispanic/Latino1.2677 **0.6648 **0.17200.12650.2925 **
(0.4525)(0.2264)(0.1479)(0.1504)(0.1076)
Binary: 1 = Feeling safe while riding the bus0.63010.19320.16940.16950.1560
(0.4507)(0.2275)(0.1398)(0.1218)(0.0979)
Walk score (0–100)0.0038−0.0099−0.00090.00440.0071 *
(0.0168)(0.0093)(0.0057)(0.0042)(0.0035)
Transit score (0–100)0.02130.00960.01250.00290.0009
(0.0341)(0.0178)(0.0105)(0.0089)(0.0089)
Bike score (0–100)0.00390.0295−0.0070−0.0065−0.0102
(0.0284)(0.0169)(0.0103)(0.0074)(0.0059)
Percentage of sidewalk (0–100) in walking route to transit −0.0046−0.0042−0.00100.00090.0006
(0.0078)(0.0040)(0.0026)(0.0021)(0.0021)
Percentage of tree cover (0–100) in walking route to transit0.02120.0068−0.00500.00020.0117
(0.0765)(0.0393)(0.0307)(0.0189)(0.0202)
Binary: 1 = Distance to nearest transit [0.25, 0.5) mile0.23780.2875−0.1177−0.00570.0624
(0.5026)(0.2676)(0.1533)(0.1358)(0.1133)
Binary: 1 = Distance to nearest transit [0.5, 1) mile1.52400.7632−0.21580.44800.3763
(1.6238)(0.6709)(0.4268)(0.4137)(0.3795)
Binary: 1 = Distance to nearest transit ≥1 mile −1.03780.3704−0.7266 *−0.1862−0.4092 **
(1.1650)(0.8671)(0.2962)(0.3137)(0.1560)
Constant.−1.3045−1.56080.3795−0.2176−0.1485
(1.6504)(0.8299)(0.5288)(0.4391)(0.3671)
Note: Numbers without parentheses are coefficients estimated from Equation (3). Numbers inside parentheses are robust standard errors. Significance levels: * for 0.01 ≤ p < 0.05, ** for 0.001 ≤ p < 0.01, and *** for p < 0.001.
Table 7. Regression models predicting changes in regular bus trips (Equation (3) when k = 3).
Exp. Var.All PurposeWorkErrandLeisureSport
Binary: 1 = Existing transit user0.6339−0.01210.13440.34770.0940
(0.5820)(0.2764)(0.2242)(0.1826)(0.1035)
Binary: 1 = Household income ≥ USD 50,0000.25820.2326−0.1055−0.00450.1424
(0.4324)(0.2299)(0.1270)(0.1247)(0.1002)
Binary: 1 = Employed for wages0.7712 *1.0028 ***−0.0378−0.0684−0.1144
(0.3809)(0.1938)(0.1258)(0.1108)(0.0803)
Binary: 1 = Household has at least one automobile0.84920.02490.24680.4654 *0.0724
(0.8949)(0.3815)(0.3486)(0.2358)(0.1861)
Binary: 1 = Has a bachelor’s degree−0.2832−0.1821−0.08780.0095−0.0224
(0.3869)(0.1963)(0.1237)(0.1154)(0.0837)
Binary: 1 = Has at least one child < 180.53700.04100.3205 **0.06540.0441
(0.3819)(0.1986)(0.1226)(0.1027)(0.0734)
Binary: 1 = 65 years or older−0.4700−0.21360.1915−0.3476 **−0.1310
(0.5153)(0.2498)(0.3013)(0.1299)(0.1053)
Binary: 1 = Male0.05870.1544−0.1363−0.06820.0636
(0.3821)(0.2037)(0.1280)(0.0994)(0.0790)
Binary: 1 = Hispanic/Latino1.3726 ***0.6527 ***0.21700.18430.2991 ***
(0.3668)(0.1886)(0.1342)(0.1047)(0.0622)
Binary: 1 = Feeling safe while riding the bus0.7875 *0.16770.21170.2557 *0.1691 **
(0.3699)(0.1975)(0.1178)(0.0991)(0.0646)
Walk score (0–100)0.02310.01150.00050.00330.0053 *
(0.0135)(0.0075)(0.0046)(0.0037)(0.0024)
Transit score (0–100)−0.0147−0.01130.0016−0.00530.0026
(0.0290)(0.0157)(0.0089)(0.0077)(0.0060)
Bike score (0–100)−0.01400.0098−0.0073−0.0065−0.0076 *
(0.0216)(0.0134)(0.0067)(0.0053)(0.0033)
Percentage of sidewalk (0–100) in walking route transit −0.0046−0.0053−0.00190.00100.0009
(0.0074)(0.0036)(0.0026)(0.0020)(0.0013)
Percentage of tree cover (0–100) in walking route transit0.09910.04620.00900.02000.0159
(0.0738)(0.0376)(0.0225)(0.0180)(0.0146)
Binary: 1 = Distance to nearest transit [0.25, 0.5] mile0.32770.2631−0.11490.04300.1206
(0.4598)(0.2421)(0.1409)(0.1314)(0.0927)
Binary: 1 = Distance to nearest transit [0.5, 1] mile−0.49700.1397−0.5669 *−0.13820.0553
(0.8540)(0.4266)(0.2492)(0.2140)(0.1517)
Binary: 1 = Distance to nearest transit ≥ 1 mile −1.1727−0.2806−0.5049 *−0.3011−0.1213
(0.6967)(0.3905)(0.2174)(0.2532)(0.1212)
Constant.−0.2561−0.51430.54180.0417−0.2558
(1.5393)(0.7424)(0.5613)(0.3919)(0.2511)
Note: Numbers without parentheses are coefficients estimated from Equation (3). Numbers inside parentheses are robust standard errors. Significance levels: * for 0.01 ≤ p < 0.05, ** for 0.001 ≤ p < 0.01, and *** for p < 0.001.
Disclaimer/Publisher’s Note: The statements, opinions and data contained in all publications are solely those of the individual author(s) and contributor(s) and not of MDPI and/or the editor(s). MDPI and/or the editor(s) disclaim responsibility for any injury to people or property resulting from any ideas, methods, instructions or products referred to in the content.

