Article

How Does the Low-Carbon City Pilot Policy Affect Enterprises’ Green Innovation? Empirical Evidence from the Context of China’s Digital Economy Development

1
School of Economics, Central University of Finance and Economics, Beijing 100081, China
2
School of Management Science and Engineering, Central University of Finance and Economics, Beijing 100081, China
*
Author to whom correspondence should be addressed.
Sustainability 2024, 16(5), 1760; https://doi.org/10.3390/su16051760
Submission received: 23 December 2023 / Revised: 7 February 2024 / Accepted: 20 February 2024 / Published: 21 February 2024
(This article belongs to the Section Economic and Business Aspects of Sustainability)

Abstract

:
The integrated development of green innovation and digital economy is crucial for addressing global climate change, promoting the application and popularization of digital technologies in the green sector, and achieving efficient, intelligent, and sustainable economic development and lifestyles. Using panel data from China’s listed enterprises from 2003 to 2021, this study examines the impacts of environmental regulations on green innovation in the low-carbon city pilot policy (LCCPP) context, which serves as a quasi-natural experiment in the digital economy. The results show that LCCPP effectively enhances enterprises’ green innovation by increasing enterprises’ environmental and research and development investments, and boosting digital transformation. Heterogeneity analysis reveals that the promotion effect of LCCPP on green innovation is highly pronounced for enterprises in the eastern region, for those with low financial constraints, and for technology-intensive enterprises. This effect is closely and positively correlated with the digital economy level in the regions where the enterprises are located. This study provides new empirical evidence for the relationship between environmental regulations and enterprises’ green innovation and discusses policy support for addressing global climate change challenges through environmental regulations in the digital economy context, thereby promoting global sustainable development.

1. Introduction

The increase in greenhouse gas emissions, particularly carbon dioxide (CO2), resulting from economic growth poses significant risks and challenges to human society, economies, and ecosystems, thereby threatening sustainable development [1]. The average global warming caused by human activities reportedly reached 1.14 °C between 2013 and 2022 and 1.26 °C in 2022 [2]. Climate change endangers global biodiversity and the well-being of future generations, requiring collaborative efforts from countries. Green innovation is crucial for addressing global climate change because it can reduce greenhouse gas emissions, promote sustainable development, create economic growth and employment opportunities, and improve the quality of social life. Consequently, green innovation has become a widely discussed topic.
Rhodes and Wield [3] introduced the term “green innovation” to refer to the development of environmentally friendly products and technologies from the research stage to the market. The Porter hypothesis indicates that appropriate environmental regulations promote green innovation [4]. However, no consensus has been achieved in the literature regarding the relationship between environmental regulations and green innovation. The first category of research found that environmental regulations lead to increased pollution control costs for enterprises, which displaces investment in research and development (R&D) and decreases their level of green innovation [5,6,7]. The second category revealed that environmental regulations stimulate an “innovation compensation” effect, which offsets the cost of environmental pollution control and enhances the level of green innovation [8,9,10]. The third category found a nonlinear effect of environmental regulations on the level of green innovation [11,12,13]. This lack of consensus may stem from variations in the environmental regulations studied and the research samples and methods employed. Therefore, a specific and thorough analysis is necessary to provide additional empirical evidence on the relationship between environmental regulations and green innovation, and to propose replicable policy recommendations in order to mitigate climate change-induced challenges and promote global sustainable development.
After more than 40 years of rapid growth following the reform and opening-up of the Chinese economy, the country has shifted from high-speed to high-quality growth, striving to achieve harmonious coexistence between humans and nature. China has actively implemented a low-carbon city pilot policy (LCCPP) to facilitate low-carbon transformation to achieve sustainable development. The first batch of low-carbon city pilots was launched in 2010, followed by the second and third batches in 2012 and 2017, respectively, covering 81 cities across eastern, central, and western China [14]. The goals, tasks, focal points, and implementation paths of the pilot cities vary considering that regions across China have achieved diverse levels of development and resource endowment [15]. Positive interactions and developments among regions have been promoted by expanding the scope of the pilot program and leveraging the comparative advantages of different regions. In addition, LCCPP has explored effective pathways for greenhouse gas emissions control and green low-carbon development in different types of regions, thus driving China’s low-carbon transformation [16]. Therefore, LCCPP has distinct characteristics for adapting to local conditions [17]. Consequently, studying the relationship between environmental regulations and green innovation from the LCCPP perspective offers two significant advantages. First, it enables the examination of the characteristics of low-carbon transformation in regions with different geographies, natural endowments, and levels of economic development, thereby providing replicable experiences and policy recommendations for other developing countries to achieve low-carbon transformation [18]. Second, the selection of pilot cities covering various regions in China eliminates sample selection bias, thus allowing for a good quasi-natural experiment to accurately identify the causal effects of environmental regulations on green innovation [19].
In addition, China is witnessing a boom in its digital economy while promoting low-carbon transformation. According to the “China Digital Economy Development White Paper (2021)” released by the China Academy of Information and Communications Technology, the penetration rates of the digital economy in the service, industrial, and agricultural sectors are 40.7%, 21.10% and 8.9%, respectively. The digital economy contributes to energy conservation, emission reduction, efficient resource utilization, and environmental risk management; it also promotes green and sustainable development, including low-carbon lifestyles, and a green economy [20]. The two factors of low-carbon transformation and enterprise digital transformation are important manifestations of China’s transition from high-speed to high-quality growth [21]. The integrated development of these factors has optimized the economic structure and promoted industrial structure transformation and upgrading, thus facilitating the application and popularization of digital technologies in the green sector and the realization of a development model that is intelligent, sustainable, innovative, and efficient with a low-carbon focus. Therefore, the impact of LCCPP on enterprises’ green innovation should be explored within the context of the digital economy, and corresponding policy recommendations must be proposed to enrich the existing literature.
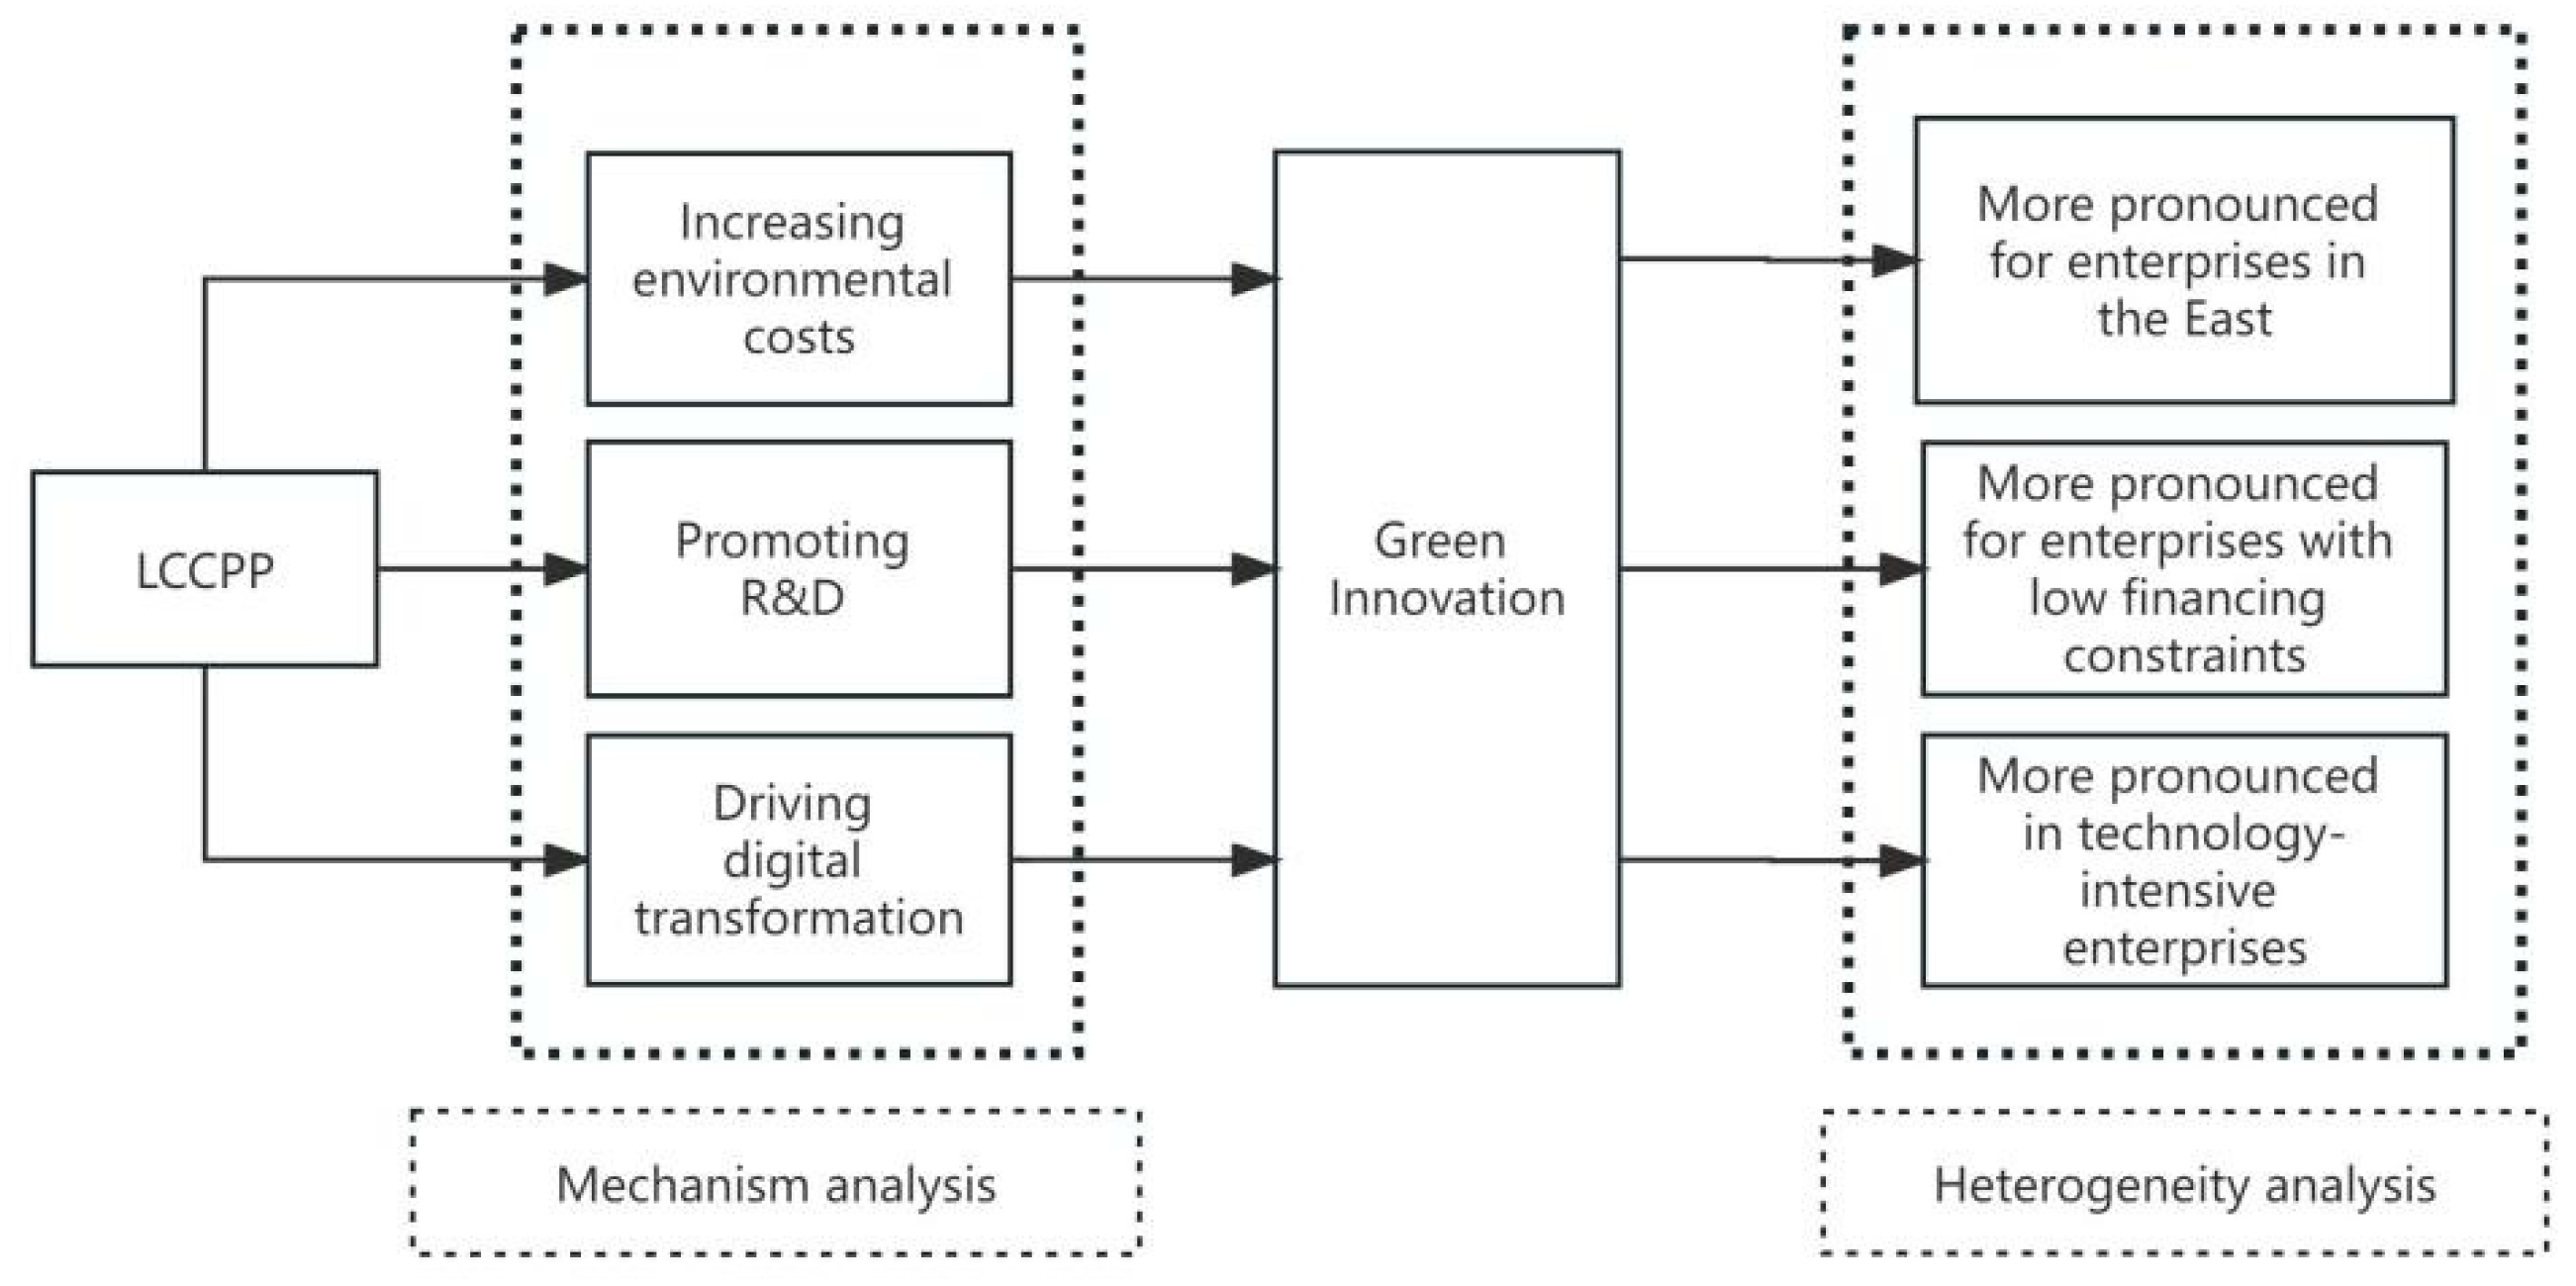
Based on the 2003–2021 data of Chinese A-share listed enterprises, this study uses LCCPP as a quasi-natural experiment and employs a difference-in-differences (DID) approach to examine the impact of LCCPP on enterprises’ green innovation in a digital economy. The findings of this research are as follows: (1) LCCPP effectively improves enterprises’ green innovation levels. (2) The mechanisms of this improvement include increasing environmental costs, increasing investment in R&D, and promoting enterprises’ digital transformation. (3) The promotion effect of LCCPP on enterprises’ green innovation is highly pronounced in eastern regions, regions with low financing constraints, and technology-intensive enterprises. (4) This promotion effect is positively correlated with the digital economy level in the region in which the enterprise is located.
This study’s marginal contributions are mainly reflected in the following three aspects. First, this study verifies the influence of LCCPP on enterprises’ green innovation at the micro-level and provides new evidence for exploring the relationship between environmental regulations and enterprises’ green innovation. Second, from the perspective of environmental costs, R&D investment, and enterprises’ digital transformation, this study analyzes the transmission path of LCCPP on enterprises’ green innovation in the context of digital economy development. Third, this study examines the heterogeneity of the impact, including factors such as the region in which the enterprise is located, financing constraints, and production factor endowments, to deepen the understanding of the effects of LCCPP in the context of a digital economy. This study also provides policy support to improve policy design and enhance enterprises’ green innovation levels and sustainable development.
The rest of this paper is organized as follows: Section 2 elaborates on the theoretical basis of the impact of LCCPP on green innovation and describes the research hypotheses. Section 3 introduces the model setting and data processing. Section 4 presents the baseline regression, robustness tests, and mechanism analysis. Section 5 discusses the heterogeneity analysis. Finally, Section 6 concludes the study and outlines policy implications.

2. Theoretical Foundation and Hypotheses

LCCPP is implemented in the form of environmental regulations, which include establishing emission standards, restricting high-pollution enterprises, and strengthening environmental supervision. These measures encourage enterprises to adopt additional environmentally friendly and low-carbon production methods, achieving a win–win situation for economic growth and environmental protection [22]. This notion is consistent with Porter’s hypothesis, which suggests that governments can drive enterprises toward environmental protection and sustainable development through regulations and incentives [4]. Based on Porter’s hypothesis and considering the background of China’s digital economy development, LCCPP can influence enterprises’ green innovations through several pathways.
First, LCCPP may promote enterprises’ green innovations by increasing environmental costs. As a government regulatory policy, the LCCPP will increase the environmental costs of enterprises. The increase in environmental costs may stimulate the demand for green innovation and improve the environmental performance of enterprises. On the one hand, the increase in environmental costs will make enterprises pay more attention to their environmental impacts and also make them realize the importance of environmental management [23]. This realization will prompt enterprises to generate more demand for green innovation, through green innovation in production, management, and technology, to reduce energy consumption, reduce pollutant emissions, and improve the efficiency of resource utilization, to achieve green development and reduce environmental costs. On the other hand, the increase in environmental protection costs of enterprises will make them pay more attention to the improvement of environmental performance [24]. By carrying out green innovation, enterprises can introduce more environmentally friendly technologies and processes, reduce the use of energy and raw materials, and minimize the generation and emission of waste, thus improving their environmental performance. In this way, enterprises can not only comply with relevant environmental laws and regulations, but also meet the market demand for green products and gain social and market recognition.
Second, LCCPP may promote green innovation by stimulating increased R&D investment. The government can provide financial, tax, or other incentive measures to encourage enterprises to increase R&D investment, particularly in the low-carbon and environmental sectors, thus fostering technological innovation [25]. Such measures can motivate enterprises to develop and apply further environmentally friendly and low-carbon production technologies and processes toward green development. Increased R&D investment will allow enterprises to enhance their technological capabilities and core competitiveness [26]. With the promotion of LCCPP, enterprises actively engage in green innovation, providing further environmentally friendly and energy-efficient products and services to meet market demands for green consumption, thereby strengthening their market competitiveness. The encouragement of increased R&D investment through LCCPP helps promote industrial structure upgrading and transformation [27]. Through technological innovation, enterprises can reduce resource consumption, decrease emissions, enhance resource utilization efficiency, and drive economic development in a low-carbon, green, and sustainable direction.
Finally, LCCPP may promote enterprises’ green innovations by facilitating digital transformation. Government regulatory policies can drive the digital transformation of enterprises [28]. LCCPP as an environmental regulatory policy may positively contribute to the digital transformation of enterprises. Digital transformation is the sociotechnical process of utilizing digitized techniques to expand organizational contexts in terms of business models, business processes, commercial offerings, etc. [29,30]. Digital transformation brings more opportunities and tools for green innovation. Through data-driven decision-making, intelligent technologies, innovation synergy, and the application of emerging technologies, companies can achieve greater breakthroughs and results in the field of green innovation and realize the goal of sustainable development. First is data-driven decision-making. Digital transformation provides companies with more data collection and analysis capabilities, enabling them to better understand their resource use, environmental impacts, and opportunities for green innovation [31]. Through in-depth analyses of large amounts of data, companies can more accurately assess environmental risks, find improvements in energy and resource efficiency, and develop more targeted green innovation strategies. Next are smart and automated technologies. Digital transformation is driving the application of smart and automated technologies that can help companies achieve the more efficient use of resources and reduce waste [32]. For example, IoT technology can monitor energy consumption and emissions in real-time, providing fine-grained management and control to reduce environmental loads. At the same time, automation technology can reduce errors and waste in human operations and improve the efficiency and sustainability of production processes. The third is innovation synergy and open innovation [33]. Digital transformation brings more opportunities for cooperation and collaboration in enterprise innovation. Through digital platforms and cloud computing technologies, enterprises can more easily collaborate with suppliers, partners, academia, and social organizations to jointly promote the development of green innovation. This open innovation model helps bring together the wisdom and resources of all parties to promote the rapid iteration and application of green technologies and solutions. Finally, there is the application of emerging technologies. Digital transformation has led to the development and application of many emerging technologies, such as artificial intelligence, blockchain, and big data analytics [34]. These technologies have the potential for green innovation, for example, through artificial intelligence and big data analytics, the management and scheduling of energy systems can be optimized to improve the efficiency of energy use, and blockchain technology can achieve decentralization and traceability of energy transactions and promote the application and development of renewable energy [35]. Based on these points, the following two hypotheses are proposed:
Hypothesis 1: 
LCCPP can promote enterprises’ green innovation.
Hypothesis 2: 
Increasing environmental costs, boosting R&D investment, and driving digital transformation are important mechanisms through which LCCPP promotes green innovation in enterprises.
Significant regional disparities exist in economic development and environmental pollution in China. The eastern coastal regions are relatively developed, whereas the central and western regions are relatively underdeveloped, with weak environmental protection awareness and capabilities. Industrialization has led to severe environmental pollution in some cities [36]. Therefore, the promotion effect of LCCPP on enterprises’ green innovation may vary across regions owing to variations in environmental governance pressure, technological and industrial intensity, policy support, and market demand in the eastern, central, and western regions.
First, compared with the western region, eastern China is technologically and industrially more advanced, providing better conditions for enterprises to engage in green innovation [37]. Moreover, enterprises in the eastern region are generally more innovative and technologically capable, enabling them to better respond to environmental requirements and develop green technologies and products. Second, when implementing LCCPP in the eastern region, the Chinese government often provides more policy support and incentive measures, such as fiscal subsidies, tax reductions, and research funding support, to encourage green innovation among enterprises [38]. These policy supports can effectively promote the enthusiasm of enterprises for green innovation. Finally, the eastern region has a larger market scale, and the consumer demand for environmentally friendly products and services is relatively higher here. This demand motivates enterprises in the eastern region to engage in green innovation to meet market demand and gain a competitive advantage [39].
LCCPP is developed and implemented at the urban level, but ultimately impacts enterprises. Given differences in factors such as financing constraints and types of production elements, enterprises’ responses and adaptability to LCCPP also vary, resulting in heterogeneity [40].
The promotion effect of LCCPP on enterprises’ green innovation may vary in terms of funding support, investment attraction, policy benefits, and market competitive advantages due to different financing constraints. First, LCCPP usually provides financial subsidies, research funding support, and other means to provide enterprises with the necessary financial support for green innovation. For enterprises with low financing constraints, these support measures can alleviate the economic burden of green innovation and encourage further active innovation [41]. Second, the implementation of LCCPP often attracts further green investment and social capital attention. For enterprises with low financing constraints, these investments and attention may provide additional financing opportunities and resources, ensuring they gain the necessary support for green innovation. Third, LCCPP often provides policy incentives such as tax reductions and preferential loan interest rates for green innovation projects. For enterprises with low financing constraints, these preferential policies can reduce the financing costs of their green innovation projects and increase their motivation for innovation [42]. Finally, enterprises can provide additional environmentally friendly and sustainable products and services through green innovation, thereby gaining a competitive advantage in the market. Enterprises with low financing constraints have a greater opportunity to gain a competitive market advantage through green innovation because they can better allocate resources and funds for innovation [43].
The promotion effect of LCCPP on enterprises’ green innovation may vary in terms of technological advantages, technological driving force, market demand, and policy support considering the different types of production elements. First, technology-intensive enterprises usually possess strong R&D and innovation capabilities, enabling them to respond quickly to the environmental requirements proposed by LCCPP [44]. These enterprises may be highly capable of developing environmentally friendly technologies and products and adapting to policy requirements. Second, the advanced technologies and specialized knowledge of technology-intensive enterprises regarding green innovation allow them to better apply high-tech and clean production technologies to promote green innovation [45]. LCCPP implementation provides further development opportunities for these enterprises, and gives them a competitive advantage in the field of green innovation. Third, technology-intensive enterprises are usually highly concerned about market demand and technological trends, allowing them to accurately grasp market opportunities for green products and services. LCCPP promotion may drive more market demand toward green and environmentally friendly products. Moreover, technology-intensive enterprises are likely to meet this market demand because of their technological advantages [46]. Finally, LCCPP often supports technology-intensive enterprises via research funding, tax reductions, and other preferential policies. These support measures can encourage enterprises to engage actively in green innovation [47]. Hence, Hypothesis 3 is proposed.
Hypothesis 3: 
The promoting effect of LCCPP on green innovation is greatly pronounced for enterprises in the eastern region, those with low financing constraints, and technology-intensive enterprises.
Based on the formation mechanism of LCCPP and related research, the role, mechanism and heterogeneity of LCCPP in promoting enterprises’ green innovation levels are determined (Figure 1).

3. Empirical Strategy and Data Sources

3.1. Identification Strategy and Model Specifications

This study employs a DID model to examine the impact of LCCPP on enterprises’ green innovation. The model specification is as follows:
G r e e n _ i n v i j t = α + β t r e a t j × p o s t t + X i t + Z j t + ρ i + τ t + ε i j t
Here, i, j and t represent the enterprise, city, and year, respectively. The dependent variable, Green_inv, represents the level of green innovation for enterprise i in year t. Further, treat is a dummy variable indicating whether city j belongs to the scope of LCCPP, with a value of 1 indicating yes and 0 indicating no; post is a dummy variable representing the period before and after LCCPP implementation, with a value of 0 before implementation and 1 after implementation; and X represents control variables at the enterprise level that may affect green innovation over time. Based on a previous paper [44], this study controls for variables such as enterprise size (Size), revenue growth rate (Growth), enterprise age (Age), institutional ownership ratio (Inst), fixed asset ratio (Fixed), independent director ratio (Indep), and industry competition level (Herfindahl), all of which may have a significant impact on corporate green innovation. (1) Firm size has a complex impact on green innovation [48]. Large enterprises have advantages in terms of technological innovation, amount of R&D investment, and scale effects, but face challenges such as organizational complexity and management difficulties. Small and medium-sized enterprises are relatively disadvantaged in some aspects, but due to their organizational simplicity and flexibility, it is easier for them to carry out green innovation in local areas. (2) An increase in the growth rate of an enterprise’s operating income can provide the enterprise with more funds for green technology research and development and promotion, promote the implementation of green innovation, and accelerate the adoption and development of environmentally friendly technologies through profit reinvestment [49]. (3) The impact of the firm’s age of establishment on green innovation is twofold [50]. Younger enterprises are usually more flexible and agile and are more likely to incorporate green innovation into their strategic planning at the start-up stage. Older enterprises, on the other hand, may face traditional inertia and institutional inertia, and need to make organizational changes to better promote green innovation. (4) An increase in the proportion of institutional investors in a company may have a positive impact on green innovation because institutional investors usually pay more attention to the long-term value and social responsibility of the company, and will urge the company to adopt environmental protection measures using voting rights and shareholder proposals [51]. At the same time, institutional investors can provide more financial support to enterprises to help them carry out green technology innovation and promotion. (5) An increase in the proportion of fixed assets of enterprises may have a positive impact on green innovation, because higher fixed asset investment means that enterprises have more physical equipment and infrastructure that can support the research and development and application of environmental protection technologies, thus promoting the implementation of green innovation and improving environmental protection [52]. (6) An increase in the proportion of independent directors in enterprises may have a positive impact on green innovation because independent directors usually have a higher level of environmental awareness and social responsibility, and can provide professional advice on environmental protection measures and green innovation strategies [53]. At the same time, independent directors may also play a supervisory role in corporate governance and promote more proactive actions by companies in green innovation. (7) An increase in the level of industry competition may have a positive impact on green innovation, as enterprises need to seek new opportunities for growth and meet consumer demand for environmentally friendly products in a competitive market, thus promoting the innovation and application of green technologies [54]. At the same time, competition in the industry will also bring more opportunities for investment, cooperation, and knowledge sharing, which will promote the development of green innovation. The economic level of the city where the enterprise is located also affects the enterprise’s green innovation [55]. Economically developed cities usually have more resources and technical support, more green innovation opportunities and partners, as well as higher environmental awareness and demand, which can provide a better market environment and impetus for enterprises to carry out green innovation. z denotes the control variables at the city level that may affect the enterprise’s green innovation, including per capita gross domestic product (GDP; Pgdp) and population density (Popd), which are used to measure the level of urban economic development. ρ represents enterprise fixed effects, which control for characteristics that do not vary over time at the enterprise level, such as ownership nature and industry attributes; τ represents time fixed effects, which control for national-level characteristics that vary over time, such as macroeconomic fluctuations and national policy shocks; and ε represents the random disturbance term. During model estimation, standard errors are adjusted by clustering at the city level. β is the main coefficient of interest in this study, reflecting the average treatment effect of LCCPP on enterprises’ green innovation.
Model (1) adopts the OLS estimation method, using which we need to make tests for problems such as the presence of nonlinear variables, choice of fixed or random effects model, and heteroskedasticity. We made the following tests for the model to address the above issues. First, we performed the Regression Equation Specification Error Test (RESET), which showed an F-statistic of 1.51 with a p-value of 0.2114, affirming the original hypothesis that there are no nonlinear omitted variables. Secondly, we conducted the Hausman test on whether the model should be chosen as a fixed effects model or a random effects model, and the test results show that the p-value was 0.0000, which strongly rejects the original hypothesis of random effects, so the fixed effects model should be chosen for use. Finally, we conducted a heteroskedasticity test on the model using the Breusch–Pagan test, and the result showed a p-value of 0.2245, which affirms the original hypothesis of homoskedasticity and indicates that the model does not have a heteroskedasticity problem.

3.2. Data Source and Descriptive Statistics

This study utilizes panel data of Chinese listed enterprises from 2003 to 2021 to analyze the impact of LCCPP implemented in 2010, 2012 and 2017 on enterprises’ green innovation. Enterprise-level data are obtained from the State Intellectual Property Office (SIPO), China Stock Market and Accounting Research database, and Wind database. City-level data are sourced from the “China Urban Statistical Yearbook” and CEIC database. Considering the significant differences in financial data and regulatory systems between listed enterprises in the financial industry and other industries, data from the financial industry are excluded [56]. Finally, we obtained 34,702 observations from 3552 enterprises across 80 industries.
(1)
Dependent Variable—The number of green invention patents applied for by listed enterprises is the dependent variable. Initially, the number of patent applications by listed enterprises is obtained from SIPO (Green_inv). Then, using the “International Patent Classification Green Inventory” online tool launched by the World Intellectual Property Organization in 2010 to facilitate the retrieval of environmentally friendly technology-related patent information, the annual number of green patent applications by each company is identified and calculated. Green patents are classified into green inventions and utility models. Green utility patents are related to strategic innovations that comply with government standards at a low level, whereas green invention patents are associated with substantive innovation, greatly reflecting a company’s sustainable development capabilities. Therefore, the number of green invention patent applications is used in this study to measure enterprises’ green innovation levels [17];
(2)
Core Explanatory Variable—This variable is a dummy variable indicating whether it belongs to the scope of LCCPP and the interaction term between the pre- and post-implementation dummy variables (DID);
(3)
Control Variables—Enterprise-level control variables include enterprise size, revenue growth rate, enterprise age, institutional ownership ratio, fixed asset ratio, independent director ratio, and industry competition level. City-level data, such as per capita GDP and population density, contain some missing values, which are filled using interpolation methods. Logarithmic transformation is applied to enterprise size and per capita GDP. Table 1 shows the descriptive statistics of the variables.

4. Empirical Results

The empirical model in this paper uses OLS estimation, and the least squares method plays a very important role in economics research. Economic research often tries to build economic models to describe the relationships between different variables, and through the least squares method, the parameters in these linear relationships can be estimated to quantify the degree of association between them. OLS provides an effective tool for economic research to obtain parameter estimates from data and to further analyze and interpret economic phenomena.

4.1. Baseline Regression Results

Table 2 presents the estimated results of the model examining the impact of LCCPP on enterprises’ green innovation. Column (1) shows only enterprises and year fixed effects. In column (2), enterprise-level control variables are additionally controlled for, and in column (3), city-level control variables are included. Across these different levels of control variables and fixed effects, the coefficient of LCCPP is consistently significant at the 1% level. This result indicates that LCCPP has a significant positive effect on enhancing enterprises’ green innovation. According to the estimation results in column (3), after LCCPP implementation in the experimental areas, enterprises’ green innovation levels in the pilot cities significantly increase by 2.6737, which corresponds to a 74.64% improvement over the mean level (3.582). This result demonstrates a substantial enhancement.

4.2. Robustness Checks

4.2.1. Parallel Trends Test

The validity of the DID method relies on the assumption of parallel trends, i.e., the assumption that the treatment and control groups exhibit similar trends in green innovation levels before LCCPP implementation. This approach ensures the validity of the control group as a counterfactual comparison group for the treatment group. Following the approach of Shao [57], this study employs the classic event analysis method to examine parallel trends. Considering the limited data available for the 6 years before and after policy implementation, this study aggregates the data from the 6 years before implementation into period t−6 and the data from the 6 years after implementation into period t + 6. Thus, this study first defines 13 dummy variables representing each year (timen, n = −6, −5, …, 4, 5, 6), where n = −6, −5, …, −1 represent the 6 years before LCCPP implementation, n = 0 represents the year of policy implementation, and n = 1, 2, …, 6 represent subsequent years. These year dummy variables then interact with LCCPP dummy variable (treat) and are introduced into model (1) to replace the previous treat × post variable. The model specification is as follows:
G r e e n _ i n v i j t = α + t = 6 6 β t t r e a t j × t i m e t + X i t + Z j t + ρ i + τ t + ε i j t
This study uses the second period before policy implementation as the reference period. The coefficient βt reflects the relative difference between the treatment and control groups in different years compared with the difference between them in the 2 years before policy implementation. Figure 2 shows the estimated results of model (2). The interaction term coefficients are not significant before LCCPP implementation, which indicates that no significant difference in green innovation levels exists between the treatment and control groups, thereby confirming the validity of the parallel trends assumption. Starting from the first year after LCCPP implementation, the interaction term coefficients become significant and show a clear upward trend. This result confirms the positive impact of LCCPP on enterprises’ green innovation levels and demonstrates a continuous strengthening trend over time.

4.2.2. Placebo Test

Although the parallel trends assumption helps address potential randomness or interference from other factors in the baseline regression results, a random bias is still possible. This study follows the approach of Shen et al. [17] and conducts a placebo test to strengthen the reliability of the results and further enhance the credibility of the baseline regression results. The specific procedure is as follows: (1) Nonduplicative random sampling is conducted to select the same number of enterprises as the “pseudo” treatment group, whereas the remaining enterprises are designated as the control group. (2) The pseudo treatment group samples are used to generate fake interaction terms with the years in which LCCPP was implemented. (3) The fake interaction terms are introduced into model (1) for estimation, while the remaining variables remain unchanged. (4) This process is repeated 1000 times. The estimated coefficient distribution plot (Figure 3) shows that the coefficients of the fake interaction terms are concentrated around zero and are all outside the range of estimates from the nonparametric permutation test. This result indicates that no random bias is caused by unobserved random factors in the baseline regression results.

4.2.3. Empirical Test Using the PSM-DID Method

Next, following the approach of Ho et al. [58], we conducted robustness tests using the propensity score matching (PSM) method to reduce estimation errors caused by systematic differences between the treatment and control groups. For simplicity, we employed a logit regression model to estimate the propensity scores, with a matching ratio of 1:3 between the groups. Based on the probability density function of the PSM scores shown in Figure 4, we found that the scores were quite close between the groups after PSM, indicating the effectiveness of the PSM method. We retested the impact of LCCPP on enterprises’ green innovation levels using the matched samples. The results, shown in columns (1) and (2) of Table 3, reveal a significantly positive effect of the DID term.

4.2.4. Excluding Interference from Other Policies

Other economic and environmental policies can interfere with baseline regression results and lead to biased estimates of policy effects [59]. We considered relevant environmental policies since 2008, including the 2011 carbon emission trading policy, 2012 green credit guidelines policy, and 2012 new environmental air quality standards.
(1)
Carbon Emission Trading Pilot Policy: In 2011, the Chinese government selected Beijing, Tianjin, Shanghai, Chongqing, Hubei, Guangdong, and Shenzhen as pilot cities for carbon emission trading. Shenzhen, Tianjin, Shanghai, Guangdong, and Beijing were officially designated as pilot cities in 2013, followed by Hubei and Chongqing in 2014 and Fujian in 2016. A policy dummy variable, DID_market, was added to the regression model to eliminate interference from the carbon emission trading pilot policy in the baseline regression results. Column (1) of Table 4 shows the detailed results.
(2)
Green Finance Experimental Zone Policy: In June 2017, China approved the construction of green finance experimental zones in Zhejiang, Jiangxi, Guangdong, Guizhou and Xinjiang to promote the establishment of a green financial system and achieve its ecological and environmental protection goals. A policy dummy variable, DID_finance, was added to the regression model to eliminate interference from the green finance experimental zone policy on the baseline regression results. Column (2) of Table 4 shows the detailed results.
(3)
New Environmental Air Quality Standards: After the U.S. Embassy in China published air quality monitoring data for Beijing in 2011, the Ministry of Ecology and Environment and the General Administration of Quality Supervision, Inspection, and Quarantine jointly released the “Environmental Air Quality Standards (2012)”. The new standards mandated the disclosure of real-time air quality data from national network monitoring stations to the public and relevant higher-level authorities in 74 pilot areas, including Beijing, Tianjin and Shijiazhuang. Implementing these new standards made it difficult for local governments to adopt short-term mechanisms to regulate pollution, fundamentally constraining their behavior and improving environmental air governance [44]. A strategy dummy variable, DID_standard, was added to the model to exclude the potential influence of the new environmental air quality standards on the baseline regression results. Column (3) of Table 4 shows the results. In addition, column (4) of Table 4 shows that the results remained significant after controlling for the above policies.
Table 4. Excluding interference from other policies.
Variable(1)(2)(3)(4)
Green_InvGreen_InvGreen_InvGreen_Inv
DID2.3164 ***2.6823 ***2.5479 ***2.2186 ***
(0.7436)(0.8185)(0.7704)(0.7188)
DID_market−2.9059 * −2.8771 *
(1.6899) (1.6837)
DID_finance −0.5683 −0.2273
(2.1947) (2.1545)
DID_standard 0.8914 *0.7420
(0.4990)(0.4596)
Constant−97.4539 ***−94.7434 ***−94.9419 ***−97.6151 ***
(26.6464)(26.2190)(26.1847)(26.6382)
ControlsYESYESYESYES
Enterprise fixed effectsYESYESYESYES
Year fixed effectsYESYESYESYES
Observations34,70234,70234,70234,702
F-statistic9.4945 ***7.4679 ***8.6790 ***8.5199 ***
R-squared0.59960.59900.59900.5996
Note: * and *** indicate significance at the 10% and 1% levels, respectively.

4.2.5. Replacing the Dependent Variable and Excluding the Interference of Outliers

We replaced the dependent variable and conducted a truncation test on all continuous variables in the model to further ensure the robustness of the results, following the approach of Yang et al. [60]. Columns (1) and (2) of Table 5 report the regression results with the dependent variable replaced by the number of green utility patents (Green _Uma) and the total number of green patents (Green_Total), respectively, showing that the results remain robust. Columns (3) and (4) of Table 5 report the results of truncating all continuous variables by 1% and 5%, respectively, to exclude the influence of outliers on the baseline regression estimates, after which the regression results remain robust.

4.3. Mechanism Test

This study empirically examines three impact mechanisms by constructing a mediation model to test the effect of LCCPP on promoting enterprises’ green innovation. The mediation effect is modeled as shown in Equations (1), (3) and (4).
G r e e n _ i n v i j t = α 1 + β 1 t r e a t j × p o s t t + β 2 M + X i t + Z j t + ρ i + τ t + ε i j t
M = α 2 + β 3 t r e a t j × p o s t t + X i t + Z j t + ρ i + τ t + ε i j t
where M is a mediating variable such as environmental cost, R&D investment, and digital transformation. β is the total effect of LCCPP on firms’ green innovation. β1 is the direct effect of LCCPP on firms’ green innovation. β2 × β3 is the indirect effect of LCCPP on firms’ green innovation (mediated by M). The rest of the variables have the same meaning as in Equation (1).

4.3.1. Environmental Cost

First, this study tests the mechanism by which LCCPP promotes green innovation by increasing environmental costs. Following the approach of Xie et al. [61], environmental costs are measured using environmental taxes and fees (Tax). Column (1) of Table 6 verifies the impact of LCCPP on environmental taxes and fees, with a significant positive regression coefficient. This result indicates that these policies increase environmental governance costs for enterprises. In column (2) of Table 6, the DID and Tax coefficients are significantly positive, indicating that environmental taxes and fees partially mediate the impact of LCCPP on enterprises’ green innovation levels.

4.3.2. R&D Investment

R&D investment can directly improve enterprises’ green innovation levels. In this regard, this study examines the mechanism by which LCCPP promotes R&D investment and enhances enterprises’ green innovation. Following the approach of Chen et al. [62], R&D expenditure is used as a proxy for R&D investment. Column (3) of Table 6 verifies the impact of LCCPP on R&D investment, and the regression coefficient is significantly positive. This result indicates that these policies have increased enterprise R&D investment. The DID and R&D coefficients in column (4) of Table 6 are significantly positive, indicating the partial mediating role of R&D investment in the impact of LCCPP on enterprises’ green innovation.

4.3.3. Digital Transformation

Digital transformation is an important means for enterprises to achieve green transformation in the digital economy context. In this regard, this study examines the mechanism by which LCCPP promotes digital transformation in enterprises and enhances their level of green innovation. Following Heubeck [63] and Hinings et al. [64], the total amount of intangible assets disclosed in the year-end financial reports of listed enterprises, specifically those related to digital transformation, is used to measure the level of digital transformation in enterprises. Specifically, when the itemized details of intangible assets include keywords such as “software”, “network”, “client”, “management system”, and “smart platform”, including relevant patents, the specific item is defined as an “intangible asset related to digital technology”. The sum of multiple such items in the same company and fiscal year represents the proxy variable for the degree of digital transformation in enterprises (Digital).
Column (3) of Table 6 verifies the impact of LCCPP on digital transformation in enterprises. The regression coefficient is significantly positive, indicating that these policies effectively promote the digital transformation of enterprises as environmental regulatory measures. The DID and Digital coefficients in column (4) of Table 6 are significantly positive. This result suggests that digital transformation plays a partial mediating role in the impact of LCCPP on enterprises’ green innovation.

5. Heterogeneity Analysis

5.1. Regional Heterogeneity

Considering that LCCPP may have differentiated impacts on enterprises’ green innovation across different regions [65], this study classifies the sample enterprises into eastern, central, and western regions for conducting tests. Columns (1)–(3) of Table 7 show the results. The findings indicate that LCCPP has a significant positive promoting effect on the green innovation level of enterprises in the eastern region, but its impact on enterprises in the central and western regions is relatively small and insignificant.

5.2. Heterogeneity in Financing Constraints

Considering that the pilot of low-carbon cities may have differential impacts on the green innovation levels of enterprises with different financing constraints [66], this study adopts the approach used by Zhang et al. [67]. The FC index is constructed as a proxy for firms’ financing constraints, and enterprises are categorized into two groups, with high and low financing constraints, based on whether they are above the mean, and a regression analysis is conducted. Enterprises are classified into two groups based on their level of financing constraints, namely, low and high financing constraints, and a regression analysis is conducted. Columns (4) and (5) of Table 7 depict the results. The results indicate that LCCPP has a significantly positive effect on the green innovation levels of enterprises with low financing constraints but a negative and insignificant effect on those with high financing constraints. This difference may be attributable to the timely access to green innovation funds for enterprises with low financing constraints.

5.3. Heterogeneity in Types of Production Factors

Considering that the pilot of low-carbon cities may have differential impacts on the green innovation levels of enterprises with different types of production factors [68], this study employs the method used by Yang et al. [60]. Enterprises are classified into three groups based on their types of production factors before a regression analysis is conducted: technology-intensive, labor-intensive, and capital-intensive. The following two variables are selected as classification indicators: fixed asset ratio (net fixed assets/average total assets) and R&D expenditure and remuneration ratio (R&D expenditure/remuneration payable to employees). We use the sum of squared deviations method of cluster analysis to classify the samples, which can minimize the differences between the samples within the classified groups and maximize the differences between the samples between the groups, and thus it is widely used in cluster analysis research with a fixed number of classes. First, according to the size of the proportion of fixed assets, the larger proportion is classified as capital-intensive industries, indicating that their capital is more important; second, according to the ratio of R&D expenditure and remuneration, the higher proportion indicates that technology research and development is more important than the labor factor to the enterprise, and thus belongs to technology-intensive industries, while the rest belong to labor-intensive industries.
Columns (1)–(3) of Table 8 outline the results. The results indicate that LCCPP has a significantly positive effect on the green innovation levels of technology- and labor-intensive enterprises, with a high effect on the former type. However, the impact on capital-intensive enterprises’ green innovation levels is not significant. The reason may be that technology-intensive enterprises have higher technological endowments and advantages, making it easier for them to promote green innovation through digital transformation mechanisms in the digital economy context. Labor-intensive enterprises can substitute labor with digital transformation technologies, such as big data and artificial intelligence, thereby saving labor costs and investing further in green innovation. From another perspective, capital-intensive enterprises have their funds concentrated on assets, making it highly challenging for them to undergo digital transformation and allocate further funds for green innovation.
Following the approach of a previous study [69], an index is constructed to measure the level of the urban digital economy to verify the regression results regarding the heterogeneity of production factors. Taking into account the availability of relevant data at the city level, the comprehensive development level of the digital economy is measured in terms of internet development and digital financial inclusion. Four aspects of indicators, namely, internet penetration rate, relevant practitioners, relevant outputs, and cell phone penetration rate, are used to measure internet development at the city level. The actual contents corresponding to the above four indicators are the number of internet broadband access users per 100 people, the proportion of employees in the computer service and software industry out of employees in urban units, the total amount of telecommunication services per capita, and the number of cell phone users per 100 people. Digital financial development uses the China Digital Inclusive Financial Index. Based on the above five indicators, the entropy method is used to measure the level of digital economic development of prefecture-level cities.
Based on whether the digital transformation level of the region in which the enterprises are located is higher than the average, enterprises are classified into two groups before a regression analysis is conducted: high- and low-level digital economy. Columns (4) and (5) of Table 8 show the results. The results indicate that LCCPP has a high promotion effect on the green innovation levels of enterprises located in regions with a high level of digital economy penetration. This result indicates that the promotion effect of the pilot policy on enterprises’ green innovation levels is related to the digital economy level in the region in which the enterprises are located. The heterogeneity in the types of production factors among enterprises is likely a result of their digital transformation mechanisms.

6. Conclusions and Policy Implications

6.1. Conclusions

Green innovation is crucial for addressing global climate change. Green innovation can reduce greenhouse gas emissions, promote sustainable development, create economic growth and job opportunities, and improve the quality of social life. This study uses the number of green invention patent applications submitted by Chinese A-share listed enterprises between 2003 and 2021 as a proxy for enterprises’ green innovation. Taking LCCPP as a quasi-natural experiment, this study employs a DID approach to evaluate the impact of low-carbon city construction on enterprises’ green innovation and examines the underlying mechanisms and heterogeneity. The main conclusions are as follows: (1) After LCCPP implementation in the experimental areas, enterprises’ green innovation levels in the pilot cities significantly increased by 2.6737, which corresponds to a 74.64% improvement over the mean level (3.582). After conducting a series of robustness tests—such as parallel trends assumption test, placebo test, and PSM—controlling for other policies, and excluding outliers, the above conclusion still holds. (2) The mediation analysis reveals that LCCPP improves enterprises’ green innovation by increasing environmental costs, boosting R&D investment, and promoting digital transformation. (3) Heterogeneity analysis indicates that the promotion effect of LCCPP on green innovation is highly pronounced for enterprises in eastern regions, for those with low financing constraints, and for technology-intensive enterprises. (4) The promotion effect of LCCPP on enterprises’ green innovation is closely positively correlated with the digital economy level in the region in which the enterprises are located.

6.2. Policy Implications

Based on the research findings, the following policy suggestions are provided to enhance enterprises’ green innovation:
(1)
Considering that LCCPP can effectively improve enterprises’ green innovation levels, the following measures can be adopted. First, the government can gradually expand the scope of the pilot and improve the policy for low-carbon city pilot construction based on the achievements in the current pilot cities, applying the policy to more cities. This approach can benefit many enterprises from LCCPP and enhance enterprises’ green innovation levels nationwide. Second, the government can organize experts and representatives from enterprises to summarize and share the experiences gained from the pilot cities. Many regions can learn from the successful experiences of pilot cities to improve their local green innovation levels by organizing seminars, experience exchange meetings, and other activities. Third, the government can select successful cases of enterprises for demonstrating and inspiring among other enterprises. This case can make more enterprises aware of green innovation and encourage them to join the ranks of low-carbon city construction. Fourth, the government can strengthen the supervision and evaluation of the pilot cities, promptly identifying problems and providing suggestions for improvement. Additionally, the achievements can be summarized to better guide and promote the implementation and improvement of the pilot policies by evaluating the level of green innovation in the pilot cities;
(2)
Considering that promoting the digital transformation of enterprises is an important mechanism for LCCPP to improve enterprises’ green innovation, the following measures can be adopted. First, the government can establish specialized digital technology support institutions to provide consulting, guidance, and technical support services for enterprises’ digital transformation. Examples include helping enterprises understand the potential benefits of digital technology, developing digital transformation plans, and promoting the application of digital technology. Second, the government can provide loans, subsidies, or other economic incentives for the digital transformation of enterprises through funding support programs. Further, incentive mechanisms can be established to reward enterprises that have made significant achievements in digital transformation, which will encourage more enterprises to actively participate in digital transformation. Third, the government can establish digital transformation demonstration bases in low-carbon cities to provide practical demonstrations so that enterprises can experience the effects of digital technology applications and learn from previous successful experiences. Fourth, the government can promote collaboration and alliance-building among enterprises to share resources and experiences in digital transformation. Fifth, the government can establish an evaluation system for digital transformation to assess and monitor the digital level of enterprises. The evaluation of enterprise digital transformation can enable the timely identification of problems and deficiencies and prompt the provision of policy support and guidance to promote the improvement of enterprises’ green innovation levels;
(3)
For the central and western regions, enterprises with high financing constraints, and asset-intensive enterprises, we propose the following measures. The insignificant improvement of green innovation levels in western China may be attributable to resource endowment and talent shortages, as well as technological underdevelopment. First, the government can provide technical support to enterprises in the central and western regions by establishing technology innovation funds and technology transfer centers. Renowned domestic and international green technology enterprises, experts, scholars, and others could be invited to help enterprises in these regions adopt advanced green technologies and improve their green innovation capabilities. Second, the government can encourage enterprises to invest in green innovation projects by guiding the inflow of private capital to alleviate the financing constraints faced by enterprises. Tax incentives, green innovation funds, and other measures can be implemented to attract more social capital investment in green innovation. Third, the government can establish a green finance mechanism to provide green loans, green bonds, and other green financial products for asset-intensive enterprises to motivate enterprises to increase their investment in green innovation;
(4)
The findings of this paper have certain policy implications for developed and developing countries other than China. Many developed countries are also implementing green and low-carbon transitions, and have set national-level carbon emission reduction targets, such as the German government, which has set medium- and long-term GHG emission reduction targets by law [70]. According to the findings of this paper, developed countries already have a high economic level and can promote green innovation in enterprises through environmental regulation policies. For example, they can formulate tax incentives to encourage enterprises to invest in green innovation. By reducing or exempting taxes related to the R&D and application of green technologies, enterprises are incentivized to increase their investment in environmental protection and promote the development of green innovation. In addition, developed countries can also combine the development of their digital economy to promote enterprise green innovation, such as increasing investment in digital infrastructure to promote the digital transformation of enterprises, as well as through the provision of financial support and technical guidance to help enterprises accelerate the pace of digital transformation, improve productivity and reduce carbon emissions. Developing countries, on the other hand, which have a lower level of economic development than developed countries, could consider focusing their policy measures on developing the digital economy, so to create new points of economic growth while at the same time taking into account green development. For example, developing countries can introduce and absorb advanced digital and green technologies through enhanced cooperation with developed countries and international organizations, and promote the technological upgrading and green innovation capacity of local enterprises. At the same time, developing countries should also focus on building digital infrastructure and enhancing network coverage. Stable internet connectivity and digital infrastructure should be provided to enterprises to support and facilitate their implementation of digital transformation.

6.3. Research Limitations and Future Directions

This study examines the relationship between low-carbon city construction and enterprises’ green innovation using the DID model; however, it has certain limitations. First, this study explores the industry synergy effects of low-carbon city construction on enterprises’ green innovation levels. Future research can investigate the impact of LCCPP on industry synergy effects among enterprises. Further, whether the policies promote environmental cooperation, resource sharing, and technology transfer among enterprises can be explored by analyzing the influence of policies on the supply chain. Second, the study examines the strategic transformation paths of enterprises’ green innovation levels influenced by low-carbon city construction. Future research can also investigate the impact of LCCPP on the strategic transformation paths of enterprises, including enterprises’ formulation of green development strategies, innovation of green products and services, and adjustments to internal management systems. The research can examine whether the policies guide enterprises to adjust and transform their strategies in low-carbon, environmentally friendly, and sustainable development directions.

Author Contributions

Conceptualization, Y.S. and Z.B.; methodology, Y.S.; software, Y.S.; validation, N.M., Z.B. and W.T.; formal analysis, Y.S.; investigation, Y.S.; resources, Y.S.; data curation, Y.S.; writing—original draft preparation, Y.S.; writing—review and editing, Y.S.; visualization, Y.S.; supervision, Y.S.; project administration, Y.S. All authors have read and agreed to the published version of the manuscript.

Funding

This study was funded by CUFE postgraduate students support program for the integration of research and teaching (grant number: 202225).

Institutional Review Board Statement

Not applicable.

Informed Consent Statement

Not applicable.

Data Availability Statement

The data can be obtained from the corresponding author upon reasonable request.

Conflicts of Interest

The authors declare no conflicts of interest.

References

  1. International Energy Agency. CO2 Emissions from Fuel Combustion Highlights, 2020 Edition; IEA Publications: Paris, France, 2020. [Google Scholar]
  2. Forster, P.M.; Smith, C.J.; Walsh, T. Indicators of Global Climate Change 2022: Annual update of large-scale indicators of the state of the climate system and human influence. Earth Syst. Sci. Data 2023, 15, 2295–2327. [Google Scholar] [CrossRef]
  3. Rhodes, E.; Wield, D. Implementing New Technologies: Innovation and the Management of Technology; Wiley Blackwell: Hoboken, NJ, USA, 1994. [Google Scholar]
  4. Porter, M.E.; Linde, C. Toward a new conception of the environment-competitiveness relationship. J. Econ. Perspect. 1995, 9, 97–118. [Google Scholar] [CrossRef]
  5. Gollop, F.M.; Roberts, M.J. Environmental regulations and productivity growth: The case of fossil-fueled electric power generation. J. Political Econ. 1983, 91, 654–674. [Google Scholar] [CrossRef]
  6. Wagner, M. On the relationship between environmental management, environmental innovation and patenting: Evidence from German manufacturing firms. Res. Policy 2007, 36, 1587–1602. [Google Scholar] [CrossRef]
  7. Milani, S. The impact of environmental policy stringency on industrial R&D conditional on pollution intensity and relocation costs. Environ. Resour. Econ. 2017, 68, 595–620. [Google Scholar]
  8. Brunnermeier, S.B.; Cohen, M.A. Determinants of environmental innovation in US manufacturing industries. J. Environ. Econ. Manag. 2003, 45, 278–293. [Google Scholar] [CrossRef]
  9. Frondel, M.; Horbach, J.; Rennings, K. End-of-pipe or cleaner production? An empirical comparison of environmental innovation decisions across OECD countries. Bus. Strategy Environ. 2007, 16, 571–584. [Google Scholar] [CrossRef]
  10. Hille, E.; Althammer, W.; Diederich, H. Environmental regulation and innovation in renewable energy technologies: Does the policy instrument matter? Technol. Forecast. Soc. Chang. 2020, 153, 119921. [Google Scholar] [CrossRef]
  11. Lanjouw, J.O.; Mody, A. Innovation and the international diffusion of environmentally responsive technology. Res. Policy 1996, 25, 549–571. [Google Scholar] [CrossRef]
  12. Scherer, F.M.; Harhoff, D. Technology policy for a world of skew-distributed outcomes. Res. Policy 2000, 29, 559–566. [Google Scholar] [CrossRef]
  13. Lanoie, P.; Patry, M.; Lajeunesse, R. Environmental regulation and productivity: Testing the porter hypothesis. J. Product. Anal. 2008, 30, 121–128. [Google Scholar] [CrossRef]
  14. Chen, W.; Liu, J.; Ning, X.; Du, L.; Zhang, Y.; Wu, C. Low-Carbon City Building and Green Development: New Evidence from Quasi Natural Experiments from 277 Cities in China. Sustainability 2023, 15, 11609. [Google Scholar] [CrossRef]
  15. Zhao, C.; Wang, B. Does China’s low-carbon pilot policy promote foreign direct investment? An empirical study based on city-level panel data of China. Sustainability 2021, 13, 10848. [Google Scholar] [CrossRef]
  16. Pan, A.; Zhang, W.; Shi, X. Climate policy and low-carbon innovation: Evidence from low-carbon city pilots in China. Energy Econ. 2022, 112, 106129. [Google Scholar] [CrossRef]
  17. Shen, W.; Wang, Y.; Luo, W. Does the Porter hypothesis hold in China? Evidence from the low-carbon city pilot policy. J. Appl. Econ. 2021, 24, 246–269. [Google Scholar] [CrossRef]
  18. Wang, Y.; Song, Q.; He, J. Developing low-carbon cities through pilots. Clim. Policy 2015, 15 (Suppl. S1), S81–S103. [Google Scholar] [CrossRef]
  19. Zhu, C.; Lee, C.C. The effects of low-carbon pilot policy on technological innovation: Evidence from prefecture-level data in China. Technol. Forecast. Soc. Chang. 2022, 183, 121955. [Google Scholar] [CrossRef]
  20. Han, D.; Liu, M. How does the digital economy contribute to regional green development in China? Evidence-based on the intermediary effect of technological innovation. Sustainability 2022, 14, 11147. [Google Scholar] [CrossRef]
  21. Zhao, S.; Zhang, L.; An, H. Has China’s low-carbon strategy pushed forward the digital transformation of manufacturing enterprises? Evidence from the low-carbon city pilot policy. Environ. Impact Assess. Rev. 2023, 102, 107184. [Google Scholar] [CrossRef]
  22. Wang, L.; Shao, J.; Ma, Y. Does China’s low-carbon city pilot policy improve energy efficiency? Energy 2023, 283, 129048. [Google Scholar] [CrossRef]
  23. Cai, W.; Li, G. The drivers of eco-innovation and its impact on performance: Evidence from China. J. Clean. Prod. 2018, 176, 110–118. [Google Scholar] [CrossRef]
  24. Liu, Z.; Yang, L.; Fan, L. Induced Effect of Environmental Regulation on Green Innovation: Evidence from the Increasing-Block Pricing Scheme. Int. J. Environ. Res. Public Health 2021, 18, 2620. [Google Scholar] [CrossRef] [PubMed]
  25. Shao, K.C.; Wang, X. Do government subsidies promote enterprise innovation?—Evidence from Chinese listed companies. J. Innov. Knowl. 2023, 8, 100436. [Google Scholar] [CrossRef]
  26. Xu, J.; Shang, Y.; Yu, W. Intellectual capital, technological innovation and firm performance: Evidence from China’s manufacturing sector. Sustainability 2019, 11, 5328. [Google Scholar] [CrossRef]
  27. Guo, S. Exploring low-carbon pilot city policy implementation: Evidence from China. Clim. Policy 2022, 23, 1045–1057. [Google Scholar] [CrossRef]
  28. Zhu, J.; Baker, J.S.; Song, Z.; Yue, X.-G.; Li, W. Government regulatory policies for digital transformation in small and medium-sized manufacturing enterprises: An evolutionary game analysis. Humanit. Soc. Sci. Commun. 2023, 10, 751. [Google Scholar] [CrossRef]
  29. Tilson, D.; Lyytinen, K.; Sørensen, C. Research commentary—Digital infrastructures: The missing IS research agenda. Inf. Syst. Res. 2010, 21, 748–759. [Google Scholar] [CrossRef]
  30. Brynjolfsson, E.; McAfee, A. The Second Machine Age: Work, Progress, and Prosperity in a Time of Brilliant Technologies; W. W. Norton Company: New York, NY, USA, 2014. [Google Scholar]
  31. Sarkis, J. A strategic decision framework for green supply chain management. J. Clean. Prod. 2003, 11, 397–409. [Google Scholar] [CrossRef]
  32. Rehman, M.H.; Yaqoob, I.; Salah, K. The role of big data analytics in industrial Internet of Things. Future Gener. Comput. Syst. 2019, 99, 247–259. [Google Scholar] [CrossRef]
  33. Xu, J.; Yu, Y.; Zhang, M. Impacts of digital transformation on eco-innovation and sustainable performance: Evidence from Chinese manufacturing companies. J. Clean. Prod. 2023, 393, 136278. [Google Scholar] [CrossRef]
  34. Hofmann, E.; Sternberg, H.; Chen, H. Supply chain management and Industry 4.0: Conducting research in the digital age. Int. J. Phys. Distrib. Logist. Manag. 2019, 49, 945–955. [Google Scholar] [CrossRef]
  35. Zhu, J.; Feng, T.; Lu, Y.; Jiang, W. Using blockchain or not? A focal firm’s blockchain strategy in the context of carbon emission reduction technology innovation. Bus. Strategy Environ. 2024. [Google Scholar] [CrossRef]
  36. Li, Q.; Song, J.; Wang, E. Economic growth and pollutant emissions in China: A spatial econometric analysis. Stoch. Environ. Res. Risk Assess. 2014, 28, 429–442. [Google Scholar] [CrossRef]
  37. Zhao, X.; Sun, B. The influence of Chinese environmental regulation on corporation innovation and competitiveness. J. Clean. Prod. 2016, 112, 1528–1536. [Google Scholar] [CrossRef]
  38. Wang, T.; Song, Z.; Zhou, J. Low-carbon transition and green innovation: Evidence from pilot cities in China. Sustainability 2022, 14, 7264. [Google Scholar] [CrossRef]
  39. Qiu, L.; Jie, X.; Wang, Y. Green product innovation, green dynamic capability, and competitive advantage: Evidence from Chinese manufacturing enterprises. Corp. Soc. Responsib. Environ. Manag. 2020, 27, 146–165. [Google Scholar] [CrossRef]
  40. Shi, Y.; Guan, Y.; Li, L. Impact of Low-Carbon City Policy on Enterprise Investment Efficiency: Based on the Heterogeneity of Chinese Urban Culture. J. Environ. Public Health 2022, 2022, 1998278. [Google Scholar] [CrossRef] [PubMed]
  41. Yu, C.H.; Wu, X.; Zhang, D. Demand for green finance: Resolving financing constraints on green innovation in China. Energy Policy 2021, 153, 112255. [Google Scholar] [CrossRef]
  42. Chen, H.; Zhong, T.; Lee, J.Y. Capacity reduction pressure, financing constraints, and enterprise sustainable innovation investment: Evidence from Chinese manufacturing companies. Sustainability 2020, 12, 10472. [Google Scholar] [CrossRef]
  43. Zhao, Q.; Li, Z.; Zhao, Z. Industrial policy and innovation capability of strategic emerging industries: Empirical evidence from chinese new energy vehicle industry. Sustainability 2019, 11, 2785. [Google Scholar] [CrossRef]
  44. Cao, Y.; You, J. The contribution of environmental regulation to technological innovation and quality competitiveness: An empirical study based on Chinese manufacturing enterprises. Chin. Manag. Stud. 2017, 11, 51–71. [Google Scholar] [CrossRef]
  45. Cai, X.; Zhu, B.; Zhang, H. Can direct environmental regulation promote green technology innovation in heavily polluting industries? Evidence from Chinese listed companies. Sci. Total Environ. 2020, 746, 140810. [Google Scholar] [CrossRef] [PubMed]
  46. Nie, G.Q.; Zhu, Y.F.; Wu, W.P. Impact of voluntary environmental regulation on green technological innovation: Evidence from Chinese manufacturing enterprises. Front. Energy Res. 2022, 10, 889037. [Google Scholar] [CrossRef]
  47. Li, L.; Msaad, H.; Sun, H. Green innovation and business sustainability: New evidence from energy intensive industry in China. Int. J. Environ. Res. Public Health 2020, 17, 7826. [Google Scholar] [CrossRef] [PubMed]
  48. Lin, W.L.; Cheah, J.H.; Azali, M.; Ho, J.A.; Yip, N. Does firm size matter? Evidence on the impact of the green innovation strategy on corporate financial performance in the automotive sector. J. Clean. Prod. 2019, 229, 974–988. [Google Scholar] [CrossRef]
  49. Li, D.; Zheng, M.; Cao, C.; Chen, X.; Ren, S.; Huang, M. The impact of legitimacy pressure and corporate profitability on green innovation: Evidence from China top 100. J. Clean. Prod. 2017, 141, 41–49. [Google Scholar] [CrossRef]
  50. Leyva-de la Hiz, D.I.; Bolívar-Ramos, M.T. The inverted U relationship between green innovative activities and enterprises’ market-based performance: The impact of firm age. Technovation 2022, 110, 102372. [Google Scholar] [CrossRef]
  51. Wu, B.; Chen, F.; Li, L.; Xu, L.; Liu, Z.; Wu, Y. Institutional investor ESG activism and exploratory green innovation: Unpacking the heterogeneous responses of family enterprises across intergenerational contexts. Br. Account. Rev. 2024, 101324. [Google Scholar] [CrossRef]
  52. Farza, K.; Ftiti, Z.; Hlioui, Z.; Louhichi, W.; Omri, A. Does it pay to go green? The environmental innovation effect on corporate financial performance. J. Environ. Manag. 2021, 300, 113695. [Google Scholar] [CrossRef]
  53. Hu, Y.; Li, Z.; Guo, J. Does Independent Directors’ Interlocking Network Position Affect Green Innovation? Sustainability 2024, 16, 1089. [Google Scholar] [CrossRef]
  54. Borsatto, J.M.L.S.; Amui, L.B.L. Green innovation: Unfolding the relation with environmental regulations and competitiveness. Resour. Conserv. Recycl. 2019, 149, 445–454. [Google Scholar] [CrossRef]
  55. Peng, W.; Yin, Y.; Kuang, C.; Wen, Z.; Kuang, J. Spatial spillover effect of green innovation on economic development quality in China: Evidence from a panel data of 270 prefecture-level and above cities. Sustain. Cities Soc. 2021, 69, 102863. [Google Scholar] [CrossRef]
  56. Bai, C.; Liu, H.; Zhang, R. Blessing or curse? Market-driven environmental regulation and enterprises’ total factor productivity: Evidence from China’s carbon market pilots. Energy Econ. 2023, 117, 106432. [Google Scholar] [CrossRef]
  57. Shao, X. Chinese OFDI responses to the B&R initiative: Evidence from a quasi-natural experiment. China Econ. Rev. 2020, 61, 101435. [Google Scholar]
  58. Ho, K.C.; Yan, C.; Mao, Z. Corporate sustainability policies and corporate investment efficiency: Evidence from the quasi-natural experiment in China. Energy Econ. 2023, 127, 107050. [Google Scholar] [CrossRef]
  59. Wu, Q.; Wang, Y. How does carbon emission price stimulate enterprises’ total factor productivity? Insights from China’s emission trading scheme pilots. Energy Econ. 2022, 109, 105990. [Google Scholar] [CrossRef]
  60. Yang, S.; Jahanger, A.; Hossain, M.R. How effective has the low-carbon city pilot policy been as an environmental intervention in curbing pollution? Evidence from Chinese industrial enterprises. Energy Econ. 2023, 118, 106523. [Google Scholar] [CrossRef]
  61. Long, F.; Lin, F.; Ge, C. Impact of China’s environmental protection tax on corporate performance: Empirical data from heavily polluting industries. Environ. Impact Assess. Rev. 2022, 97, 106892. [Google Scholar] [CrossRef]
  62. Hsu, C.C.; Quang-Thanh, N.; Chien, F.S. Evaluating green innovation and performance of financial development: Mediating concerns of environmental regulation. Environ. Sci. Pollut. Res. 2021, 28, 57386–57397. [Google Scholar] [CrossRef] [PubMed]
  63. Heubeck, T. Managerial capabilities as facilitators of digital transformation? Dynamic managerial capabilities as antecedents to digital business model transformation and firm performance. Digit. Bus. 2023, 3, 100053. [Google Scholar] [CrossRef]
  64. Hinings, B.; Gegenhuber, T.; Greenwood, R. Digital innovation and transformation: An institutional perspective. Inf. Organ. 2018, 28, 52–61. [Google Scholar] [CrossRef]
  65. Yin, H.; Qian, Y.; Zhang, B. Urban construction and firm green innovation: Evidence from China’s low-carbon pilot city initiative. Pac. Basin Financ. J. 2023, 80, 102070. [Google Scholar] [CrossRef]
  66. Yu, H.; Peng, F.; Yuan, T. The effect of low-carbon pilot policy on low-carbon technological innovation in China: Reexamining the porter hypothesis using difference-in-difference-in-differences strategy. J. Innov. Knowl. 2023, 8, 100392. [Google Scholar] [CrossRef]
  67. Zhang, B.; Yu, L.; Sun, C. How does urban environmental legislation guide the green transition of enterprises? Based on the perspective of enterprises’ green total factor productivity. Energy Econ. 2022, 110, 106032. [Google Scholar] [CrossRef]
  68. Li, Y.; Liu, J.; Wang, X. Can Low-Carbon Pilot City Policies Improve Energy Efficiency? Evidence from China. Sustainability 2023, 15, 1857. [Google Scholar] [CrossRef]
  69. Xu, Y.; Li, T. Measuring digital economy in China. Natl. Account. Rev. 2022, 4, 251–272. [Google Scholar] [CrossRef]
  70. Zhu, J.; Lu, Y.; Song, Z.; Shao, X.; Yue, X.-G. The choice of green manufacturing modes under carbon tax and carbon quota. J. Clean. Prod. 2023, 384, 135336. [Google Scholar] [CrossRef]
Figure 1. Flowchart of the effects of LCCPP on enterprises’ green innovation levels.
Sustainability 16 01760 g001
Figure 2. Parallel trend tests.
Sustainability 16 01760 g002
Figure 3. Placebo tests.
Sustainability 16 01760 g003
Figure 4. Probability distribution density function of the PSM score.
Sustainability 16 01760 g004
Table 1. Variables and descriptive statistics.
VariableObsMeanStd. Dev.MinMax
Green_Inv34,7023.58224.450978
DID34,7020.5400.49801
Size34,70222.111.33117.6428.64
Growth34,7024.666727.1−0.984134,607
Age34,7022.8030.3950.6934.159
Inst34,70248.2224.910.0001157.1
Fixed34,7020.2260.170−0.2060.971
Indep34,70237.125.7580100
Herfindah34,7020.1650.1210.00010.810
Pgdp34,70211.210.7097.77113.06
Popd34,7020.09180.06770.00020.316
Table 2. Baseline regression results.
Variable(1)(2)(3)
Green_InvGreen_InvGreen_Inv
DID2.4296 ***2.6183 ***2.6737 ***
(0.7637)(0.8055)(0.8104)
Size 2.5800 ***2.5867 ***
(0.8737)(0.8721)
Growth 0.000010.00001
(0.00001)(0.00001)
Age 12.842312.8787
(8.2378)(8.2522)
Inst −0.0098−0.0102
(0.0220)(0.0220)
Fixed 3.04893.0020
(2.2479)(2.2585)
Indep −0.0485−0.0499
(0.0476)(0.0482)
Herfindah 4.79514.8114
(5.8596)(5.8571)
Pgdp 0.5055
(0.6445)
Popd −13.1319
(10.8637)
Constant2.2866 ***−90.0611 ***−94.7248 ***
(0.4174)(23.5762)(26.2000)
Enterprise fixed effectsYESYESYES
Year fixed effectsYESYESYES
Observations34,70234,70234,702
F-statistic10.1218 ***7.0752 ***8.1151 ***
R-squared0.59430.59890.5990
Note: The SD of cluster adjustment at the city level is shown in parentheses; *** indicates significance at the 1% level. This note also applies to the following tables.
Table 3. PSM-DID regression results.
Variable(1)(2)
Green_InvGreen_Inv
DID2.3689 ***2.5900 ***
(0.7793)(0.8223)
Constant1.0705−94.8510 ***
(1.5627)(26.1153)
ControlsNOYES
Enterprise fixed effectsYESYES
Year fixed effectsYESYES
Observations3470234702
F-statistic6.1346 ***7.5454 ***
R-squared0.59430.5990
Note: *** indicates significance at the 1% level.
Table 5. Replacing the explained variable and troubleshooting outliers.
Variable(1)(2)(3)(4)
Green_UmaGreen_TotalGreen_InvGreen_Inv
DID1.0811 **3.7548 ***0.9172 ***0.2294 ***
(0.4144)(1.0932)(0.2363)(0.0850)
Constant−52.1233 ***−146.8480 ***−42.1230 ***−16.2348 ***
(17.5133)(38.0403)(8.9609)(3.3772)
ControlsYESYESYESYES
Enterprise fixed effectsYESYESYESYES
Year fixed effectsYESYESYESYES
Observations34,70234,70234,70234,702
F-statistic6.5037 ***10.0858 ***8.6482 ***12.1321 ***
R-squared0.66500.64250.63190.6371
Note: ** and *** indicate significance at the 5% and 1% levels, respectively.
Table 6. Mechanism tests.
Variable(1)(2)(3)(4)(5)(6)
TaxGreen_InvR&DGreen_InvDigitalGreen_Inv
DID0.0189 *2.5634 ***0.8111 ***2.0084 **0.1646 *2.3768 ***
(0.0099)(0.6278)(0.3032)(0.9536)(0.0841)(0.7909)
Tax 54.3572 ***
(5.9538)
R&D 1.3093 ***
(0.3543)
Digital 1.8035 **
(0.7242)
Constant−0.7972 ***−55.5643 **−63.4496 **−58.3187 **−3.9109 **−87.6714 ***
(0.2671)(23.9776)(25.7093)(27.8180)(1.4851)(24.0356)
ControlsYESYESYESYESYESYES
Enterprise fixed effectsYESYESYESYESYESYES
Year fixed effectsYESYESYESYESYESYES
Observations257302573025122251223470234702
F-statistic37.3749 ***28.1474 ***5.1807 ***7.1161 ***4.5918 ***9.5116 ***
R-squared0.84360.68730.75950.74850.66250.6050
Note: *, **, and *** indicate significance at the 10%, 5%, and 1% levels, respectively.
Table 7. Heterogeneity analysis of regional and financing constraints.
VariableHeterogeneity Analysis of Regional ConstraintsHeterogeneity Analysis of Financing Constraints
(1)(2)(3)(4)(5)
Eastern RegionCentral RegionWestern RegionLow Financing ConstraintsHigh Financing Constraints
DID3.4207 ***0.10940.14674.8018 **−0.0318
(1.2074)(0.7898)(0.6071)(1.8539)(0.2071)
Constant−130.6683 ***−31.0942 *−50.9501 ***−185.8603 ***−15.5529 ***
(40.9932)(16.4673)(16.4529)(57.2573)(5.0794)
ControlsYESYESYESYESYES
Enterprise fixed effectsYESYESYESYESYES
Year fixed effectsYESYESYESYESYES
Observations23,6265066601016,64118,061
F-statistic7.2396 ***3.6675 ***5.5431 ***3.8167 ***5.1211 ***
R-squared0.61470.44720.48560.62820.5349
Note: *, ** and *** indicate significance at the 10%, 5% and 1% levels, respectively.
Table 8. Heterogeneity analysis of factors of production and digital economy level.
Heterogeneity Analysis of Factors of ProductionHeterogeneity Analysis of Factors of Digital Economy Level
(1)(2)(3)(4)(5)
VariableTechnology-IntensiveLabor-IntensiveAsset-IntensiveHigh Digital Economy LevelLow Digital Economy Level
DID4.4077 ***1.0451 *3.81243.9762 ***1.3595 **
(1.3940)(0.6163)(3.3204)(1.2756)(0.6755)
Constant−174.8747 ***−49.9306−2.7012−122.1835 ***−50.1681 ***
(51.8482)(32.2605)(20.7153)(41.9807)(16.1569)
ControlsYESYESYESYESYES
Enterprise fixed effectsYESYESYESYESYES
Year fixed effectsYESYESYESYESYES
Observations148941333664721980014902
F-statistic86.1130 ***2.9455 ***111.2361 ***7.5108 ***2.7875 ***
R-squared0.55310.53830.74780.63120.5957
Note: *, **, and *** indicate significance at the 10%, 5%, and 1% levels, respectively.
Disclaimer/Publisher’s Note: The statements, opinions and data contained in all publications are solely those of the individual author(s) and contributor(s) and not of MDPI and/or the editor(s). MDPI and/or the editor(s) disclaim responsibility for any injury to people or property resulting from any ideas, methods, instructions or products referred to in the content.

