Article

Evaluation of the Development Level of Integration of Culture and Tourism in China’s Provinces under the Perspective of Spatial Interaction and Study of Influence Paths

1
College of Tourism, Huaqiao University, Quanzhou 362000, China
2
Center for Tourism Safe & Security Research of China Tourism Academy, Quanzhou 362000, China
*
Author to whom correspondence should be addressed.
Sustainability 2024, 16(5), 1756; https://doi.org/10.3390/su16051756
Submission received: 19 January 2024 / Revised: 9 February 2024 / Accepted: 15 February 2024 / Published: 21 February 2024
(This article belongs to the Section Tourism, Culture, and Heritage)

Abstract

:
In the new stage of the deep integration of culture and tourism, fully exploring its mechanism of action, spatial connection, and path of influence will be of great significance to the sustainable development of the integration of culture and tourism. In this paper, we analysed the mechanism of integration of culture and tourism with the help of systems theory, introduced the concept of spatial interaction to construct a new measurement model of integration of culture and tourism, and conducted empirical analyses with Chinese provinces as the target. We found that in the last decade, the tourism industry has been dominant, and most of the industrial elements have been clustered towards it. The centre of the spatial interaction network of culture and tourism is located in the area of the “North China Plain—Middle and Lower Yangtze River Plain” and moves towards the southwest over time. The northwestern and northeastern zones have become “desert zones” in the spatial interaction network of culture and tourism. The level of integration of culture and tourism peaked in 2018, with East China having a chronically higher level of integration. In addition, the deep integration of culture and tourism can be promoted through the combination of new development philosophies.

1. Introduction

The integration of culture and tourism is evolving from an existing reality towards an expected norm, and ultimately, it is advancing towards an inevitable future. In 2012, socialism with Chinese characteristics entered a new era, with significant changes in economic and social development, and China underwent historic transformations in its national endeavours. In this new context, along with the rapid development of tourism and culture, the integration of culture and tourism has gradually become a trend in industrial development. In 2018, after the 19th National Congress of the CPC, in order to meet the development needs of the culture and tourism industry, China’s Ministry of Culture and Tourism came into being to provide practical protection and effective promotion for the integrated development of culture and tourism from the administrative system and top-level design. In 2022, the report of the 20th National Congress of the CPC pointed out that China should insist on shaping tourism with culture and enhancing culture with tourism, advancing the deep integration of culture and tourism. Building on this, China can hasten the establishment of a new development pattern and promote high-quality development across industries. In this process, the integration of culture and tourism in China started from the basic integration stage of simple addition, gradually stepped into the improved integration stage of mutual promotion, and finally entered the new stage of deep integration of harmony and symbiosis. Through these processes, the depth and breadth of the integration of culture and tourism has been greatly enhanced. As a vast country, the development of cultural and tourism industries in various regions of China is very different, and there are inextricable links between regional industries. Therefore, in the face of such a complex systematic project as the integration of culture and tourism, at the beginning of the new stage, to fully clarify the process of integration of culture and tourism, sorting out the spatial connections of the industry, identifying the regional differences, and exploring the directions of the way forward, the depth of the integration of culture and tourism in China has a pioneering significance.
As cultural and tourism integration stages have evolved, academic research on this topic has been enriched, with shifting focal points. The conceptual definition of the integration of culture and tourism initially garnered attention. For example, scholars explored the relationship between culture and tourism, broadly agreeing that the two are interdependent [1]. Specifically, culture is the soul of tourism, and tourism can flourish with the help of culture [2]. Tourism is the carrier of culture, with culture relying on tourism to inherit it [3]. Despite reaching a preliminary consensus, there has yet to be unanimous agreement on the concept of the integration of culture and tourism [4]. Accordingly, scholars have begun to dissect the intrinsic mechanisms and evolutionary logic of the integration of culture and tourism from both horizontal (e.g., subject–object relationships) and vertical (e.g., industrial development) perspectives. For example, Fu believes that the integration of culture and tourism requires neither a simple connection between culture and tourism, nor a full merger of the two industries, but the construction of an interactive relationship between the subject and object of cultural tourism [5]. Wang proposed that the deep integration of culture and tourism in five dimensions, namely, products, formats, elements, markets, and values, will lead to the evolutionary logic of the integration system of culture and tourism from interaction to symbiosis [6]. Later, with the continuous development of the integration of culture and tourism at the practical level, scholars have gradually focused their research attention on the effectiveness evaluation of the integration of culture and tourism. Scholars have evaluated the development of the integration of culture and tourism at different geographical scales, including national [7], regional [8,9,10], provincial [11,12], municipal [13,14,15], and county [16] units. Among them, the coupling coordination model is the research method favoured by most scholars, but in recent studies, a few scholars have begun to use text mining methods [17] and a weighted TOPSIS model [18] for evaluation. On the basis of solving the problems of “what is integration, how to integrate, and how to integrate”, scholars have focused their research on the problem of “how to promote integration”. In this regard, existing research often uses panel models, geographical detectors, and spatial Durbin models to explore the issue, and it has found that economic development [19], capital investment [20], innovation level [21], infrastructure [22], and human capital [23] have important impacts on the integration of culture and tourism.
In summary, the current academic research on the integration of culture and tourism and its related issues has achieved fruitful research results, but there are still some weak links that need to be improved. On the one hand, in the effectiveness evaluation of the integration of culture and tourism, existing research has largely used coupling coordination models and their modified models [7,11,14] for empirical analysis, focusing on exploring the coordination state between culture and tourism. However, this approach may neglect the industrial connections between internal and external spaces in the process of the integration of culture and tourism, thereby weakening the geographical characteristics of the region. Considering the integration of culture and tourism as a process of integration and development between two abstract and isolated industries on the same plane may introduce certain biases into the evaluation results of the integration of culture and tourism in a specific region. On the other hand, existing research has focused more on the impact of a single factor [19,20,21,22,23] on the integration of culture and tourism. But, the causes of things are often complex and diverse, and there are also universal connections between factors. Only through the combination of multiple factors can we promote the deep integration of the cultural and tourism industries.
Therefore, in this paper, we aim to clarify the mechanism of the integration of culture and tourism by using systems theory. Specifically, in this paper, we tried to introduce the concept of spatial interaction into the assessment of the effectiveness of the integration of culture and tourism, and we constructed a model for measuring the degree of integration by combining it with an evaluation of the coordinated development state of the culture and tourism industry. The model was validated using data on the integration of culture and tourism from 30 provinces in China from 2012 to 2021 and the configurational paths for promoting the integration of culture and tourism under the new development philosophy were further explored. Finally, with this paper, we aim to offer new insights and methods for evaluating the integration of culture and tourism and to provide theoretical implications for the high-quality development of the deep integration of culture and tourism in China.

2. Theoretical Analysis

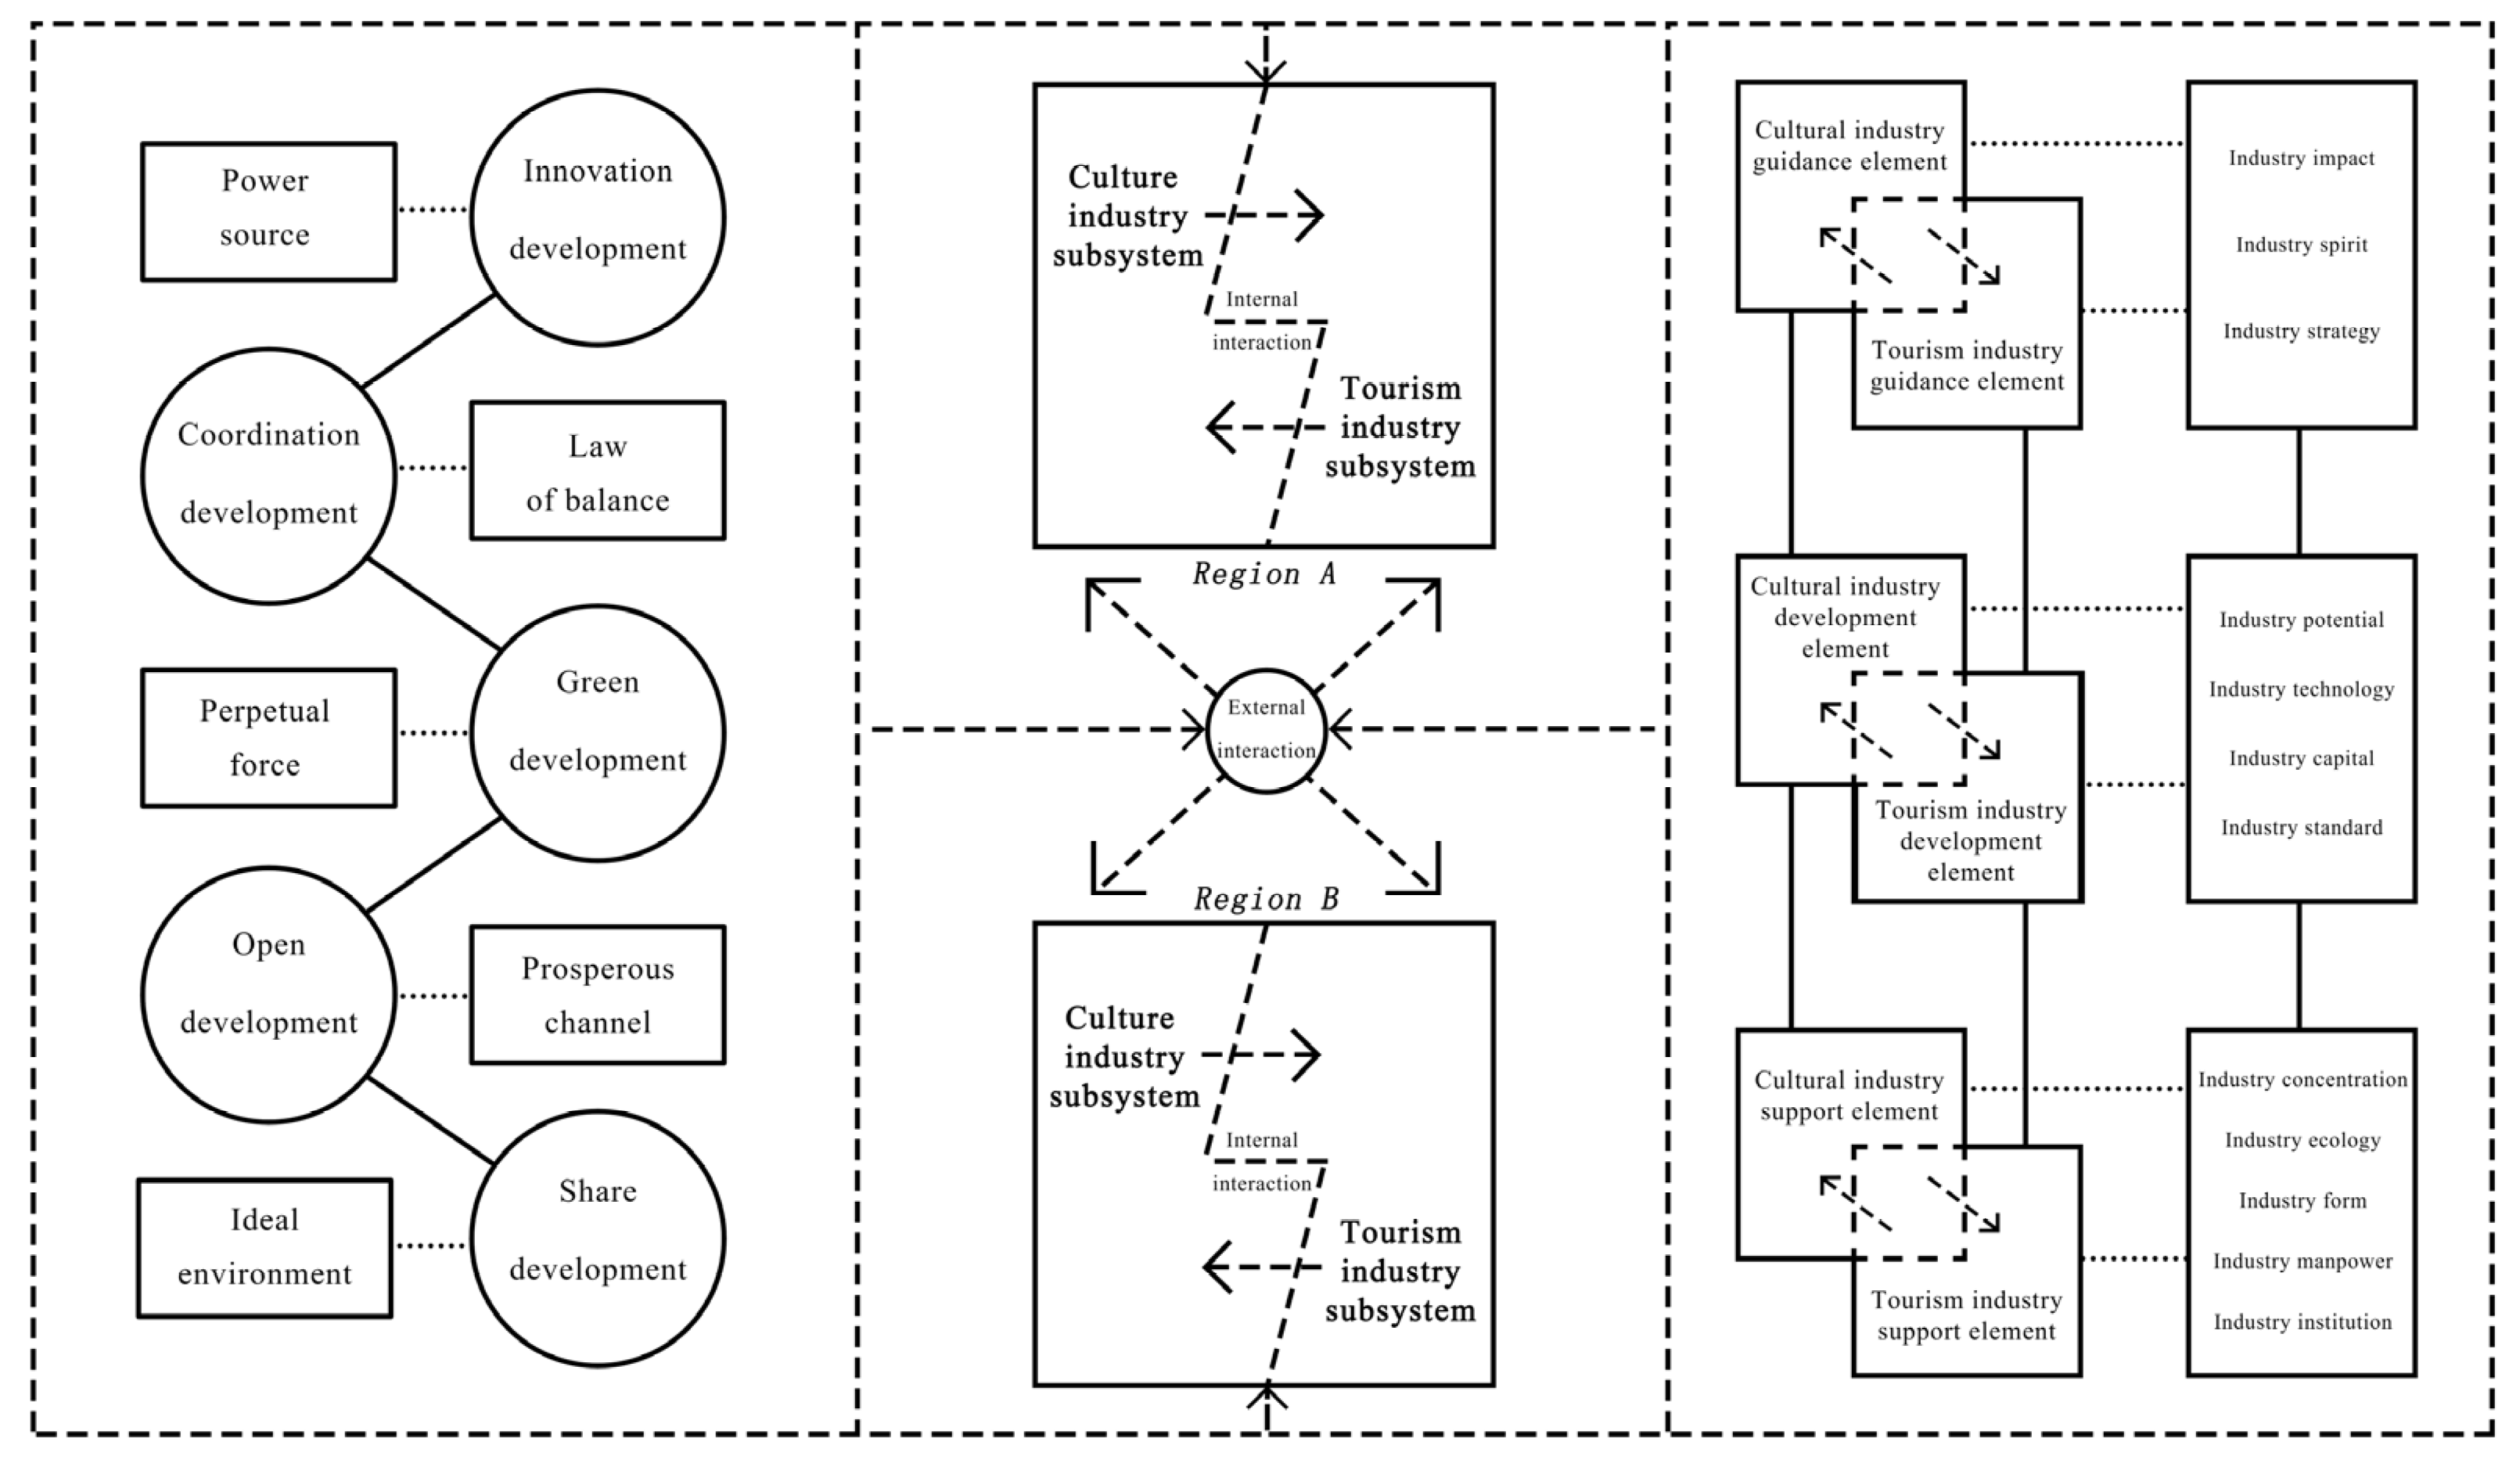
2.1. The Mechanism of the Integration System of Culture and Tourism from the Perspective of Systems Theory

Systems theory holds that a system is an organic whole with a certain function constituted by a number of elements linked in a certain structural form [24], containing four basic concepts: the system, element, structure, and function. In the process of development and evolution, the system presents the characteristics of openness, correlation, hierarchy, complexity, and wholeness, and it deduces the laws of structural–functional correlation, the law of rise and fall, and the law of optimal evolution [25]. Based on the characteristics and laws of systems theory, people can better guide practice and understand the evolution of things from a holistic perspective [26]. The integration of culture and tourism has strong comprehensive characteristics, and the logic and law of its development can be accurately sorted out from the perspective of systems theory. Thus, this paper mainly analyses the mechanism of the integration system of culture and tourism based on systems theory.
Since the preliminary consensus among scholars regarding the concept of the integration of culture and tourism belongs to the category of industrial integration [4], this paper defines the concept of the integration of culture and tourism from a systems theory perspective. Systems theory suggests that industry integration refers to the process where, under the auspices of technological advancement, competition and collaboration unfold among different constituent elements within two or more open industrial systems, collectively evolving to form an emerging industry [27]. Therefore, the integration of culture and tourism refers to the dynamic evolution process of the internal elements of the culture and tourism industry system in the spatial and temporal dimensions of interaction, interrelatedness, mutual constraints, cross-penetration and integration of each other, reconstruction, and co-construction of new industries.
The underlying logic [28] and intrinsic mechanism [29] for the integration of culture and tourism lie in the evident complementary and coupling relationships between the two. Therefore, the integration of culture and tourism is more than just a mere addition of the two sub-systems of the culture and tourism industry. Instead, it is a system where the various elements within these two sub-systems coordinate, complement, and couple with each other to drive the optimization and upgrade of the industrial structure, thereby forming an integration system with new functions. The internal elements of the integration system of culture and tourism mainly include the support elements, development elements, and guidance elements in the two sub-systems of the culture and tourism industry. The non-linear role between these elements will lead to the complementing and coupling of similar industrial elements, forming a fusion evolution mechanism within the system and promoting the orderly development of the system [30]. Through figurative transformation, this paper compares the integration system of culture and tourism to a car’s operation system. Among them, the support element, as a chassis, is the foundational structure of the integration system of culture and tourism, with the roles of carrying, maintaining, and linking other elements. The development element, as the engine, is the power source of the integration system of culture and tourism, with the roles of providing power and releasing potential. The guidance element, as a steering wheel, is the regulating mechanism of the integration system of culture and tourism, with the roles of direction leading and goal orientation (Figure 1). In addition, in the system of integration of culture and tourism, shaping tourism with culture and enhancing culture with tourism represent structural forms. Promoting the development of the culture and tourism industries is an essential system function.

2.2. Industrial Connections in the Integration of Culture and Tourism under the Spatial Interaction Effect

The first law of geography states that any element in space is spatially correlated [31], and the constituent elements in the integration system of culture and tourism are by no means an exception. In the context of regional integration, the socioeconomic links between regions are becoming increasingly close, and the degree of interdependence between industries is getting stronger and stronger [32]. The industrial development of a particular region will inevitably be affected by neighbouring regions, and industrial spatial interaction will occur. The cultural and tourism industries are highly interconnected, exhibiting a spatial synergy [33], spatial spillover [9], and spatial correlation effect [34]. In the process of industrial integration, the spatial interaction of industrial elements occurs first within a given region. At the same time, when the spatial conditions of the region cannot meet the development needs, the culture and tourism industry will break through the regional constraints and actively seek to establish spatial connections with other regions to achieve the cross-regional flow of industrial elements, thus contributing to the integration of culture and tourism.
Specifically, as regional integration deepens, economic ties between regions are becoming closer, and government cooperation and business interactions are becoming more frequent. Various cultural and tourism industry elements achieve cross-regional flow through channels of cooperation and interaction between regions. The region can optimize its culture and tourism industry structure and enhance the integration of culture and tourism by leveraging neighbouring areas’ culture and tourism industry elements. Moreover, under the current policy context in China, local governments are actively seeking to strengthen the development of the culture and tourism industry and promote its integration. They are keen to learn from the experiences, technologies, and management systems related to culture and tourism integration in neighbouring regions, actively engaging in culture and tourism spatial interactions, thereby attracting culture and tourism industry elements, achieving mutually beneficial complementarity, and driving the integration of culture and tourism. In addition, local governments take the initiative to interact with neighbouring regions to attract elements of the culture and tourism industry into their own interior, thereby achieving complementary advantages and promoting the level of integration of culture and tourism.

2.3. High-Quality Development of Integration of Culture and Tourism under the New Development Philosophy

A philosophy is the forerunner of action, and specific development philosophies always guide development practices [35]. The integration of culture and tourism, as an industry practice, inevitably requires the guidance of advanced philosophy. As a systematic theoretical framework, new development philosophy is China’s strategic guide for entering a new development stage, building a new development pattern, and promoting high-quality development. The new development philosophy contains five significant aspects: innovation development, coordination development, green development, open development, and shared development. Promoting the integration of culture and tourism through the new development philosophy not only adheres to the guiding principles of the development of China’s culture and tourism industry at this stage but also delineates the direction of the high-quality development of the integration of culture and tourism, as well as effectively promoting the construction of the new development pattern of the integration of culture and tourism.
Innovation development is the power source of integration of culture and tourism. Technological innovation is the intrinsic reason for industrial integration [36]. Through technological innovation, the consumption characteristics of the original products of the culture and tourism industry have been reshaped, production costs have been reduced, and market demand has been expanded, providing the source power and extension space for the integration of culture and tourism. Coordination development is the law of balance in the integration of culture and tourism. Coordination development emphasises holistic, proportional, and intrinsic convergent development, focuses on the overall improvement in the system and all elements, and pursues an ideal state of global optimisation, structural optimisation, and individual co-development [35]. As a complex system, the integration of culture and tourism needs to be coordinated in order to provide useful constraints and regulations on the behaviour of integration and to maintain benign interaction and dynamic equilibrium, so that it can give full play to its potential and develop in an orderly and stable structure. Green development is the perpetual force of integration of culture and tourism. Green development is a direct manifestation of the concept of sustainable development and is an inevitable choice for adjusting economic structures and transforming development modes. By embracing green development, we can effectively protect existing cultural and tourism resources and create new ones, providing an inexhaustible driving force for the integration of culture and tourism. At the same time, it can encourage the production mode within the integration of culture and tourism to undergo a low-carbon transformation and upgrade, promoting sustainable development. Open development is a prosperous channel for the integration of culture and tourism. Constructing a new development pattern with the domestic great cycle as the main body and the domestic and international double cycle promoting each other is the focus and direction of China’s economic development at this stage [37]. In the double-cycle development pattern, open development can continuously promote the culture and tourism industry to break down the obstacles to the cross-border flow of industrial elements, break through geographical restrictions, and stimulate the potential for the integration of culture and tourism. At the same time, it promotes the participation of the culture and tourism industry in global economic development, acquires new development space from global economic ties, and adds new vigour to the integration of culture and tourism. Shared development is the ideal environment for the integration of culture and tourism. Production and distribution are two links in economic activity, whereby production determines distribution and distribution reacts to production [38]. In accordance with the requirements of common wealth, improving the distribution system can have a promoting effect on high-quality development [37]. Culture is created by people, and tourism is also centred around people. Under shared development, a distribution system and distribution method centred around common wealth will stimulate the enthusiasm and creativity of the people, promote the high-quality development of the integration of culture and tourism, and realise the people’s common building and sharing with the integration of culture and tourism. In summary, the new development philosophy will guide the future integration of culture and tourism. However, as a comprehensive guiding philosophy, it often requires adjustments when applied to different regions. Therefore, we aim with this paper to explore the influence of the new development philosophy on the integration of culture and tourism across China’s provinces and to seek a suitable combination of new development philosophies for them.

3. Research Methods and Data Sources

The data analysis in this paper comprised three main steps (Figure 2). Firstly, by constructing an index system for the development status of culture and tourism industry elements, we evaluated the development status of the cultural and tourism industry across provinces using the cultural and tourism industry and comprehensive index method of fully aligned polygons. Secondly, we employed a model of the degree of integration measurement of culture and tourism to assess the spatial interaction intensity and integration degree of culture and tourism industries in each province. Thirdly, based on the construction of the indicator system, we adopted the fsQCA method to analyse the configurational impact of the new development philosophy on the development of the integration of culture and tourism.

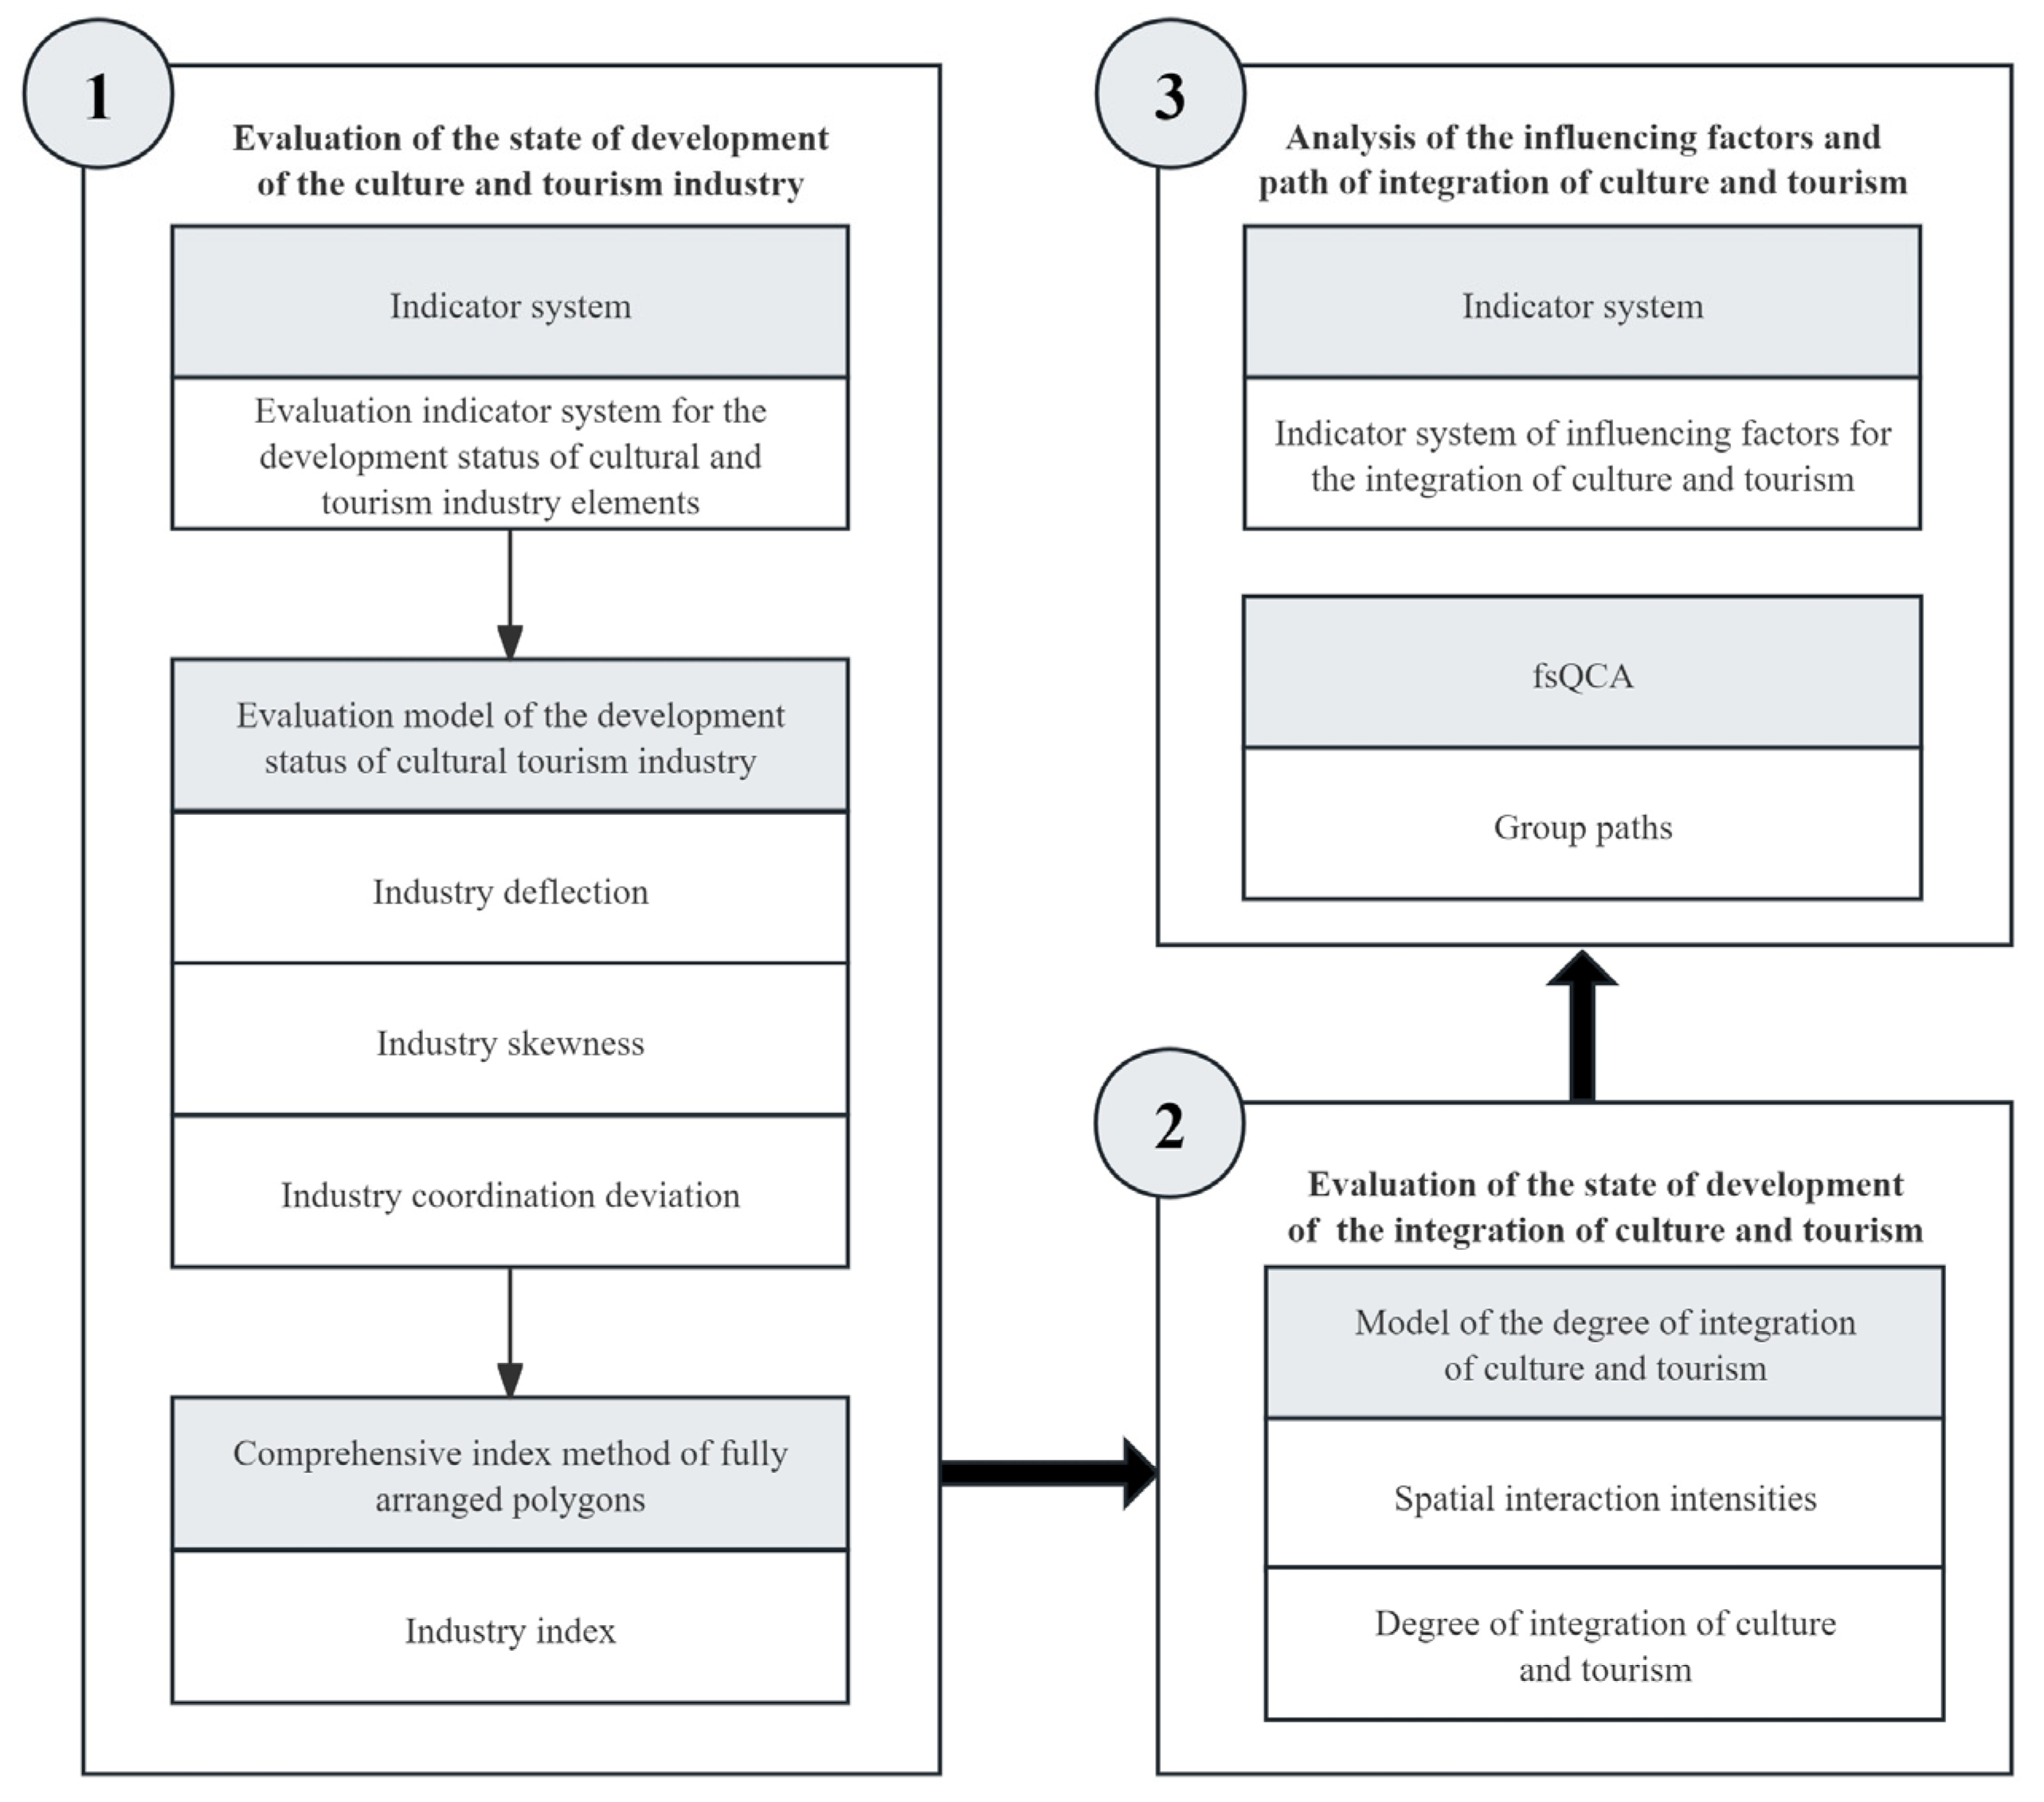
3.1. Research Methods

3.1.1. Evaluation of the State of Development of the Culture and Tourism Industry and the Integration of Culture and Tourism

  • Indicator System
Based on the aforementioned discussions and previous research [8,9,13,39,40,41], we developed an index system centred (Table 1) around support elements, developmental elements, and guidance elements to depict the state of development of the cultural and tourism industry, thereby accurately delineating the elemental structure of the cultural and tourism industry in different regions.
2.
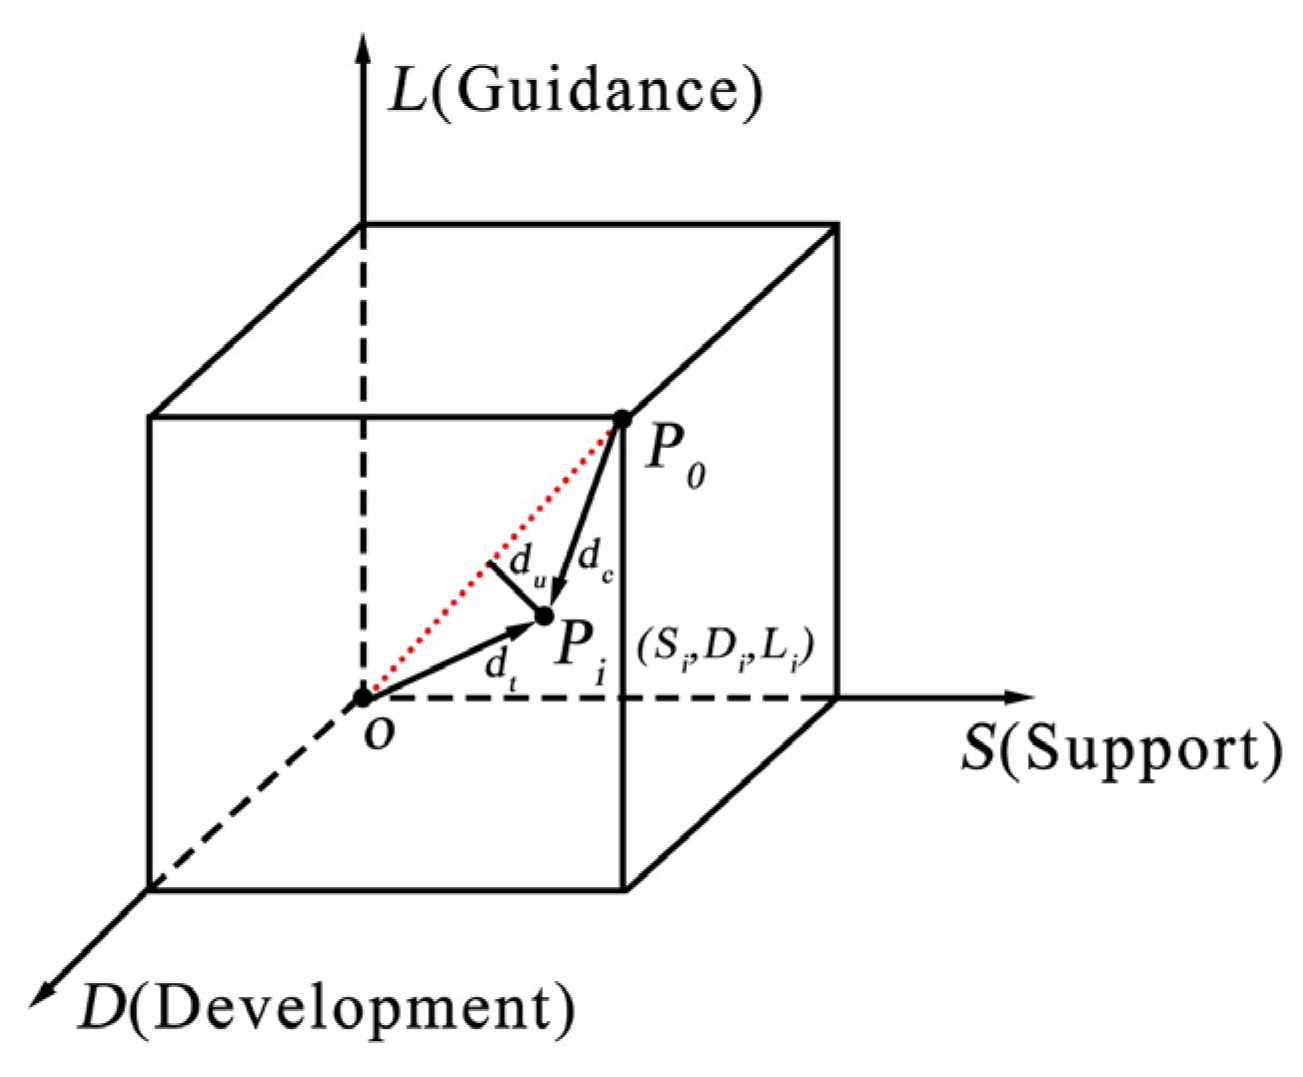
Evaluation Model of the Development Status of the Cultural Tourism Industry
We constructed a three-dimensional space to assess the development status of the cultural and tourism industry based on the development status and structural shape of the industry elements (Figure 3). In the spatial model, it is assumed that the origin of the coordinates O is the region where the culture industry completely dominates the development, and the point P0 is the region where the tourism industry completely dominates the development, which means that all the elements in the region are all under culture industrialisation or tourism industrialisation, respectively. Any point Pi in the space indicates the development status of the elements within the regional cultural and tourism industry and its degree of industry coordination. Among them, only when the point Pi is on the body’s diagonal line OP0(Si = Di = Li) can it indicate that the development of internal elements of the cultural and tourism industry is relatively balanced, and the overall development structure of the regional cultural and tourism industry tends to be coordinated. Otherwise, there exists an industry coordination deviation distance du, i.e., the distance from point Pi to line OP0. The dc and dt values denote the extent to which regional development has shifted towards the cultural industry and the tourism industry, respectively, as indicated by the distance from point P0 or point O to point Pi. The relevant formulae are the following [42]:
d i u = S i D i 2 + S i L i 2 + D i L i 2 3
d i c = S i c 2 + D i c 2 + L i c 2
d i t = S i t 2 + D i t 2 + L i t 2
where i is the unit of study, i.e., province; c and t are the cultural industry and tourism industry, respectively; and diu is the degree of coordination deviation of cultural and tourism industry. When the value of diu is 0, it means that the development of industry elements in the province is in a state of complete coordination. The larger the value of diu, the more dysfunctional the development of industry elements, which inhibits the integration of culture and tourism. The values dic and dit are the cultural industry skewness and tourism industry skewness, respectively. A dic or dit value of 0 indicates that the regional development is completely dominated by the tourism industry or the cultural industry. The larger the value of dic or dit, the more the regional development is biased towards the domination of the cultural industry or the tourism industry. Si, Di, and Li are the cultural industry deflection or tourism industry deflection of industry support elements, development elements, and guidance elements, respectively, reflecting the elemental characteristics and structural patterns of the cultural and tourism industry within the region, and their specific calculation method is shown in Table 2.
3.
Comprehensive Index Method of Fully Arranged Polygons
The comprehensive index method of fully arranged polygons is an objective evaluation method, which can avoid the instability problem caused by subjective weights on the evaluation results in the evaluation process and improve the reliability of the evaluation results. In this paper, we adopted the comprehensive index method of fully arranged polygons to evaluate the 12 indicators corresponding to the cultural industry and tourism industry, respectively, in Table 1 to obtain the cultural industry index and tourism industry index. The calculation formula is the following [43]:
Z m = ( U V m L V m ) ( A V m C V m ) U V m + L V m 2 C V m A V m + U V m C V m + L V m C V m 2 U V m L V m
Z = m n m , n ( Z m + 1 ) ( Z n + 1 ) 2 x ( x 1 )
where Zm and Zn are the standardised values of the mth and nth indicators, respectively; UVm, LVm, CVm, and AVm are the upper limit value, lower limit value, critical value, and actual value of the m indicators, respectively; X is the number of indicators; and Z is the cultural industry index or tourism industry index, with its value ranging between [0, 1]. The larger the value of Z, the better the overall development of the cultural industry or tourism industry.
4.
Model of the Degree of Integration of Culture and Tourism
This paper introduces spatial interaction into the evaluation of the integration of culture and tourism and quantitatively explains the degree of spatial interaction of culture and tourism within and between provinces by expanding and modifying spatial interaction models such as the classical gravity model and the potential model. At the same time, we combined cultural and tourism industry coordination deviation and cultural and tourism industry skewness to construct a model of the degree of integration of culture and tourism and evaluate the integration of culture and tourism in each province. The calculation formulae are the following [44]:
R = M a x d i u d i u × F i c d i c × F i t d i t
F i c = i = 1 w j = 1 w 1 K c Z i c Z j t E i c j t G i c j t 2 + K t Z i c Z i t E i c t G i c t 2
F i t = i = 1 w j = 1 w 1 K t Z i t Z j c E i t j c G i t j c 2 + K c Z i t Z i c E i t c G i t c 2
where R is the degree of integration of culture and tourism; i and j are the ith and jth provinces, respectively; w is the total number of provinces; Max{diu}diu is the weight coefficient of integration of culture and tourism, reflecting the degree of coordinated development of cultural and tourism industry; Fic and Fit are the spatial interaction intensities of cultural and tourism industry, respectively. Zic and Zit are the cultural industry index and tourism industry index, respectively; Kc and Kt are their corresponding influence coefficients, specifically the ratio of the cultural industry index and tourism industry index to the sum of the two indices, respectively; and E and D are the economic distance and spatial distance of the cultural and tourism industry, respectively. Economic distance is represented by the margin between per capita cultural consumption and per capita tourism consumption. Spatial distances are divided into two categories: intraprovincial and interprovincial. Intraprovincial distances are represented by the average distance from the seat of the people’s government of the prefectural-level city under its jurisdiction to the seat of the provincial people’s government. Interprovincial distances are represented by the distance between the seats of people’s governments in each province.

3.1.2. Analysis of the Influencing Factors and Path of Integration of Culture and Tourism

1.
Indicator System
To investigate the configurational pathways of the new development concept to enhance the integration of culture and tourism and drawing on previous research [45,46,47,48], we constructed an index system for factors influencing the integration of culture and tourism. This system is centred around the five core concepts of innovation, coordination, green, open, and shared development, encompassing 15 specific indicators (Table 3).
2.
Fuzzy Set Qualitative Comparative Analysis Method
The fuzzy set qualitative comparative analysis (fsQCA) method is based on the principles of Boolean algebra and set theory, which can effectively identify the joint and interactive effects of the impacts of complex risk factors, make a retrospective inference about the impact factors of existing events, and be applied to small sample studies [49]. China is a vast country with very different provincial characteristics, and the impact of the new development philosophy on the integration of culture and tourism varies from province to province. Therefore, we chose to use the fsQCA method to analyse the group impact of the new development philosophy on the integration of culture and tourism.

3.2. Data Sources

Due to the limitation of data availability, this paper did not include data from Hong Kong, Macao, Taiwan, and Tibet in China and took the remaining 30 provinces as the research object, with the research period being 2012–2021. Specifically, the number of local industry standards was obtained through the China Standard Information Public Service Platform. The number of valid patents related to the industry was obtained through the Innojoy global patent search platform. The number of master’s and doctoral degree theses was obtained through the China Knowledge Network. The number of industry-related policies was obtained through China Laws and Regulations Information Database. The number of Baidu search indices was obtained through the official website of the Baidu Index. The rest of the socioeconomic data came mainly from the China Statistical Yearbook, the China Tertiary Industry Statistical Yearbook, the China Culture and Related Industries Statistical Yearbook, the China Culture, Heritage and Tourism Statistical Yearbook, the China Tourism Statistical Yearbook, the China Energy Statistical Yearbook, the China Science and Technology Statistical Yearbook, and the statistical bulletins of the national economy and social development of the various regions. Some of the missing data were supplemented by linear interpolation to ensure the scientific validity and continuity of the statistics. In order to eliminate the differences in the index scale, we adopted the extreme value method for the initial processing of raw data to ensure the accuracy of the subsequent measurement results.

4. Results

4.1. Analysis of the State of Industrial Development

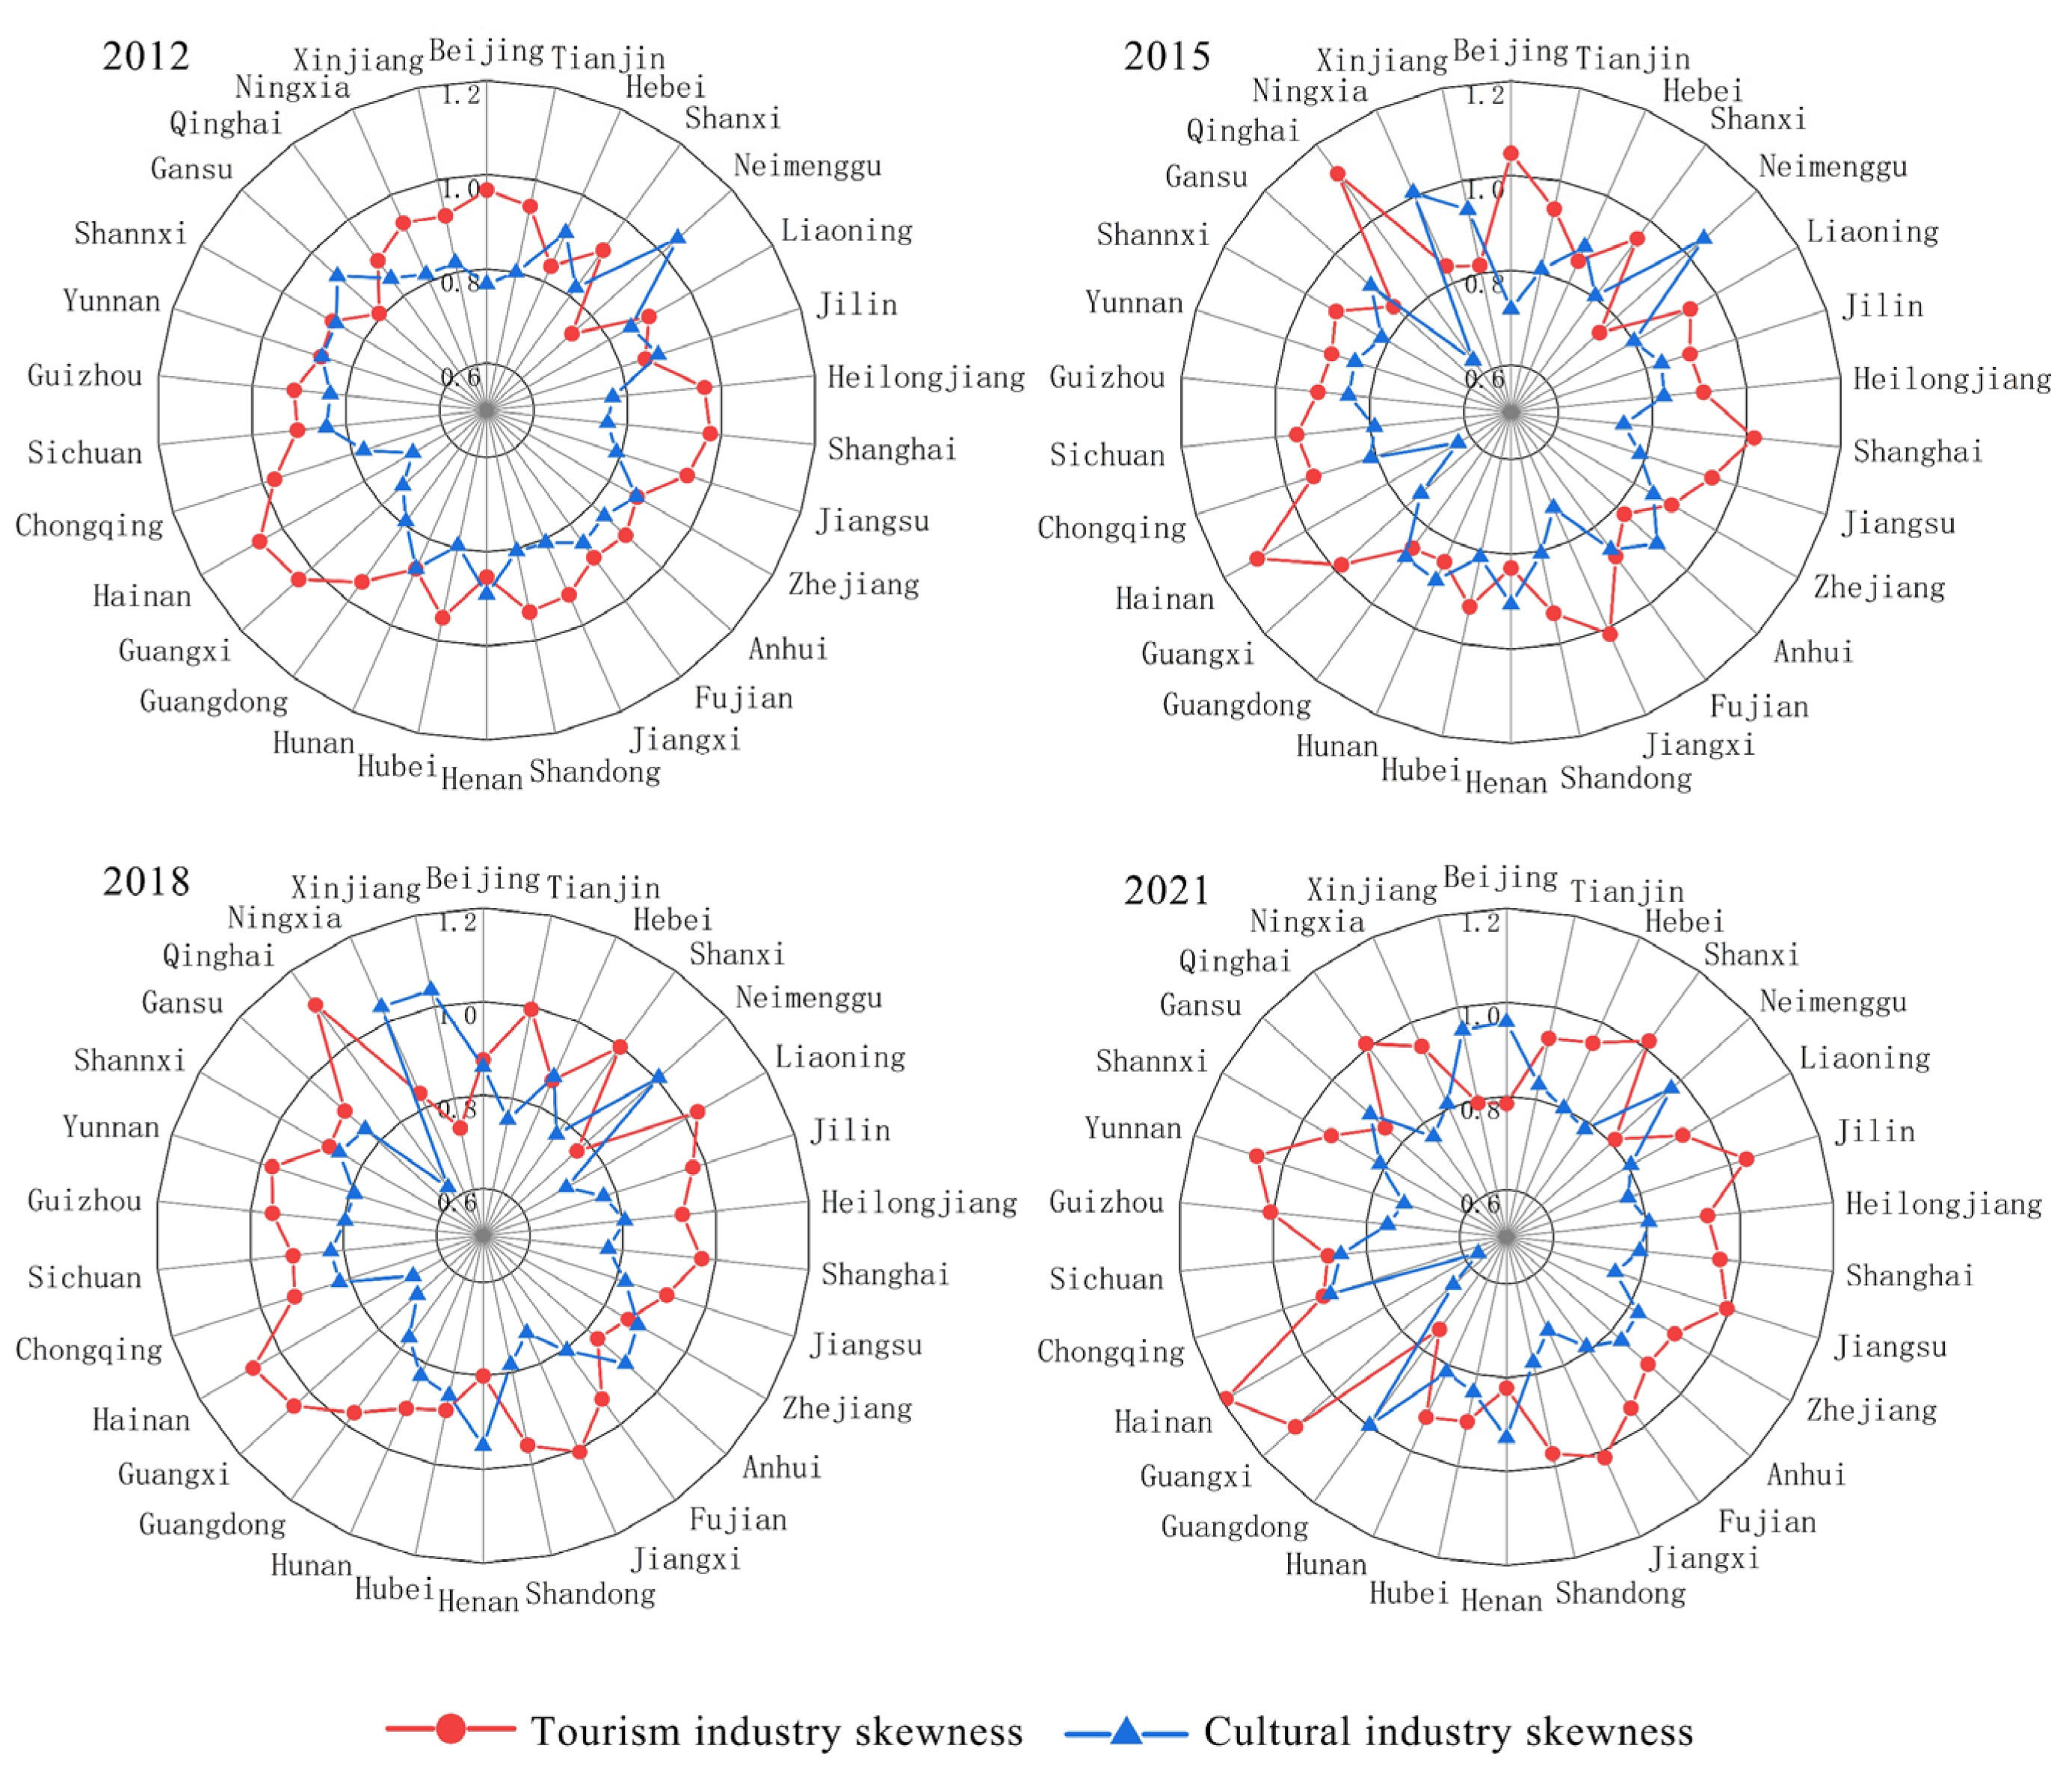
4.1.1. Analysis of Cultural and Tourism Industry Skewness and Industry Coordination Deviations

Based on the evaluation model of the development status of cultural tourism industry, the cultural and tourism industry skewness (Figure 4) and industry coordination deviation (Figure 5) were calculated for each province. From the results of the industry skewness measurement, it can be seen that from a comprehensive point of view that the tourism industry skewness in China was higher than the cultural industry skewness from 2012 to 2021, with an average difference of 0.0985 over the decade. Among them, the tourism industry skewness gradually increased from 0.9124 to 0.9392, with an increase of 2.93%. The cultural industry skewness gradually decreased from 0.8307 to 0.8152, with a decrease of 1.86%, which indicates that the tourism industry was in a dominant position in the development process of China in the past decade, and the industry elements were more inclined to the tourism industry. Specifically, regionally, the tourism industry skewness was relatively high in South China and relatively low in Central China. The cultural industry skewness was just the opposite, being relatively high in Central China and relatively low in South China. In terms of provinces, as many as 14 provinces, including Tianjin, Shanxi, Liaoning, Shanghai, Jiangsu, Jiangxi, Shandong, Guangxi, Hainan, Chongqing, Sichuan, Guizhou, Yunnan, and Qinghai, showed a tourism industry skewness higher than the cultural industry skewness for a long period of time during the study period. And only 2 provinces, Neimenggu and Henan, showed a cultural industry skewness consistently higher than the tourism industry skewness. Among them, the gap between the cultural and tourism industry skewness in Hainan and Qinghai provinces was the most obvious, with the tourism industry having a much higher development advantage than the cultural industry.
As can be seen from the results of the measurement of industry coordination deviation, comprehensively, the cultural and tourism industry coordination deviation in China showed a fluctuating growth trend from 2012 to 2021. Its value was 0.0874 in 2012, followed by a rapid increase to 0.0940 in 2015, then a small drop to 0.0922 in 2018, and finally a rapid surge to 0.1233 in 2021, with an overall increase of up to 41.09% over the ten-year period, which suggests that the development of elements of the cultural and tourism industry in China has tended to be generally out of sync, inhibiting the integration of culture and tourism. From the point of view of spatial differentiation, the cultural and tourism industry coordination deviation in China showed the spatial differentiation characteristics of “high in the northwest and low in the southeast”. The specific degree values, from highest to lowest, were for Southwest China (0.1313), North China (0.1279), Northwest China (0.1211), South China (0.0841), Northeast China (0.0789), East China (0.0670), and Central China (0.0659). As a result, the dysfunctional development of the elements of the cultural and tourism industry had a significant regional demarcation. As can be seen from Figure 4, specifically at the provincial scale, the interprovincial cultural and tourism industry coordination deviation varied considerably, and there were obvious imbalances. In particular, Ningxia and Neimenggu provinces had the largest cultural and tourism industry coordination deviation, with mean values as high as 0.2037 and 0.2026, respectively, during the study period, suggesting that the integration of culture and tourism in the two provinces was severely constrained. The different stages of development of the cultural and tourism industries in the provinces may be the main reason for the spatial variation in the degree of industry coordination deviation. At present, the culture and tourism industries in the eastern and central regions of China belong to the stage of deepening development, and a more mature cultural tourism has been formed. On the contrary, in the western region, its cultural and tourism industries are still in the initial stage of development, with nature tourism being the mainstay. This has led to a large imbalance in the development of the cultural and tourism industries in the western region.

4.1.2. Cultural and Tourism Industry Index Analysis

The cultural and tourism industry index of each province was calculated separately through the comprehensive index method of fully arranged polygons (Figure 6). The results indicate that from 2012 to 2021, the cultural and tourism industry index in China experienced initial growth followed by a decline. There was a trend of fluctuating growth during the early and middle stages, while a gradual decline was observed in the latter period. Despite the downturn in the latter period, in numerical terms, the cultural and tourism industry indices in 2021 were still 1.61% and 2.74% higher than in 2012, respectively. This suggests that although the development trend of China’s cultural and tourism industry has experienced some fluctuations, the overall situation remains positive. At the same time, the tourism industry index in China generally surpassed the cultural industry index, but the margin was not significant; over the decade, the average difference between the two was only 0.0115. From the point of view of spatial differentiation, the cultural and tourism industry index in China has formed a spatial distribution pattern of “high in the south and low in the north”. The cultural and tourism industry indices of East China, Central China, South China, and Southwest China were all generally higher than those of North China, Northeast China, and Northwest China. Notably, the cultural industry index in Central China and the tourism industry index in East China were the highest, at 0.2964 and 0.3265, respectively. In contrast, Northwest China had the lowest indices, at 0.1123 and 0.1023, respectively. According to Figure 5, at a provincial scale, from 2012 to 2021, the trend of the cultural and tourism industry index of various provinces varied significantly, with substantial differences in specific values. Specifically, provinces such as Shandong, Henan, and Hainan have seen continuous growth in their cultural industry indices. At the same time, Anhui, Jiangxi, Guangxi, Guizhou, and Yunnan have experienced sustained growth in their tourism industry indices. On the other hand, the cultural industry indices for Jilin, Heilongjiang, and Fujian, along with the tourism industry indices for Beijing, Heilongjiang, Jiangsu, and Chongqing, have declined. Although Jiangsu’s tourism industry index has been decreasing, it still ranked among the top compared to other provinces.

4.2. Analysis of the Spatial Interaction and Integration of Culture and Tourism

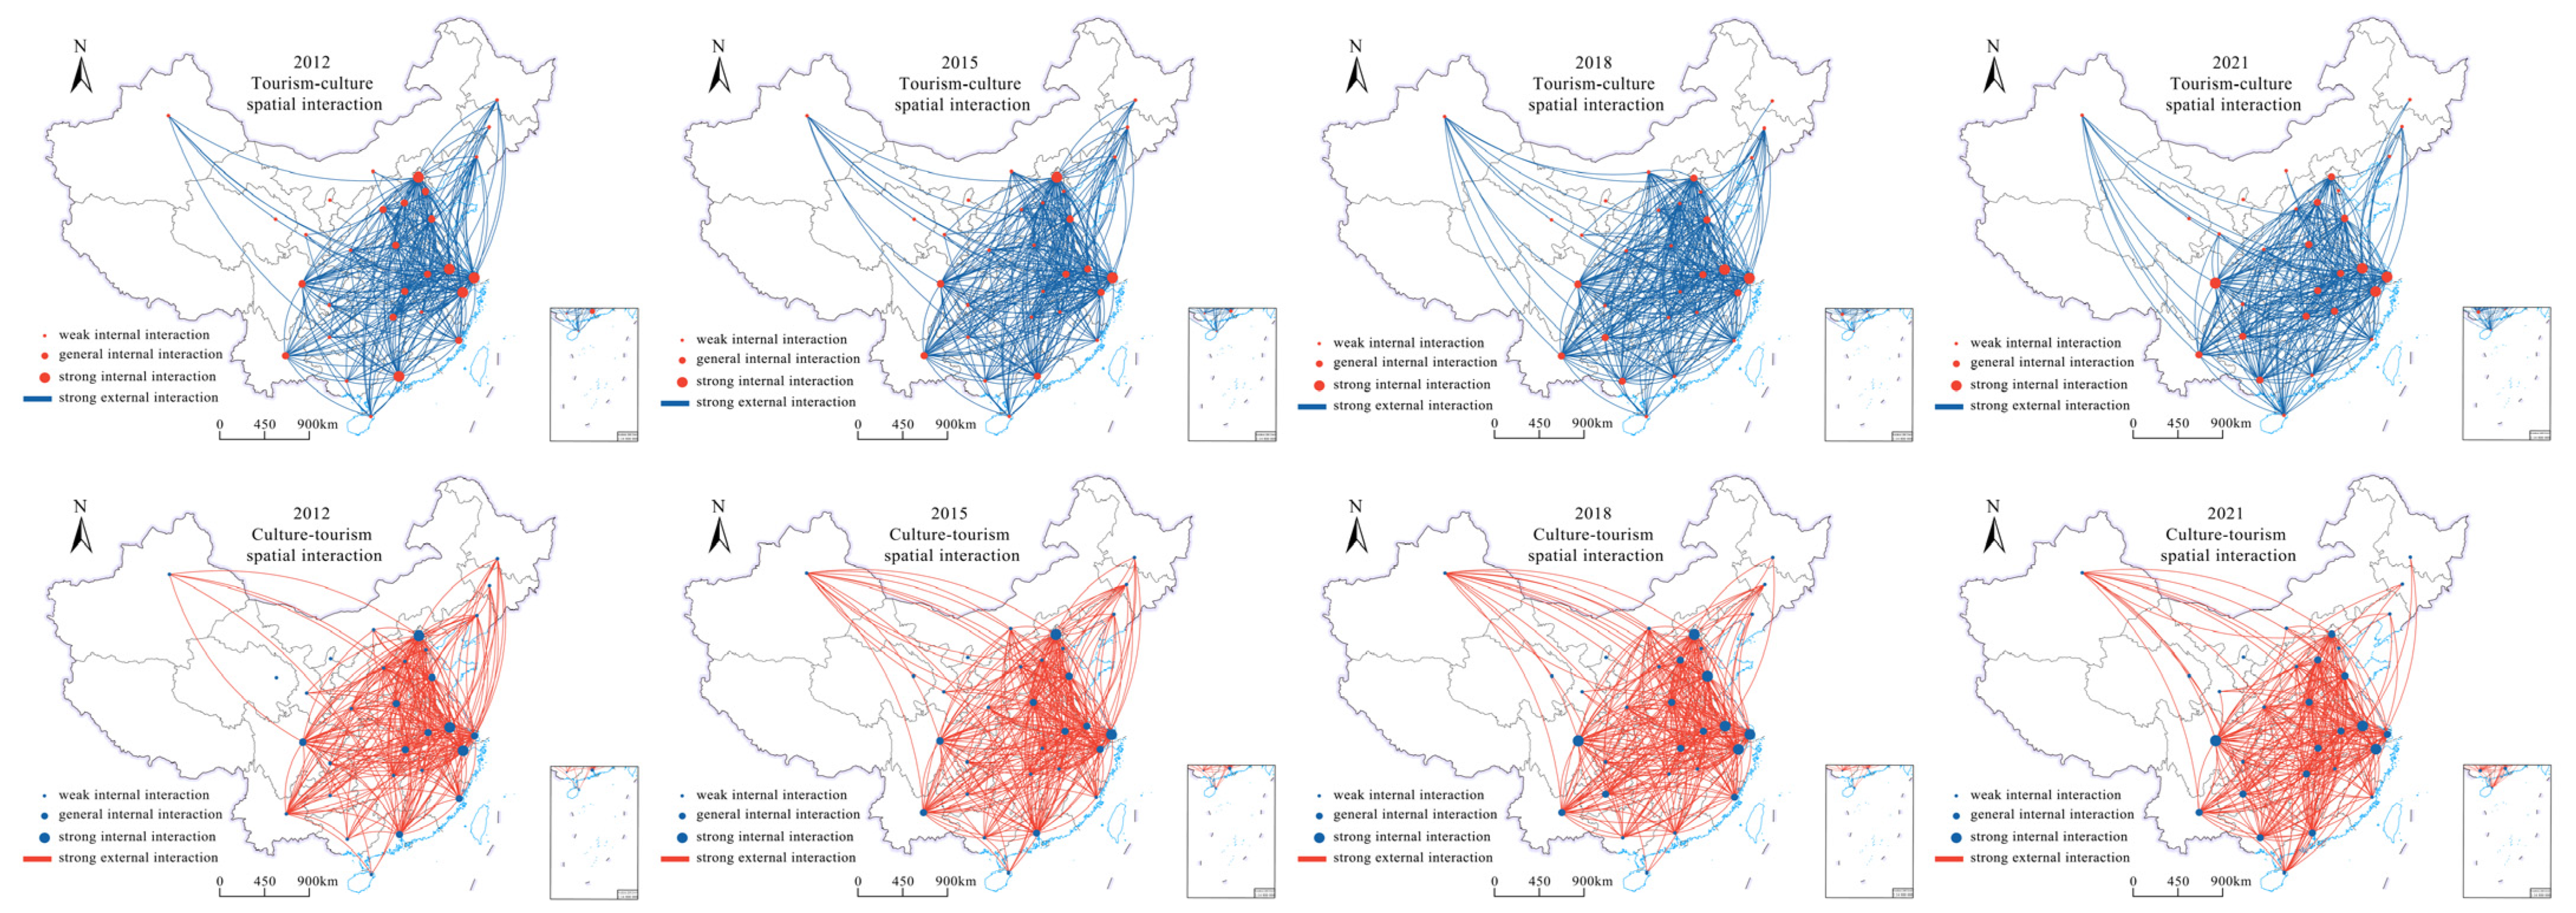
4.2.1. Analysis of the Spatial and Temporal Evolution of Cultural and Tourism Spatial Interactions

Based on model of the degree of integration of culture and tourism used to measure the spatial interaction of culture and tourism in provincial areas, the two types of spatial interactions, culture–tourism and tourism–culture, dominated by the cultural industry and tourism industry, respectively, were visually expressed. Among them, the spatial interaction intensity value of culture and tourism within the provincial area was classified by the natural breakpoint method, which is divided into three types of strong interaction, general interaction, and weak interaction, and characterised by the sign size. Interprovincial cultural and tourism spatial interaction strength values were discriminated on a case-by-case basis using the average of all interprovincial spatial interaction strengths for the year as the discriminating criterion. Exceeding the average value was considered a strong interaction, and otherwise, it was a weak interaction. In order to effectively clarify the network structure of interprovincial cultural and tourism spatial interaction, this paper only used arc line segments to visualise strong interactions (Figure 7).
1.
Spatial Interaction within Provinces
In terms of the number of types, for tourism–culture spatial interaction, the number of strong internal interaction types decreased from 16.67% in 2012 to 13.33% in 2021. The number of general internal interaction types declined rapidly from 36.67% in 2012 to 23.33% in 2015 before gradually rising to 36.37% in 2021. The number of weak internal interactions followed the same pattern as the previous two, from a rapid increase to a slow decline, and finally to 50.00% in 2021. For culture–tourism spatial interaction, the number of strong internal interaction types went through a process of “decreasing, increasing, and decreasing again” and then remained at 10.00% in 2021. After a slight decrease in 2018, the number of general internal interactions increased to 36.67% in 2021. The number of weak internal interactions decreased from 63.33% in 2012 to 53.33% in 2021. Overall, tourism–culture spatial interaction within the province weakened, while culture–tourism spatial interaction increased.
In terms of spatial distribution, whether it was tourism–culture spatial interaction or culture–tourism spatial interaction, the strong internal interaction types and general internal interaction types were mostly located in East China, Central China, South China, and Southwest China, while the weak internal interaction types were more centrally distributed in Northwest China, North China, and Northeast China. Specifically at the provincial scale, Beijing, Shandong, Shanghai, Jiangsu, Zhejiang, Guangdong, and Sichuan were in the strong internal interaction type in different periods, indicating that these provinces have coordinated the development of cultural and tourism industry for a long period of time, and their internal culture–tourism industry elements flowed frequently to maintained strong tourism–culture (culture–tourism) spatial interaction. Xinjiang, Qinghai, Gansu, Ningxia, Shaanxi, Neimenggu, Heilongjiang, Jilin, Liaoning, Chongqing, and Hainan were all in the weak internal interaction type for different periods, indicating that these provinces had fewer internal cultural and tourism industry elemental links, restricted spatial flows, and weak foundations for the integration of culture and tourism. Provinces with smaller land areas tended to have more frequent internal spatial interactions, while larger provinces tended to have the opposite pattern. For example, Shanghai and Xinjiang provinces are very different regarding land area. Compared to Xinjiang, Shanghai, which has a smaller land area, provides more conducive conditions for the spatial connection between cultural and tourism industries.
2.
Spatial Interactions between Provinces
In terms of the number of interactions, for tourism–culture spatial interactions, the number of strong external interactions increase from 292 in 2012 to 328 in 2018 and then decreased to 306 in 2021. For culture–tourism spatial interactions, the number of strong external interactions increased from 293 in 2012 to 313 in 2018, before it decreased to 301 in 2021. As a result, the intensity gap between interprovincial tourism–culture spatial interactions and culture–tourism spatial interactions has narrowed and network density has increased, both of which peaked in 2018. At the same time, the number of strong external interactions for tourism–culture spatial interaction was higher in comparison, indicating that the tourism industry was more clearly characterised by its outward orientation and was able to initiate spatial interactions more proactively. Specifically at the provincial scale, in tourism–culture spatial interaction, the tourism industries of Jiangsu, Zhejiang, and Beijing had more active spatial interactions with the cultural industries of other provinces, with an average number of 26, 23.5, and 21.25 strong external interactions per year, respectively, indicating that the development of tourism industries of these provinces was dominant across the country and was able to radiate and drive the development of the cultural industries of other regions. Among the culture–tourism spatial interactions, the cultural industries in Beijing, Henan, and Sichuan generated more spatial interactions with the tourism industries in other provinces, with an average number of 23.75, 21.5, and 20.25 strong external interactions per year, respectively, indicating that the cultural industries in these provinces were better developed, and they would take the initiative to establish links with the tourism industries in other regions to promote the integration of culture and tourism with each other. In addition, the culture–tourism spatial industry in Qinghai and Ningxia hardly took the initiative to interact spatially with other regions and played the role of receiver in both tourism–cultural spatial interaction and cultural–tourism spatial interaction, with the number of strong external interactions in both provinces during the study period being zero.
In terms of structural distribution, the centre of the network of tourism–culture spatial interaction and culture–tourism spatial interaction was located in the “North China Plain—Middle and Lower Yangtze River Plain” at the beginning of the study, with frequent spatial interactions in the central region, and the overall network structure showed a trend of spreading from the centre to the periphery. With the passage of the time series, the centre of the network gradually shifted to the southwest in the middle and late stages of the study. The spatial interaction frequency in the central region remained prominent. However, the interaction density within the domain decreased, and the overall network structure became fuller, tending to be homogenized and looser. This indicates that the spatial interaction of the cultural and tourism industry was gradually moving from single-core dominance to multiple-core concurrency. In addition, the cultural and tourism industry in the eastern–central region played a core guiding role. The cultural and tourism industry in the southwestern region also began to actively build links with other regions and synergistically promoted cross-boundary flow of cultural and tourism industry elements.
Collectively, there was a certain synergy between interprovincial spatial interactions and intraprovincial spatial interactions, with strong external spatial interactions tending to be more centred around provinces with strong internal interactions. When the internal interaction intensity increased in a province, the external interaction intensity would also increase accordingly, and the two would promote each other, forming a three-dimensional and comprehensive spatial interaction structure of cultural and tourism industry and promoting the integration of culture and tourism. In addition, the areas under the jurisdiction of the northwestern and northeastern zones of China have long been in a state of weak internal interaction, with little intraprovincial exchange of cultural and tourism industry, and only a few strong internal interactions, failing to connect with the dense interaction network in the eastern–central part of the country, and ultimately becoming “desert zones” of interaction of cultural and tourism industry.

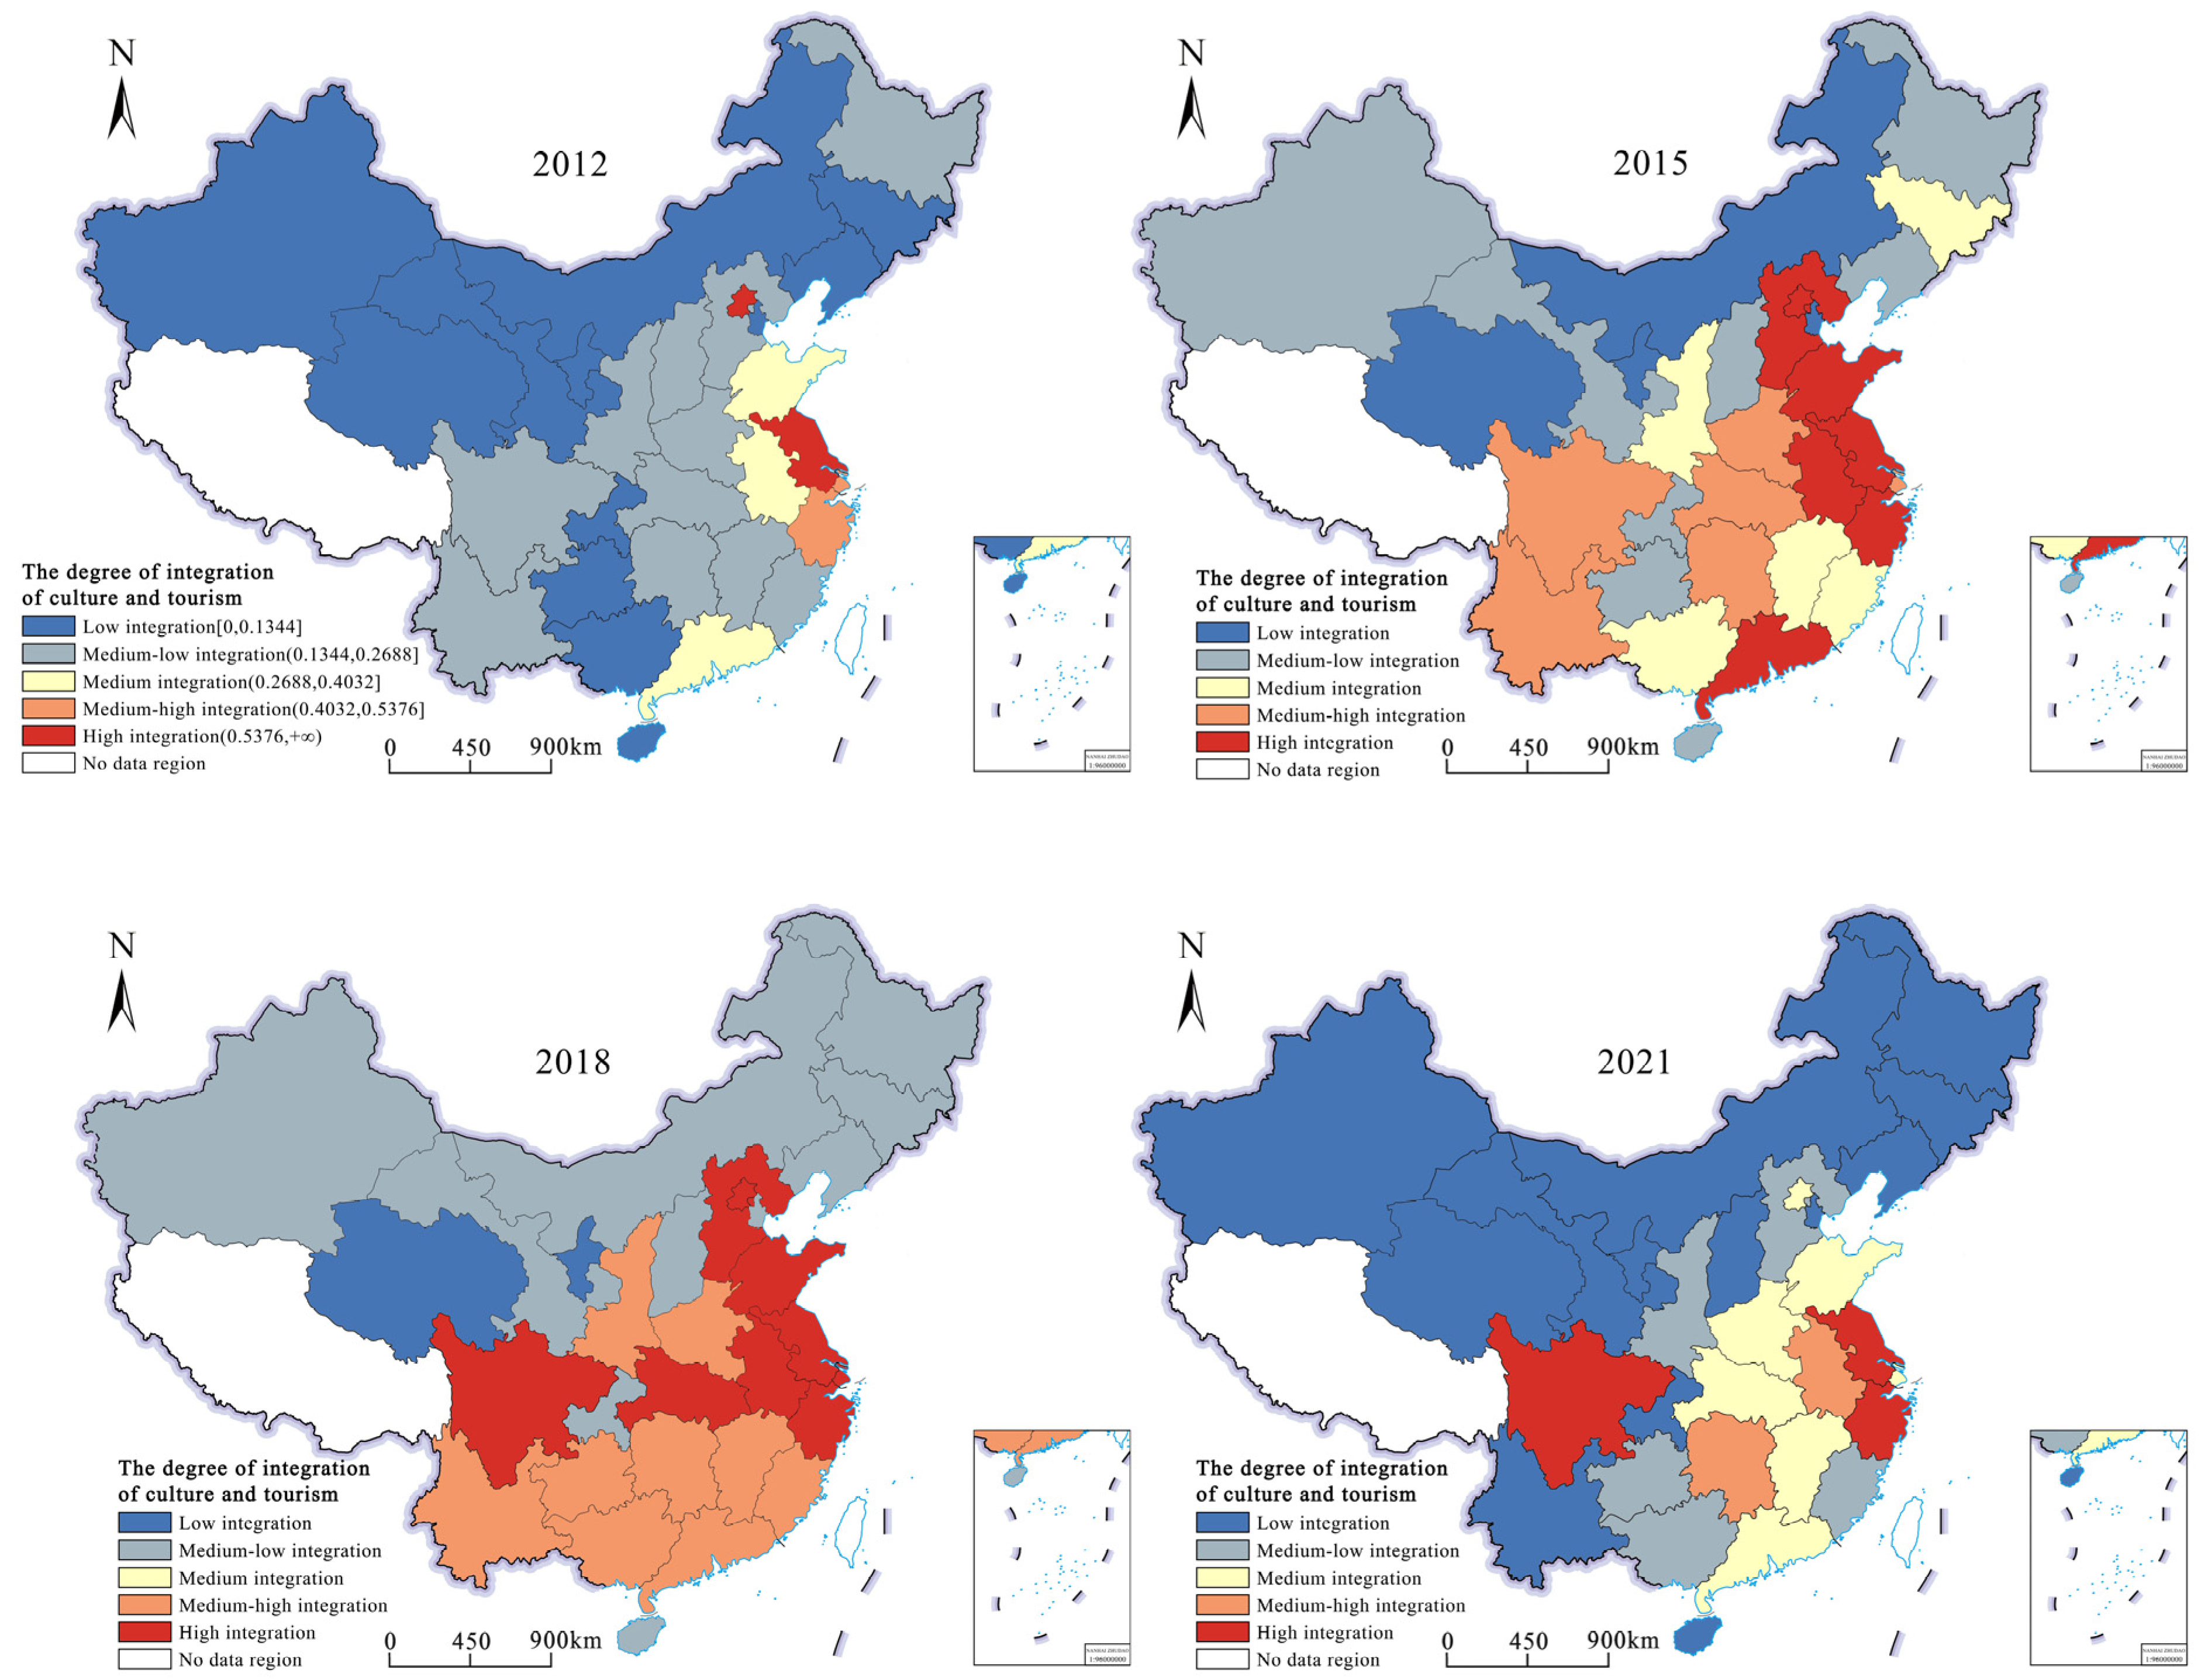
4.2.2. Analysis of the Spatial and Temporal Evolution of Integration of Culture and Tourism

Based on the spatial interaction of culture and tourism, the provincial integration of culture and tourism was further calculated. To better reflect the spatial and temporal differentiation characteristics of the integration of culture and tourism between provinces, we used the equal interval method to classify the degree of integration of culture and tourism in 2012. Using this as a benchmark, the degree of integration of culture and tourism in different periods from 2012 to 2021 was classified into five types: low integration, medium–low integration, medium integration, medium–high integration, and high integration (Figure 8).
In 2012, the degree of integration of culture and tourism in China was 0.2095, and the types of integration of culture and tourism were dominated by low and medium–low integration types, with the number of the two accounting for as much as 76.67% in total. This observation indicates that during this period, China’s integration of culture and tourism was in its initial development stage, with most provinces experiencing a relatively low level of development in this integration. Only a few of the strong traditional economic provinces achieved relatively good results in the integration of culture and tourism. Among them, in the Eastern China region, the integration of culture and tourism was relatively advanced, with medium, medium–high, and high levels of integration all converging in this area. This led to a spatial pattern where integration radiated outward from Eastern China, diminishing as it spread.
In 2015, the degree of integration of culture and tourism in China increased significantly to 0.3713. The number of provinces belonging to medium, medium–high, and high integration increased, with the three accounting for 16.67%, 20.00%, and 23.33%, respectively, and the total accounting for 60.00%. This indicates that the integration of culture and tourism in China entered a high-speed development stage in this period, and the development level of integration of culture and tourism in all provinces increased. Meanwhile, the spatial distribution characteristics of integration of culture and tourism types in this period showed new changes, and the degree of spatial differentiation deepened. The medium, medium–high, and high integration types began changing from sporadic to concentrated distribution. In contrast, the low and medium–low integration types were gradually divided from continuous to sporadic.
In 2018, the degree of integration of culture and tourism in China further increased, reaching a peak of 0.4621, with the number of provinces with medium–high integration and high–high integration types both increasing to 30.00% and the number of provinces with low integration types decreasing to a minimum of 6.67% in all periods. This indicates that China’s integration of culture and tourism stepped into a stage of comprehensive development in this period, and the development level of integration of culture and tourism in the vast majority of provinces increased again, with only a very small number of provinces yet to form a breakthrough in the development of integration of culture and tourism. In terms of spatial distribution, the medium–low integration, medium–high integration, and high integration types formed a very clear geographical division. The high integration type was mainly distributed in the areas under the jurisdiction of the North China Plain and the middle and lower reaches of the Yangtze River Plain. The medium–high integration type was concentrated in the areas south of the Yangtze River. The medium–low integration type was distributed in the northern border areas.
The degree of integration of culture and tourism in China showed a downward trend in 2021, dropping to 0.2262, down as much as 51.06% compared with 2018. The number of provinces belonging to the low and medium–low integration increased significantly, accounting for 43.33% and 16.67%, respectively. The number of provinces belonging to the medium–high and high integration types decreased to 6.67% and 10.00%, respectively. This suggests that the development of the integration of culture and tourism in China faced great crises and challenges during this period, and the integration of culture and tourism in the majority of provinces was in a declining trend, with the decline ranging from 0.0559 to 0.7715. The COVID-19 pandemic may have contributed to the decline in the integration of culture and tourism during this period. The uncertainty of the pandemic and control measures imposed significant constraints on the connection between the cultural and tourism industries.
At the provincial scale, the integration of culture and tourism in most provinces from 2012 to 2021 underwent a process of “continuous increase—rapid decrease”. Among them, the cultural and tourism industry in Jiangsu continuously maintained a high level of integration of culture and tourism at different times. Even with the impact of the New Crown epidemic, Jiangsu’s integration of culture and tourism in 2021 remained at 0.6824, ranking first in the country. Although Beijing’s integration of culture and tourism was at a high level of integration development in the first and middle periods, it did not grown much and was greatly affected by the New Crown epidemic, and downgraded to a medium integration type in 2021, with a degree of integration of culture and tourism of only 0.3364 in that year, a decrease of about 69.64% from 2018. The integration of culture and tourism in Sichuan rose from the medium–low integration type in the early stage to the medium–high integration type and finally continued to stabilise at the high integration type in the middle and late stages. This indicates that the cultural and tourism industry in Sichuan was in a state of compatible and coordinated development for a long time, and the momentum of integration of culture and tourism was relatively good.
Comprehensively, the integration of culture and tourism development in China had obvious spatiotemporal differentiation laws, which were closely related to the spatial interaction of culture and tourism. Specifically, the network centres of spatial interaction of culture and tourism basically coincided with the spatial distribution of the high integration of culture and tourism types, which were located within the jurisdiction of the North China Plain and the Middle and Lower Yangtze River Plains. Meanwhile, the spatial distribution pattern of spatial interaction of culture and tourism, which was “dense in the south-east and sparse in the north-west”, was also similar to the spatial differentiation of the development level of integration of culture and tourism, which was “high in the south-east and low in the north-west”. Moreover, the tendency of the movement of the centre of the spatial interaction network of culture and tourism and the degree of sparseness of the network structure were basically consistent with the tendency of the specific value and type of integration of culture and tourism to shift in time and space.

4.3. Analysis of Group Paths of Impact Factors of Integration of Culture and Tourism

Before using the fsQCA method for group analysis, we measured the specific characterisation values of innovation, coordination, green, open, and share development based on the indicators listed in Table 3, using the ten-year average value of the data of each indicator from 2012 to 2021 as the standard, and adopting the comprehensive index method of fully arranged polygons, respectively. Subsequent analyses were conducted on the basis of the measured values.

4.3.1. Calibration and Analysis of Necessary Conditions

In fsQCA studies, antecedent conditions and outcome variables need to be calibrated before necessity and sufficiency analyses can be conducted. Based on the comprehensive consideration of the specific values of the antecedent conditions and outcome variables, and with reference to the practices of existing studies [50,51], we chose to use objective quantile values to determine the locations of the calibration anchor points, and the 25%, 50%, and 75% quantiles of the antecedent conditions and outcome variables were used as the complete unaffiliated points (Table 4), the crossover points, and the complete affiliation points, based on which antecedent conditions and outcome variables were calibrated. The subsequent steps of this study were performed based on the calibrated data.
Before configuration analysis, a necessary condition analysis needed to be performed. It is usually considered that an antecedent condition is necessary for the outcome variable when the level of agreement for that antecedent condition is greater than 0.9 [49]. The necessary conditions for the integration of culture and tourism were tested by fsQCA3.0 software. The results showed that the consistency of all antecedent conditions was less than 0.9, indicating that there was no single necessary condition to produce the outcome. Since a single antecedent condition does not provide an adequate explanation for the integration of culture and tourism results (Table 5), further exploration of the combinatorial paths that generated the results of culture and tourism integration was needed.

4.3.2. Configuration Analysis

Based on the results of the requisite condition analysis, we further analysed the antecedent group state paths that produced the integration of culture and tourism results. Using a specific operation, we referred to the criteria proposed by Chen et al. [52], choosing to take 1 as the frequency threshold and setting 0.8 and 0.7 as the raw consistency threshold and the PRI consistency threshold, respectively, conducting analyses of the output of simple solutions, intermediate solutions, and complex solutions, which were a total of three types of solutions. Then, according to the usual practice of existing studies, the intermediate solution was used as the main debriefing type, and the core and edge conditions in the intermediate solution were discriminated in conjunction with the simple solution. The results of the grouping analysis are shown in Table 6, which shows that there were four grouping paths that produced high integration of culture and tourism, with a consistency of 0.977273, 0.990196, 0.955423, and 0.916667, respectively, with a solution consistency of 0.955896, all of which showed high consistency, and with a solution coverage of 0.684753. It was shown that the group path explained about 68.48% of the causative reasons for the high integration of culture and tourism. The results of the group state paths for the high integration of culture and tourism were further analysed.
M1 shows that high integration of culture and tourism can be generated when high innovation development, non-high coordination development, and high open development are the core conditions, coupled with non-high green development as a peripheral condition. This group path roughly covered 26.58% of the provinces, typically represented by Hunan and Sichuan. Taking Hunan and Sichuan as examples, these provinces are located in the central and western regions of China where the ecological environment is more fragile. Their economic and social development is mostly centred around their provincial capitals, and the integration of culture and tourism has a certain degree of polarisation and may cause some damage to the ecological environment. However, with their strong innovation ability and openness, the two provinces have actively established interactive links with other regions to improve the integration of culture and tourism, while technology also empowers the development of cultural and tourism industry.
M2 shows that high integration of culture and tourism can be generated when non-high coordination development, high green development, high open development, and high shared development together serve as the core conditions, and this group path roughly covered 13.87% of the provinces, typically represented by Hebei and Anhui. Taking Hebei and Anhui as examples, these provinces are mostly located in the vicinity of China’s important economic circle or are themselves the marginal part of the economic circle. Under the influence of the centripetal force of the economic circle, the development of cultural and tourism industry will be more inclined to the centre of the economic circle, forming the phenomenon of geographical concentration. However, these provinces have a high degree of openness and are able to build frequent spatial interactions with the cultural and tourism industry of the economic circle, undertake industrial transfer, and extend the industrial chain. At the same time, through high-quality eco-construction and public services, they can absorb the visitor market and cultural and tourism talents of the economic circle, thus promoting the integration of culture and tourism.
M3 shows that when high innovation development, high green development, high open development, and high shared development together serve as the core conditions, high integration of culture and tourism can still be generated even without coordination development conditions. This group path encompassed approximately 44.16% of the provinces, with Jiangsu and Zhejiang being the quintessential examples. These provinces are mostly located in the eastern coastal area of China, and their reform and opening started early and deeply. They generally exhibit better socioeconomic development, and issues with coordinated development are less pronounced, hence having a negligible impact on the integration of culture and tourism development. Moreover, due to their high level of socioeconomic development, when these areas embark on integrating culture and tourism, they can offer a robust foundation for innovation, a favourable ecological environment, substantial openness to external markets, and efficient public services, all of which are advantageous conditions that support the culture and tourism industry.
M4 shows that high integration of culture and tourism can be generated when high innovation development and high green development are used as core conditions and non-high coordination development, non-high open development, and non-high shared development are used as peripheral conditions, and the group path roughly covered 9.82% of the provinces, typically represented by Shaanxi. Taking Shaanxi as an example, this province has a long history of cultural resources and fragile ecological environment, giving priority to the concept of innovative development and green development to help improve its level of integration of culture and tourism. Specifically, on the one hand, the use of modern high-tech can help in achieving the protection and adaptive use of historical and cultural features. On the other hand, it is beneficial to carry out ecological civilisation construction to improve the regional ecological environment and to improve the carrying capacity of tourism, so as to ultimately promote the sustainable development of culture and tourism integration and high-quality development.

5. Conclusions

This paper’s main conclusions are the following:
Firstly, in the past 10 years, although the development of China’s cultural and tourism industry has been repetitive, the overall situation has been good, the cultural industry index and tourism industry index continued to grow in the first period to a late gradual decline, and a “high in the south and low in the north” spatial distribution pattern formed. At the same time, the tourism industry skewness was generally higher than the cultural industry skewness, and the industry elements were more concentrated in the tourism industry. In addition, the cultural and tourism industry coordination deviation also increased with the fluctuation of time, and the flow of industrial elements tended to be out of order and showed the spatial differentiation of “high in the northwest and low in the southeast”.
Secondly, the spatial interaction of culture and tourism within and between provinces has a certain degree of synergy, and the centre of the network is located in the “North China Plain—Middle and Lower Yangtze River Plain” area. With the passage of the time series, the cultural and tourism spatial interaction changed from a single nucleus dominant to multiple nuclei, and the centre of the network gradually moved towards the southwest, with a fuller network structure that tended to be homogeneous. For a long time, the cultural and tourism industry in the northwestern and northeastern zones has not only had poor internal interactions, but has also had few connections with the outside world, making it a “desert zone” of spatial interactions for culture and tourism.
Therefore, in the past 10 years, the degree of integration of culture and tourism in China has experienced the development process of “continuous growth—rapid decline”, reaching a peak of 0.4621 in 2018 and then rapidly declining to 0.2262 in 2021. At the same time, the spatial differentiation of the integration of culture and tourism has also changed over time. In the early and late periods, there were spatial patterns of diminishing circles centred around eastern China, while in the middle period, a spatial pattern of “high in the southeast and low in the northwest” was formed. In terms of specific provinces, the integration of culture and tourism in Jiangsu has maintained a high level for a long time, and the integration of culture and tourism in Sichuan has been more stable and gained momentum.
Finally, through the configuration analysis, a total of four group paths to achieve the integration of culture and tourism were explored. It was found that any single philosophy among the five new development concepts is not absolutely effective in promoting the integration of culture and tourism. Each province needs to choose the appropriate conceptual path to drive the development of its cultural and tourism industry according to its own characteristics in order to realise the integration of culture and tourism.

6. Discussion

In Chinese-style modernization, the deep integration of culture and tourism is the general trend and the inevitable way of culture and tourism development. The development of integration of culture and tourism exhibits a phased characteristic. It is crucial to elucidate the spatial connections within regional cultural and tourism industries, evaluate the developmental state of the culture and tourism industries, and assess the level of integration between culture and tourism. These actions serve as crucial measures to regulating and promoting the high-quality development of culture and tourism integration.
In this paper, we firstly analysed the mechanism of the integration of culture and tourism based on the perspective of systems theory, introduced the concept of spatial interaction into the integration of culture and tourism, and constructed a model of the degree of integration of culture and tourism that took into account the microtransformations and macroscopic linkages, which provided a new way of thinking and a new methodology for the evaluation of the effectiveness of the integration of culture and tourism. Secondly, through further empirical analyses, this paper provides a preliminary validation of the feasibility and practicality of the model, and also creates a certain degree of comparability with the existing research results [7,9,40], which enriches the relevant research results on the evaluation of the effectiveness of the integration of culture and tourism. Then, we explored the joint influence effects of the new development philosophy on the integration of culture and tourism from a holistic perspective and comprehensively revealed the complex group paths of different development philosophies, so as to provide a theoretical basis for the strategic guidance of the future development direction of the integration of culture and tourism in China’s provincial areas.
In addition, there are some limitations in this paper. We focused our research scale on provincial units, and the evaluation of integration of culture and tourism was limited to the macro level. Future research should further penetrate into small- and medium-scale units such as municipalities and counties to form a three-dimensional evaluation system for the effectiveness of the integration of culture and tourism. At the same time, future research can carry out multiple explorations of the quantification of spatial interaction of industry, portray the flow state and connection of cultural and tourism elements as accurately as possible, and improve the comprehensiveness and objectivity of the assessment of the effectiveness of integration of culture and tourism.

Author Contributions

Conceptualization, H.Z.; methodology, H.Z.; software, H.Z.; validation, H.Z.; formal analysis, H.Z.; investigation, H.Z.; resources, C.X.; data curation, H.Z.; writing—original draft preparation, H.Z. and J.Z.; writing—review and editing, H.Z. and J.Z.; visualization, H.Z.; supervision, C.X.; project administration, C.X.; funding acquisition, C.X. All authors have read and agreed to the published version of the manuscript.

Funding

This research was funded by the Innovation Strategy Research Project of Fujian Provincial Science and Technology Department (2021R0058).

Institutional Review Board Statement

Not applicable.

Informed Consent Statement

Not applicable.

Data Availability Statement

No new data were created or analyzed in this study. Data sharing is not applicable to this article.

Acknowledgments

The authors would like to thank the anonymous reviewers for their helpful suggestions and comments.

Conflicts of Interest

The authors declare no conflicts of interest.

References

  1. Richards, G. The Development of Cultural Tourism in Europe. In Cultural Attractions and European Tourism; Cabi Publishing: Wallingford, UK, 2001; pp. 3–29. [Google Scholar]
  2. Bachleitner, R.; Zins, A.H. Cultural tourism in rural communities: The residents’ perspective. J. Bus. Res. 1999, 44, 199–209. [Google Scholar] [CrossRef]
  3. Yu, G.Y. Tourism and culture. Outlook 1986, 14, 35–36. [Google Scholar]
  4. Xu, F.F.; La, L.Q.; Yan, X.Y.; Han, L.; He, Y.M.; Zhong, X.Q. A review of researches on the integration of cultural industry and tourism industry in China. Tour. Sci. 2023, 37, 1–18. [Google Scholar]
  5. Fu, C.W. On the internal logic in the integration of culture and tourism. Wuhan Univ. J. (Philos. Soc. Sci.) 2020, 73, 89–100. [Google Scholar]
  6. Wang, X.W. From interaction to symbiosis: The structural dimensions, evolution logic and development trend of cultural and tourism integration. J. Southwest Minzu Univ. (Humanit. Soc. Sci. Ed.) 2021, 42, 29–36. [Google Scholar]
  7. Zhao, M.; Wang, R.Z. The dynamic mechanism and development evaluation of cultural and tourism industry integration in China. Ecol. Econ. 2022, 38, 121–129. [Google Scholar]
  8. Yin, W.H.; Liu, N.N.; Lu, F.Y. Cultural industry and tourism’s integrated development and its spatial evolution in the Yangtze River Economic Belt. World Reg. Stud. 2022, 31, 1009–1020. [Google Scholar]
  9. Zhang, X.C.; Wang, Y.L.; Song, X.; Zhao, Y. Evaluation of the quality of integration of culture and tourism in the Yellow River Basin and study of spatial spillover effects. Stat. Decis. 2022, 38, 51–55. [Google Scholar]
  10. Qin, Z.C.; Cong, H.Z. Research on the culture-tourism integration upgrading of Chinese cultural belt—A measurement based on Jiangsu section of the Grand Canal Cultural Belt. J. Shandong Univ. (Philos. Soc. Sci.) 2022, 6, 49–59. [Google Scholar]
  11. Fan, H.Y.; Xue, B.Q. Empirical study on coupling coordination of tourism industry and cultural industry in Henan province. Areal Res. Dev. 2016, 35, 104–109. [Google Scholar]
  12. Syafrini, D.; Fadhil, N.M.; Sugandi, Y.S.; Miko, A. The impact of multiethnic cultural tourism in an Indonesian former mining city. Tour. Recreat. Res. 2020, 45, 511–525. [Google Scholar] [CrossRef]
  13. Chen, J.; Wang, H.; Yang, Z.; Li, P.; Ma, G.; Zhao, X. Comparative Spatial Vitality Evaluation of Traditional Settlements Based on SUF: Taking Anren Ancient Town’s Urban Design as an Example. Sustainability 2023, 15, 8178. [Google Scholar] [CrossRef]
  14. Hong, X.T.; Huang, Z.F.; Yu, F.H.; Sheng, W.L. Coupling coordination between urban cultural resources and tourism industry in the Yangtze River Delta and cultural compensation. Econ. Geogr. 2020, 40, 222–232. [Google Scholar]
  15. Zhu, Y.Y.; Zhou, X.Q.; Gu, J.; Chen, J. Spatial effect and driving mechanism of the integrated development of culture-tourism industries in the middle Yangtze River Basin urban agglomeration. Prog. Geogr. 2022, 41, 785–796. [Google Scholar] [CrossRef]
  16. Cui, F.J.; Xu, N.N.; Chen, X.F. An empirical study of an evaluative index of integrated development of county culture and tourism. Gov. Stud. 2022, 38, 93–101. [Google Scholar]
  17. Qian, M.H.; Li, H.R.; Meng, T.T. Analysis and evaluation on the mode of cultural and tourism integration for Chinese modernization. Libr. Dev. 2023, 1–21. Available online: https://link.cnki.net/urlid/23.1331.G2.20230925.0953.004 (accessed on 2 January 2024).
  18. Tang, C.C.; Liu, Y.R.; Wan, Z.W.; Liang, W.Q. Evaluation system and influencing paths of the integration of culture and tourism of traditional villages. Acta Geogr. Sin. 2023, 78, 980–996. [Google Scholar] [CrossRef]
  19. Shi, Y.; Zhan, G.H. Index construction, influencing factors and promotion strategies of high-quality development of cultural tourism industry’ s integration: A case study of Jiangsu province. Nanjing J. Soc. Sci. 2021, 7, 165–172. [Google Scholar]
  20. Wu, L.; Liang, H.; Yu, H.J.; Huo, R.M. Spatial differentiation and driving factors of the integrated development of culture and tourism in China. Econ. Geogr. 2021, 41, 214–221. [Google Scholar]
  21. Li, L.; Xu, J. Measuring the level of integration of culture and tourism industry development and analysing its driving factors in China. Stat. Decis. 2020, 36, 49–52. [Google Scholar]
  22. Zheng, C.R.Y.; Yang, C.D.; Ren, W.X. Spatial-temporal evolution characteristics and influencing factors on integration of cultural industry and tourism industry in ethnic regions-taking lnner Mongolia as an example. World Reg. Stud. 2022, 31, 613–623. [Google Scholar]
  23. Wang, Z.F.; Liang, Z.Q. Spatio-temporal evolution and influencing factors of the integration development level of culture and tourism industry in the Yangtze River Economic Belt. J. Shaanxi Norm. Univ. (Nat. Sci. Ed.) 2023, 51, 97–110. [Google Scholar]
  24. Zeng, G.R. Systems Theory Cybernetics Information Theory and Philosophy; China South University of Technology Press: Guangzhou, China, 1988. [Google Scholar]
  25. Wei, H.S.; Zeng, G.P. Systems Theory: Philosophy of Systems Science; Tsinghua University Press: Beijing, China, 1995. [Google Scholar]
  26. Liu, J.S.; Ma, Y.F. The evolution and driving mechanism of the supply and demand coupling about tourism flow and destination system based on the genesis and system theory: Taking Xi’an as an example. Geogr. Res. 2017, 36, 1583–1600. [Google Scholar]
  27. Rui, M.J.; Hu, J.X. Research on the identification method of industrial convergence: A viewpoint based on systematology. Shanghai Manag. Sci. 2008, 3, 33–35. [Google Scholar]
  28. Li, R. Deep integration and synergistic development: Theoretical logic and practical path of integration of culture and tourism. Theory Mon. 2022, 1, 88–96. [Google Scholar]
  29. Zhang, S.B. The internal mechanism, basic model and industrial development logic of the in-depth integration of cultural industries and tourism. J. China Univ. Pet. (Ed. Soc. Sci.) 2019, 35, 94–99. [Google Scholar]
  30. Fang, S.M.; Wang, H.Y. Agriculture and tourism industry convergence based on system theory: A viewpoint of viscidity. Econ. Geogr. 2018, 38, 211–218. [Google Scholar]
  31. Ji, X.M.; Chen, J.H.; Fu, Y.Q. A study of the convergence and spatial spillover effects of Chinese in bound tourism flow. Tour. Sci. 2015, 29, 47–60. [Google Scholar]
  32. Zhang, K.; Mao, J.X. Industry co-agglomeration, regional innovation and spatial spillover: The empirical analysis based on the region of the Yangtze River Delta. J. Huazhong Univ. Sci. Technol. (Soc. Sci. Ed.) 2018, 32, 76–88. [Google Scholar]
  33. Chi, Y.; Fang, Y.; Liu, J. Spatial–temporal evolution characteristics and economic effects of China’s cultural and tourism industries’ collaborative agglomeration. Sustainability 2022, 14, 15119. [Google Scholar] [CrossRef]
  34. Kranioti, A.; Tsiotas, D.; Polyzos, S. The Topology of Cultural Destinations’ Accessibility: The Case of Attica, Greece. Sustainability 2022, 14, 1860. [Google Scholar] [CrossRef]
  35. Wang, D.S. New development philosophy and high-quality development. J. Beijing Technol. Bus. Univ. (Soc. Sci.) 2022, 37. 11–19+113. [Google Scholar]
  36. Ma, J. Review of industrial integration theory research. Econ. Perspect. 2002, 5, 78–81. [Google Scholar]
  37. Qi, X.; Chen, Y.Y.; Liu, H.G. lmplementing the new development philosophy to promote urban-rural integration: Logic and path. Comp. Econ. Soc. Syst. 2023, 2, 14–23. [Google Scholar]
  38. Zhang, J.G. Analysis on the Path of Realizing Common Prosperity: Production or Distribution. Contemp. Econ. Res. 2023, 1, 62–70. [Google Scholar]
  39. Xu, F.; Li, B. Measurement of cultural and tourism industry integration in Liaoning province based on coupling model. J. Liaoning Univ. (Philos. Soc. Sci. Ed.) 2021, 49, 70–78. [Google Scholar]
  40. Li, L.Y.; Weng, G.M. Research of integrational degree and spatial-temporal differences of tourism industry and cultural industry in China. Geogr. Geo-Inf. Sci. 2015, 31, 94–99. [Google Scholar]
  41. Zhang, A.Z. Evaluation of the level of high-quality development of cultural industry in the Yellow River Basin. Stat. Decis. 2023, 39, 127–131. [Google Scholar]
  42. Cui, S.Q.; Zhou, G.S.; Wu, G.H.; Bi, F.Z. The evaluation of urban-rural integration degree and its driving mechanism in Changsha-Zhuzhou-Xiangtan urban agglomeration from the perspective of spatial interaction. Geogr. Res. 2023, 42, 1029–1049. [Google Scholar]
  43. Sun, X.; Liu, X.S.; Li, F.; Tao, Y. Comprehensive evaluation of sustainable development for different scale cities in China. Acta Ecol. Sin. 2016, 36, 5590–5600. [Google Scholar]
  44. Yu, Y.; Tong, Y.; Hu, S.S.; Ke, Y.Y. Metropolitan area spatio-temporal evolution of spatial interaction among cities of Wuhan. Resour. Environ. Yangtze Basin 2017, 26, 1784–1794. [Google Scholar]
  45. Wang, W.; Fan, Z.P.; Qin, Y.G. Construction of economic high-quality development indicator system and empirical measurement. Stat. Decis. 2022, 38, 124–128. [Google Scholar]
  46. Zhang, Y.; Hao, F.; Li, J.W. The spatial distribution of coupling and coordination of China’s gigh-quality development level based on the new development philosophy. J. Guizhou Univ. Financ. Econ. 2022, 2, 23–34. [Google Scholar]
  47. Shan, Q.Q.; Li, Z. Regional differences and spatiotemporal convergence of high-quality economic development. Econ. Geogr. 2022, 42, 50–58. [Google Scholar]
  48. Ding, C.H.; Tian, Z.; Song, X.M.; Wang, W. Research on high-quality development of china’s regional economy under the new development concept: Level measurement, spatial and temporal differentiation and dvnamic evolution. J. Tech. Econ. Manag. 2022, 12, 3–9. [Google Scholar]
  49. Zhang, M.; Du, Y.Z. Qualitative comparative analysis (QCA) in management and organization research: Position, tactics, and directions. Chin. J. Manag. 2019, 16, 1312–1323. [Google Scholar]
  50. Rihoux, B. Qualitative comparative analysis (QCA) and related systematic comparative methods: Recent advances and remaining challenges for social science research. Int. Sociol. 2006, 21, 679–706. [Google Scholar] [CrossRef]
  51. Greckhamer, T.; Gur, F.A. Disentangling combinations and contingencies of generic strategies: A set-theoretic configurational approach. Long Range Plan. 2021, 54, 101951. [Google Scholar] [CrossRef]
  52. Chen, H.C.; Liang, C.; Fan, J.H.; He, Z.M. The influence of organizational characteristics and institutional distance on the social responsibility performance of foreign enterprises in China: A research based on fsQCA and NCA Methods. Manag. Rev. 2023, 35, 280–293. [Google Scholar]
Figure 1. Operation mechanism of the system of integration of culture and tourism.
Sustainability 16 01756 g001
Figure 2. Conceptual framework for assessing the integration of culture and tourism.
Sustainability 16 01756 g002
Figure 3. Three-dimensional spatial conceptual model of the development state of a cultural and tourism industry.
Sustainability 16 01756 g003
Figure 4. Culture and tourism industry skewness, 2012–2021.
Sustainability 16 01756 g004
Figure 5. Culture and tourism industry coordination deviation, 2012–2021.
Sustainability 16 01756 g005
Figure 6. Cultural industry index and tourism industry indices, 2012–2021.
Sustainability 16 01756 g006
Figure 7. Spatial interactions of integration of culture and tourism, 2012–2021.
Sustainability 16 01756 g007
Figure 8. Degrees of integration of culture and tourism, 2012–2021.
Sustainability 16 01756 g008
Table 1. Evaluation indicator system for the development status of cultural and tourism industry elements.
Elementary LayerComprehensive IndicatorSpecific IndicatorsIndicator Interpretation
Cultural IndustryTourism Industry
Support elementsIndustry institutionNumber of major institutions in the cultural industry (C1)Number of major institutions in the tourism industry (T1)Characterizes the basic scale state of the industry
Industry manpowerNumber of employees in major institutions of the cultural industry (C2)Number of employees in major institutions of the tourism industry (T2)Characterizes the human resource status of the industry
Industry formCultural industry structure rationalization index (C3)Tourism industry structure rationalization index (T3)Characterizes the equilibrium development state of the industry
Industry ecologyCultural industry structure upgrading index (C4)Tourism industry structure upgrading index (T4)Characterize the optimization and upgrading state of the industry
Industry concentrationLocation entropy of the cultural industry (C5)Location entropy of the tourism Industry (T5)Characterizes the agglomeration development state of industry
Development elementsIndustry standardNumber of local standards related to the cultural industry (C6)Number of local standards related to the tourism industry (T6)Characterizes the normative development state of the industry
Industry capitalCultural industry fixed asset investment (C7)Tourism industry fixed asset investment (T7)Characterizes the capital size state of the industry
Industry technologyNumber of valid patents related to the cultural industry (C8)Number of valid patents related to the tourism industry (T8)Characterizes the scientific and technological innovation capacity of the industry
Industry potentialNumber of master’s and doctoral theses on the theme “Culture” (C9)Number of master’s and doctoral theses on the theme “Tourism” (T9)Characterizes the talent reserve status of the industry
Guidance elementsIndustry strategyNumber of policies related to the cultural industry (C10)Number of policies related to the tourism industry (T10)Characterizes the policy support of the industry
Industry spiritProtection of cultural resources (C11)Per capita tourism carbon emissions (T11)Characterizes the spirit development ability of the industry
Industry impact“Culture” Baidu search index (C12)“Tourism” Baidu search index (T12)Characterize the social concerns of the industry
Note: The main organisations in the cultural industry are public libraries, cultural centres, cultural stations, museums, performing arts groups, and performing arts venues; the main organisations in the tourism industry are A-grade scenic spots, star-rated hotels, and travel agencies.
Table 2. Calculation formulae for industry deflection.
Element StructureIndicators InvolvedIndustry DeflectionFormula
Distribution structure of support elementsC1, T1, C2, T2, C3, T3, C4, T4, C5, T5Cultural industry deflection of support elements (Sic) S i c = 1 5 C 1 C 1 + T 1 + C 2 C 2 + T 2 + C 3 C 3 + T 3 + C 4 C 4 + T 4 + C 5 C 5 + T 5
Tourism industry deflection of support elements (Sit) S i t = 1 S i c
Distribution structure of development elementsC6, T6, C7, T7, C8, T8, C9, T9Cultural industry deflection of development elements (Dic) D i c = 1 4 C 6 C 6 + T 6 + C 7 C 7 + T 7 + C 8 C 8 + T 8 + C 9 C 9 + T 9
Tourism industry deflection of development elements (Dit) D i t = 1 D i c
Distribution structure of guidance elementsC10, T10, C11, T11, C12, T12Cultural industry deflection of guidance elements (Lic) L i c = 1 3 C 10 C 10 + T 10 + C 11 C 11 + T 11 + C 12 C 12 + T 12
Tourism industry deflection of guidance elements (Lit) L i t = 1 L i c
Table 3. Indicator system of influencing factors for the integration of culture and tourism.
Development PhilosophyForm of ExpressionSpecific Indicator
Innovation developmentScience and technology investmentFinancial expenditure on science and technology
R&D intensityResearch and development (R&D) investment intensity
Talent scaleFull-time equivalents of research and development personnel
Coordination developmentIndustry coordinationTertiary industry output value as a proportion of total output value
Urban–rural coordinationRate of urbanisation
Regional coordinationGDP per capita as a proportion of national GDP per capita
Green developmentPollution controlRatio of investment in industrial pollution control to value added of industry
Low carbon developmentPublic trams per 10,000 people
Ecological constructionGreen space per capita
Open developmentForeign investmentForeign direct investment
Domestic marketRetail sales of consumer goods
Foreign marketTotal import and export of goods
Shared developmentFacility supportRoad network density
Public serviceFiscal expenditure on general public services
Improvement in people’s livelihoodPer capita disposable income
Table 4. Variable calibration anchors.
VariableCalibration
Complete Unaffiliated PointCrossover PointComplete Affiliation Point
Outcome variableIntegration of culture and tourism0.2130.4490.637
Antecedent variableInnovation development0.0350.1480.310
Coordination development0.0630.1520.271
Green development0.1020.1980.262
Open development0.0350.1670.278
Shared development0.0880.2100.320
Table 5. Results of the analysis of the necessary conditions.
Antecedent ConditionConsistencyCoverage
Innovation development0.8427200.826819
~Innovation development0.2918960.280343
Coordination development0.5418960.534915
~Coordination development0.5322800.508197
Green development0.5728020.545098
~Green development0.5364010.531292
Open development0.8166210.808294
~Open development0.2857140.272073
Shared development0.7829670.792217
~Shared development0.3358520.313261
Note: ~ denotes “not” for logical operations.
Table 6. Group paths of the integration of culture and tourism.
Path and ConfigurationRaw CoverageUnique CoverageConsistency
M1: Innovation development*~coordination development*~green development*open development0.2657970.1916210.977273
M2: ~Coordination development*green development*open development*share development0.1387360.01579660.990196
M3: Innovation development*green development*open development*share development0.4416210.3186810.955423
M4: Innovation development*~coordination development*green development*~open development*~shared development0.09821430.0329670.916667
Solution coverage: 0.684753Solution consistency: 0.955896
Note: M1~M4 represent the action paths, respectively; * represents the “and” of the logical operation; ~ represents the “not” of the logical operation; the bold font represents the “core condition”; the standard font represents the “edge condition”.
Disclaimer/Publisher’s Note: The statements, opinions and data contained in all publications are solely those of the individual author(s) and contributor(s) and not of MDPI and/or the editor(s). MDPI and/or the editor(s) disclaim responsibility for any injury to people or property resulting from any ideas, methods, instructions or products referred to in the content.

